Article

Comparative Genomics Analyses Reveal the Differences between B. longum subsp. infantis and B. longum subsp. longum in Carbohydrate Utilisation, CRISPR-Cas Systems and Bacteriocin Operons

1
State Key Laboratory of Food Science and Technology, Jiangnan University, Wuxi 214122, China
2
School of Food Science and Technology, Jiangnan University, Wuxi 214122, China
3
International Joint Research Laboratory for Pharmabiotics & Antibiotic Resistance, Jiangnan University, Wuxi 214122, China
4
APC Microbiome Ireland, University College Cork, T12 K8AF Cork, Ireland
5
Teagasc Food Research Centre, Moorepark, Fermoy, P61 C996 Co. Cork, Ireland
6
National Engineering Research Center for Functional Food, Jiangnan University, Wuxi 214122, China
7
Wuxi Translational Medicine Research Center and Jiangsu Translational Medicine Research Institute Wuxi Branch, Wuxi 214122, China
*
Author to whom correspondence should be addressed.
Microorganisms 2021, 9(8), 1713; https://doi.org/10.3390/microorganisms9081713
Submission received: 20 July 2021 / Revised: 8 August 2021 / Accepted: 9 August 2021 / Published: 11 August 2021
(This article belongs to the Section Food Microbiology)

Abstract

:
Bifidobacterium longum is one of the most widely distributed and abundant Bifidobacterium in the human intestine, and has been proven to have a variety of physiological functions. In this study, 80 strains of B. longum isolated from human subjects were classified into subspecies by ANI and phylogenetic analyses, and the functional genes were compared. The results showed that there were significant differences in carbohydrate metabolism between the two subspecies, which determined their preference for human milk oligosaccharides or plant-derived carbohydrates. The predicted exopolysaccharide (EPS) gene clusters had large variability within species but without difference at the subspecies level. Four subtype CRISPR-Cas systems presented in B. longum, while the subtypes I-U and II-C only existed in B. longum subsp. longum. The bacteriocin operons in B. longum subsp. infantis were more widely distributed compared with B. longum subsp. longum. In conclusion, this study revealed the similarities and differences between B. longum subsp. infantis and B. longum subsp. longum, which could provide a theoretical basis for further exploring the probiotic characteristics of B. longum.

1. Introduction

Bifidobacterium longum consists of three subspecies, including B. longum subsp. suis, B. longum subsp. longum and B. longum subsp. infantis, which is one of the most abundant Bifidobacterium in the intestines [1]. B. longum subsp. longum is widely present in the human intestine of different ages, while B. longum subsp. infantis mainly exists in the intestine of breast-fed infants, and B. longum subsp. suis is mainly isolated from the gastrointestinal tract of piglets or cattle [2]. At present, B. longum subsp. infantis and B. longum subsp. longum have been widely used in dairy products, functional foods and probiotic products, and they have various physiological functions such as regulating immunity [3,4] and maintaining intestinal balance [5]. Although the genetic relationship between B. longum subsp. infantis and B. longum subsp. longum is extremely similar, there are still some diversities in phenotypic and genetic determinants. For instance, B. longum subsp. infantis can metabolise human milk oligosaccharides (HMOs), while B. longum subsp. longum has a preference for plant-derived carbohydrates [6]. In addition, RAPD-PCR, ribose typing and other genotyping techniques, as well as comparative genomic analysis, revealed the differences in genetic determinants between B. longum subsp. infantis and B. longum subsp. longum [7].
Comparative genomics analyses could help understand the genomic characteristics of different strains and their relationship with phenotypes, the differences in strains to compete and adapt in the intestine, and the interaction with the hosts. Gene sequencing technology has developed rapidly in recent years, and the publicly available genomes of B. longum have continued to increase, providing more data for genomic comparison. Previous studies revealed the general characteristics of B. longum genomes, the compositional characteristics of its pan-genome and the differences in the glycosylhydrolase genes of different subspecies. In addition, those studies discussed the similarities and differences of plasmids, CRISPR-Cas systems and adhesion genes among different strains, and expanded the understanding of the intraspecies genomic diversity of B. longum [8,9,10,11]. Unfortunately, the strains used in those studies were mainly B. longum subsp. longum, and only a few B. longum subsp. infantis genomes have been involved. Hence, the results of those studies could not fully reflect the characteristics of B. longum subsp. infantis genomes and the diversities in genetic information among B. longum subsp. infantis strains.
In this study, B. longum were identified at the subspecies level based on ANI and phylogenetic analysis. The similarities and differences of genomes between B. longum subsp. infantis and B. longum subsp. longum were explored by the comparative genomics approach, including pan-genome, subspecies specific gene, carbohydrate utilisation, exopolysaccharide (EPS) gene clusters, CRISPR-Cas systems and bacteriocin operons.

2. Materials and Methods

2.1. B. Longum Strain, Genonic Sequencing and Data Assembly

The 40 B. longum strains used in this study were isolated from human faeces and preserved in our lab (Table 1). All the strains were cultured anaerobically in de Man, Rogosa and Sharpe plus 0.05% (w/v) L-cysteine hydrochloride (mMRS) medium at 37 °C. The Illumina Hiseq × 10 platform (Majorbio BioTech Co, Shanghai, China) was used to sequence the draft genomes, SOAPdenovo v2.04 was used to assemble the reads and GapCloser v1.12 was used to fill the local inner gaps referred to previous research [12]. In this study, the genomes of B. longum subsp. infantis ATCC15697, B. longum subsp. longum NCC2705 and 38 other available strains randomly selected in the NCBI RefSeq database (including 19 B. longum subsp. infantis strains and 19 B. longum subsp. longum strains) were used for genomic comparison (Table 1). In addition, B. longum subsp. infantis ATCC15697 was acquired from China General Microbiological Culture Collection Centre.

2.2. Average Nucleotide Identity (ANI) Values

A python script [13] (https://github.com/widdowquinn/pyani) (accessed on 20 July 2021) was used to calculate the ANI values between each two genomes, and TBtools was used to cluster and visualise the resulting matrix [14]. Ten genomes of B. longum subsp. suis in the NCBI RefSeq database were supplemented for calculating ANI (Table S1).

2.3. Phylogenetic Analyses

The orthologous gene analysis was carried out using orthomclV2.0.9 software [15], the mafft-7.313 [16] was used to align the orthologous gene sequences of different strains and phylogeny software was used to analyse the evolutionary relationship via the neighbour-joining (NJ) method and construct a phylogenetic tree. The optimization of the phylogenetic tree was completed on the online website (http://www.evolgenius.info/evolview/) (accessed on 15 December 2020) [17].

2.4. Pan-Genome and Core-Genome Analysis

The pan-genome and the function of core genes were analysed via PGAP v1.2.1 [18], and functional classification of core genes was based on the COG database.

2.5. Whole Genome and Orthologous Gene Comparison

The sequence similarities of whole genomes among different strains in the same subspecies were visualised by BLAST Ring Image Generator (BRIG) [19]. OrthomclV2.0.9 software [15] was used to analyse the orthologous genes of B. longum subsp. infantis and B. longum subsp. longum and to compare the similarities and differences between the two subspecies.

2.6. Genotype and Phenotype Analysis of Carbohydrate Metabolism

The HMM method in HMMER-3.1 was used to annotate all the genomes. The CAZy database was used to predict the carbohydrate active enzyme genes [20], and BLAST was used to compare the carbohydrate metabolism gene clusters. The growth of 41 B. longum strains on the medium with six carbohydrates as the sole carbon source was determined, including L-arabinose, L-fucose, lacto-N-tetraose (LNT), 2′-fucosyllactose (2′FL), 3′-sialyllactose (3′SL) and galactooligosaccharide (GOS). Glucose-free mMRS medium with bromocresol purple as an indicator was prepared and the carbohydrate solution filtered through a 0.22-µm sterile membrane filter was added to the glucose-free mMRS medium at a final concentration of 1% (w/v). After 48 h anaerobic culturing at 37 °C, a colour change of the medium was observed, and the experiment was repeated independently three times.

2.7. CRISPR-Cas Systems Prediction

CRISPRCasFinder was used to predict the CRISPR systems, together with cas genes [21]. A phylogenetic tree based on Cas1 protein amino acid sequences and repeat nucleic acid sequences was constructed via MEGA X [22], and sequence alignment was performed using MUSCLE and UPGMA methods to construct a phylogenetic tree. The conserved repeat sequence secondary structure was visualised via RNAfold [23], and Weblogo was used to predict the conservation of RNA secondary structure [24]. The potential prophages in B. longum were predicted by PHASTER [25], and a local BLAST database was built based on the prophage sequences to analyse the match between CRISPR spacers and the prophages.

2.8. Bacteriocin Prediction

The online database BAGEL4 was used to predict the potential bacteriocins in B. longum [26]. Core peptide BLAST was performed to confirm the bacteriocins identified by BAGEL4.

2.9. Statistical Analysis

The number of GH genes, GT genes and CRISPR spacers in B. longum genomes were statistically analysed. GraphPad Prism 9.0 (GraphPad Software Inc., San Diego, CA, USA) was utilised for data analysis and plotting, and the significant difference of gene number was evaluated by t test.

3. Results

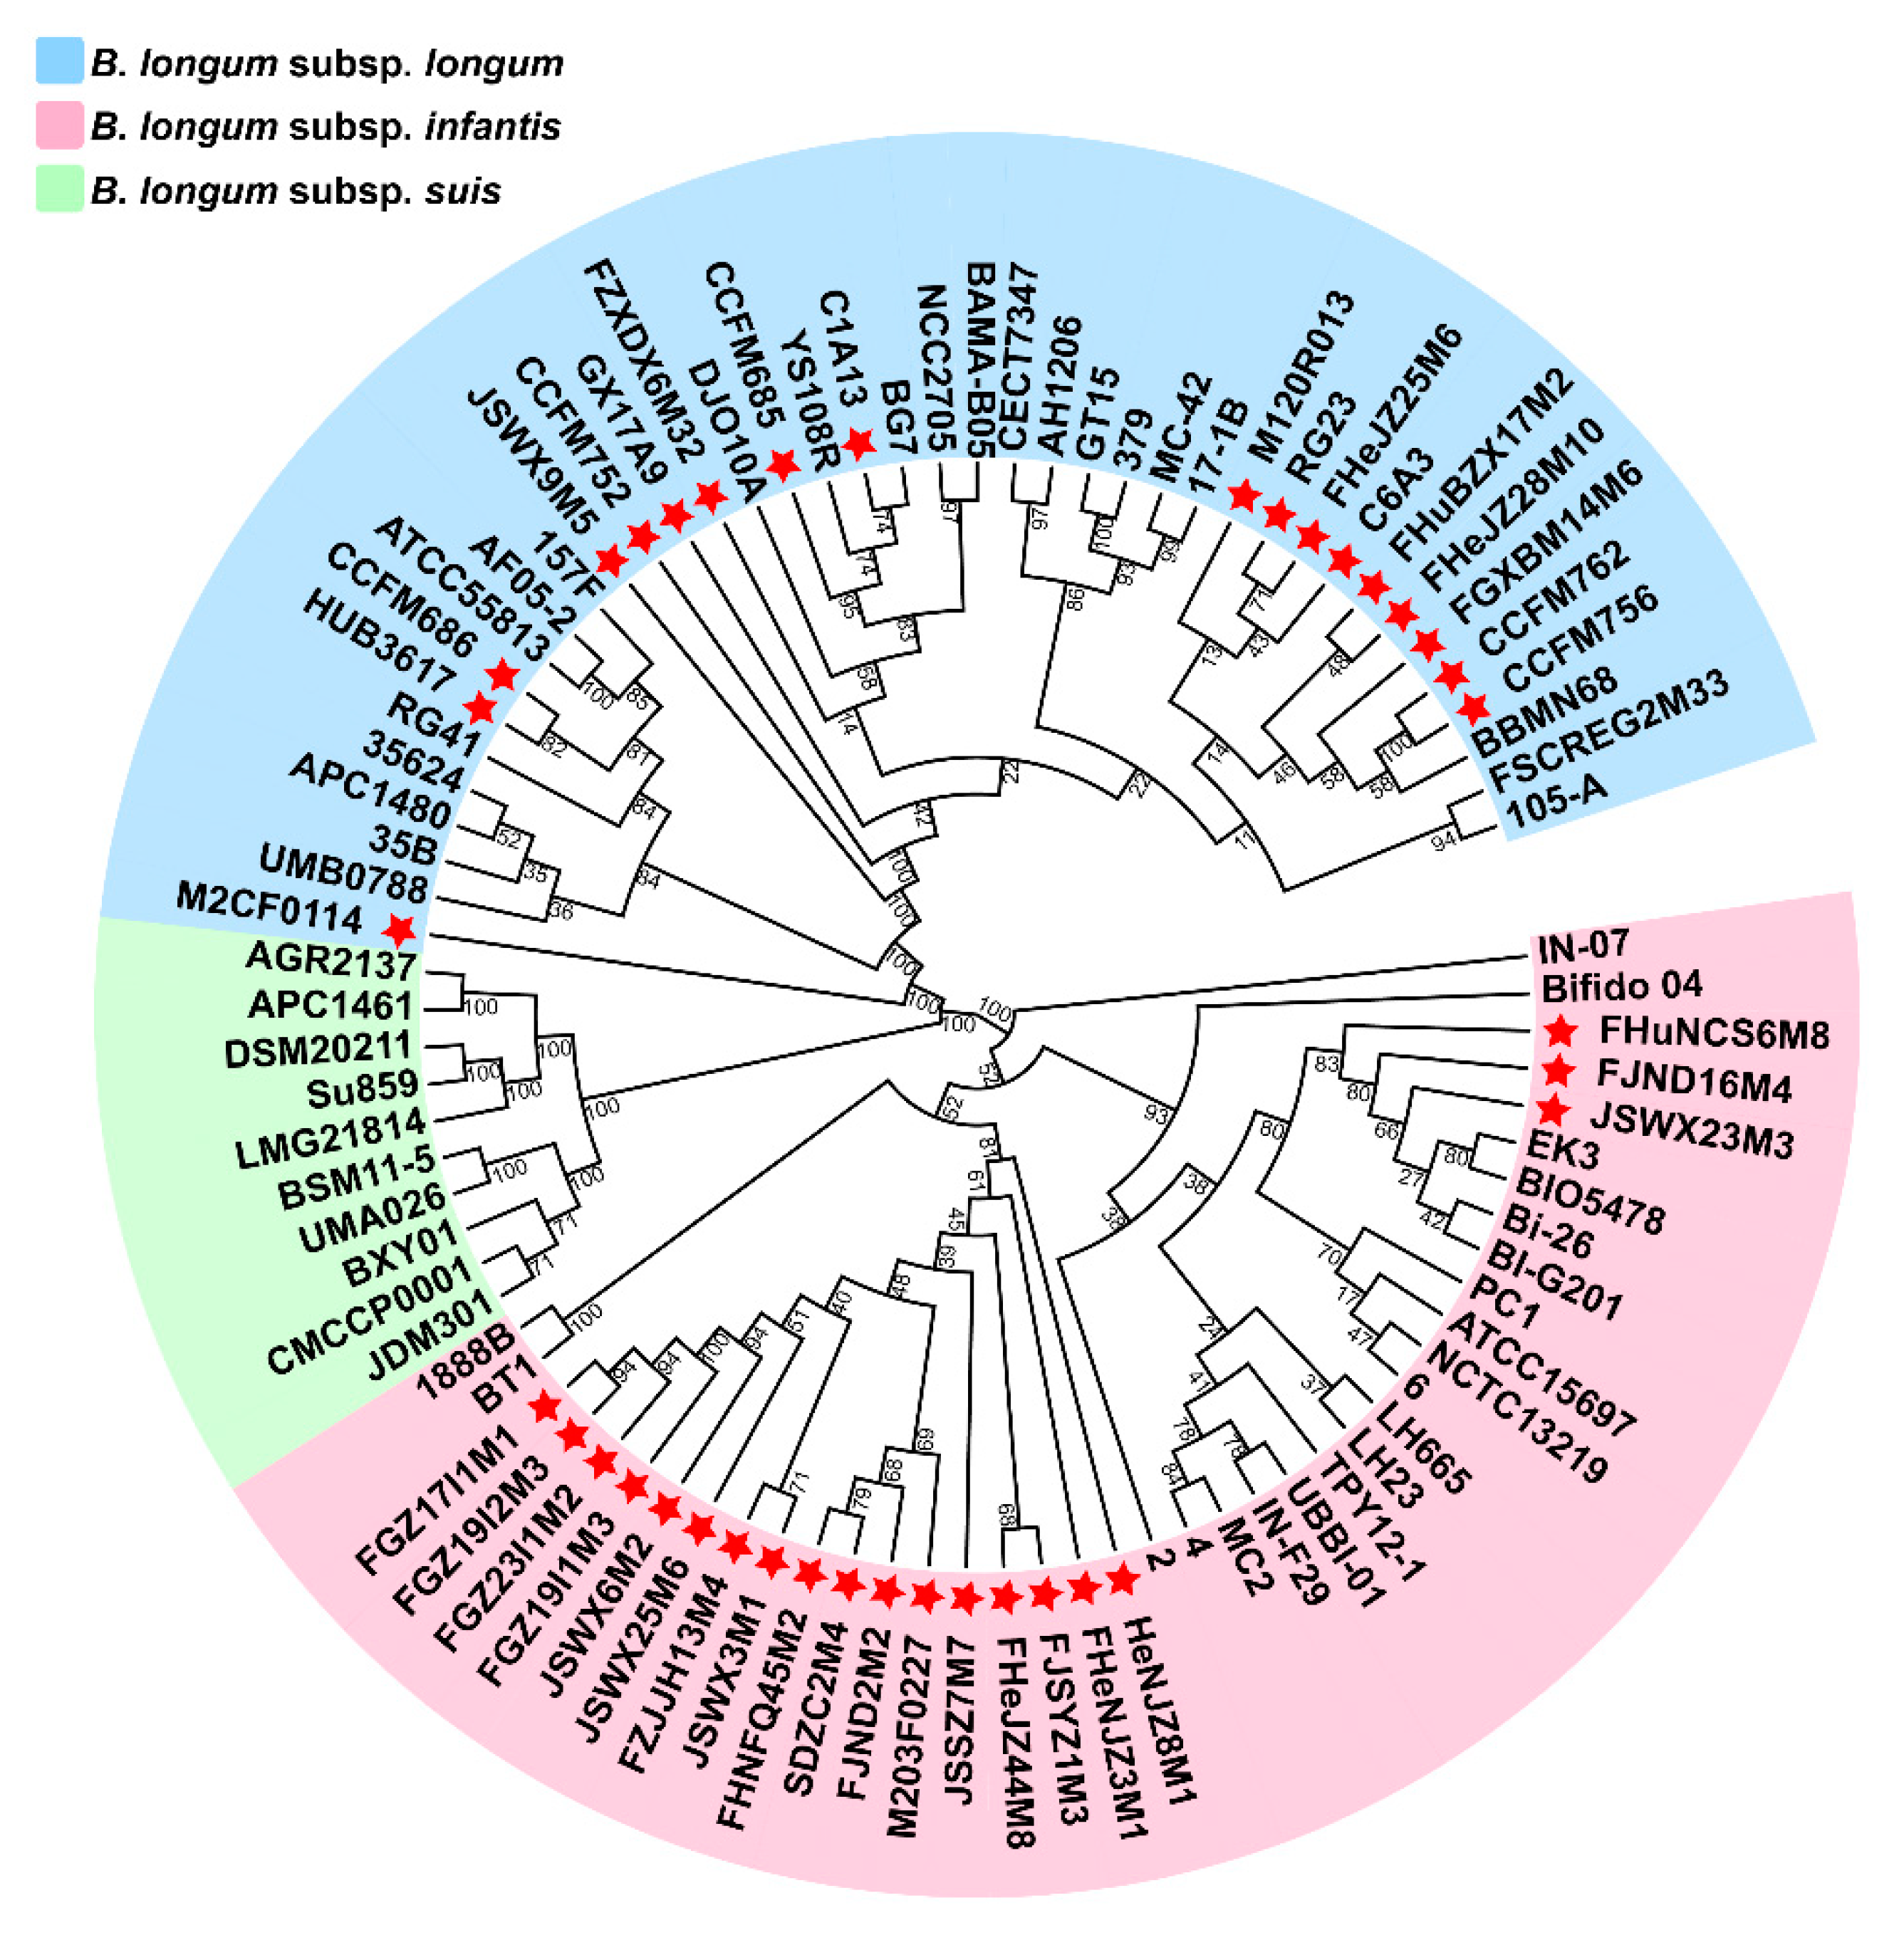
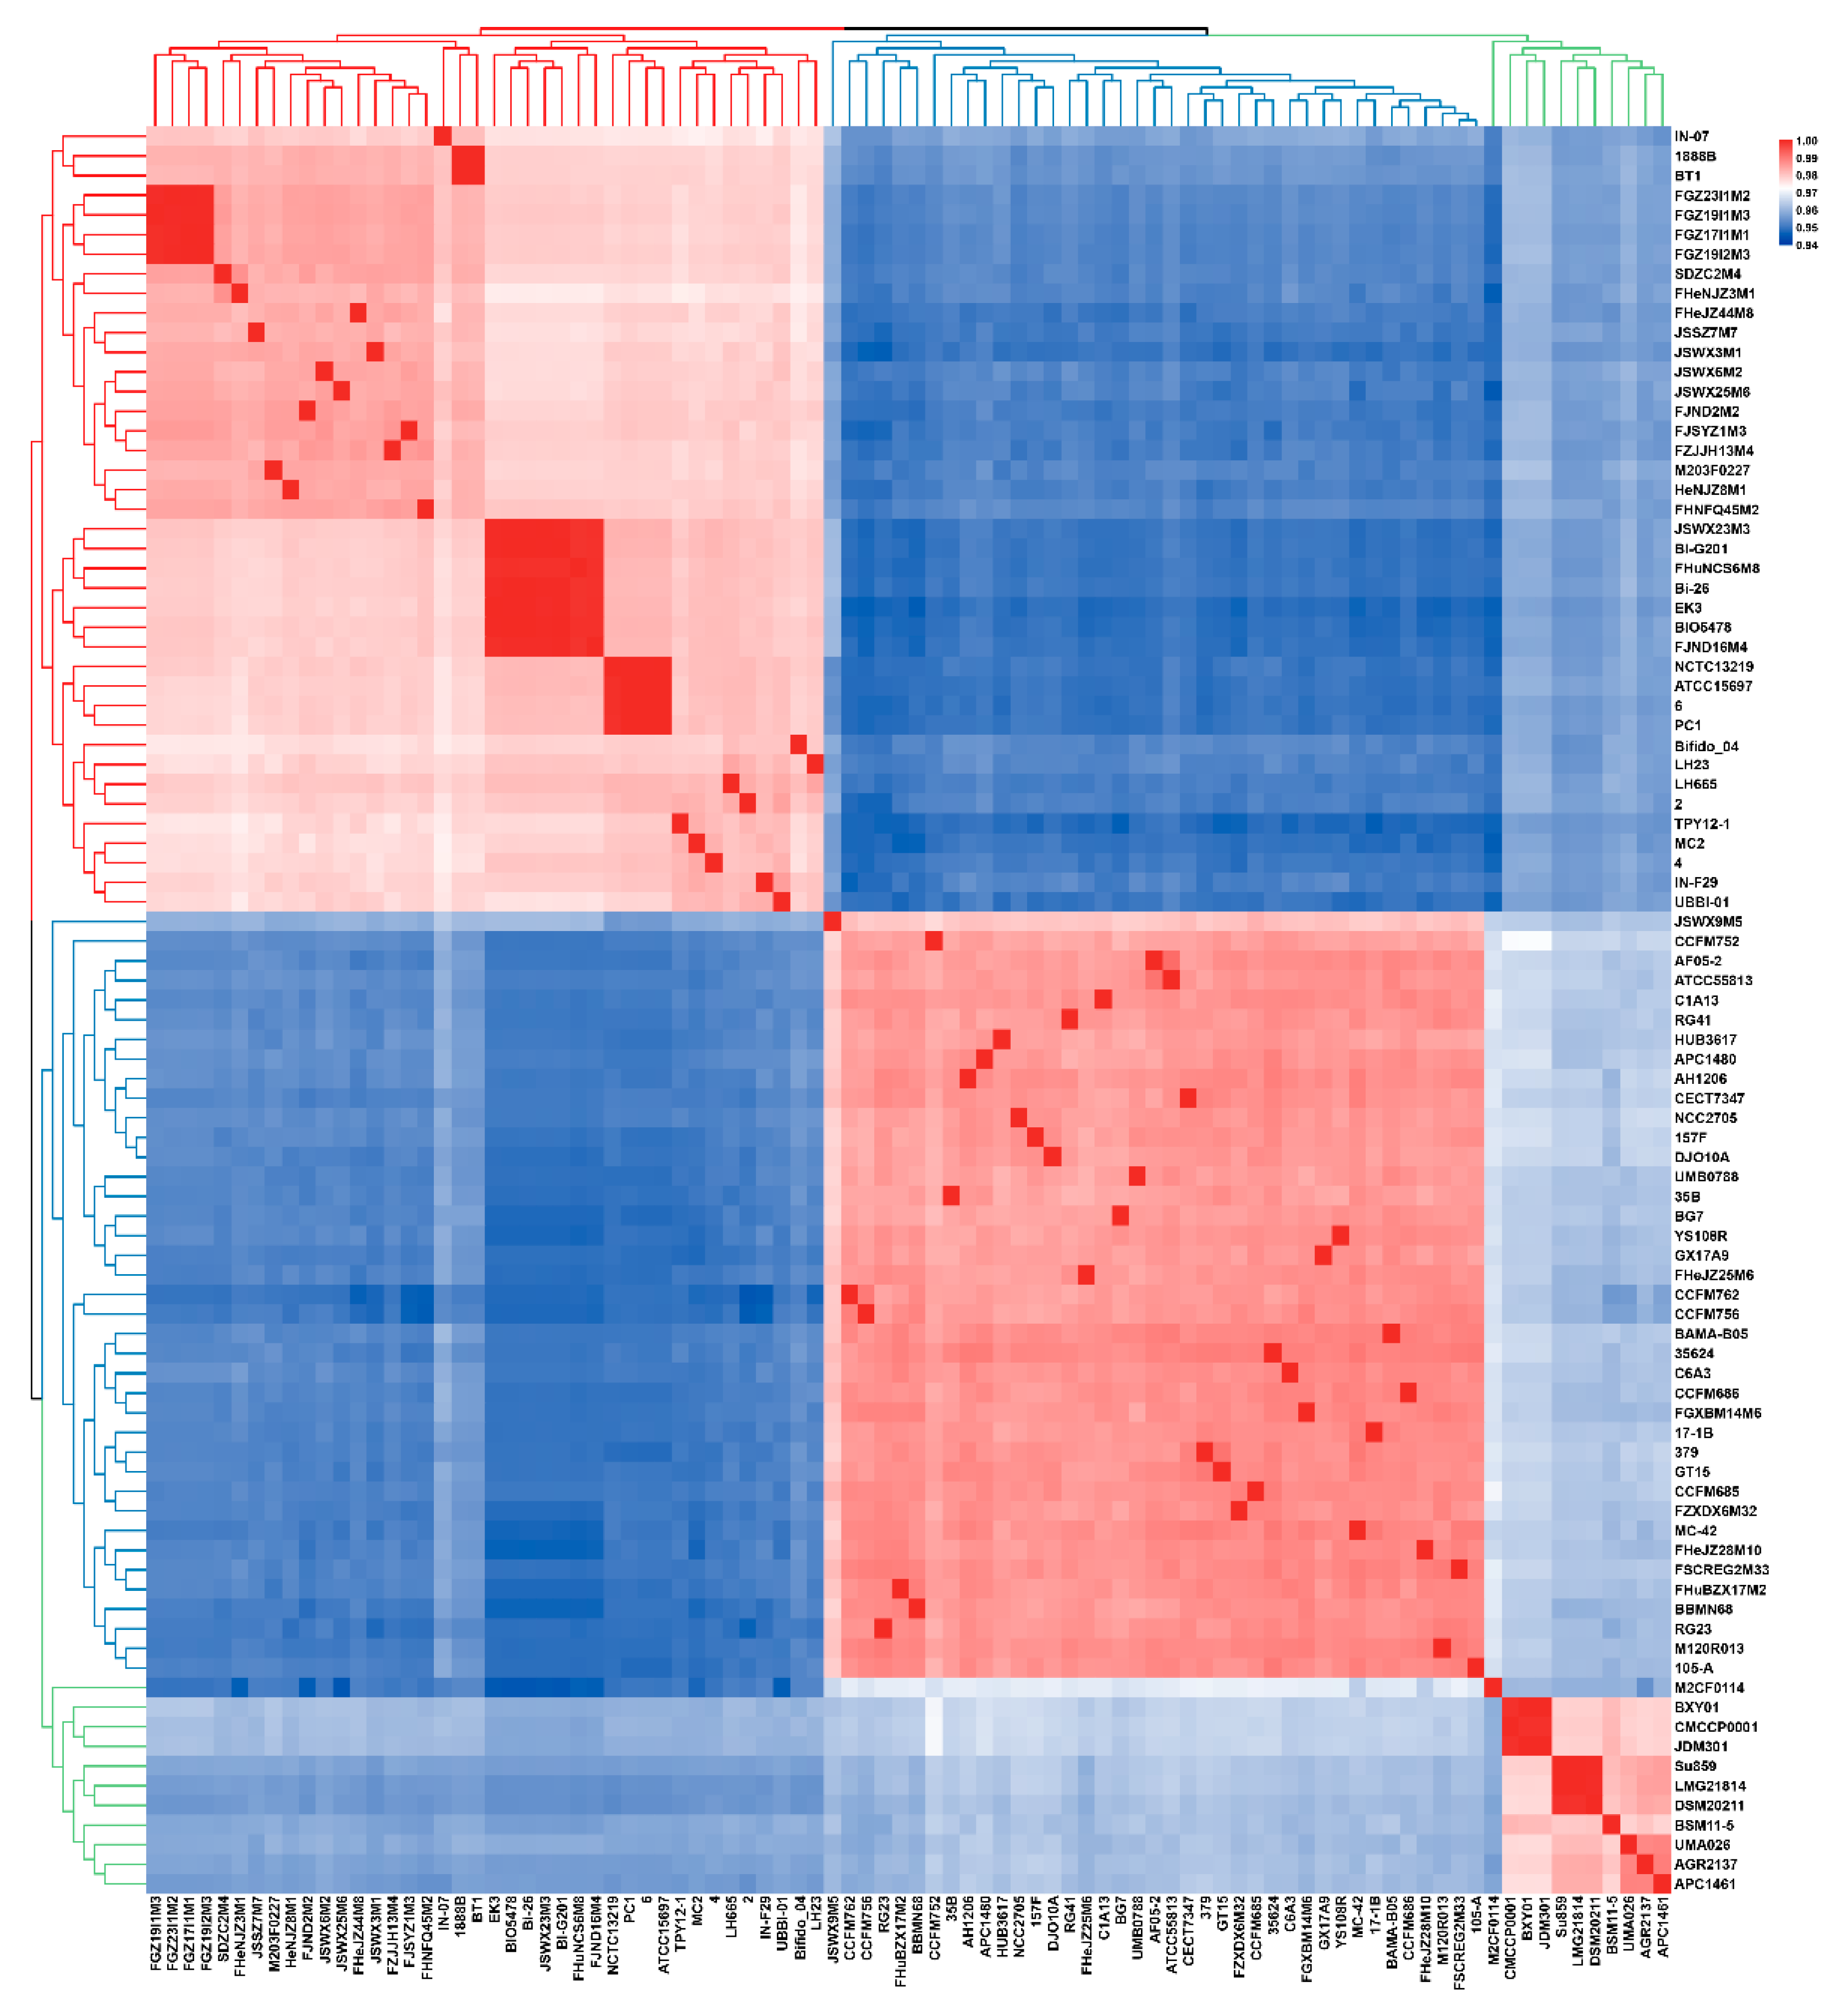
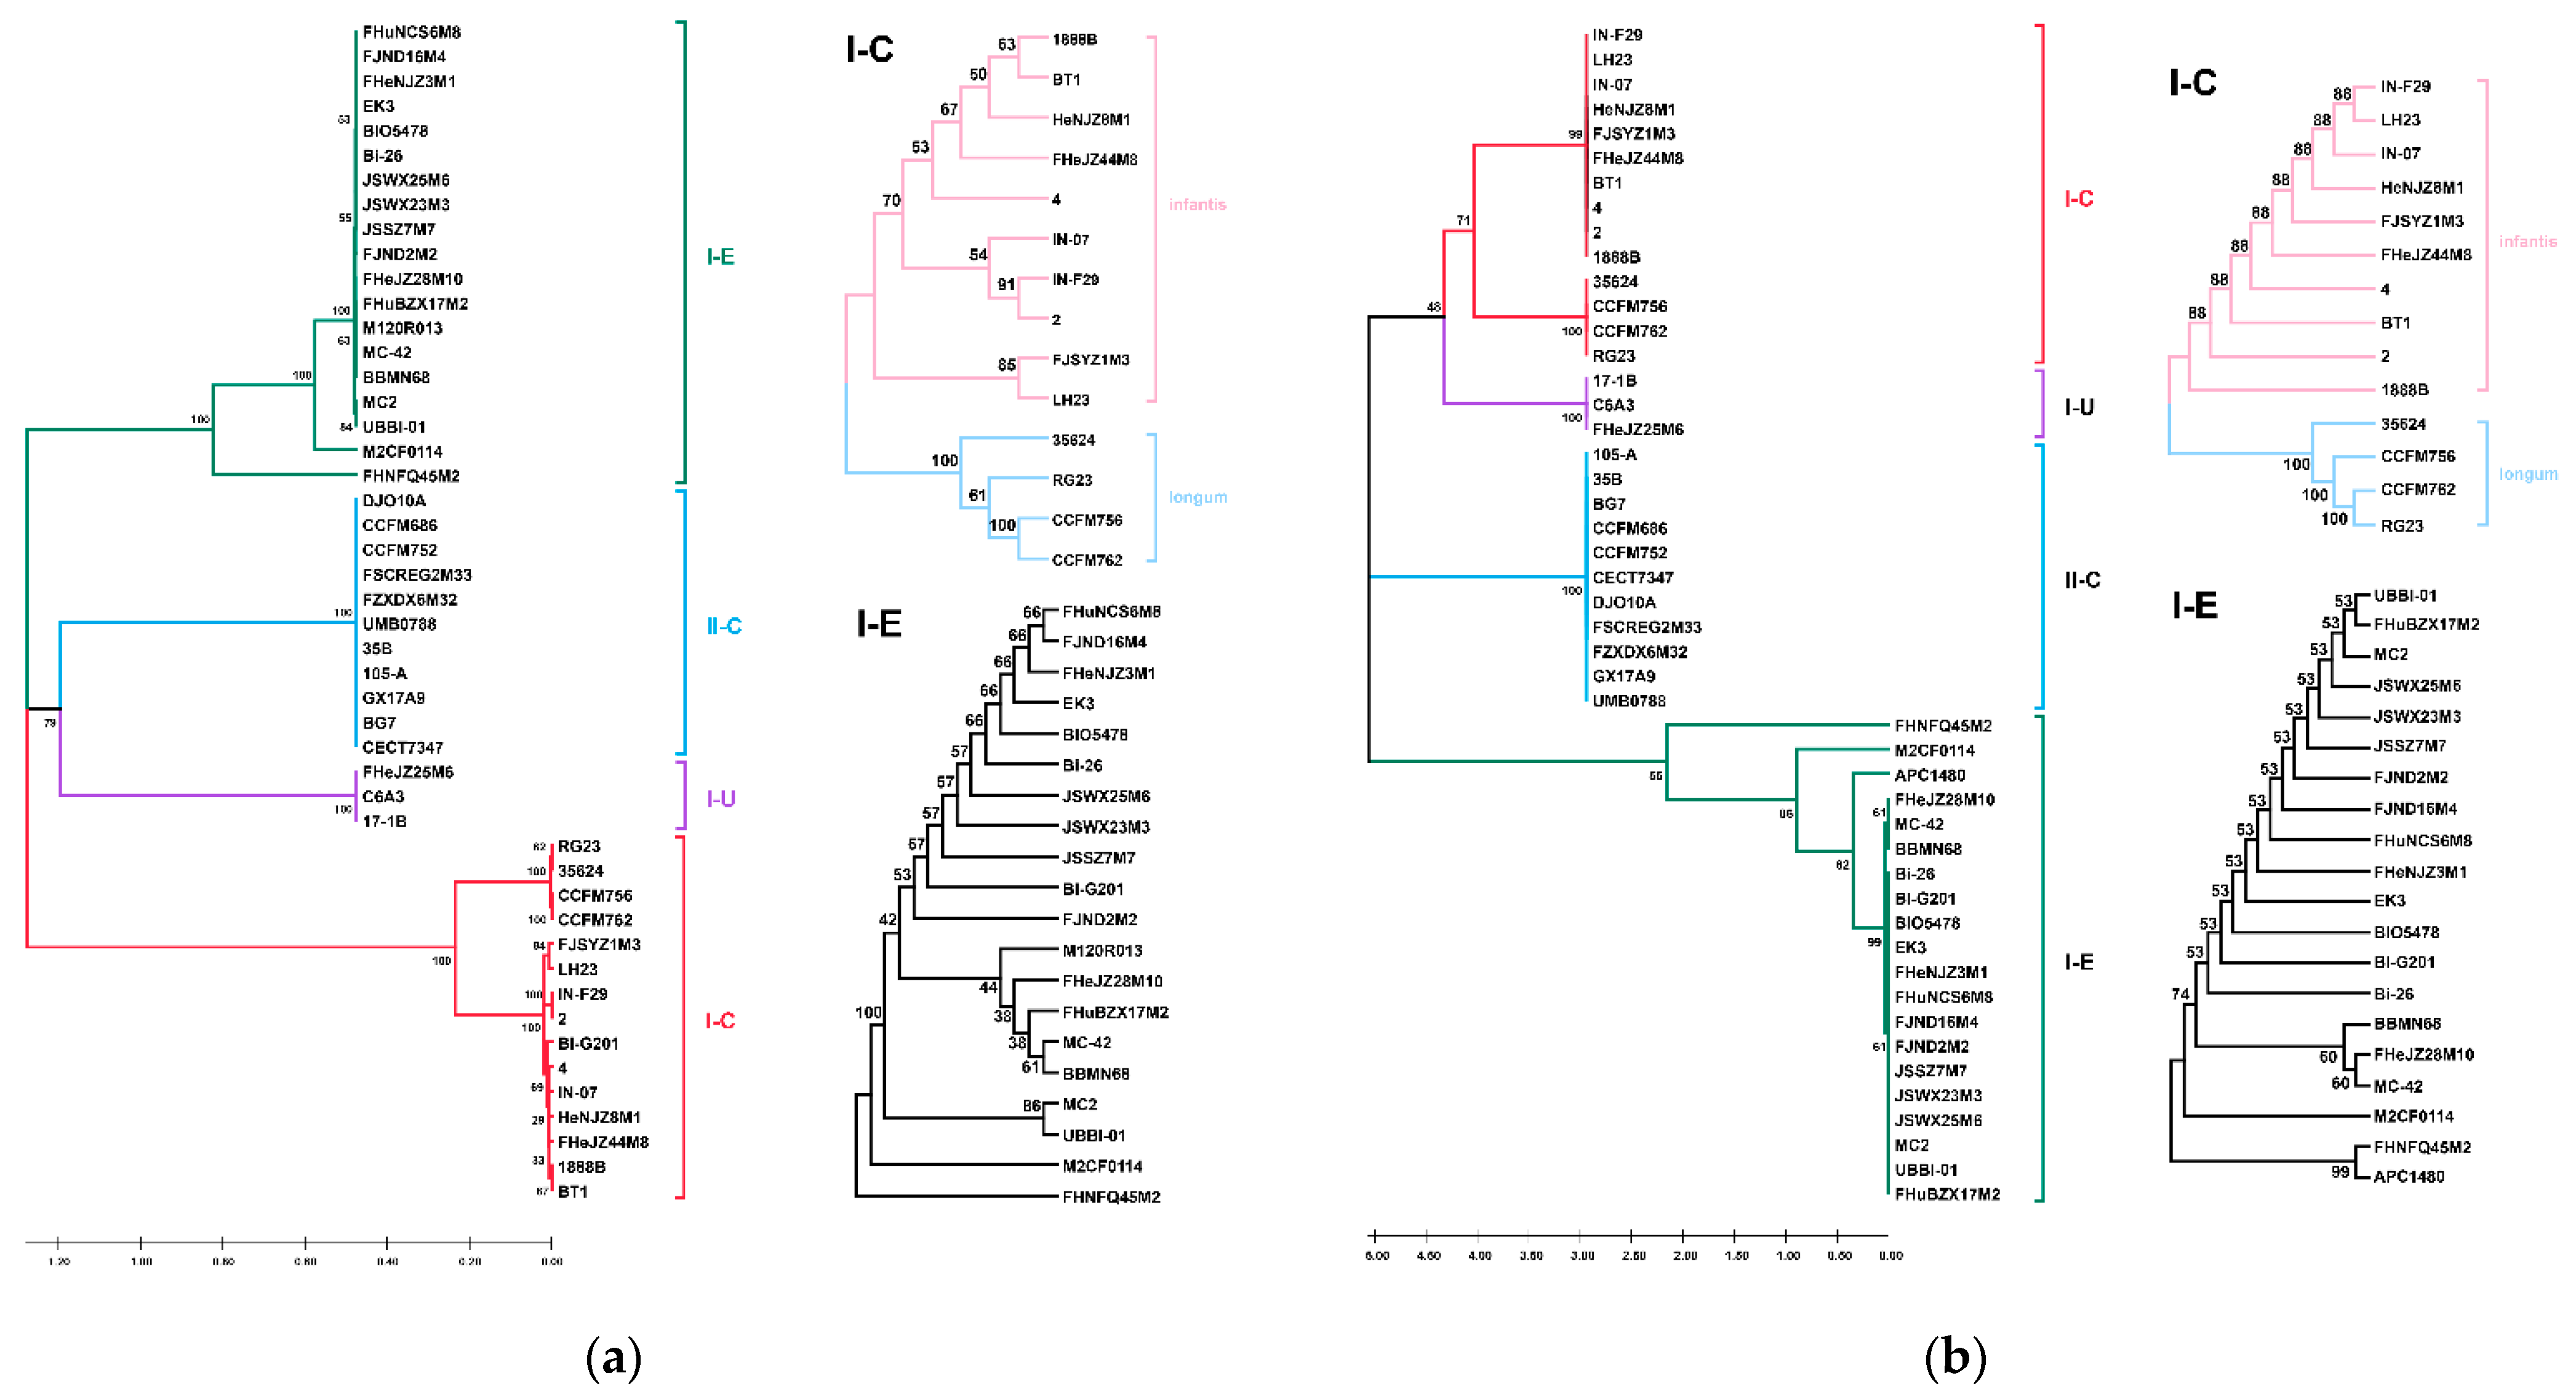
3.1. ANI and Phylogenetic Analysis of B. longum

ANI is the average of all orthologous genes consistency in the two genomes, which can be used for species classification. As 16S rRNA gene comparison analysis cannot accurately distinguish the subspecies, all the B. longum strains in the study were classified at the subspecies level via ANI and phylogenetic analysis. The clustering results based on ANI values showed that 90 strains could be divided into three subspecies (Figure 1, Table S2). The mean of ANI value between B. longum subsp. infantis and B. longum subsp. longum was 95.21%, while the mean of ANI between B. longum subsp. suis and B. longum subsp. infantis or B. longum subsp. longum were 95.80% and 96.29%, respectively. Moreover, the mean of ANI between B. longum M2CF0114 and B. longum subsp. longum or B. longum subsp. suis were 96.90% and 95.97%, respectively. Therefore, B. longum M2CF0114 should be classified as B. longum subsp. longum, although the clustering of ANI puts it in the same branch as B. longum subsp. suis.
Phylogenetic analysis was performed to further confirm the classification of the strains. OrthoMCL was used to analyse the orthologous genes of 90 B. longum strains; a total of 849 orthologous genes were obtained, and a phylogenetic tree of B. longum was constructed based on the orthologous genes (Figure 2). The results showed that 90 strains were located on three branches, 39 strains were located on the same branch with B. longum subsp. longum NCC2705 (type strain) and 39 strains were located on the same branch with B. longum subsp. infantis ATCC15697 (type strain); B. longum Su859 and LMG 21814 among the 10 strains on the third branch have been proved to be B. longum subsp. suis [2,27]. Moreover, it was further confirmed that M2CF0114 belonged to B. longum subsp. longum. In addition, those analyses showed that some strains were misclassified in the previous study; for instance, 157F, ATCC55813 and 35624 should be B. longum subsp. longum instead of B. longum subsp. infantis, and BXY01, CMCCP0001 and JDM301 should be classified as B. longum subsp. suis rather than B. longum subsp. longum.

3.2. General Genome Features of B. longum subsp. infantis and B. longum subsp. longum

The general genome features of B. longum are shown in Table 1. The genome sizes of B. longum subsp. longum strains ranged from 2.20 Mb (M120R013) to 2.54 Mb (JSWX9M5), with an average size of 2.39 Mb. The average size of B. longum subsp. infantis genomes was 2.66 Mb, among which FJND2M2 represented the smallest genome (2.54 Mb) and FHNFQ45M2 possessed largest genome with a size of 2.84 Mb. The average GC content of B. longum subsp. longum was 60.01%, ranging from 59.69% of CCFM685 to 60.40% of AF05-2, and the average number of genes was 1978. While the average GC content of B. longum subsp. infantis was 59.56%, and the number of genes ranged from 2011 to 2781, with an average of 2315.

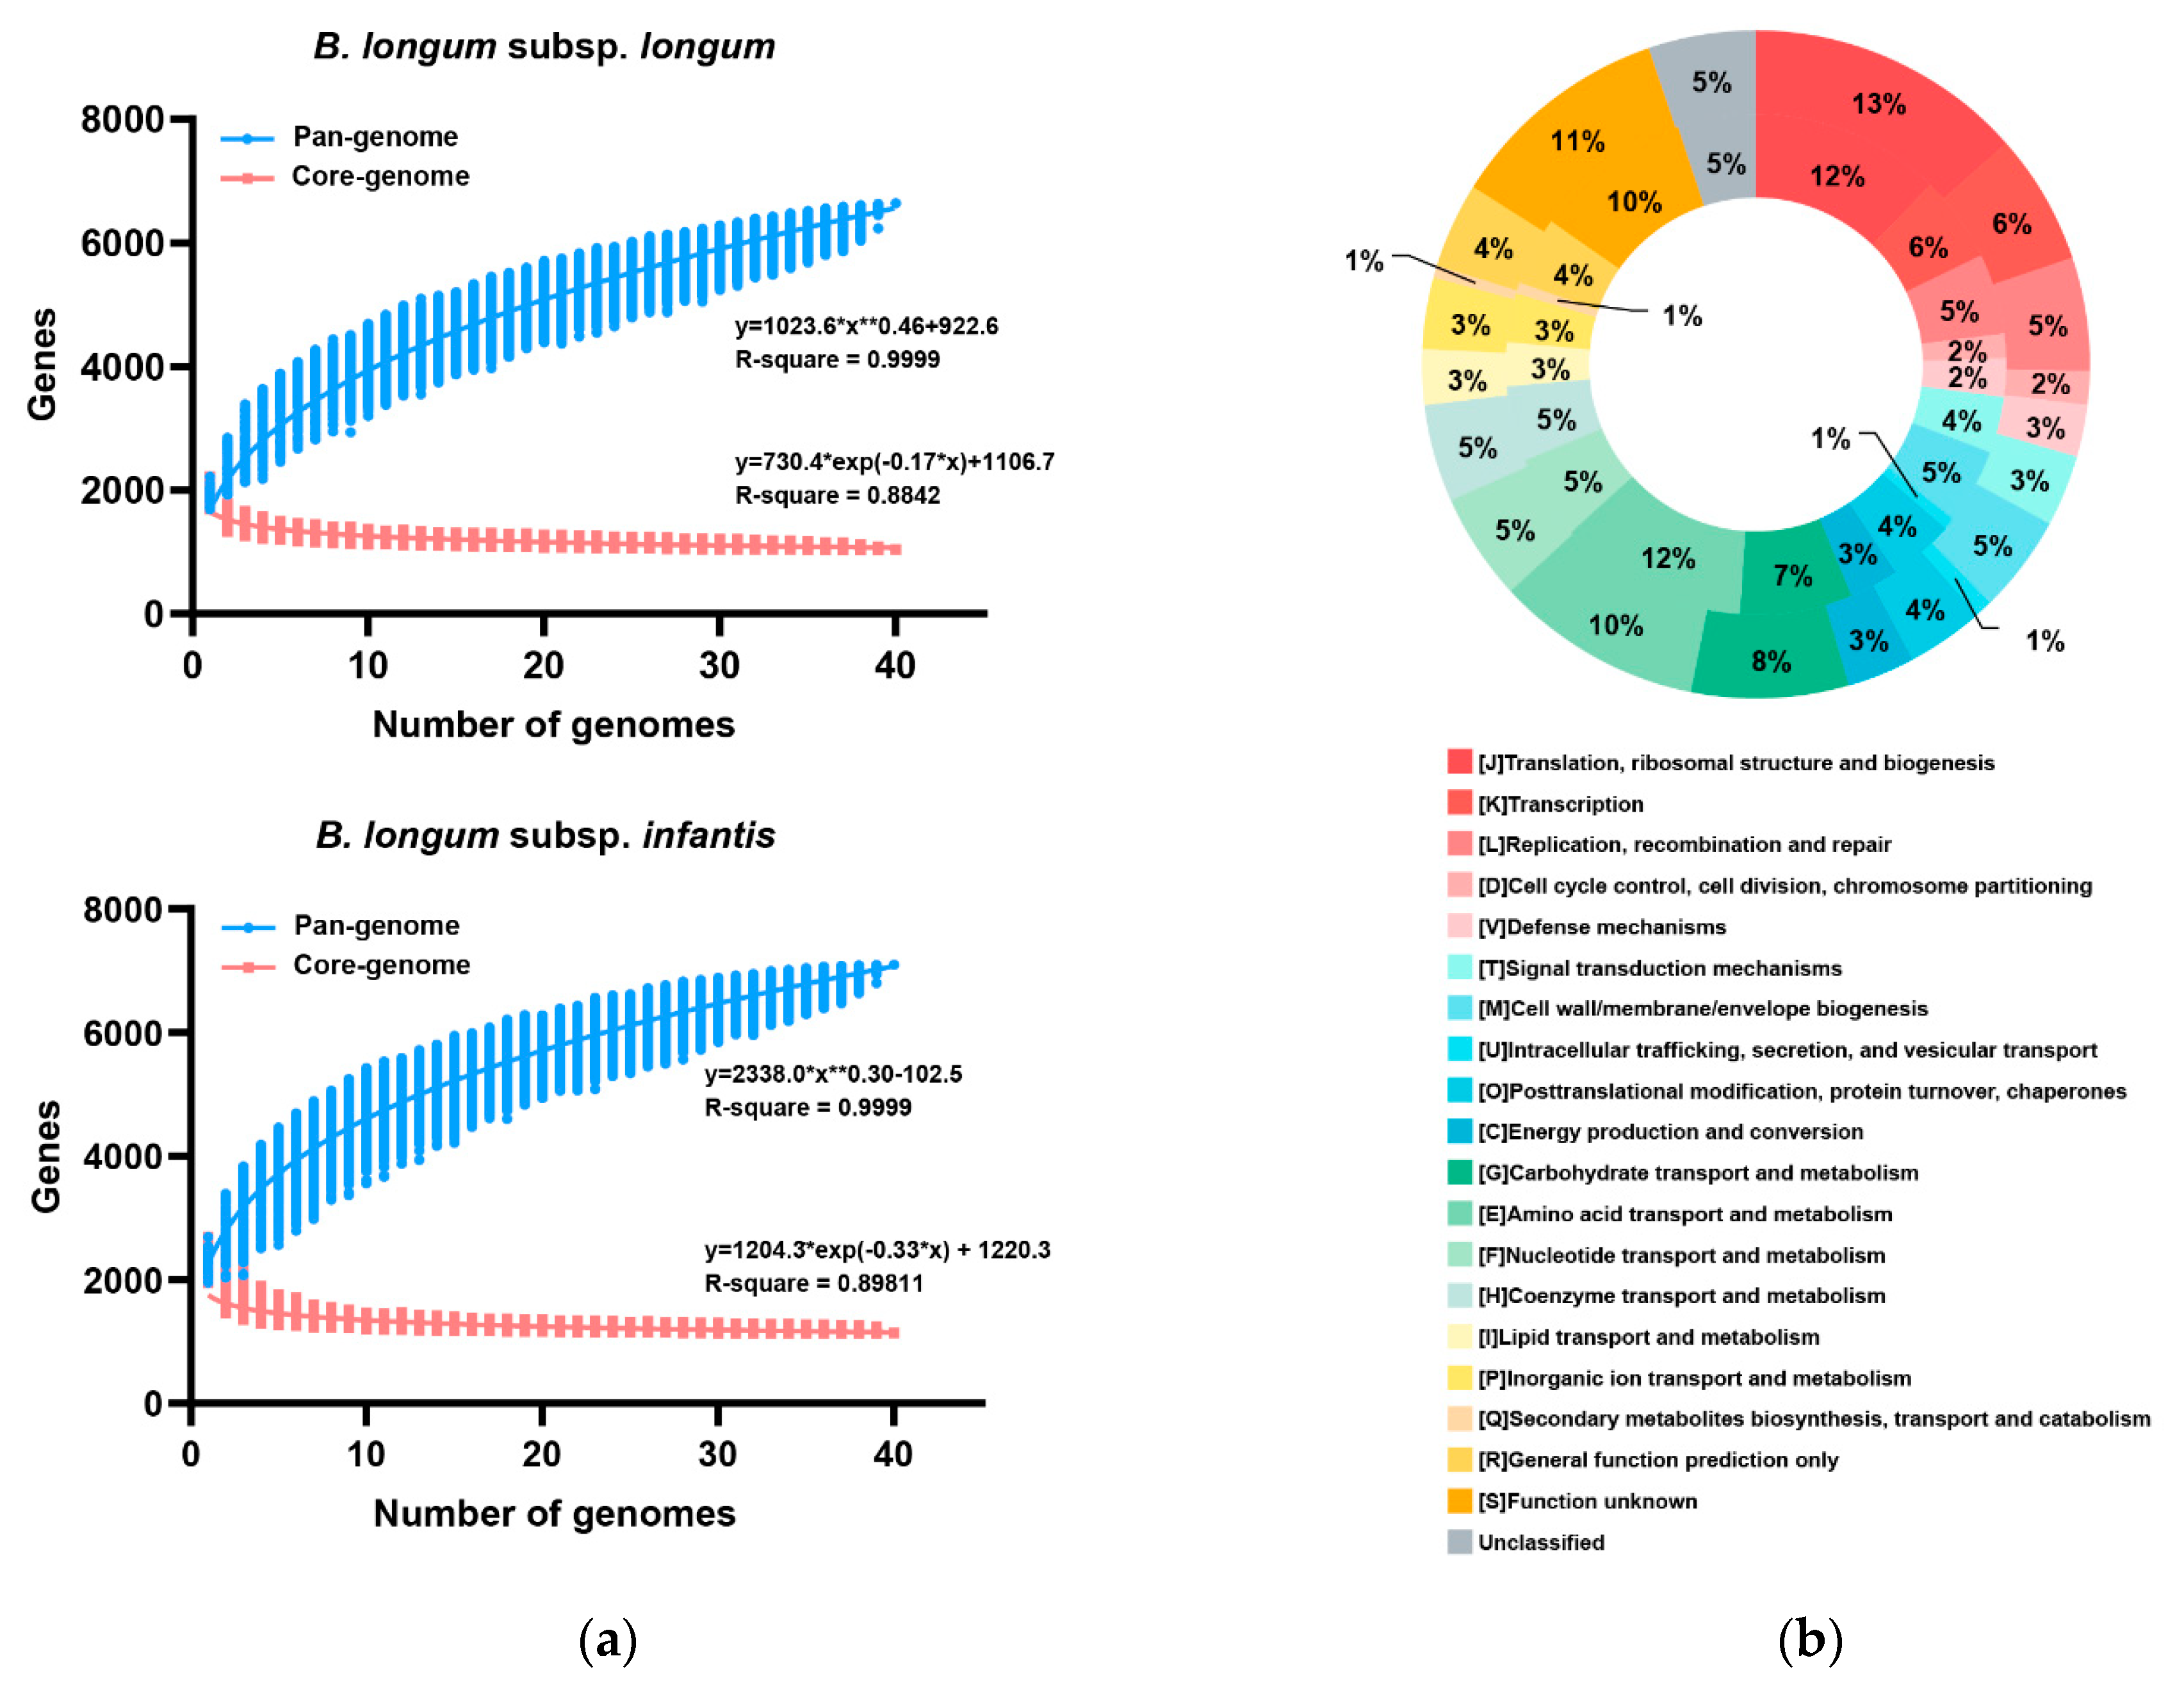
3.3. Pan- and Core-Genome of B. longum subsp. infantis and B. longum subsp. longum

Pan-genome refers to all the genes of one species, consisting of three parts: core genes, non-essential genes and strain-specific genes. The pan-genome analysis of B. longum subsp. longum showed that as the number of added genomes increased, new genes continued to appear, and the number of pan-genome gradually increased; when the number of genomes reached 35, the number of pan-genomic genes increased slowly (Figure 3a), which indicated that the B. longum subsp. longum genome was nearly closed. The pan-genome of B. longum subsp. longum contained 6645 genes, and its core genome possessed 1043 genes. The COG annotation showed that those genes related to translation, ribosomal structure and biogenesis accounted for the highest proportion in the core genome (13.42%), followed by function unknown (10.83%), amino acid transport and metabolism related genes (9.97%), and the genes related to carbohydrate transport and metabolism accounted for 7.57% in the core genome (Figure 3b). The pan-genome curve of B. longum subsp. infantis showed that it was approximately closed; as the number of added genomes increased, the rate of change in the number of core genomes slowed down (Figure 3a). The core genome size of B. longum subsp. infantis strains was 1139 genes, which accounted for approximately 16.06% of the B. longum subsp. infantis pan-genome. The functional composition of the COG of B. longum subsp. infantis was not significantly different from that in B. longum subsp. longum (Figure 3b), and only slightly higher than B. longum subsp. longum (12.20%) in genes related to amino acid transport and metabolism.

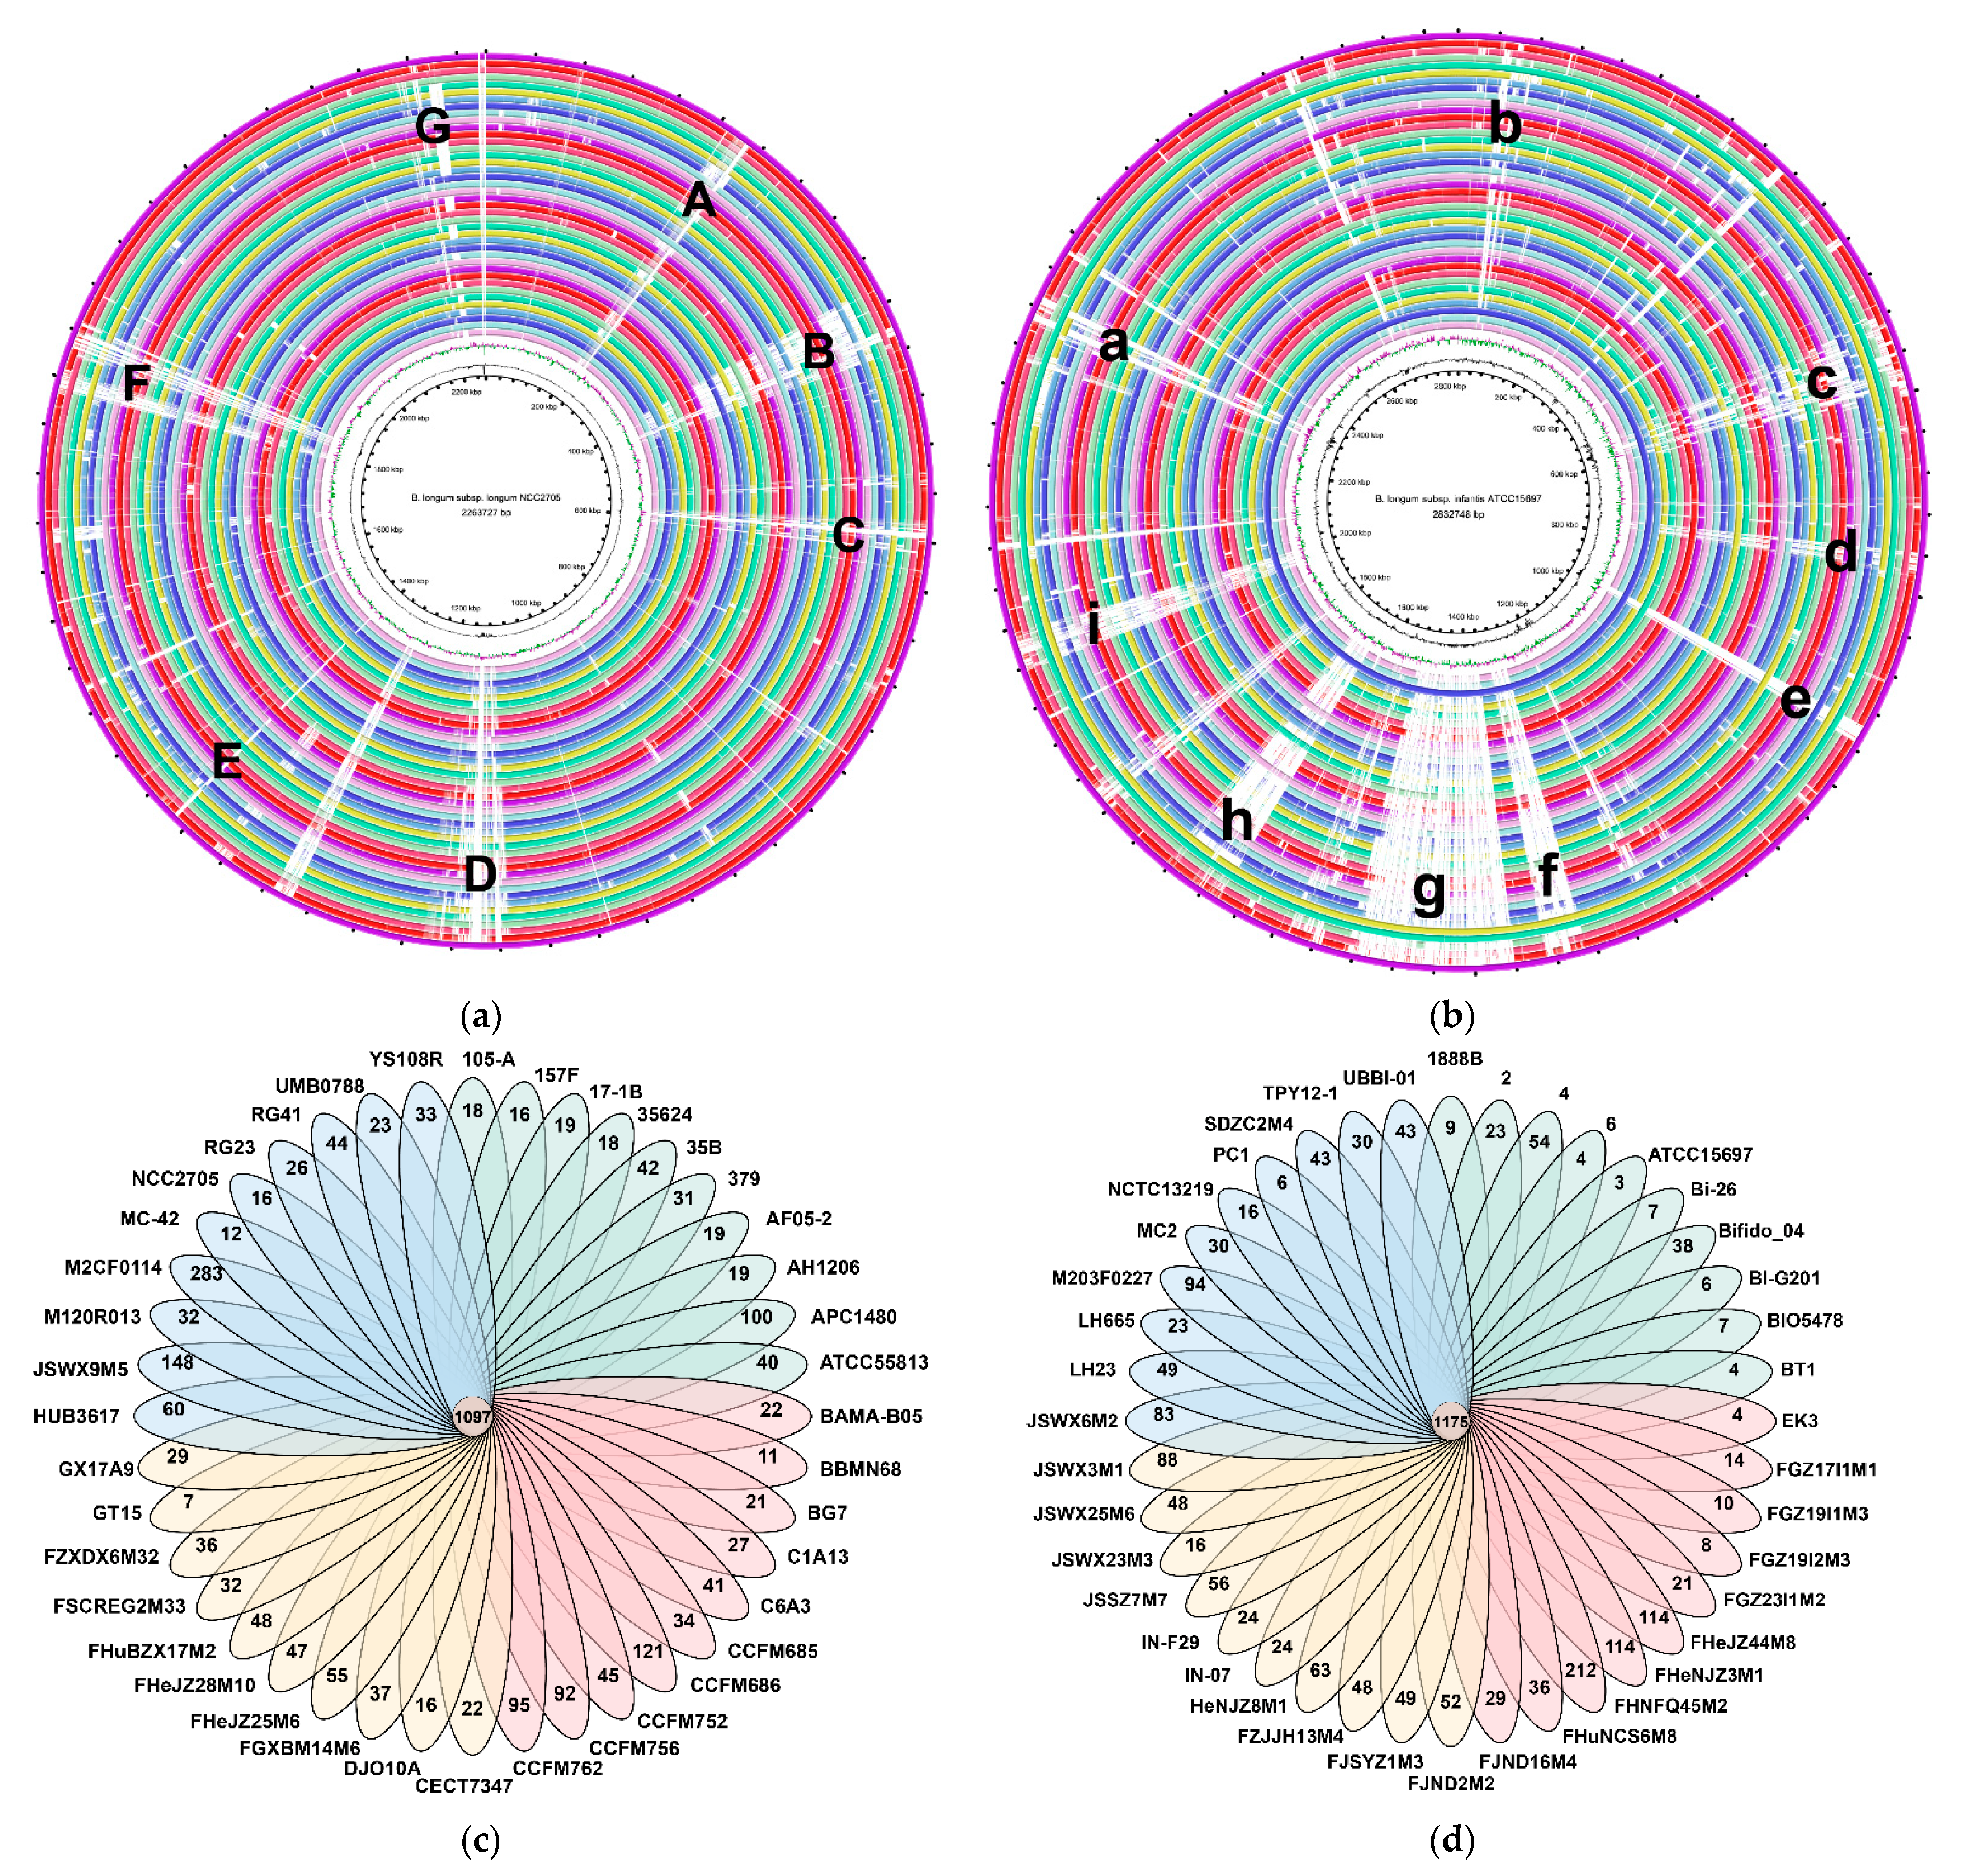
3.4. Whole Genome and Orthologous Gene Comparison

The whole genomes of B. longum subsp. infantis and B. longum subsp. longum were compared via BRIG. B. longum subsp. infantis ATCC15697 and B. longum subsp. longum NCC2705 were taken as the reference genomes of each subspecies, respectively. The genomes of B. longum subsp. longum included seven main regions of variation (Figure 4a); regions A, C and F mainly included the genes related to transport and metabolism of substances, especially carbohydrates; region D mainly included the extracellular polysaccharide synthesis gene clusters; the genes in region B were related to replication, recombination and repair and transcription; region E mainly included the genes related to prophages, transposons and function unknown; and region G consisted of genes related to transcription or defence mechanisms. B. longum subsp. infantis had more variable regions compared with B. longum subsp. longum (Figure 4b). Among them, regions a, b, d and h had the same functions as the regions D, C, A and E of B. longum subsp. longum; region c was mainly related to signal transduction mechanisms; regions e and g contained genes related to replication, recombination and repair; and the main genes in regions f and i had unknown function.
The results of orthologous genes analysis showed that the number of orthologous genes in B. longum subsp. longum and B. longum subsp. infantis were 1097 and 1175 (Figure 4c,d), respectively. The difference between orthologous genes of the two subspecies was further compared, and a total of 41 genes only existed in B. longum subsp. infantis, while there were only ten specific genes for B. longum subsp. longum (Table S3). Specific genes of B. longum subsp. infantis mainly included urease gene clusters (BLON_RS00555-BLON_RS00605) and sialic acid metabolism gene clusters (BLON_RS03265-BLON_RS03305) [6], while the specific-genes of B. longum subsp. longum included transcriptional regulator, transpeptidase and amidohydrolase.

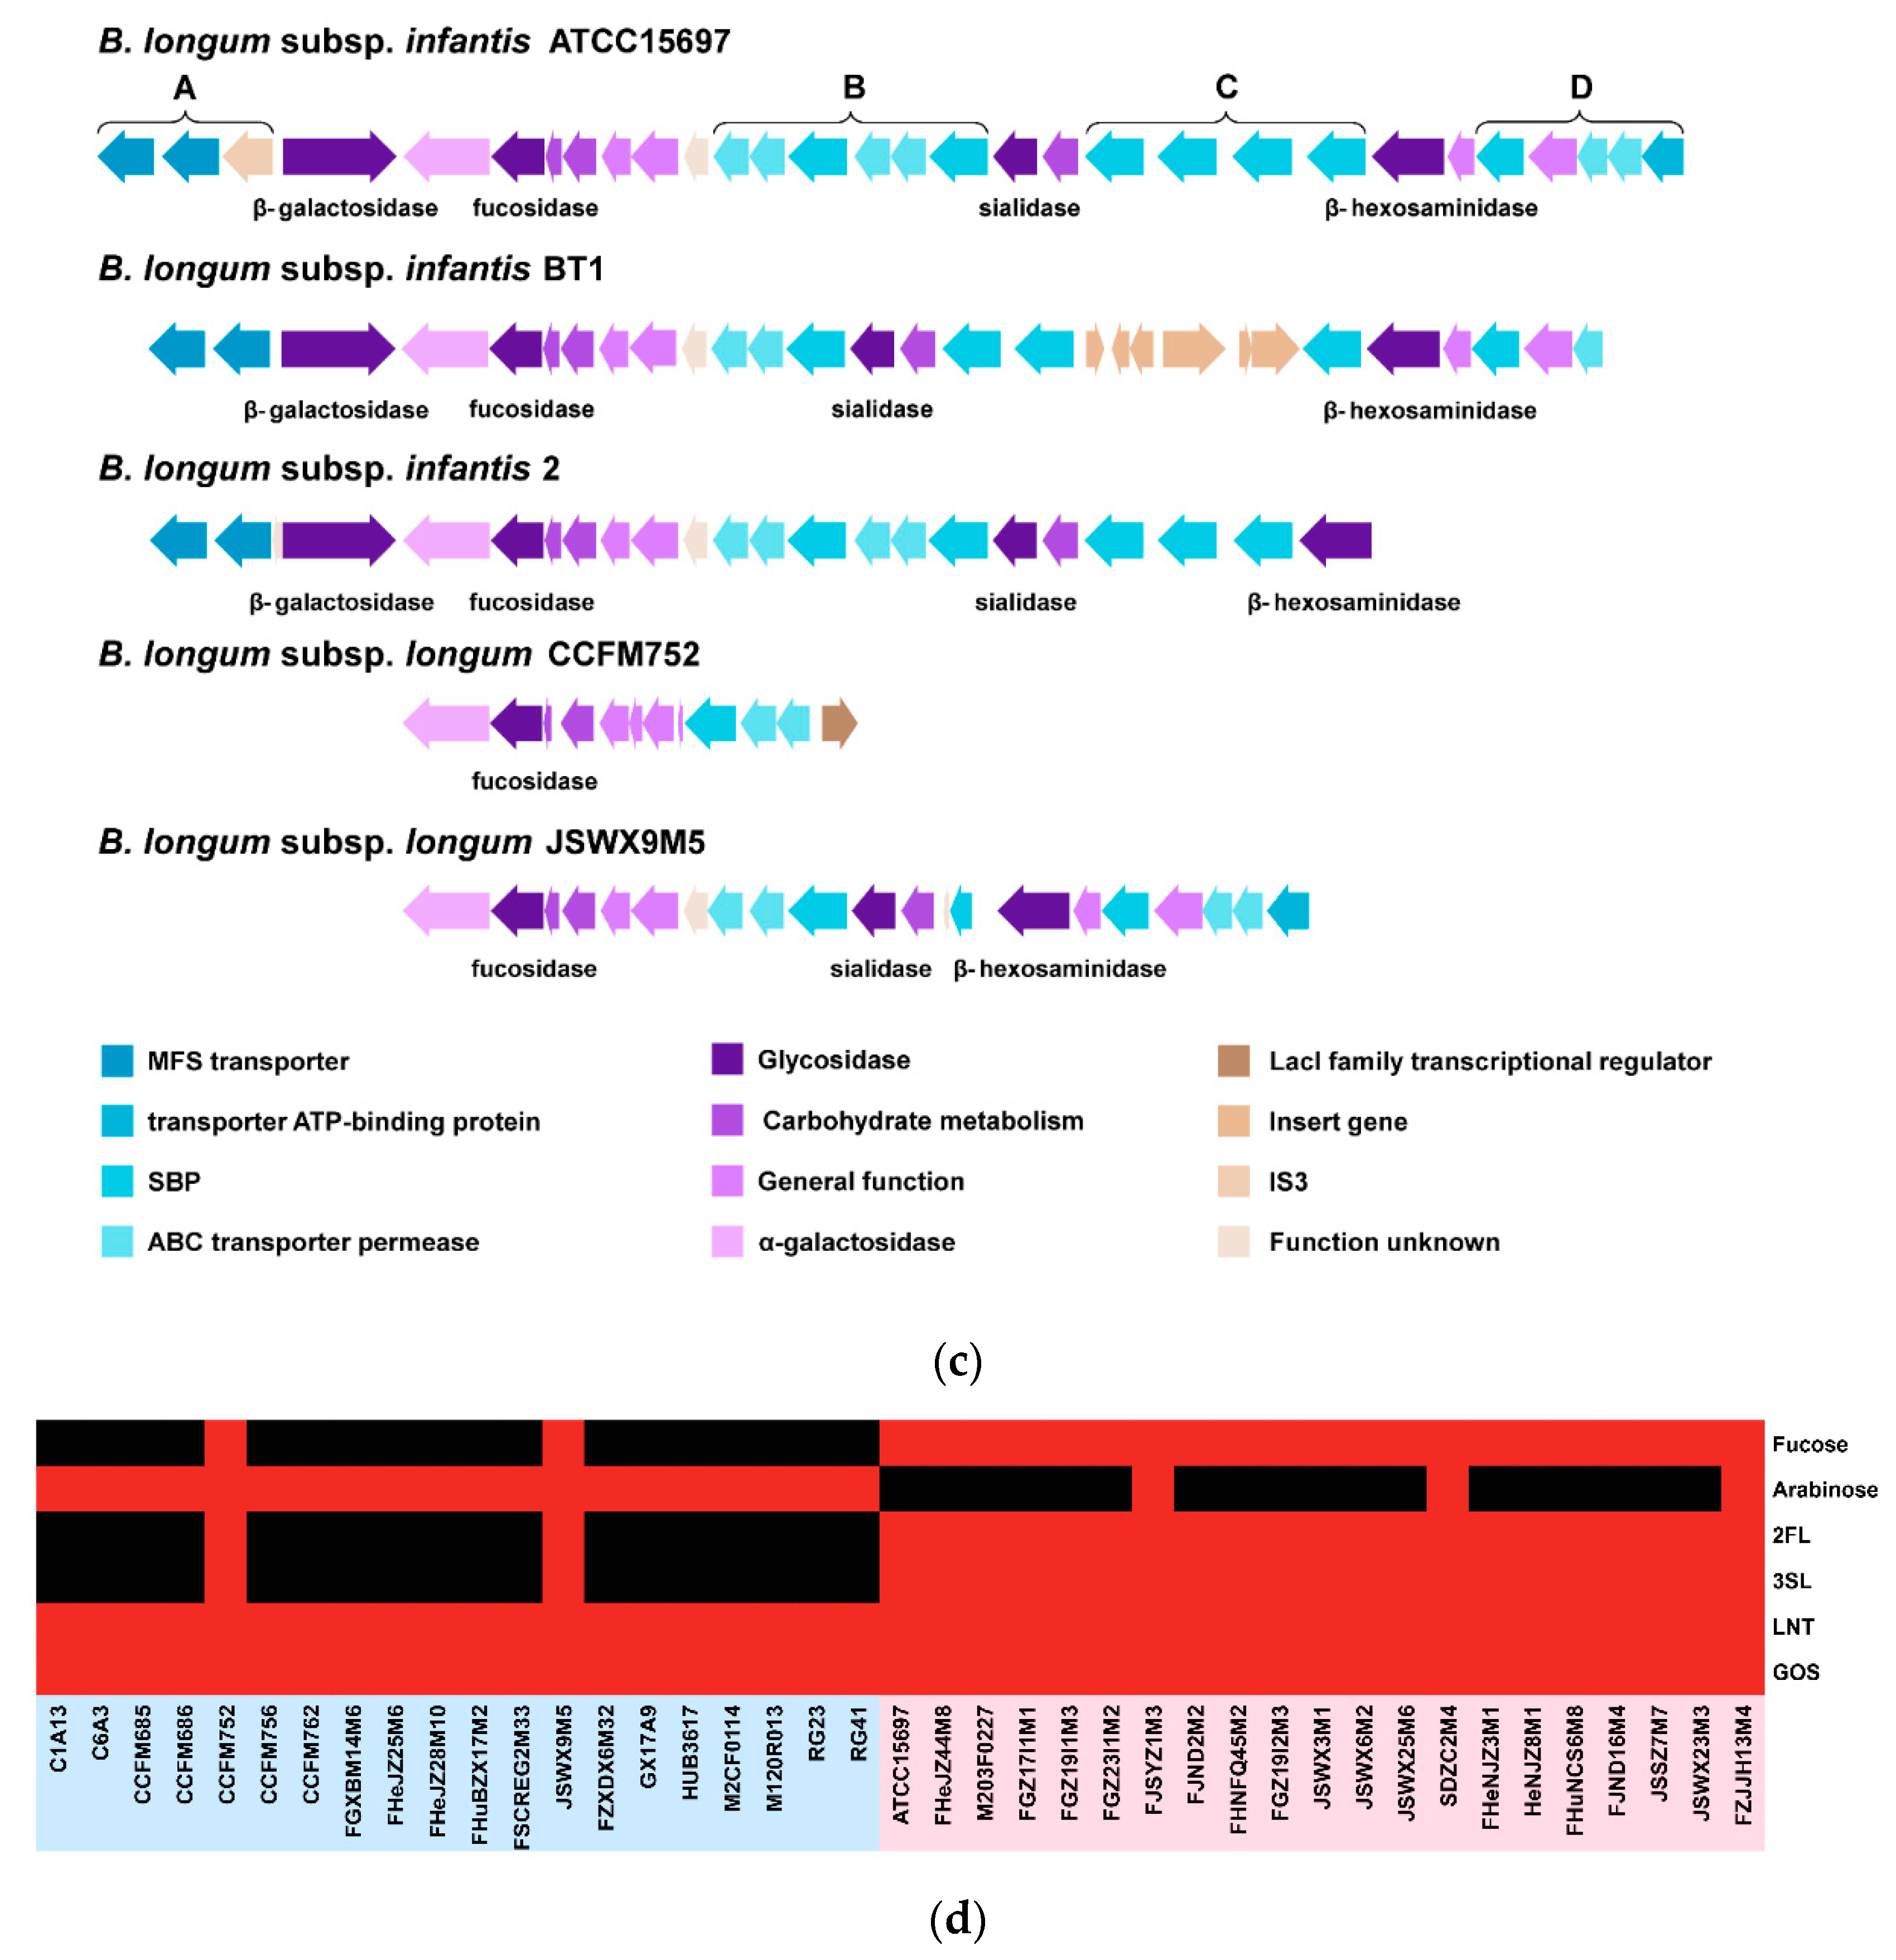
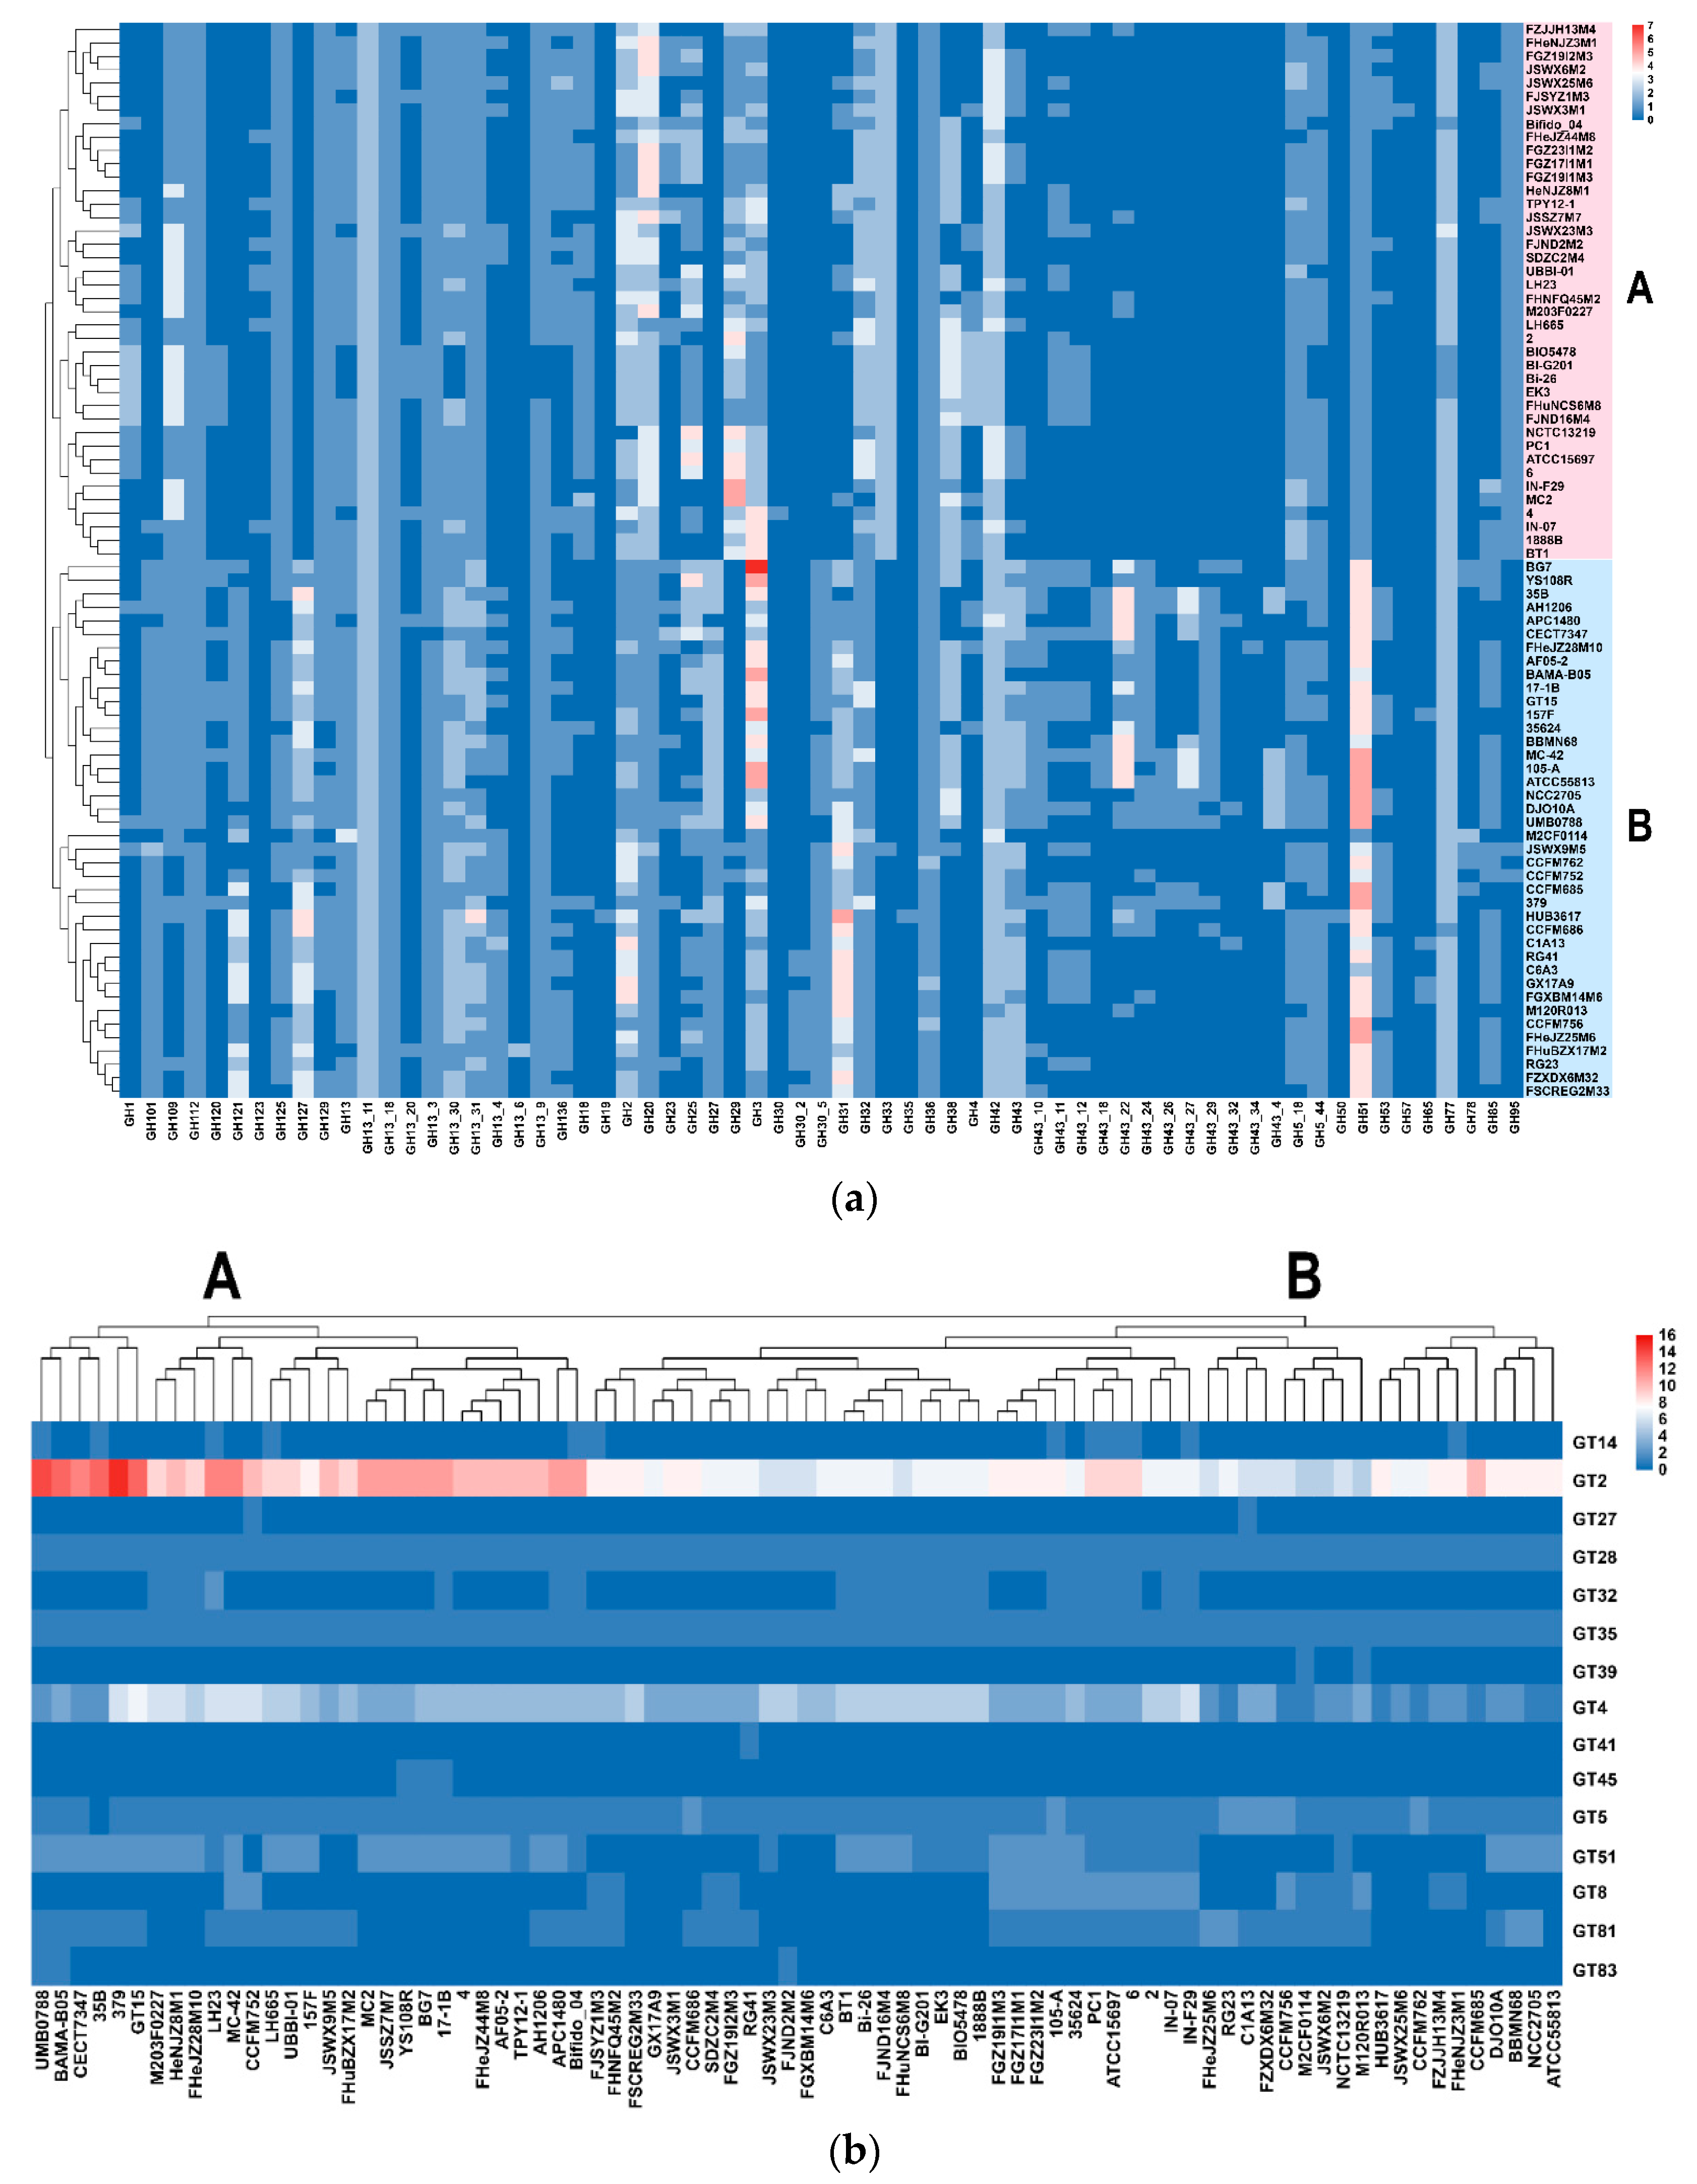
3.5. Carbohydrate Utilization Genotype and Phenotype of B. longum subsp. infantis and B. longum subsp. longum

Carbohydrate metabolism was one of the main differences between B. longum subsp. infantis and B. longum subsp. longum. In this study, the carbohydrate metabolism phenotype of B. longum and its association with genotype were analysed. The prediction of the CAZy database showed that those 80 B. longum strains encoded 65 glycosylhydrolase (GH) families and 15 glycosyltransferase (GT) families; in addition, GH19, GH30, GH35, GH43_34, GH50, GH57 and GH13_6 only existed in very few genomes, while GH20, GH2, GH77, GH13_11, GH42, GH3 and GH51 were abundant in B. longum.
The cluster analysis of the distribution and abundance of GH families showed that the GH families of B. longum could be divided into two groups, in which group A was B. longum subsp. infantis and group B was B. longum subsp. longum (Figure 5a). In addition, the significant difference in the number of GH genes between B. longum subsp. infantis and B. longum subsp. longum was evaluated by t-test, and the results showed that 21 out of 65 GH families were significantly different (p < 0.05, data not shown). The GH27, GH121 and GH127 families only existed in B. longum subsp. longum. Only B. longum subsp. longum APC1480 lacked the GH27 family; the GH121 family was absent in JSWX9M5, CCFM762, DJO10A and YS108R, while the GH127 family was conserved in all the B. longum subsp. longum strains. The GH29, GH33 and GH95 families were conserved in all the B. longum subsp. infantis, and only a few B. longum subsp. longum strains (such as JSWX9M5 and CCFM752) consisted of those genes. The number of GH43 and its subfamily, GH51, in B. longum subsp. infantis was less than that in B. longum subsp. longum. In addition, the 15 GT families in B. longum could also be divided into two groups (Figure 5b), but there was no significant distinction at the subspecies level (except GT2, p < 0.05, data not shown).
There was a 43kb HMOs utilisation gene cluster in B. longum subsp. infantis [6]. The BLAST using B. longum subsp. infantis ATCC15697 (type strain) as a template showed that the four glycosylhydrolase genes in the HMOs utilization gene cluster, including beta-galactosidase (BLON_RS12085), alpha-L-fucosidase (BLON_RS12095), exo-alpha-sialidase (BLON_RS12155) and beta-hexosaminidase (BLON_RS12185), were conserved in all B. longum subsp. infantis, and the diversities of different strains mainly existed in the four regions (Figure 5c). The number of MFS transporters was different in region A, and a few strains had IS3 and other hypothetical proteins; the difference in region B is the number of ABC transporter permease and ABC transporter substrate-binding proteins. SDZC2M4, FHeNJZ3M1, HeNJZ8M1, BT1, 1888B and IN-07 had inserted genes in region C and the number of SBPs in this region was different; six genes in region D were deleted in JSSZ7M7, FJND2M2, FZJJH13M4, 2, 4 and TPY12-1. Only B. longum subsp. longum JSWX9M5 and CCFM752 possessed the HMOs utilisation gene clusters similar to that in B. longum subsp. infantis (Figure 5c). B. longum subsp. longum JSWX9M5 lacked a beta-galactosidase (BLON_RS12085), and part of SBP compared with B. longum subsp. infantis ATCC15697, B. longum subsp. longum CCFM752 had only one L-fucosidase (BLON_RS12095) gene and a linked LacI family transcriptional regulator. Interestingly, there was a beta-galactosidase gene (BLON_RS12085) in most B. longum subsp. longum strains (except FHuBZX17M2, JSWX9M5 and NCTC13219), but there was no complete gene cluster. In addition, other genes related to HMOs metabolism were found in B. longum subsp. infantis ATCC15697, including two fucosidase clusters, one sialidase cluster, one beta-galactosidase gene (GH42), and two beta-hexosaminidase (GH20) genes as well as gene clusters related to LNB utilisation (Table 2).
The B. longum subsp. longum NCC2705 arabinose utilization gene cluster consisted of six genes (Table 3), among which the genes of BL_RS05095, BL_RS05100 and BL_RS05105 were found in all the strains. Genes araA, araB and araD were present in all B. longum subsp. longum (except CECT7347), but most B. longum subsp. infantis did not have those three genes. B. longum subsp. infantis FGZ17I1M1, FGZ19I1M3, FGZ19I2M3 and FGZ23I1M2 only consisted of araD, B. longum subsp. infantis FHNFQ45M2, and JSSZ7M7 only possessed araB. Additionally, only B. longum subsp. infantis SDZC2M4 and FZJJH13M4 had the same arabinose metabolism gene cluster as that in B. longum subsp. longum.
The growth of B. longum with six carbohydrates as the sole carbon source in vitro was determined. All B. longum could grow with GOS and LNT as the sole carbon source. There was a significant difference in the utilisation of the other four carbohydrates between the two subspecies. All the B. longum subsp. infantis strains were able to grow with fucose as the sole carbon source, while B. longum subsp. longum could not metabolise it (except CCFM752 and JSWX9M5). Additionally, all the B. longum subsp. longum strains could use arabinose; by contrast, only a few B. longum subsp. infantis strains could grow in the presence of arabinose, including FJSYZ1M3, SDZC2M4 and FZJJH13M4. The utilisation of 2’FL and 3’SL by B. longum showed that both HMOs supported the growth of all B. longum subsp. infantis, while the vast majority of B. longum subsp. longum were not able to metabolise HMOs (except CCFM752 and JSWX9M5) (Figure 5d).

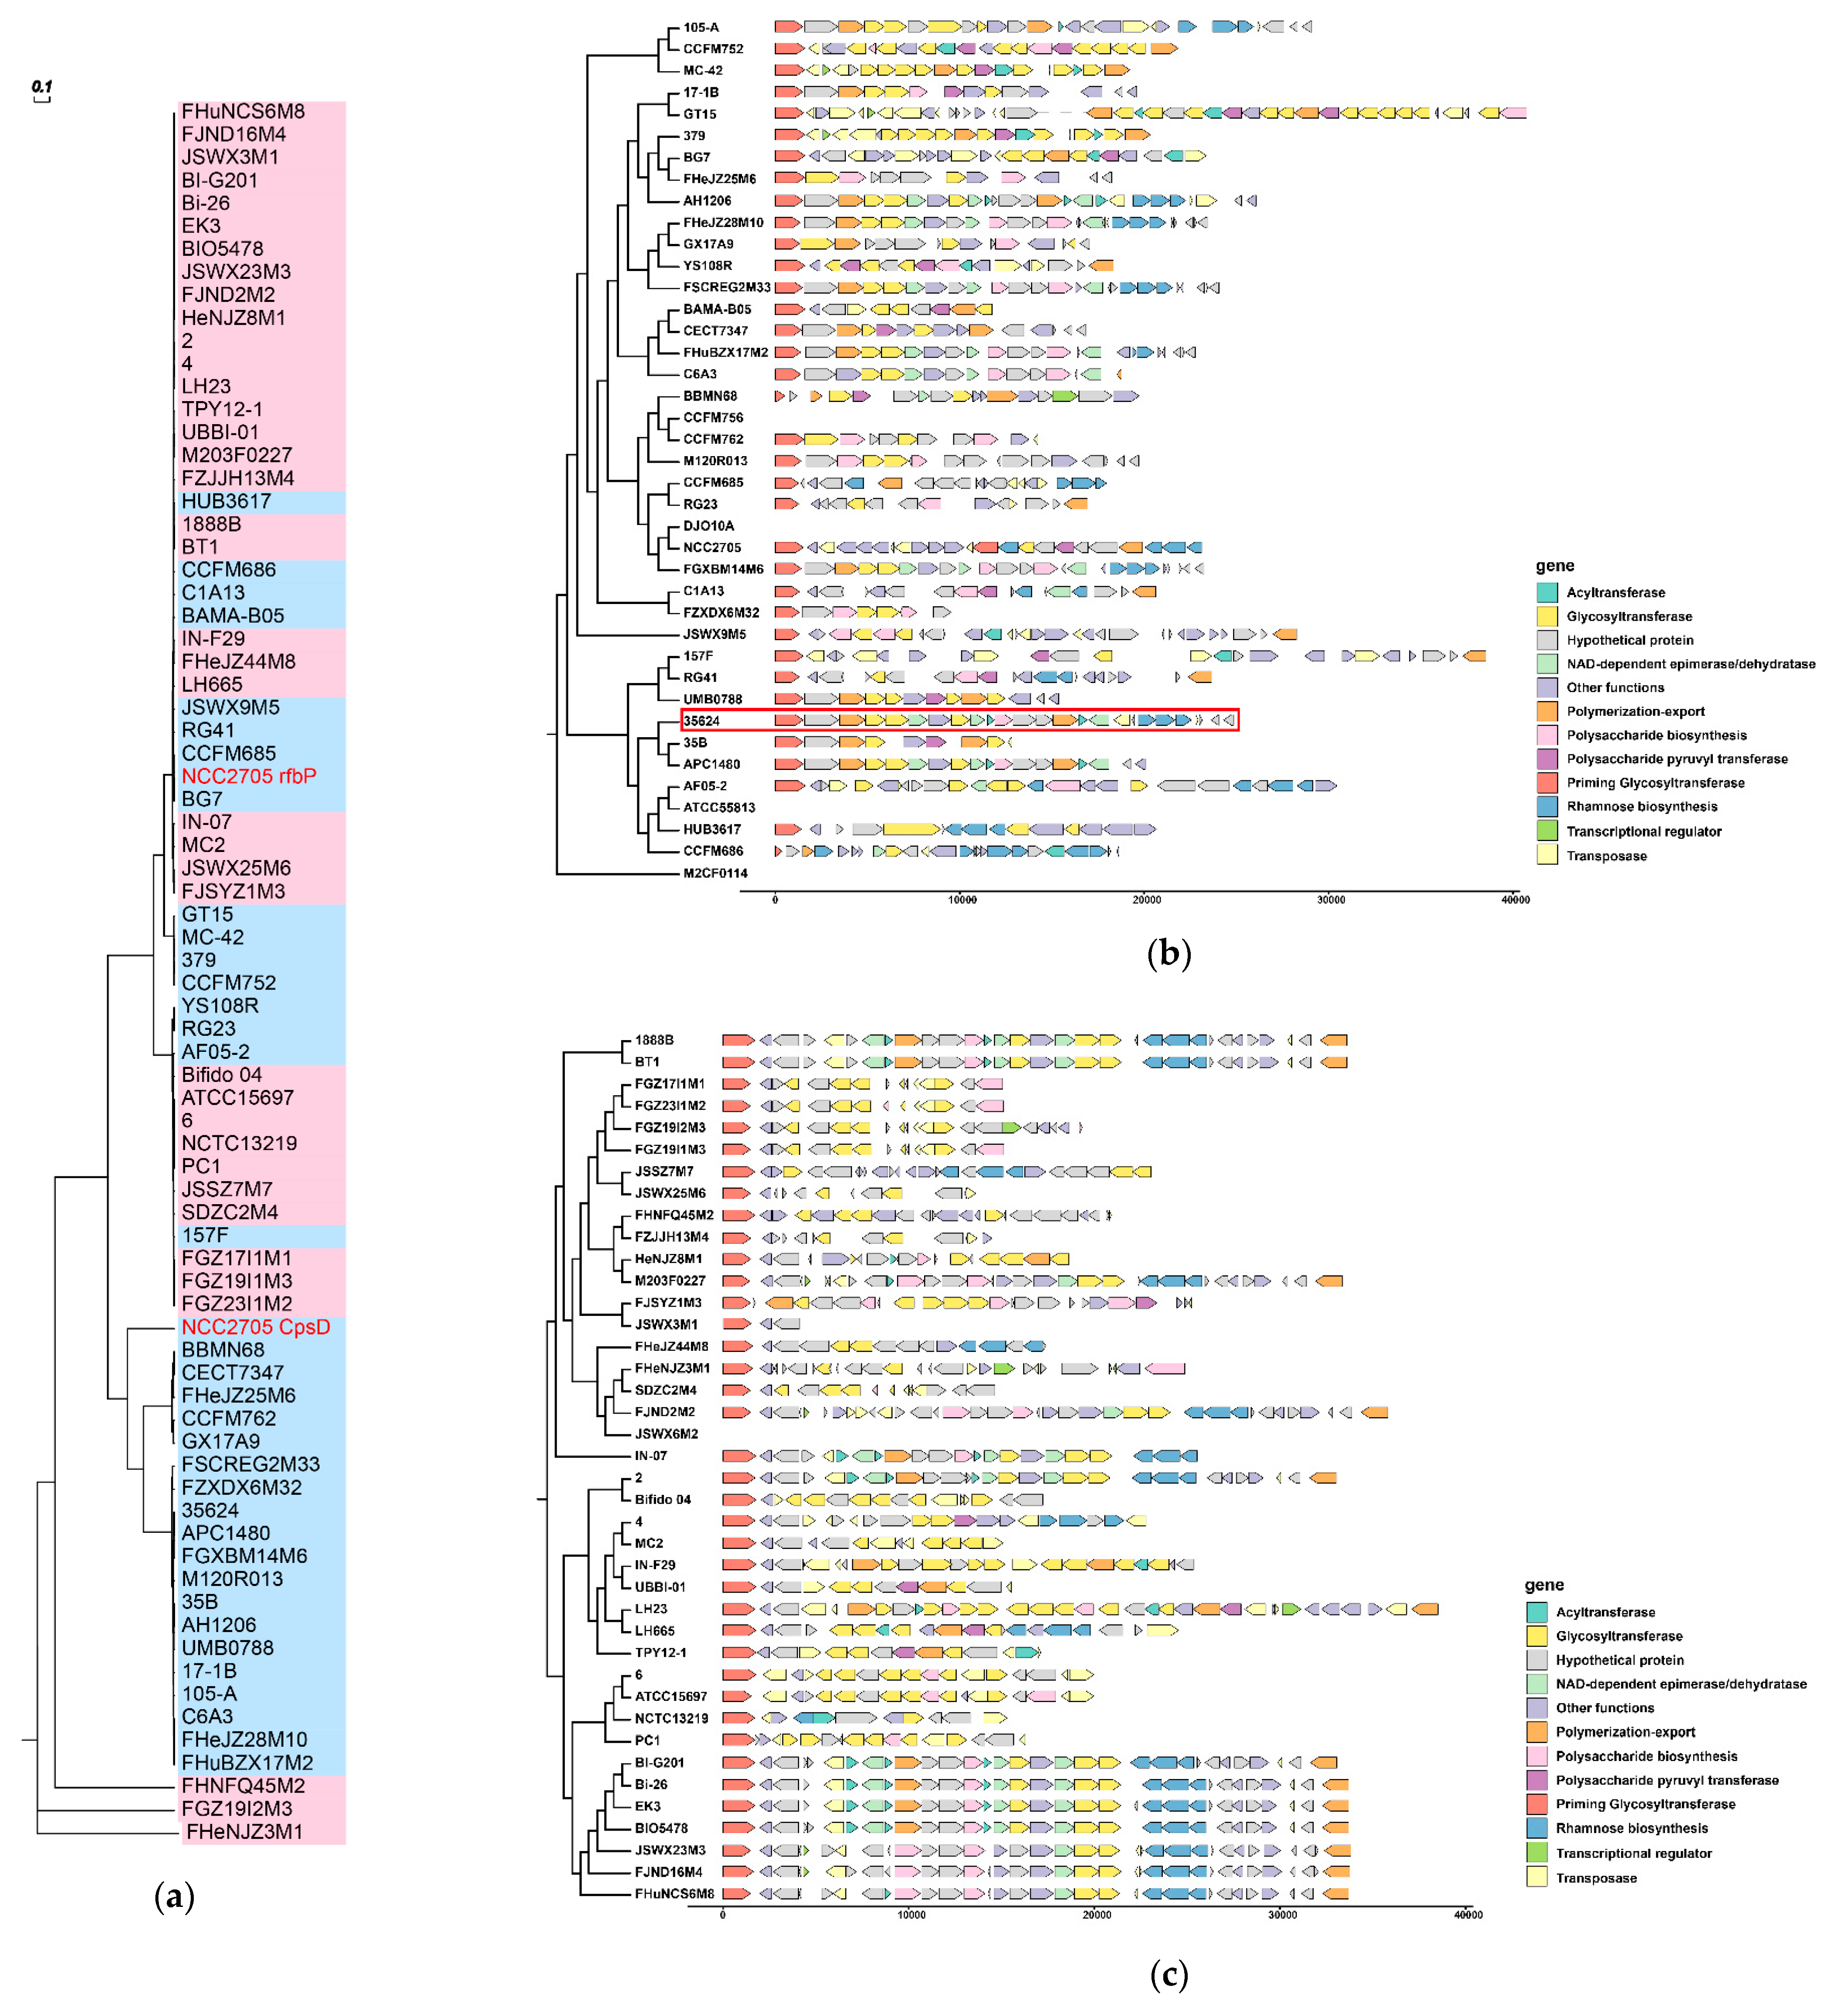
3.6. Predicted EPS Gene Clusters in B. longum subsp. infantis and B. longum subsp. longum

Priming glycosyltransferase (p-GTF) is a key enzyme for synthesizing exopolysaccharides and catalyses the first step in synthesizing many heteropolysaccharides [28]. The genomic analysis of B. longum showed that B. longum subsp. longum ATCC 55813, CCFM756, DJO10A and M2CF0114, as well as B. longum subsp. infantis JSWX6M2, lacked the p-GTF (cpsD or rfbP), and only B. longum subsp. longum NCC2705 had two p-GTFs. The phylogenetic tree based on the genes encoding p-GTF showed that the p-GTF genes of B. longum subsp. infantis FHNFQ45M2, FGZ19I2M3 and FHeNJZ3M1 were different from other strains. The p-GTF gene in other B. longum subsp. infantis strains was rfbP; while there were two types of p-GTF genes in B. longum subsp. longum (Figure 6a).
EPS gene clusters defined in two Bifidobacterium strains were used as templates to perform BLAST comparison with the remaining B. longum, including B. animalis subsp. lactis DSM 10140, containing most of the genes described in the “consensus” LAB-EPS cluster [29] and B. longum subsp. longum 35624 [30]. The results showed that the predicted EPS gene clusters were highly variable in different strains, and only some strains showed similar gene cluster composition. For instance, the EPS gene clusters in B. longum subsp. longum FGXBM14M, FHeJZ28M10, FHuBZX17M2 and FSCREG2M33, as well as B. longum subsp. infantis FHuNCS6M8, FJND16M4 and JSWX23M3, were relatively similar to that in B. longum subsp. longum 35624; all the EPS gene clusters in B. longum subsp. infantis FGZ17I1M1, FGZ19I1M3, FGZ23I1M2 and ATCC15697 contained multiple glycosyltransferases (Figure 6b,c).

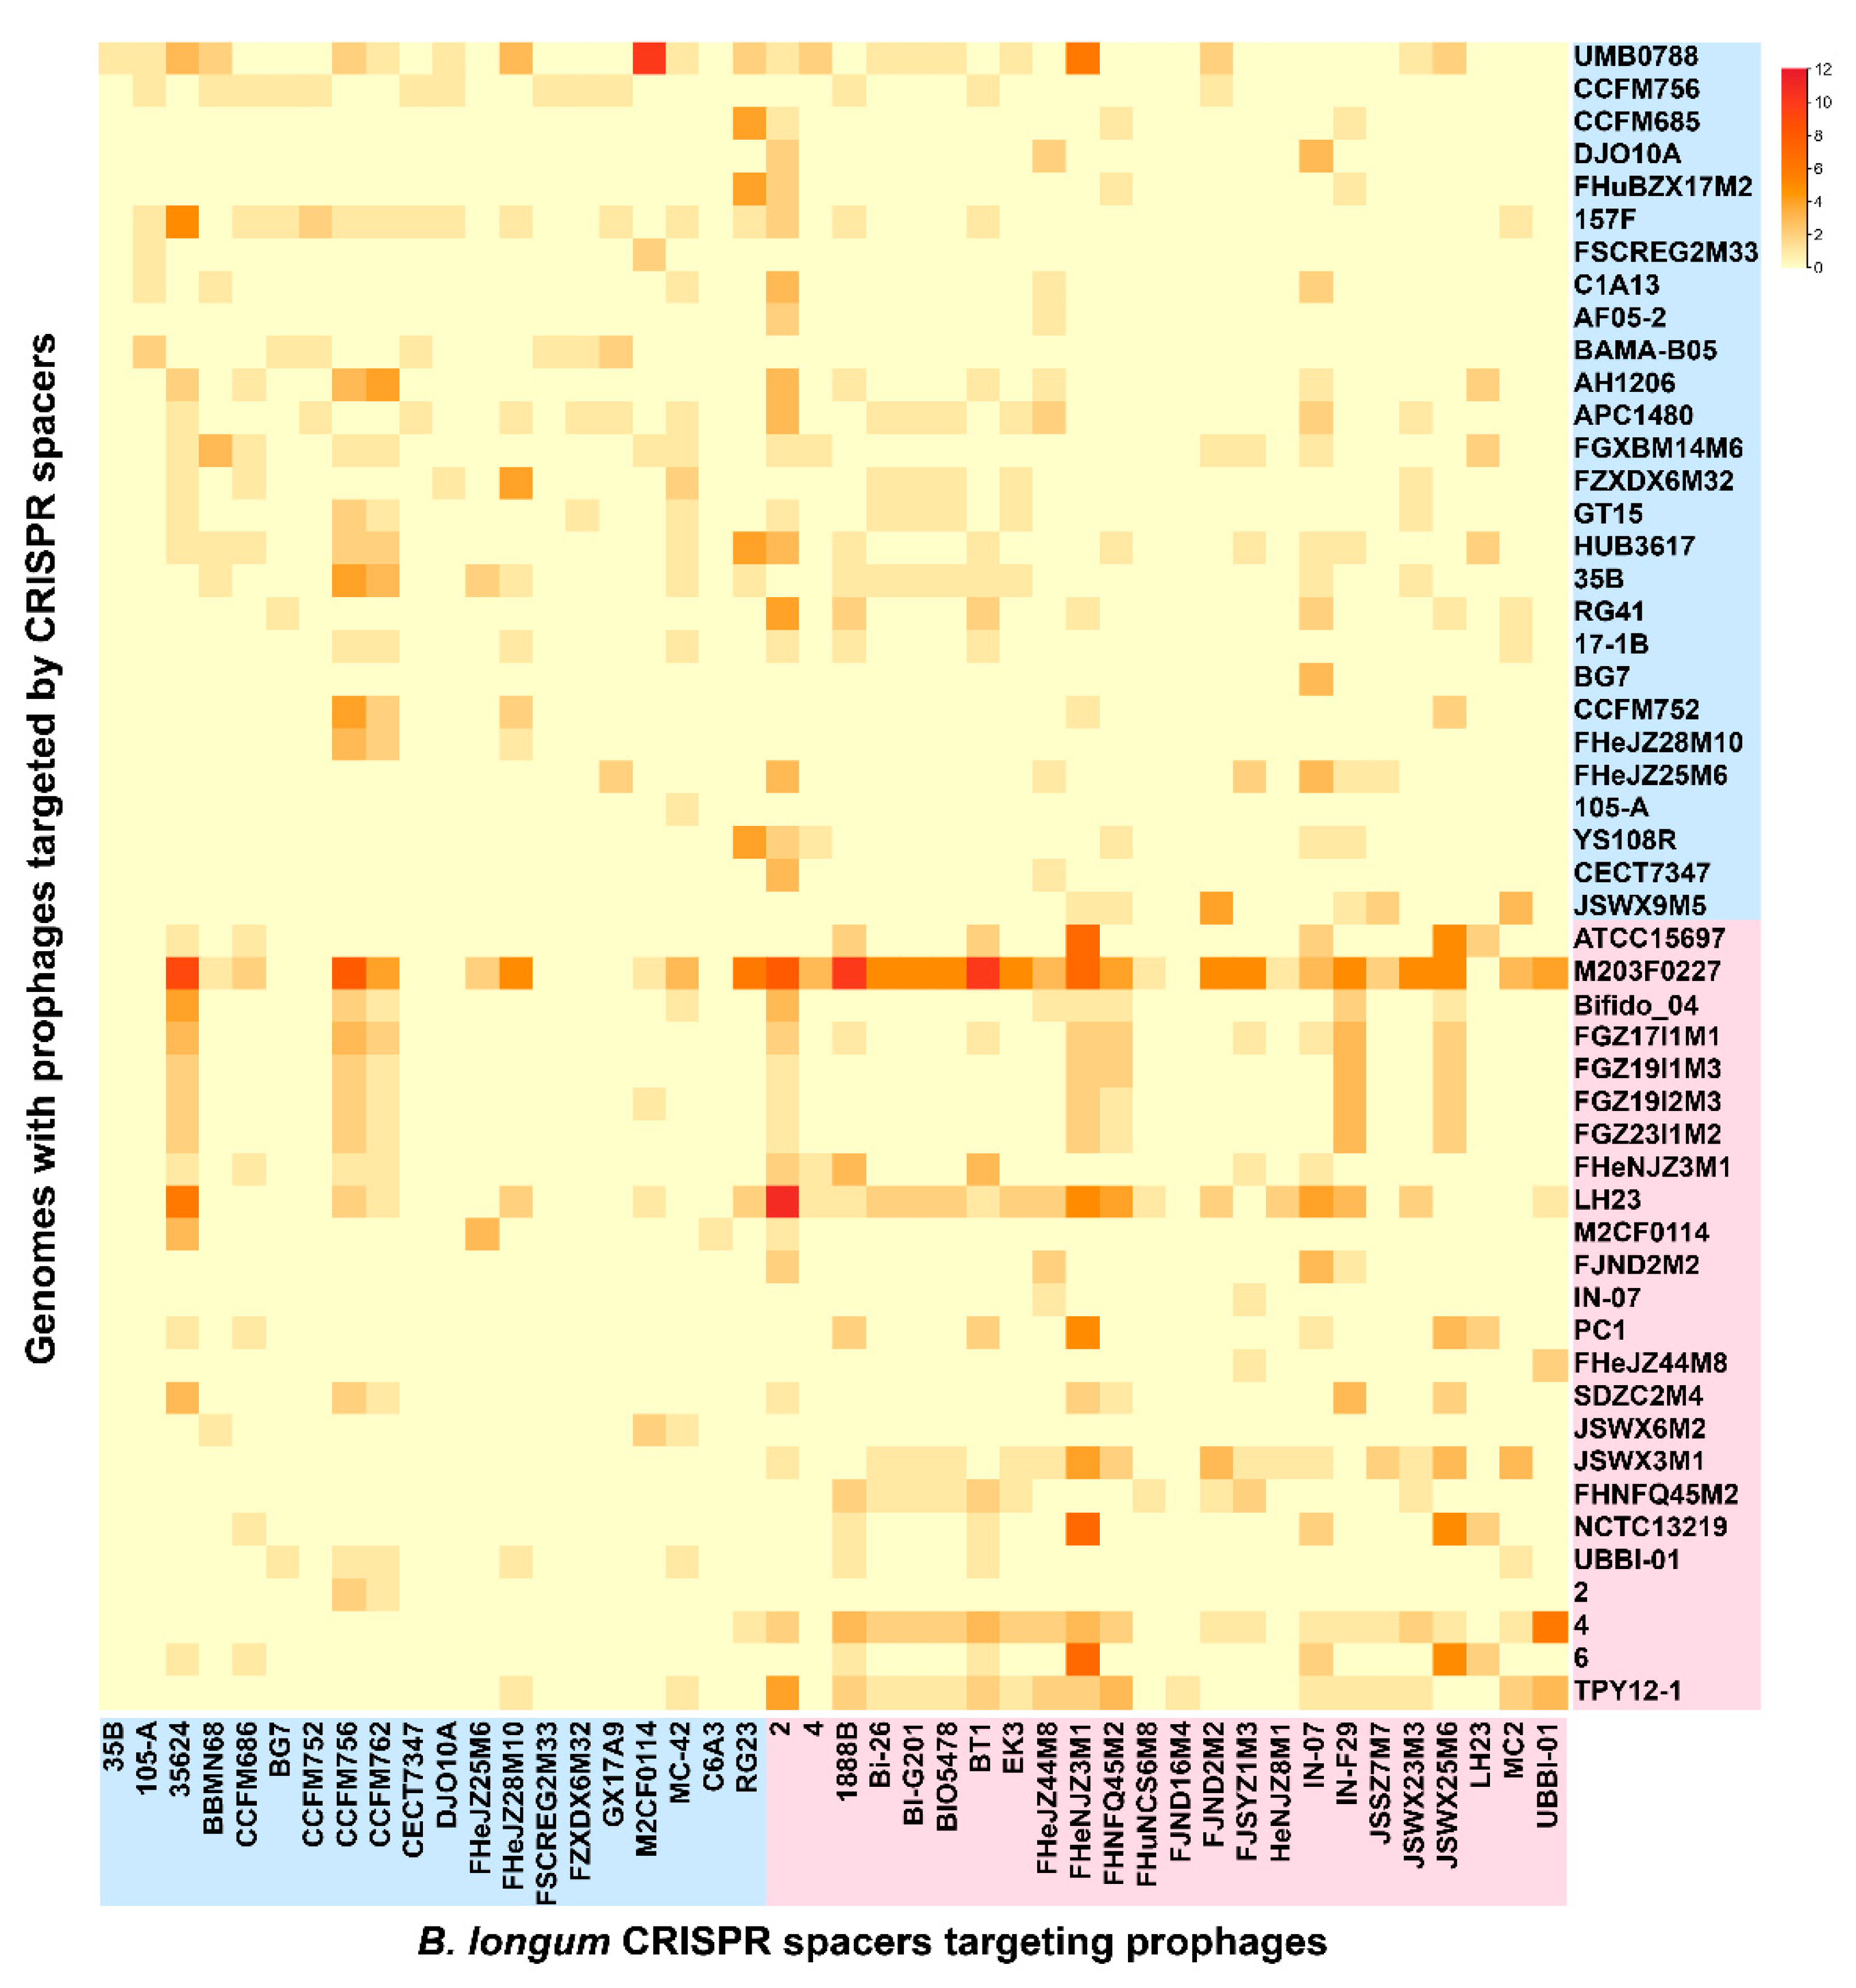
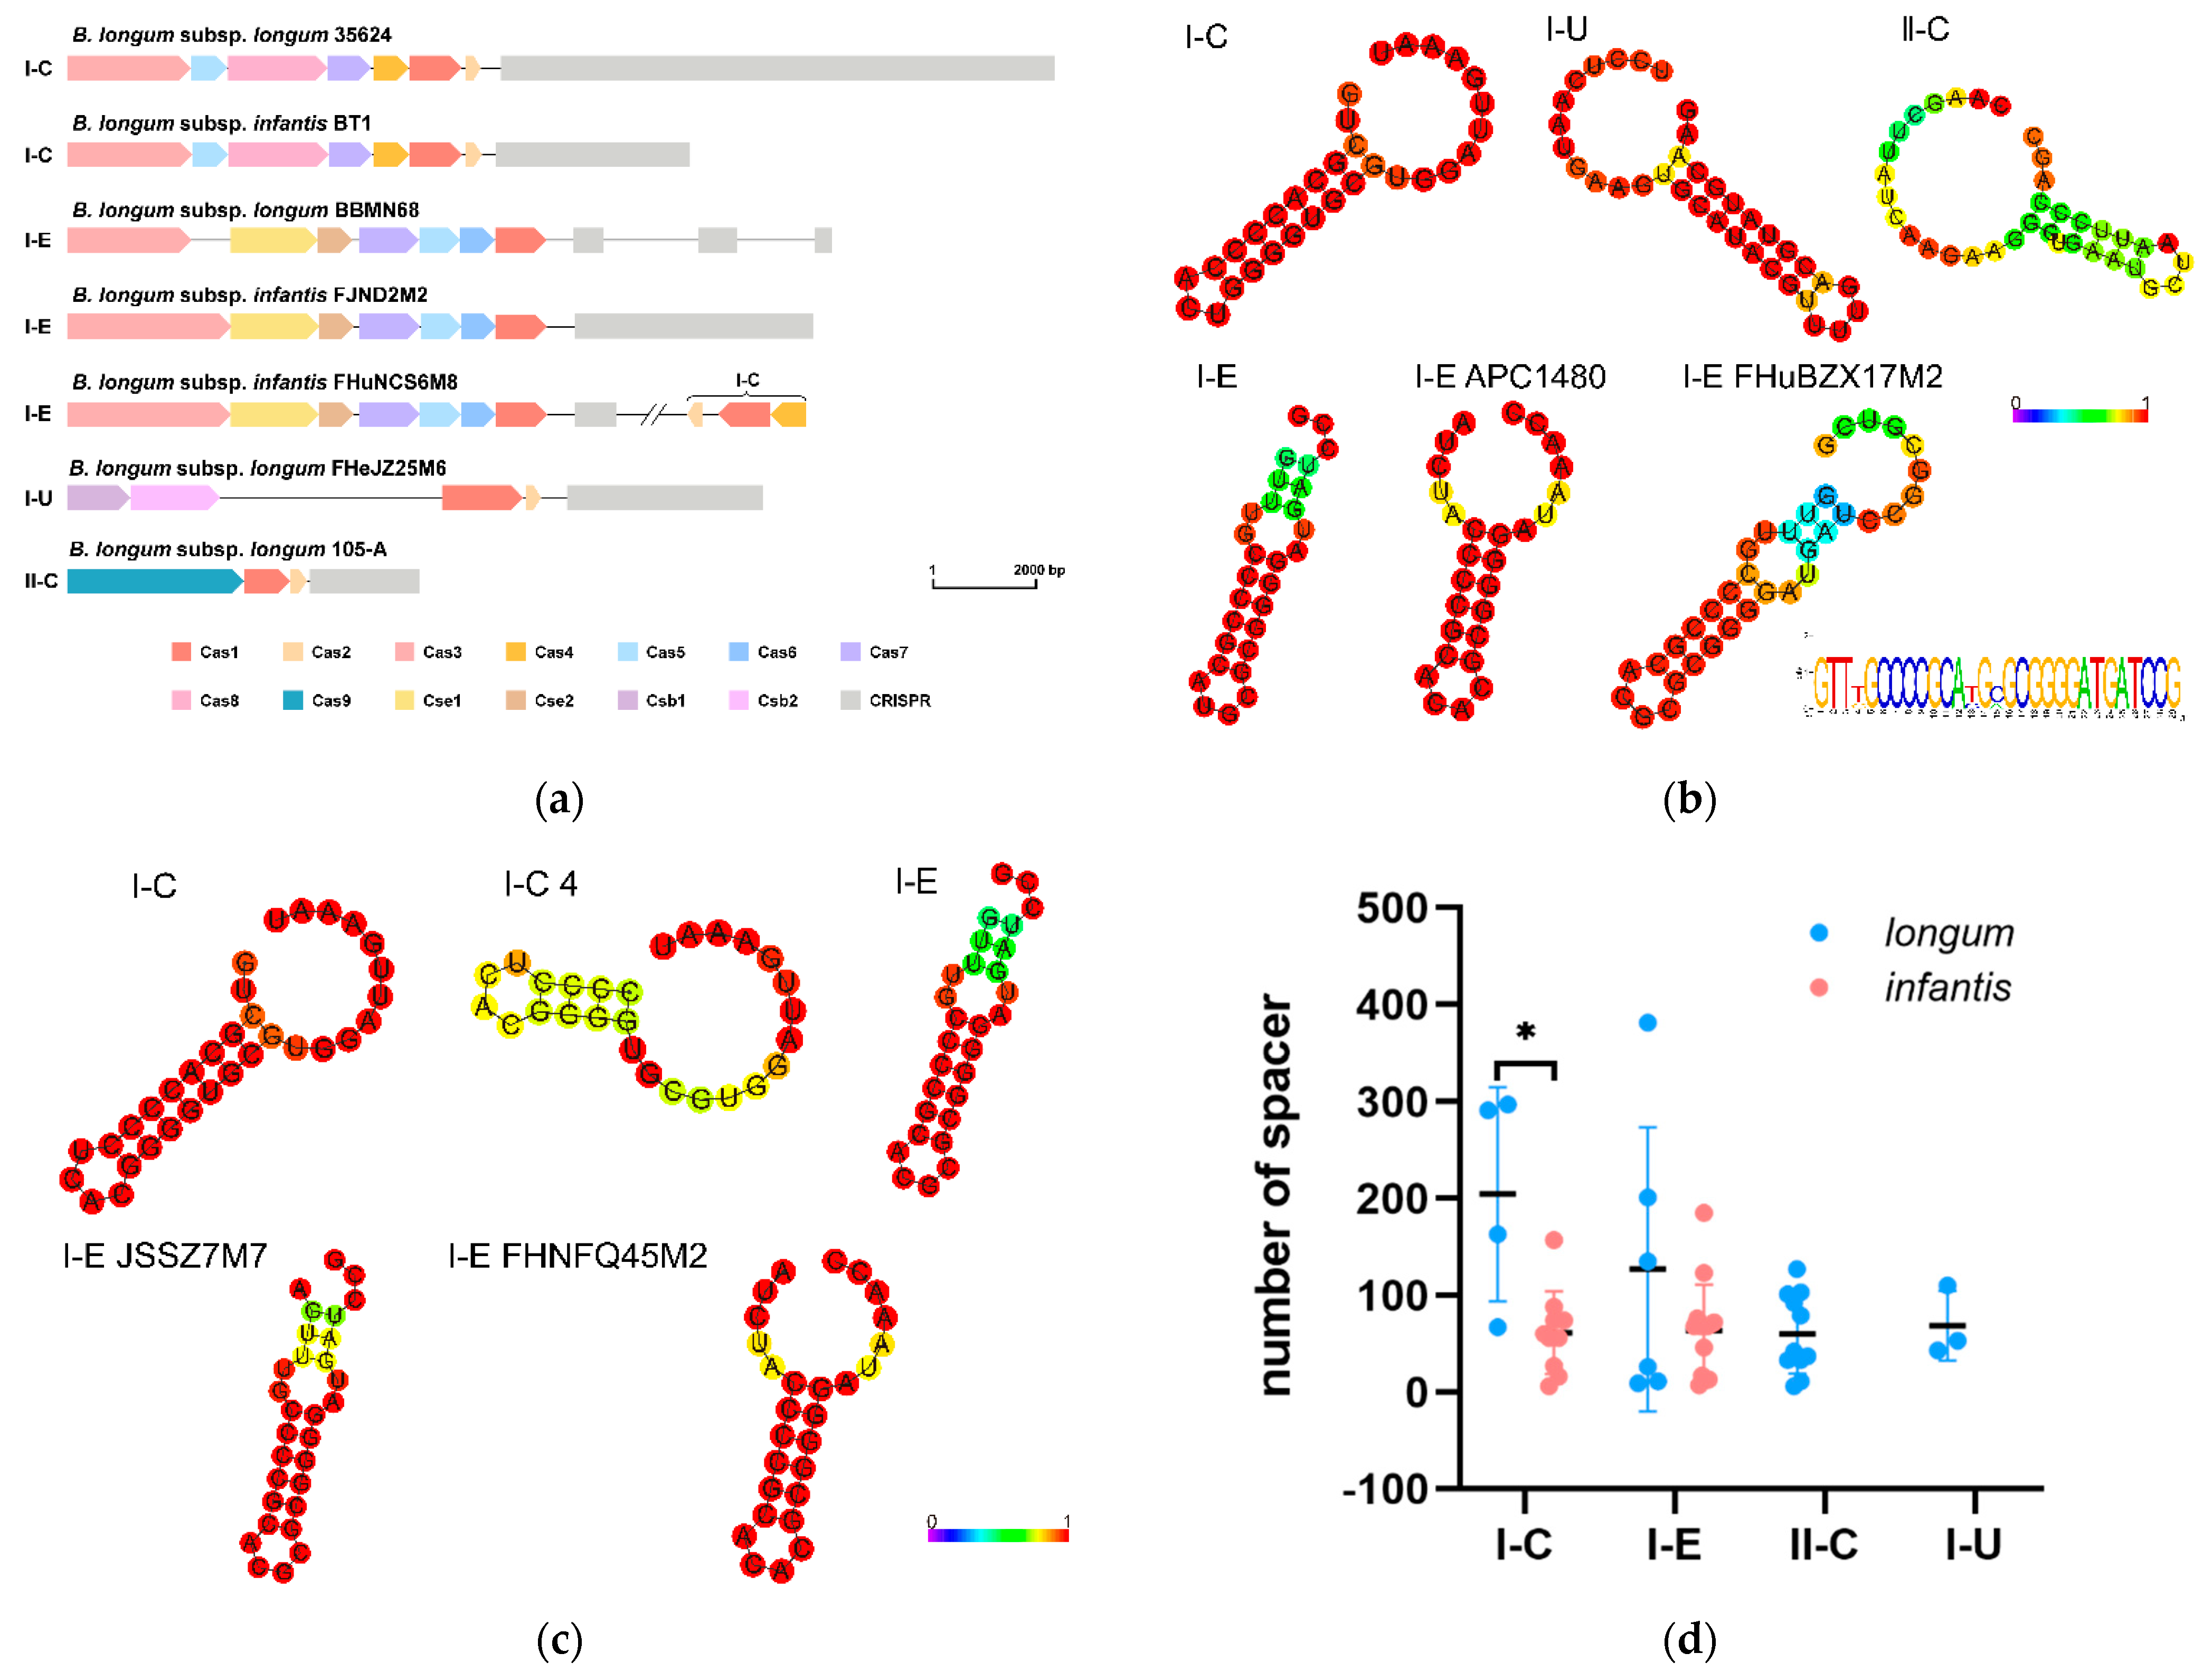
3.7. CRISPR-Cas Systems in B. longum subsp. infantis and B. longum subsp. longum

CRISPR-Cas systems provided adaptive immunity for prokaryotes through DNA-encoded and RNA-mediated nucleic acid targeting mechanisms. B. longum CRISPR-Cas systems were predicted by CRISPRCasFinder, and the existence of cas genes and the repeats sequence Evidence_Level = 4 in CRISPR loci were used as the basis for evaluating the existence of CRISPR-Cas systems in genomes. The results showed that 25 out of 40 B. longum subsp. longum strains had a CRISPR-Cas system, including four subtypes I-C, I-E, I-U and II-C, while 24 out of 40 B. longum subsp. infantis strains had CRISPR-Cas systems with subtypes I-C and I-E (Figure 7a, Table S4). Interestingly, there was another type of I-C Cas protein cluster in some subtypes of I-E in B. longum subsp. infantis, while B. longum subsp. longum with subtype I-E did not possess the two types of Cas proteins.
The Cas1 protein is the best phylogenetic marker for the evolution of CRISPR-Cas systems. Cas1 protein was present in the CRISPR-Cas systems of all the strains except B. longum subsp. longum APC1480. The phylogenetic tree, constructed based on the sequence of Cas1 protein, showed that the Cas1 proteins of different subtypes were located on different branches (Figure 8a). The phylogenetic analysis of subtypes I-C and I-E Cas1 proteins showed that the subtype I-C Cas1 proteins of B. longum subsp. infantis and B. longum subsp. longum were located on two branches, while the subtype I-E Cas1 protein had no obvious difference between the two subspecies (Figure 8a).
A total of 24 CRISPR were predicted in B. longum subsp. longum (except M120R013). The length of type I-C repeats was 32 nucleotides and the length of type II-C and I-U repeats was 36 nucleotides, while the length of type I-E repeats was different (Table S4), and the predicted RNA secondary structure was diverse (Figure 7b). There were three variable nucleotides in the 4th, 13th and 15th positions in the repeat sequence of the four type I-E strains, but there was no significant influence on the secondary structure (Figure 7b). A total of 24 CRISPR were predicted in B. longum subsp. infantis. Except for B. longum subsp. infantis 4, the type I-C repeat sequence was conserved; the repeat sequences of FHNFQ45M2 and JSSZ7M7 were different from other type I-E strains (Table S4, Figure 7c). Phylogenetic analysis was performed on repeat sequences of B. longum, and the results showed that repeat sequences could distinguish the different subtypes of the CRISPR-Cas system in B. longum (Figure 8b); repeat sequences of type I-C CRISPR-Cas system could distinguish B. longum subsp. infantis and B. longum subsp. longum, while repeat sequences of the type I-E CRISPR-Cas system had no obvious diversity between the two subspecies.
CRISPR spacers revealed the immune record of the strain and the challenges overcome during DNA invasion. The number of subtypes I-C spacers in B. longum subsp. infantis was significantly less than that of B. longum subsp. longum (p < 0.05), while there was no significant difference in the number of subtypes I-E spacers between the two subspecies (Figure 7d). Most of the predicted prophages in B. longum were incomplete, and intact prophages only existed in B. longum subsp. longum APC1480 and C1A13 (Table S5). A comparative analysis between the prophages in 80 B. longum and the spacers existing in the 48 CRISPR-Cas systems indicated that 24 B. longum subsp. infantis strains and 20 B. longum subsp. longum strains possessed at least one spacer which targeted a prophage of B. longum (Figure 9). B. longum subsp. longum spacers matched the prophage in 41 genomes, while the spacers of B. longum subsp. infantis matched the prophage in 45 genomes. Among B. longum subsp. longum strains, 35624 possessed the highest number of spacers matching B. longum subsp. longum 157F, B. longum subsp. infantis M203F0227 and B. longum subsp. infantis LH23, while the spacers of B. longum subsp. infantis 2 and FHeNJZ3M1 matched the B. longum prophages by as high as 77 and 67 times, respectively. The prophage of B. longum subsp. infantis M203F0227 was targeted by B. longum spacers the most times, reaching 145 times, and these spacers came from 32 B. longum.

3.8. Bacteriocin Operons in B. longum subsp. infantis and B. longum subsp. longum

BAGEL was used to predict the potential bacteriocin operons in B. longum, and different types of bacteriocin were distinguished according to the bacteriocin classification method proposed in previous studies. There was no bacteriocin operon in most B. longum subsp. longum strains; only two bacteriocin operons were predicted in four genomes. A lantibiotic (BLD_1648) was predicted in DJO10A, CECT7347 and JSWX9M5, and there was a class II bacteriocin Propionicin_SM1 (originally isolated from Propionibacterium jannaschii) in APC1480 (Table 4, Figure 10a). Differently from B. longum subsp. longum, there were 12 bacteriocin operons in B. longum subsp. infantis. All the predicted bacteriocins were class I bacteriocin except for Propionicin_SM1, and seven belonged to class Ia bacteriocin. Only nine B. longum subsp. infantis strains had no bacteriocin operons. The comparative analysis of the distribution of bacteriocin operons and strains clustering revealed that seven B. longum subsp. infantis strains without predicted bacteriocin were located on the same branch of the phylogenetic tree (Figure 10a). Additionally, the gene clusters of four bacteriocins widely distributed in B. longum were further analysed. The three class I bacteriocins were lanthipeptides, the gene cluster consisting of a gene encoding core peptide, genes encoding a lantibiotic modifying enzyme (LanM), a lantibiotic biosynthesis protein (LanC), a transcriptional regulatory protein (LanR) and genes relating to signal transduction (LanK) and lantibiotic mersacidin transporter(LanT). There was one gene encoding core peptide, one transposase and some genes with other functions in class II bacteriocin Propionicin_SM1 (Figure 10b).

4. Discussion

As there are certain differences in phenotypes and genotypes between B. longum subsp. infantis and B. longum subsp. longum, such as carbohydrate utilisation, research on B. longum should be carried out at the subspecies level; the close genetic relationship makes it difficult for the common methods of species identification to accurately distinguish the two subspecies. Therefore, the classification of B. longum subsp. infantis and B. longum subsp. longum is the pre-requisite for comparative genomic analysis. ANI can be used to assess the genetic relationship between subspecies at the genomic level. The results of this study showed that ANI between B. longum subsp. suis and B. longum subsp. longum, and that between B. longum subsp. suis and B. longum subsp. infantis, was higher than that between B. longum subsp. longum and B. longum subsp. infantis, which was consistent with the previous report [8], indicating that the relationship between B. longum subsp. infantis and B. longum subsp. longum was relatively distant, and their genetic determinants were different. In addition, the results also showed that ANI among strains of the same subspecies were all greater than 97%, while ANI between different subspecies were all less than 97%. However, the results obtained by different ANI calculation software are slightly different, which may cause classification errors [31], and ANI combined with phylogenetic analysis to distinguish similar species was more reliable. In this study, through further phylogenetic analysis, B. longum subsp. infantis and B. longum subsp. longum were distinguished clearly, and there were some misclassified strains in the public database. Previous studies also found similar results, in which a phylogenetic tree was constructed based on 43 selected reference genes and confirmed that B. longum subsp. longum JDM301 should be B. longum subsp. suis, while B. longum subsp. infantis 157F and ATCC 55813 should be B. longum subsp. longum [8]. The phylogenetic tree constructed based on the core genes of 33 B. longum strains also showed errors in the classification of B. longum 157F [9]. The comparison of B. longum core genes also proved that strain 35624 was indeed B. longum subsp. longum [30]. B. longum subsp. longum BXY01 and CMCCP0001 were also reclassified as B. longum subsp. suis in similar phylogenetic studies [9,11]. Therefore, the classification of different B. longum subspecies could be achieved via the combination of ANI and phylogenetic analysis.
The comparison of general characteristics of B. longum genomes showed that there were differences in the size of different genomes. The genome of B. longum subsp. infantis was generally larger than that of B. longum subsp. longum, the average GC content of B. longum subsp. infantis was slightly lower than that of B. longum subsp. longum and the number of genes in B. longum subsp. infantis was also more than that in B. longum subsp. longum. The pan-genome of 23 B. longum subsp. longum strains has been analysed previously and was confirmed as open, but the number of strains involved was relatively small [8]. Similarly, other pan-genome analyses of B. longum contained only a small number of B. longum subsp. infantis strains [9,11]. The difference between B. longum subsp. infantis and B. longum subsp. longum may lead to bias analysis of pan-genome features. Therefore, in this study, the pan-genome of 40 B. longum subsp. infantis strains and 40 B. longum subsp. longum strains was analysed and compared. The results showed that the pan-genome of B. longum subsp. infantis and B. longum subsp. longum was nearly closed, which indicated that, with the addition of new strains, new genes would appear in the genomes of the two subspecies, but the probability of new genes appearing is low.
The comparison of whole genome sequence revealed the differences in the intraspecies genetic information of B. longum subsp. longum and B. longum subsp. infantis. The results showed that different genomes of B. longum subsp. infantis had greater diversities than those of B. longum subsp. longum. Strains of both subspecies had variability in carbohydrate transport and metabolism genes and EPS gene clusters. The comparison of homologous gene diversities revealed the interspecific differences between the two subspecies. The number of specific genes in B. longum subsp. infantis was four times than that in B. longum subsp. longum, and it mainly included two larger gene clusters. This may be related to the utilisation of breast milk by B. longum subsp. infantis. The urease gene cluster (BLON_RS00555-BLON_RS00605) was related to the utilisation of urea in breast milk. As the protein concentration in breast milk often makes it difficult to meet the increasing nitrogen demand during the growth of infants, the urea in breast milk becomes another potential nitrogen sources for infants and their gut microbes; bacterial urease (EC5.3.1.5) plays a major role in urea nitrogen recovery (UNS) [6]. Comparative genomic hybridization analysis of 15 B. longum strains has been performed in a previous study, and the results indicated that genes and their activity of urea metabolism were only conserved in B. longum subsp. infantis [32]. The sialic acid metabolism gene cluster (BLON_RS03265-BLON_RS03305) is related to the metabolism of HMOs. Although this gene cluster did not exist in B. longum subsp. longum strains in this study, it was found that ten B. longum subsp. longum strains isolated from younger subjects contained the genes encoding sialidase homologous to that in B. longum subsp. infantis ATCC 15697 via gene enrichment [33]. The existence of specific genes in B. longum subsp. infantis may further explain why B. longum subsp. infantis are more widely present in the intestine of breast-fed infants.
The proportion of annotated gene encoding enzymes involved in complex carbohydrates metabolism were more than 8% in the B. longum genome [9,34]. GTs and GHs are responsible for the synthesis of glycosidic bonds and hydrolysis (or modification), respectively, and are the two major enzymes related to metabolising carbohydrates. In this study, the GH and GT families of B. longum were compared and the results showed that B. longum subsp. infantis and B. longum subsp. longum had significant differences in the composition of GHs, while GTs showed no difference at the subspecies level. The GH27 family contained various enzymes such as α-galactosidase and β-L-arabinopyranosidase, the GH121 family mainly encoded β-L-arabinobiosidase, the GH127 family contained β-L-arabinofuranosidases and the GH43 family mainly included α-L-arabinanase, β-xylosidase, L-arabinofuranosidase and other enzymes related to the metabolism of complex plant-derived polysaccharides. Moreover, the GH29, GH33 and GH95 families were related to HMOs utilization. Therefore, there were gene families related to the utilisation of HMOs in B. longum subsp. infantis, while the number of gene families related to the utilisation of plant-derived polysaccharides in B. longum subsp. longum was greater, which was consistent with the previous reports [8,9].
In earlier studies, it was found that B. longum subsp. infantis can grow well in a medium with HMOs as the sole carbon source, while B. longum subsp. longum could not utilise HMOs or had weak utilisation ability [35,36,37], but the latest research has found that certain B. longum subsp. longum strains could also utilise 2’FL and 3’FL in HMOs [38,39]. Therefore, the metabolism-related genes of the three HMOs, 2’FL, 3’SL and LNT, were analysed and further determined the metabolic ability of B. longum. Both B. longum subsp. longum and B. longum subsp. infantis could metabolise LNT (Galβ 1-3GlcNAc linkage) similar to previous reports [38,40]. LNT was decomposed into LNB and lactose under the action of β-hexosaminidases [6], and a gene encoding β-hexosaminidases and genes related to LNB metabolism were present in both B. longum subsp. infantis and B. longum subsp. longum. Additionally, beta-galactosidases (BLON_RS10470) was also related to LNT metabolism [41], which explains the reason for B. longum subsp. longum metabolising LNT. All B. longum subsp. infantis strains in this study could metabolise the three HMOs assayed. The deletion of some transporters and the insertion of gene fragments in the HMO utilisation gene cluster did not affect the metabolic ability of B. longum subsp. infantis on 2’FL and 3’SL. The presence of partial HMO utilisation gene clusters in B. longum subsp. longum JSWX9M5 and CCFM752 enabled them to metabolise 2’FL and 3’SL. The HMO utilisation gene cluster in B. longum subsp. longum JSWX9M5 was more similar to that in B. longum subsp. infantis ATCC15697, while the HMO utilisation gene cluster in B. longum subsp. longum CCFM752 was consistent with that found in B. longum subsp. longum SC596 [38]. Interestingly, B. longum subsp. longum CCFM752 could also metabolise 3’SL, although there was no presence of sialidase in its genome.
Previous studies have shown that B. longum subsp. infantis could use L-fucose, but B. longum subsp. longum could not [42]; hence, L-arabinose was considered to be a potential marker distinguishing B. longum subsp. longum and B. longum subsp. infantis [7]. It was found that a permease and a fucosidase in B. longum subsp. infantis ATCC15697 seemed to replace the three arabinose metabolism genes (BL_RS05080-BL_RS05090) in B. longum subsp. longum NCC2705 [43]. No fucosidase clusters and fucose metabolism ability were found in other B. longum subsp. longum strains, except for JSWX9M5 and CCFM752. It was found that there was an arabinose metabolism gene cluster in B. longum subsp. infantis SDZC2M4 and FZJJH13M4, and in vitro growth studies also proved that both the two strains could metabolise arabinose. It is worth noting that an arabinose gene cluster was not found in the genome of B. longum subsp. infantis FJSYZ1M3. Those studies showed that the differences in carbohydrate metabolism-related genes determined the different carbohydrate metabolism capabilities of strains, and further revealed that B. longum subsp. infantis preferred to metabolise HMOs, while B. longum subsp. longum had a stronger utilisation capacity for plant-derived carbohydrates. Kujawska et al. analysed the B. longum isolated from infant faecal samples from 1 to 18 months and found that the difference in carbohydrate metabolism between B. longum subsp. infantis and B. longum subsp. longum was compatible with the changes in the infant’s diet, particularly the transition from breast milk to a more diverse diet [44], which could further explain why the niches of B. longum subsp. longum and B. longum subsp. infantis were different.
Previous studies have shown that the exopolysaccharides produced by B. longum were involved in the immune regulation functions [45,46]. Therefore, the EPS gene clusters in B. longum were predicted in this study. There was no p-GTF in a few genomes. Phylogenetic analysis showed that p-GTF in different strains had high homology, which may be due to the existence of conserved domains involved in the interaction with lipid carriers [29]. A previous work used the EPS gene cluster in B. animalis subsp. lactis DSM10140 as a template to predict the EPS gene cluster in B. longum subsp. longum NCC2705 and B. longum subsp. infantis ATCC15697, and found that EPS gene clusters of the two strains were quite different; among which, there were more glycosyltransferases in B. longum subsp. infantis ATCC15697, while genes encoding rhamnose biosynthetic precursors only existed in the EPS gene cluster of B. longum subsp. longum NCC2705 [29]. Altmann et al. focused on the EPS gene cluster and EPS structure of B. longum subsp. longum 35624 and found that only some B. longum subsp. longum strains showed partial similarity with its EPS gene cluster. The EPS gene clusters of Bifidobacterium have great variability, both interspecific and intraspecific, which created uncertainty in the prediction of the EPS gene cluster in B. longum subsp. longum and B. longum subsp. infantis. This study predicted the EPS gene clusters of B. longum subsp. longum and B. longum subsp. infantis and found diversity between different strains, but there was no significant difference between the two subspecies. Because the exopolysaccharide biosynthesis in Bifidobacterium is still unclear, the prediction of its gene cluster is mainly based on sequence homology studies, and the correlation between the B. longum EPS gene cluster and its physicochemical properties cannot be determined [29]. For example, B. longum subsp. longum CCFM756 and M2CF0114 in this study did not have a complete EPS gene cluster, but they were still able to produce EPS [47]. Therefore, the association analysis of B. longum EPS production and its gene cluster still needs further investigation.
CRISPR-Cas systems provide an adaptive genetic resistance mechanism for prokaryotes. In this study, we analysed the existence and diversity of CRISPR-Cas systems in B. longum subsp. infantis and B. longum subsp. longum. Previous research on B. longum CRISPR-Cas systems found that the types of CRISPR-Cas system in B. longum subsp. infantis and B. longum subsp. longum were different, and subtypes II-C and I-U only existed in B. longum subsp. longum [10], which was consistent with our results, although many strains in the study classified as B. longum subsp. infantis previously should have been B. longum subsp. longum. In addition, in the phylogenetic analysis of Cas1 proteins and repeat sequences of type I-C and I-E CRISPR-Cas systems, it was found that Cas1 protein and repeat sequences of subtype I-C B. longum subsp. longum and B. longum subsp. infantis were significantly different, which may be used as a basis for distinguishing B. longum subsp. longum and B. longum subsp. infantis. Previous studies found that a large number of B. longum spacers matched the prophages of other species, indicating that these species lived in the same niches, where co-evolution occurred between the CRISPR-Cas system and the prophage [10]. In this study, spacers in B. longum subsp. infantis targeted the prophages of B. longum subsp. infantis more than B. longum subsp. longum prophages, and B. longum subsp. longum spacers also targeted B. longum subsp. longum prophages more frequently. This seemed to be able to further explain that B. longum subsp. infantis and B. longum subsp. longum niches were similar, but there were certain differences; therefore, B. longum subsp. infantis mainly exists in the intestine of breast-fed infants, while B. longum subsp. longum is widely present in the intestine of humans of different ages.
Bacteriocin is a kind of antimicrobial peptide synthesised by bacterial ribosomes. It usually acts by inducing pore formation in target cells or inhibiting the synthesis of cell walls. It has been considered as a potential substitute for antibiotics in the future [48]. Among the bacteriocins of B. longum identified by BAGEL4, only BLD_1648 was isolated from Bifidobacterium, while other bacteriocins were originally isolated from other species, such as Propionibacterium jensenii, Geobacillus kaustophilus and Clavibacter michiganensis. This may be due to the fact that only a few bifidobacterial bacteriocins have been purified and identified in previous studies. Bacteriocins BLD_1648 from B. longum subsp. longum DJO10A is a lantibiotic with antimicrobial activity against both Gram-positive bacteria and Gram-negative bacteria. It has been deeply characterised, and the amino acid sequence of it has at least been partially elucidated [49,50]. The prediction results of this study showed that bacteriocin operons in B. longum were class I bacteriocin, except for Propionicin_SM1. Previous studies have found that B. bifidum NCFB 1454 could produce bifidocin B, which belongs to class IIa bacteriocin with strong antilisterial activity [50]. However, no bacteriocins of B. longum homologous to bifidocin B were found in this study. In addition, bacteriocins were more widespread in B. longum subsp. infantis compared with B. longum subsp. longum, which might reveal the stronger antimicrobial activity and greater competitive advantage of B. longum subsp. infantis. Although this study found potential bacteriocin operons in B. longum subsp. infantis, relying on in silico screening, the production of its functional bacteriocins needs further experimental verification.

5. Conclusions

In this study, 40 genomes of B. longum subsp. infantis and 40 genomes of B. longum subsp. longum were compared via comparative genomics analyses. The results revealed the differences between the two subspecies mainly existed in carbohydrate utilisation, CRISPR-Cas systems and bacteriocin operons, as well as the diversity of EPS gene clusters. This study expanded the understanding of differences in the genomic characteristics of B. longum subsp. infantis and B. longum subsp. longum, and provided references for the further development and application of B. longum probiotic resources.

Supplementary Materials

The following are available online at https://www.mdpi.com/article/10.3390/microorganisms9081713/s1, Table S1: The information of B. longum subsp. suis, Table S2: Average nucleotide identity (ANI) values of B. longum, Table S3: Specific genes for B. longum subsp. infantis or B. longum subsp. longum, Table S4: CRISPR-Cas systems in B. longum, Table S5: Predicted prophages in B. longum.

Author Contributions

Conceptualization, B.Y., H.Z. and W.C.; methodology, M.L. and X.Z.; software, M.L. and X.Z.; validation, M.L., J.Z. and B.Y.; formal analysis, M.L. and X.Z.; investigation, M.L. and X.Z.; resources, J.Z.; data curation, M.L. and B.Y.; writing—original draft preparation, M.L. and B.Y.; writing—review and editing, R.P.R., C.S. and B.Y.; visualization, M.L.; supervision, J.Z., H.Z. and B.Y.; project administration, J.Z.; funding acquisition, W.C. All authors have read and agreed to the published version of the manuscript.

Funding

This research was funded by the National Natural Science Foundation of China (Nos. 32021005, 31820103010, 31771953), the National First-Class Discipline Program of Food Science and Technology (JUFSTR20180102), the Fundamental Research Funds for the Central Universities (JUSRP52003B), the 111 Project (BP0719028), and the Collaborative Innovation Centre of Food Safety and Quality Control in Jiangsu Province.

Data Availability Statement

All raw sequencing data analysed in this study have been submitted to the NCBI Sequence Read Archive (https://www.ncbi.nlm.nih.gov/sra/) (accessed on 20 July 2021) under the BioProject PRJNA681061, PRJNA730421, PRJNA732070 and PRJNA694834.

Acknowledgments

2′FL, 3′SL, LNT and GOS were kindly shared by FrieslandCampina Ingredients, the Netherlands.

Conflicts of Interest

All authors declared no conflict of interest.

References

  1. Mattarelli, P.; Bonaparte, C.; Pot, B.; Biavati, B. Proposal to reclassify the three biotypes of Bifidobacterium longum as three subspecies: Bifidobacterium longum subsp. longum subsp. nov., Bifidobacterium longum subsp. infantis comb. nov. and Bifidobacterium longum subsp. suis comb. nov. Int. J. Syst. Evol. Microbiol. 2008, 58, 767–772. [Google Scholar] [CrossRef] [PubMed] [Green Version]
  2. Matteuzzi, D.; Crociani, F.; Zani, O.; Trovatelli, L.D. Bifidobacterium suis n. sp.: A new species of the genus Bifidobacterium isolated from pig faces. J. Basic Microbiol. 1971, 11, 387–395. [Google Scholar] [CrossRef]
  3. Groeger, D.; O’Mahony, L.; Murphy, E.F.; Bourke, J.F.; Dinan, T.; Kiely, B.; Shanahan, F.; Quigley, E.M. Bifidobacterium infantis 35624 modulates host inflammatory processes beyond the gut. Gut Microbes 2013, 4, 325–339. [Google Scholar] [CrossRef] [Green Version]
  4. Miyauchi, E.; Ogita, T.; Miyamoto, J.; Kawamoto, S.; Morita, H.; Ohno, H.; Suzuki, T.; Tanabe, S. Bifidobacterium longum alleviates dextran sulfate sodium-induced colitis by suppressing il-17a response: Involvement of intestinal epithelial costimulatory molecules. PLoS ONE 2013, 8, e79735. [Google Scholar] [CrossRef] [PubMed] [Green Version]
  5. Barba-Vidal, E.; Castillejos, L.; Colom, P.L.; Urgell, M.R.; Muñoz, J.A.M.; Martín-Orúe, S.M. Evaluation of the probiotic strain Bifidobacterium longum subsp. Infantis CECT 7210 capacities to improve health status and fight digestive pathogens in a piglet model. Front. Microbiol. 2017, 8, 533. [Google Scholar] [CrossRef] [Green Version]
  6. Sela, D.A.; Chapman, J.; Adeuya, A.; Kim, J.; Chen, F.; Whitehead, T.R.; Lapidus, A.; Rokhsar, D.; Lebrilla, C.B.; German, J.B.; et al. The genome sequence of Bifidobacterium longum subsp. infantis reveals adaptations for milk utilization within the infant microbiome. Proc. Natl. Acad. Sci. USA 2008, 105, 18964–18969. [Google Scholar] [CrossRef] [PubMed] [Green Version]
  7. Sakata, S. Unification of Bifidobacterium infantis and Bifidobacterium suis as Bifidobacterium longum. Int. J. Syst. Evol. Microbiol. 2002, 52, 1945–1951. [Google Scholar] [CrossRef] [PubMed]
  8. Chaplin, A.V.; Efimov, B.A.; Smeianov, V.; Kafarskaia, L.I.; Pikina, A.P.; Shkoporov, A. Intraspecies genomic diversity and long-term persistence of Bifidobacterium longum. PLoS ONE 2015, 10, e0135658. [Google Scholar] [CrossRef] [Green Version]
  9. O’Callaghan, A.; Bottacini, F.; Motherway, M.O.; Van Sinderen, D. Pangenome analysis of Bifidobacterium longum and site-directed mutagenesis through by-pass of restriction-modification systems. BMC Genom. 2015, 16, 832. [Google Scholar] [CrossRef] [Green Version]
  10. Hidalgo-Cantabrana, C.; Crawley, A.; Sanchez, B.; Barrangou, R. Characterization and exploitation of CRISPR loci in Bifidobacterium longum. Front. Microbiol. 2017, 8, 1851. [Google Scholar] [CrossRef] [PubMed] [Green Version]
  11. Arboleya, S.; Bottacini, F.; O’Connell-Motherway, M.; Ryan, C.A.; Ross, R.P.; Van Sinderen, D.; Stanton, C. Gene-trait matching across the Bifidobacterium longum pan-genome reveals considerable diversity in carbohydrate catabolism among human infant strains. BMC Genom. 2018, 19, 33. [Google Scholar] [CrossRef]
  12. Jiang, J.; Yang, B.; Ross, R.; Stanton, C.; Zhao, J.; Zhang, H.; Chen, W. Comparative genomics of pediococcus pentosaceus isolated from different niches reveals genetic diversity in carbohydrate metabolism and immune system. Front. Microbiol. 2020, 11, 253. [Google Scholar] [CrossRef]
  13. Richter, M.; Rosselló-Móra, R. Shifting the genomic gold standard for the prokaryotic species definition. Proc. Natl. Acad. Sci. USA 2009, 106, 19126–19131. [Google Scholar] [CrossRef] [PubMed] [Green Version]
  14. Chen, C.; Chen, H.; Zhang, Y.; Thomas, H.R.; Frank, M.H.; He, Y.; Xia, R. TBtools: An integrative toolkit developed for interactive analyses of big biological data. Mol. Plant 2020, 13, 1194–1202. [Google Scholar] [CrossRef] [PubMed]
  15. Chen, F. OrthoMCL-DB: Querying a comprehensive multi-species collection of ortholog groups. Nucleic Acids Res. 2006, 34, D363–D368. [Google Scholar] [CrossRef]
  16. Katoh, K.; Standley, D.M. A simple method to control over-alignment in the MAFFT multiple sequence alignment program. Bioinformatics 2016, 32, 1933–1942. [Google Scholar] [CrossRef]
  17. Subramanian, B.; Gao, S.; Lercher, M.J.; Hu, S.; Chen, W.-H. Evolview v3: A webserver for visualization, annotation, and management of phylogenetic trees. Nucleic Acids Res. 2019, 47, W270–W275. [Google Scholar] [CrossRef] [PubMed]
  18. Zhao, Y.; Wu, J.; Yang, J.; Sun, S.; Xiao, J.; Yu, J. PGAP: Pan-genomes analysis pipeline. Bioinformatics 2012, 28, 416–418. [Google Scholar] [CrossRef] [Green Version]
  19. Alikhan, N.-F.; Petty, N.K.; Ben Zakour, N.L.; Beatson, S.A. BLAST Ring Image Generator (BRIG): Simple prokaryote genome comparisons. BMC Genom. 2011, 12, 402. [Google Scholar] [CrossRef] [Green Version]
  20. Lombard, V.; Ramulu, H.G.; Drula, E.; Coutinho, P.M.; Henrissat, B. The carbohydrate-active enzymes database (CAZy) in 2013. Nucleic Acids Res. 2014, 42, D490–D495. [Google Scholar] [CrossRef] [Green Version]
  21. Couvin, D.; Bernheim, A.; Toffano-Nioche, C.; Touchon, M.; Michalik, J.; Néron, B.; Rocha, E.P.C.; Vergnaud, G.; Gautheret, D.; Pourcel, C. CRISPRCasFinder, an update of CRISRFinder, includes a portable version, enhanced performance and integrates search for cas proteins. Nucleic Acids Res. 2018, 46, W246–W251. [Google Scholar] [CrossRef] [Green Version]
  22. Kumar, S.; Stecher, G.; Li, M.; Knyaz, C.; Tamura, K. MEGA X: Molecular evolutionary genetics analysis across computing platforms. Mol. Biol. Evol. 2018, 35, 1547–1549. [Google Scholar] [CrossRef]
  23. Lorenz, R.; Bernhart, S.H.F.; Zu Siederdissen, C.H.; Tafer, H.; Flamm, C.; Stadler, P.F.; Hofacker, I.L. ViennaRNA Package 2.0. Algorithms Mol. Biol. 2011, 6, 26. [Google Scholar] [CrossRef]
  24. Crooks, G.E.; Hon, G.; Chandonia, J.-M.; Brenner, S.E. WebLogo: A sequence logo generator. Genome Res. 2004, 14, 1188–1190. [Google Scholar] [CrossRef] [Green Version]
  25. Arndt, D.; Grant, J.R.; Marcu, A.; Sajed, T.; Pon, A.; Liang, Y.; Wishart, D.S. PHASTER: A better, faster version of the PHAST phage search tool. Nucleic Acids Res. 2016, 44, W16–W21. [Google Scholar] [CrossRef] [PubMed] [Green Version]
  26. Van Heel, A.J.; De Jong, A.; Song, C.; Viel, J.; Kok, J.; Kuipers, O.P. BAGEL4: A user-friendly web server to thoroughly mine RiPPs and bacteriocins. Nucleic Acids Res. 2018, 46, W278–W281. [Google Scholar] [CrossRef] [PubMed]
  27. Lugli, G.A.; Milani, C.; Turroni, F.; Duranti, S.; Ferrario, C.; Viappiani, A.; Mancabelli, L.; Mangifesta, M.; Taminiau, B.; Delcenserie, V.; et al. Investigation of the evolutionary development of the genus Bifidobacterium by comparative genomics. Appl. Environ. Microbiol. 2014, 80, 6383–6394. [Google Scholar] [CrossRef] [Green Version]
  28. Ruas-Madiedo, P.; Moreno, J.A.; Salazar, N.; Delgado, S.; Mayo, B.; Margolles, A.; Reyes-Gavilán, C.G.D.L. Screening of exopolysaccharide-producing lactobacillus and Bifidobacterium strains isolated from the human intestinal microbiota. Appl. Environ. Microbiol. 2007, 73, 4385–4388. [Google Scholar] [CrossRef] [Green Version]
  29. Hidalgo-Cantabrana, C.; Sánchez, B.; Milani, C.; Ventura, M.; Margolles, A.; Ruas-Madiedo, P. Genomic overview and biological functions of exopolysaccharide biosynthesis in Bifidobacterium spp. Appl. Environ. Microbiol. 2014, 80, 9–18. [Google Scholar] [CrossRef] [PubMed] [Green Version]
  30. Altmann, F.; Kosma, P.; O’Callaghan, A.; Leahy, S.; Bottacini, F.; Molloy, E.; Plattner, S.; Schiavi, E.; Gleinser, M.; Groeger, D.; et al. Genome analysis and characterisation of the exopolysaccharide produced by Bifidobacterium longum subsp. longum 35624™. PLoS ONE 2016, 11, e0162983. [Google Scholar] [CrossRef] [Green Version]
  31. Figueras, M.J.; Beaz-Hidalgo, R.; Hossain, M.J.; Liles, M.R. Taxonomic affiliation of new genomes should be verified using average nucleotide identity and multilocus phylogenetic analysis. Genome Announc. 2014, 2, e00927-14. [Google Scholar] [CrossRef] [Green Version]
  32. LoCascio, R.G.; Desai, P.; Sela, D.A.; Weimer, B.; Mills, D.A. Broad conservation of milk utilization genes in Bifidobacterium longum subsp. infantis as revealed by comparative genomic hybridization. Appl. Environ. Microbiol. 2010, 76, 7373–7381. [Google Scholar] [CrossRef] [Green Version]
  33. Odamaki, T.; Bottacini, F.; Kato, K.; Mitsuyama, E.; Yoshida, K.; Horigome, A.; Xiao, J.-Z.; Van Sinderen, D. Genomic diversity and distribution of Bifidobacterium longum subsp. longum across the human lifespan. Sci. Rep. 2018, 8, 1–12. [Google Scholar] [CrossRef] [PubMed] [Green Version]
  34. Ventura, M.; Canchaya, C.; Tauch, A.; Chandra, G.; Fitzgerald, G.F.; Chater, K.F.; van Sinderen, D. Genomics of actinobacteria: Tracing the evolutionary history of an ancient phylum. Microbiol. Mol. Biol. Rev. 2007, 71, 495–548. [Google Scholar] [CrossRef] [Green Version]
  35. Locascio, R.G.; Niñonuevo, M.R.; Kronewitter, S.R.; Freeman, S.L.; German, J.B.; Lebrilla, C.B.; Mills, D.A. A versatile and scalable strategy for glycoprofiling Bifidobacterial consumption of human milk oligosaccharides. Microb. Biotechnol. 2008, 2, 333–342. [Google Scholar] [CrossRef] [PubMed] [Green Version]
  36. Asakuma, S.; Hatakeyama, E.; Urashima, T.; Yoshida, E.; Katayama, T.; Yamamoto, K.; Kumagai, H.; Ashida, H.; Hirose, J.; Kitaoka, M. Physiology of consumption of human milk oligosaccharides by infant gut-associated Bifidobacteria. J. Biol. Chem. 2011, 286, 34583–34592. [Google Scholar] [CrossRef] [Green Version]
  37. Garrido, D.; Ruiz-Moyano, S.; Lemay, D.; Sela, D.A.; German, J.B.; Mills, D.A. Comparative transcriptomics reveals key differences in the response to milk oligosaccharides of infant gut-associated Bifidobacteria. Sci. Rep. 2015, 5, 13517. [Google Scholar] [CrossRef] [PubMed]
  38. Garrido, D.; Ruiz-Moyano, S.; Kirmiz, N.; Davis, J.C.; Totten, S.M.; Lemay, D.; Ugalde, J.A.; German, J.B.; Lebrilla, C.B.; Mills, D.A. A novel gene cluster allows preferential utilization of fucosylated milk oligosaccharides in Bifidobacterium longum subsp. longum SC596. Sci. Rep. 2016, 6, 35045. [Google Scholar] [CrossRef] [Green Version]
  39. Bunesova, V.; Lacroix, C.; Schwab, C. Fucosyllactose and L-fucose utilization of infant Bifidobacterium longum and Bifidobacterium kashiwanohense. BMC Microbiol. 2016, 16, 248. [Google Scholar] [CrossRef] [Green Version]
  40. Lawley, B.; Centanni, M.; Watanabe, J.; Sims, I.; Carnachan, S.; Broadbent, R.; Lee, P.S.; Wong, K.H.; Tannock, G.W. Tuf gene sequence variation in Bifidobacterium longum subsp. infantis detected in the fecal microbiota of Chinese infants. Appl. Environ. Microbiol. 2018, 84, e00336-18. [Google Scholar] [CrossRef] [Green Version]
  41. Yoshida, E.; Sakurama, H.; Kiyohara, M.; Nakajima, M.; Kitaoka, M.; Ashida, H.; Hirose, J.; Katayama, T.; Yamamoto, K.; Kumagai, H. Bifidobacterium longum subsp. infantis uses two different β-galactosidases for selectively degrading type-1 and type-2 human milk oligosaccharides. Glycobiology 2012, 22, 361–368. [Google Scholar] [CrossRef] [PubMed] [Green Version]
  42. Crociani, F.; Alessandrini, A.; Mucci, M.M.; Biavati, B. Degradation of complex carbohydrates by Bifidobacterium spp. Int. J. Food Microbiol. 1994, 24, 199–210. [Google Scholar] [CrossRef]
  43. Sela, D.A.; Mills, D.A. Nursing our microbiota: Molecular linkages between Bifidobacteria and milk oligosaccharides. Trends Microbiol. 2010, 18, 298–307. [Google Scholar] [CrossRef] [PubMed] [Green Version]
  44. Kujawska, M.; La Rosa, S.L.; Roger, L.C.; Pope, P.B.; Hoyles, L.; McCartney, A.L.; Hall, L.J. Succession of Bifidobacterium longum strains in response to a changing early life nutritional environment reveals dietary substrate adaptations. iScience 2020, 23, 101368. [Google Scholar] [CrossRef]
  45. Schiavi, E.; Gleinser, M.; Molloy, E.; Groeger, D.; Frei, R.; Ferstl, R.; Rodriguez-Perez, N.; Ziegler, M.; Grant, R.; Moriarty, T.F.; et al. The surface-associated exopolysaccharide of Bifidobacterium longum 35624 plays an essential role in dampening host proinflammatory responses and repressing local TH17 responses. Appl. Environ. Microbiol. 2016, 82, 7185–7196. [Google Scholar] [CrossRef] [PubMed] [Green Version]
  46. Yan, S.; Yang, B.; Zhao, J.; Zhao, J.; Stanton, C.; Ross, R.; Zhang, H.; Chen, W. A ropy exopolysaccharide producing strain Bifidobacterium longum subsp. longum YS108R alleviates DSS-induced colitis by maintenance of the mucosal barrier and gut microbiota modulation. Food Funct. 2019, 10, 1595–1608. [Google Scholar] [CrossRef]
  47. Yan, S.; Zhao, G.; Liu, X.; Zhao, J.; Zhang, H.; Chen, W. Production of exopolysaccharide by Bifidobacterium longum isolated from elderly and infant feces and analysis of priming glycosyltransferase genes. RSC Adv. 2017, 7, 31736–31744. [Google Scholar] [CrossRef] [Green Version]
  48. Cotter, P.D.; Ross, R.; Hill, C. Bacteriocins—A viable alternative to antibiotics? Nat. Rev. Genet. 2013, 11, 95–105. [Google Scholar] [CrossRef]
  49. Lee, J.-H.; Li, X.; O’Sullivan, D.J. Transcription analysis of a lantibiotic gene cluster from Bifidobacterium longum DJO10A. Appl. Environ. Microbiol. 2011, 77, 5879–5887. [Google Scholar] [CrossRef] [Green Version]
  50. Martinez, F.C.; Balciunas, E.M.; Converti, A.; Cotter, P.D.; Oliveira, R.P.D.S. Bacteriocin production by Bifidobacterium spp. A review. Biotechnol. Adv. 2013, 31, 482–488. [Google Scholar] [CrossRef]
Figure 1. Heatmap based on average nucleotide identity (ANI) of B. longum. The gradation of colour from blue to white to red represents an increasing ANI value. The blue branch represents B. longum subsp. longum, the red branch represents B. longum subsp. infantis and the green branch represents B. longum subsp. suis.
Microorganisms 09 01713 g001
Figure 2. Phylogenetic tree of B. longum based on orthologous genes. The blue area represents B. longum subsp. longum, the red area represents B. longum subsp. infantis and the green area represents B. longum subsp. suis. The red stars represent the strains previously isolated from human faeces samples in our lab. Bootstrap values are shown on each node.
Microorganisms 09 01713 g002
Figure 3. Pan-genome and core-genome of B. longum subsp. longum and B. longum subsp. infantis: (a) Numbers of pan-genes (blue) and core-genes (red) as a function of the number of genomes; * multiplication, ** exponentiation (b) Comparison of core gene function based on the COG database between B. longum subsp. longum (outside ring) and B. longum subsp. infantis (inside ring).
Microorganisms 09 01713 g003
Figure 4. Comparative analysis of B. longum subsp. longum and B. longum subsp. infantis genomes: Whole genome sequence comparison of B. longum subsp. longum (a) and B. longum subsp. infantis (b). The blank areas in the figure represent genes that existed in the reference genome but not in other genomes. Orthologous genes and unique genes of B. longum subsp. longum (c) and B. longum subsp. infantis (d).
Microorganisms 09 01713 g004
Figure 5. Carbohydrate utilisation genotype and phenotype of B. longum subsp. longum and B. longum subsp. infantis: The distribution and number of GH family genes (a) and GT family genes (b). The number of genes is represented by colour ranging from blue (absent) to red. (c) Predicted HMOs utilisation gene cluster in B. longum. (d) Carbohydrate metabolism capacity of B. longum. The horizontal axis represents the strains tested in this study and the vertical axis represents the six carbohydrates used in this test. Red for positive and black for negative. The blue area represents B. longum subsp. longum and the red area represents B. longum subsp. infantis.
Microorganisms 09 01713 g005aMicroorganisms 09 01713 g005b
Figure 6. Predicted EPS gene clusters in B. longum: (a) Phylogenetic tree of B. longum based on Priming glycosyltransferase. The blue area represents B. longum subsp. longum, the red area represents B. longum subsp. infantis and the red letter highlights two types of p-GTF genes in B. longum subsp. longum NCC2705. Predicted EPS gene clusters in B. longum subsp. longum (b) and B. longum subsp. infantis (c). The red square highlights the EPS gene clusters, which were used as templates to perform BLAST comparison.
Microorganisms 09 01713 g006
Figure 7. The characteristics of B. longum CRISPR: (a) CRISPR loci in B. longum. (b) Predicted RNA secondary structure for repeats of B. longum subsp. longum and repeat sequences shared by four type I-E strains. The height of the letter indicates the frequency of the corresponding base at that position. (c) Predicted RNA secondary structure for repeats of B. longum subsp. infantis. The minimum free energy (MFE) structure was coloured by base-pairing probabilities. (d) Number of B. longum spacers. The significant difference was evaluated by t-test. * p < 0.05.
Microorganisms 09 01713 g007
Figure 8. Phylogenetic tree based on Cas1 proteins (a) and repeat sequences (b). CRISPR-Cas subtypes or subspecies are shown on the right, and each group was marked with colour. The tree was drawn with UPGMA using 1000 bootstrap replicates. Bootstrap values were recorded on the nodes.
Microorganisms 09 01713 g008
Figure 9. CRISPR spacers targeting prophages in B. longum. The vertical axis represented the genomes with prophages targeted by CRISPR spacers. The horizontal axis represents the B. longum CRISPR spacers targeting prophages. The heatmap indicates B. longum CRISPR spacers that match prophages in the B. longum genomes. The number of targeting is represented by colour ranging from yellow (absent) to red. The blue area represents B. longum subsp. longum and the red area represents B. longum subsp. infantis.
Microorganisms 09 01713 g009
Figure 10. Predicted bacteriocins in B. longum: (a) Bacteriocins distribution of B. longum. The horizontal axis represents the genomes which were clustered according to the phylogenetic tree. The vertical axis represents bacteriocins predicted in B. longum. The blue area represents B. longum subsp. longum and the red area represents B. longum subsp. infantis. Red indicates present, while grey indicates absents. (b) Four predicted bacteriocin structures of B. longum.
Microorganisms 09 01713 g010
Table 1. The information of 80 B. longum strains.
StrainGenome Size (Mbp)GC (%)CDS NumberOriginAccession Number
22.6259.402075Human FaecesSAMEA5770183
42.5759.602053Human FaecesSAMEA5770185
62.8359.902405Human FaecesSAMEA5770187
105-A2.2960.101770Human FaecesSAMD00019943
157F2.4160.111929Infant FaecesSAMD00060953
17-1B2.4760.201959Human FaecesSAMN02862993
1888B2.5859.402039Infant FaecesSAMN06621708
356242.2660.001758Human FaecesSAMN04254466
35B2.5160.101967Human FaecesSAMN00829158
3792.3960.201902Human FaecesSAMN04155602
AF05-22.4360.401978Human FaecesSAMN09734186
AH12062.4260.201955Infant FaecesSAMN04576213
APC14802.4859.902017Human FaecesSAMN07958358
ATCC156972.8359.902411Infant FaecesSAMN02598380
ATCC558132.4060.101901Infant FaecesSAMN00001475
BAMA-B052.2759.901800Human FaecesSAMN12569298
BBMN682.2759.901747Human FaecesSAMN02603469
BG72.4660.011926Infant FaecesSAMN03271682
Bi-262.6159.302078Infant FaecesSAMN10380491
Bifido_042.5859.702110Human BloodSAMEA51817918
BI-G2012.5759.302028Human FaecesSAMN14908987
BIO54782.5759.402093Infant FaecesSAMN12856543
BT12.5859.402030Infant FaecesSAMN03271683
C1A132.3159.862000Human FaecesSAMN19128425
C6A32.4060.032037Human FaecesSAMN16976870
CCFM6852.3559.692025Infant FaecesSAMN16976872
CCFM6862.5059.762125Infant FaecesSAMN19128426
CCFM7522.2859.701939Infant FaecesSAMN17575072
CCFM7562.3460.002075Infant FaecesSAMN16976873
CCFM7622.4059.892037Infant FaecesSAMN19128427
CECT73472.3360.001869UnknownSAMEA3146249
DJO10A2.3960.121874UnknownSAMN02603512
EK32.5659.402061Human FaecesSAMN02862995
FGXBM14M62.5260.152262Human FaecesSAMN16976885
FGZ17I1M12.7259.602583Infant FaecesSAMN16976996
FGZ19I1M32.6659.662506Infant FaecesSAMN16976991
FGZ19I2M32.7259.602574Infant FaecesSAMN16976986
FGZ23I1M22.7259.602597Infant FaecesSAMN16976987
FHeJZ25M62.5059.962150Human FaecesSAMN19128429
FHeJZ28M102.3959.992033Human FaecesSAMN19128430
FHeJZ44M82.7259.222551Infant FaecesSAMN16976998
FHeNJZ3M12.7159.702599Infant FaecesSAMN16976982
FHNFQ45M22.8459.572781Infant FaecesSAMN16976993
FHuBZX17M22.4360.142122Human FaecesSAMN19128431
FHuNCS6M82.5559.402332Infant FaecesSAMN16976988
FJND16M42.5659.392390Infant FaecesSAMN16976985
FJND2M22.5459.512296Infant FaecesSAMN16976992
FJSYZ1M32.6359.702441Infant FaecesSAMN16976990
FSCREG2M332.3660.162030Human FaecesSAMN16976909
FZJJH13M42.5759.622336Infant FaecesSAMN19128438
FZXDX6M322.3159.771961Human FaecesSAMN16976921
GT152.3460.001815Human FaecesSAMN03093230
GX17A92.4959.882072Human FaecesSAMN16976922
HeNJZ8M12.6759.552447Infant FaecesSAMN16976984
HUB36172.4659.942175Human FaecesSAMN19128434
IN-072.7560.002189Human FaecesSAMD00047616
IN-F292.6459.902109Human FaecesSAMD00047617
JSSZ7M72.6259.352330Infant FaecesSAMN16976979
JSWX23M32.5659.382311Infant FaecesSAMN19128437
JSWX25M62.6259.552372Infant FaecesSAMN16976983
JSWX3M12.6358.892306Infant FaecesSAMN16976989
JSWX6M22.7259.922569Infant FaecesSAMN16976980
JSWX9M52.5460.042276Infant FaecesSAMN19128439
LH232.7659.602293Infant FaecesSAMEA4838174
LH6652.5959.402087Infant FaecesSAMEA4838176
M120R0132.2060.021897Human FaecesSAMN16976924
M203F02272.7759.612639Infant FaecesSAMN16976997
M2CF01142.3759.772085Human FaecesSAMN19128435
MC22.5659.602011Human FaecesSAMEA5574696
MC-422.2959.801775Infant FaecesSAMN04263942
NCC27052.2660.111769Infant FaecesSAMN02603675
NCTC132192.6060.002235UnknownSAMEA104318167
PC12.7959.802387Human FaecesSAMEA51825418
RG232.2660.021911Human FaecesSAMN16976925
RG412.4960.252147Human FaecesSAMN19128436
SDZC2M42.7359.642586Infant FaecesSAMN16976981
TPY12-12.6459.702128Infant FaecesSAMN05578879
UBBI-012.7359.402234Fermented FoodSAMN11370925
UMB07882.4560.202012Female Urinary TractSAMN08193649
YS108R2.5260.102021Human FaecesSAMN09355369
Table 2. Predicted HMOs metabolism-related genes of B. longum.
Enzymes/CarbohydratesGene (Cluster)B. longum subsp. longumB. longum subsp. infantis
FucosidaseBLON_RS01290- BLON_RS01310AbsentPresent (except FHeNJZ3M1, SDZC2M4)
FucosidaseBLON_RS02195-BLON_RS02205AbsentPresent (except FHeNJZ3M1, SDZC2M4)
SialidasesBLON_RS03255-BLON_RS03305AbsentPresent
beta-galactosidasesBLON_RS10470PresentPresent
N-acetyl-β-D-hexosaminidasesBLON_RS02365Absent (except JSWX9M5)Present (except LH665)
N-acetyl-β-D-hexosaminidasesBLON_RS03705PresentPresent
LNBBLON_RS11215- BLON_RS11245Present (except M2CF0114)Present
Table 3. Arabinose metabolism gene clusters of B. longum subsp. longum.
Gene IDGene NameProtein IDAnnotation
BL_RS05080araAWP_007051388.1L-arabinose isomerase
BL_RS05085araBWP_007051389.1L-ribulose-5-phosphate 4-epimerase
BL_RS05090araDWP_007051390.1FGGY-family carbohydrate kinase
BL_RS05095-WP_008782880.1LacI family DNA-binding transcriptional regulator
BL_RS05100-WP_011068401.1ribonuclease HII
BL_RS05105lepBWP_010081174.1signal peptidase I
Table 4. Class and sources of predicted bacteriocins in B. longum.
BacteriocinB. longum subsp. longumB. longum subsp. infantisClassSources
Propionicin_SM1126IIPropionibacterium jensenii
Michiganin-A-18Ia, Lanthipeptide BClavibacter michiganensis subsp. michiganensis
Geobacillin_I_like-12Ia, Lanthipeptide AGeobacillus kaustophilus HTA426
BLD_1648319Ia, Lanthipeptide BB. longum subsp. longum DJO10A
Propeptin_2-4If, Lasso_peptideMicrobispora sp. SNA-115
Nai_112-2Ia, Lanthipeptide CActinoplanes sp. NAI112
Variacin-4Ia, Lanthipeptide Bkocuria varians
Planosporicin-4Ia, Lanthipeptide AMicrobispora sp. 107891
Flavucin-3Ia, Lanthipeptide ACorynebacterium lipophiloflavum
Thiopeptide-4Thiopeptide-
LAPs-5Id, LAPs-
Sactipeptides-3Ic, Sactipeptides-
Publisher’s Note: MDPI stays neutral with regard to jurisdictional claims in published maps and institutional affiliations.

