Article

A Machine Learning Approach to Study Glycosidase Activities from Bifidobacterium

1
Department of Microbiology and Biochemistry of Dairy Products, Instituto de Productos Lácteos de Asturias (IPLA), Consejo Superior de Investigaciones Científicas (CSIC), Paseo Río Linares S/N, 33300 Villaviciosa, Asturias, Spain
2
Instituto de Investigación Sanitaria del Principado de Asturias (ISPA), 33011 Oviedo, Asturias, Spain
*
Author to whom correspondence should be addressed.
Microorganisms 2021, 9(5), 1034; https://doi.org/10.3390/microorganisms9051034
Submission received: 12 April 2021 / Revised: 30 April 2021 / Accepted: 5 May 2021 / Published: 11 May 2021
(This article belongs to the Special Issue Bifidobacteria: From Molecular Research to Host Interaction)

Abstract

:
This study aimed to recover metagenome-assembled genomes (MAGs) from human fecal samples to characterize the glycosidase profiles of Bifidobacterium species exposed to different prebiotic oligosaccharides (galacto-oligosaccharides, fructo-oligosaccharides and human milk oligosaccharides, HMOs) as well as high-fiber diets. A total of 1806 MAGs were recovered from 487 infant and adult metagenomes. Unsupervised and supervised classification of glycosidases codified in MAGs using machine-learning algorithms allowed establishing characteristic hydrolytic profiles for B. adolescentis, B. bifidum, B. breve, B. longum and B. pseudocatenulatum, yielding classification rates above 90%. Glycosidase families GH5 44, GH32, and GH110 were characteristic of B. bifidum. The presence or absence of GH1, GH2, GH5 and GH20 was characteristic of B. adolescentis, B. breve and B. pseudocatenulatum, while families GH1 and GH30 were relevant in MAGs from B. longum. These characteristic profiles allowed discriminating bifidobacteria regardless of prebiotic exposure. Correlation analysis of glycosidase activities suggests strong associations between glycosidase families comprising HMOs-degrading enzymes, which are often found in MAGs from the same species. Mathematical models here proposed may contribute to a better understanding of the carbohydrate metabolism of some common bifidobacteria species and could be extrapolated to other microorganisms of interest in future studies.

1. Introduction

Bifidobacterium is one of the most abundant genera of Gram-positive anaerobes that compose the human intestinal microbiota, especially in the early stages of life, during which bifidobacteria may comprise up to 90% of infant gut microbiota [1,2]. It has been proposed that bifidobacteria play a key role in human health, both in infancy and later life stages [3]. Breastfeeding provides infants with a wide variety of natural prebiotic structures, called human milk oligosaccharides (HMOs), which comprise the third most abundant solid component of human milk after lactose and lipids [2]. Remarkably, some HMOs structures are selectively fermented by specific bifidobacterial species typically associated with the breastfed infant gut microbiota and thus are suggested to promote their persistence in the infant gut. Some health benefits associated with Bifidobacterium include reducing inflammation, supplementing nutrients through the production of folate and other vitamins, enhancing immune responses to vaccinations, preventing or reducing allergic diseases, and conferring resistance against human pathogens [2,4]. In addition, the probiotic properties of some bifidobacterial strains have been demonstrated and are currently commercialized as probiotic products [5].
Dietary carbohydrates may shape the bifidobacterial pan-genome [3]. Efforts have been made to elucidate glycosidase domains codified in Bifidobacterium genomes involved in the hydrolysis of HMOs and galactooligosaccharide (GOS) [2], one of the main oligosaccharide types widely recognized as prebiotics and which is commonly added to infant formula in combination with fructo-oligosaccharides (FOS) to mimic biological functions of HMOs [6]. However, few studies report the recovery of metagenome-assembled genomes (MAGs) of Bifidobacterium to study the glycolytic activities of each species. In recent works, Asnicar et al. [7] reported the recovery of 48,181 MAGs, including Faecalibacterium prausnitzii or Bifidobacterium animalis, while Pasolli et al. [8] reconstructed 154,723 microbial genomes, including B. adolescentis, B. bifidum, B. breve, B. dentium and B. longum and Faecalibacterium species.
On the other hand, it should be considered that microbiome experiments generate large volumes of intricate data, which are often difficult to interpret. For this purpose, several computational workflows involving advanced mathematical modeling techniques have been developed. In this sense, implementing machine learning models comprising several families of powerful pattern-recognition algorithms has proven to be of fundamental interest in the main areas and challenges in microbiome research. Some examples of machine learning applications in basic microbiome research include identification of changes in brain structure associated with diet-dependent changes in gut microbiome populations to gain a better understanding of the gut–brain–microbiota axis [9], identification of trends and patterns characteristic of microbiota-associated gastrointestinal disorders to help with the diagnosis based on different clinical symptoms and biochemical findings [10], design microbiome-targeted therapies and in silico prediction of drug–microbiome interactions [11]. In addition, more specific applications of mathematical modeling and machine-learning algorithms have been reported in the field of probiotics and metagenomics. Machine learning has been used to optimize probiotic therapeutics in an artificial human gastrointestinal tract [12] and to assist gut microbiome analysis of sequencing data for identifying patients with specific gastrointestinal diseases [13]. Applications to assess the bioactivity of prebiotic carbohydrates have also been reported. Machine learning models were employed to determine the impact of GOS and FOS on microbial taxa in clinical trials [14] and to simulate colonic fermentation and mechanisms of action in silico of novel prebiotic structures in combination with other computational techniques [15].
To our knowledge, no previous attempts have been made to establish specific glycosidase profiles of recovered MAGs from Bifidobacterium species exposed to different types of prebiotic structures. Therefore, this study aimed to develop advanced machine learning models to elucidate complete glycosidase activities encoded in Bifidobacterium MAGs recovered from human samples. Characteristic glycosidase profiles of Bifidobacterium species were compared, determining the influence of HMOs, GOS, FOS and dietary fiber on their metabolic activities.

2. Materials and Methods

2.1. Data Collection and Genome Recovery from Metagenomes

To compare metabolic patterns and glycosidic activities of the most representative Bifidobacterium species, individual genomes were first recovered from human metagenomes. For this purpose, we collected metagenomic sequencing data obtained from two of the most widely known reference repositories: Sequence Read Archive (SRA) from the National Center for Biotechnology Information (NCBI) and MG-RAST metagenomics analysis server. Among all datasets available, two studies reported shotgun metagenomic sequencing of human fecal samples after regular prebiotic consumption or fiber-based dietary interventions [16,17]. The first study comprises 447 paired-end metagenomic sequences from 60 infants (0–8 months of age; 31 females and 29 males) following different diets (breastfed, whole-milk-fed, and infant formula-fed). Infant formulas described were supplemented with different types of prebiotic oligosaccharides: GOS and FOS. In addition, HMOs may play a relevant role in breastfed individuals. These samples were deposited under BioProject identity PRJNA473126, sample accession codes SAMN09259835–SAMN09260236 [16]. On the other hand, the second study consisted of 40 paired-end metagenomic sequences from 39 healthy adults (33 women, 6 men) following two 3 day dietary interventions where they consumed either barley kernel-based bread or white wheat flour bread. These samples were deposited under MG-RAST identity mgp13068, MG-RAST ID of sequences mgm4624578.3–mgm4624657.3 [17].
Sequences had been already quality-filtered, trimmed and decontaminated by the authors. The first step in our data-analysis pipeline involved concatenation of paired-end sequences and metagenome assembly using MEGAHIT v.1.2.9 [18]. Default settings were used for assembly commands with the exception of maximum k-mer size, set at 127, generating a series of k-mers with different length, which are shorter than entire reads (k-21, k-31, k-41, k-51, k-61, k-71, k-81, k-91, k-101, k-111, k-121, k-127). Bowtie2 v.2.3.5.1 [19] was run on MEGAHIT results to map the reads against the assembly. Bam files generated were sorted and indexed. Then, assembled contigs ≥1.5 kilobases were grouped and assigned to individual genomes in the binning step performed using MetaBAT2 v.2.2.15 default options [20]. Quality control of the obtained bins was assessed using CheckM v.1.1.3 lineage-specific workflow, the recommended workflow for assessing the completeness and contamination of genome bins [21]. MAGs showing completeness higher than 50% and contamination lower than 5% were selected according to Asnicar et al. [7]. Finally, taxonomic identification of MAGs was performed following Kraken2 standard workflow [22].
Once individual genomes were assembled and identified, glycosidase functional domains of MAGs were annotated following the “run_dbcan” pipeline developed by Zhang et al. [23], which maps the samples against the carbohydrate-active enzymes database (CAZy, http://www.cazy.org/ last accessed: 1 March 2021). HMMER software for biosequence analysis using profile hidden Markov models (HMMs) [24] was integrated into the standard workflow, allowing functional domain annotation and glycosidase identification based on the Pfam database, a widely used resource for identifying functional domains that occur within proteins and the classification of protein sequences into families [25]. To ensure the quality of glycosidase identification, only glycosidase domains showing coverage values higher than 0.95 were selected for further analysis.

2.2. Machine Learning Modeling to Elucidate Glycosidase Patterns

Glycosidase functional domains identified in MAGs were grouped into CAZy glycosidase families. To compare metabolic profiles of MAGs recovered, glycosidase profiles were expressed as binary data, including presence (value = 1) and absence (value = 0) of glycosidase domains from the same CAZy family in each MAG. According to different criteria, these data were used as input for different machine learning models, powerful pattern-recognition algorithms that allow accurate classification of samples from their biological origin [26,27]. Our machine-learning data analysis strategy involved three main steps: (i) unsupervised distribution of glycosidase profiles of MAGs according to both Bifidobacterium species (B. adolescentis, B. bifidum, B. breve, B. catenulatum, B. dentium, B. longum, B. pseudocatenulatum, B. scardovii) and diet type (breastfed, breastfed + GOS, breastfed + GOS + FOS, infant formula-fed, infant formula-fed + FOS, infant formula-fed + GOS, infant formula-fed + GOS + FOS and whole-milk-fed infants as well as fiber-rich diets in adults), (ii) supervised classification of MAGs to accurately elucidate characteristic glycosidic patterns of the main bifidobacteria identified (B. adolescentis, B. bifidum, B. breve, B. longum, B. pseudocatenulatum), (iii) association study between glycosidase families found in MAGs. It should be noted that B. catenulatum, B. dentium and B. scardovii were not considered for supervised classification in step (ii) due to the low number of MAGs recovered from these species, insufficient to train supervised models.
Concerning the first step, the unsupervised distribution of MAG glycosidic activities was investigated through artificial neural network-based principal component analysis (PCA). This model was developed to reconstruct experimental data (i.e., presence/absence of functional domains from a specific CAZy family) by the conventional PCA method in combination with artificial neural networks (ANNs) [26,28]. ANNs are among the most popular families of machine learning models that allow modeling complex and highly nonlinear processes. These complex algorithms are formed by an input layer (i.e., principal components from PCA), an output layer (i.e., reconstructed glycosidase profiles of each MAG) and several “neurons” or nodes organized in a hidden layer (i.e., 20 neurons in this study), connected through mathematical functions. The activation function, a transformation applied to the input spectra to determine whether the information that the neuron is receiving is relevant or not, was a hyperbolic tangent activation function (tanh). Weight decay value, a regularization technique used to avoid over-fitting based on the multiplication of the sum of squares of ANN weights by a smaller number, was 0.001. ANN-based PCA was computed using the “pcaMethods” R package v1.78.0 [28].
The second data analysis step involves a supervised classification of MAGs to elucidate characteristic glycosidase profiles of several Bifidobacterium species in an accurate and reproducible way. With this aim, three different supervised machine learning models were compared: ANN, random forest (RF) and generalized linear model elastic-net (glmnet). Similar to the first step, ANN was formed by an input layer (i.e., presence/absence of functional domains from a specific CAZy family), an output layer (i.e., Bifidobacterium species) and 5 neurons organized in one hidden layer, where each neuron in a layer was connected with each neuron in the next layer through a weighted connection. The activation function was logistic, and the weight decay value was 0.1. In contrast, RF is based on multiple decision trees (i.e., 500 in this study), outputting the different classes (i.e., bifidobacteria species), and each node is split using the best among a subset of predictors (i.e., presence/absence of functional domains from a specific CAZy family) randomly chosen (i.e., 9 variables tried at each split in this study). Then, RF averages the results from each tree to get a more accurate and stable prediction. The glmnet model involves a linear regression model that could be generalized (i.e., the response variable may follow different distributions than the normal distribution). Regularization methods are used to reduce possible overfitting of generalized linear models and reduce the prediction error variance. Elastic-net regularization is based on two parameters, alpha and lambda. Alpha (comprised between 0 and 1, i.e., 0.4 in this study) is used to optimize the model, and it indicates the combination of two different regularization techniques, L1 and L2. All these methods try to penalize the Beta coefficients (i.e., 0.02 in this case) of the regression for obtaining the important variables. Lambda is the regularization parameter or penalty coefficient and allows adjusting the prediction error. ANN, RF and glmnet models were computed using the nnet v7.3.12, random forest v4.6.14 and glmnet v3.0.2 R packages [29,30,31].
The last data analysis step involved a graphical correlation network between glycosidase families present in MAGs, computed using ccrepe v1.22.0 and qgraph v1.6.5 R packages [32,33].
All mathematical models were computed on R v3.6.2.

3. Results

3.1. Recovery of Metagenome-Assembled Genomes (MAGs)

Characteristic glycosidase profiles of several Bifidobacterium species present in the gastrointestinal tract of both healthy infants and adults were investigated through a survey of MAGs recovered from gut metagenomic datasets. To this end, shotgun metagenomic data have been collected from the main sequence repositories [16,17]. Sequences were assembled into contigs and MAGs, and annotation of glycosidase functional domains and families codified in individual genomes was performed using the CAZy database [23]. A total of 1806 MAGs representatives of 177 species and strains were recovered from 487 metagenomes, comprising 1339 MAGs from 447 metagenomes from 60 infants, as well as 467 MAGs from 40 metagenomes from 39 adults (Supplementary Materials Table S1). Escherichia coli (n = 140), Faecalibacterium prausnitzii (n = 116), and Ruminococcus gnavus (n = 114) showed the highest overall number of MAGs recovered. Asnicar et al. [7] and Pasolli et al. [8] recovered MAGs from F. prausnitzii and R. gnavus showing the relevance of these species in large cohorts of participants. Escherichia, Faecalibacterium and Ruminococcus were also found in infant metagenomes using assembly-free methods [16].
In general, bifidobacterial species were among the most frequently identified MAGs species, including B. longum (n = 70), B. bifidum (n = 39), B. breve (n = 38) and B. pseudocatenulatum (n = 35). However, a low number of MAGs were recovered from other bifidobacteria species, such as B. adolescentis (n = 17), B. dentium (n = 2), B. catenulatum (n = 1) and B. scardovii (n = 1). Previous studies also reported MAG recovery from B. adolescentis, B. bifidum, B. breve, B. dentium and B. longum in fecal metagenomes from human donors following westernized and non-westernized lifestyles [7,8], highlighting the relevance of these species in metagenomes from different individuals (infants and adults) exposed to specific types of diets, including variable prebiotic consumption. Moreover, gene families and metabolic pathways of several species belonging to Bifidobacteriaceae were reported by previous authors in the assembly free analysis of the infant metagenomes [16], in agreement with our assembly results.
Other species and strains showing a high number of MAGs recovered were Collinsella aerofaciens (n = 71), Veillonella parvula (n = 62), Akkermansia muciniphila (n = 59), Lachnospiraceae bacterium strain GAM79 (n = 50) and Ruthenibacterium lactatiformans (n = 46). MAGs from A. muciniphila were also recovered from Pasolli et al. [8] in westernized and non-westernized cohorts in agreement with our results. It has been reported that metabolic pathways of Collinsella, Veillonella parvula and Akkermansia muciniphila played a relevant role in infant microbiota [16], in agreement with the high number of MAGs recovered from these clades.
It should be noted that some MAGs were identified at strain level, including Blautia sp. SC05B48 (n = 38), Ruminococcus sp. JE7A12 (n = 32), Lachnoclostridium sp. YL32 (n = 25), Longibaculum sp. KGMB06250 (n = 25), Caproiciproducens sp. NJN-50 (n = 19), Blautia sp. N6H1-15 (n = 16), Lachnospiraceae bacterium Choco86 (n = 16), Erysipelotrichaceae bacterium GAM147 (n = 15), Streptococcus sp. HSISS3 (n = 11) and Enterococcus sp. HSIEG1 (n = 8). Interestingly, metabolic pathways of Enterobacteriaceae and Lachnospiraceae families as well as Blautia species had been also identified in infant metagenomes using assembly-free methods [16].
Furthermore, up to 11 MAGs could be recovered from Lacticaseibacillus rhamnosus, although few MAGs were obtained from other lactobacilli species. On the other hand, Clostridium bolteae (n = 36) was the most frequent Clostridium species, while a low number of MAGs could be obtained from other genera like Bacillus, Staphylococcus and Streptococcus. Interestingly, Clostridium genes were also identified in the assembly-free analysis of infant metagenomes [16].
Concerning the sample origin of each MAG, most MAGs were recovered from formula-fed infants (n = 638), adults following fiber-rich dietary interventions (n = 467) and infant formula + GOS-fed infants (n = 281). Similarly, most bifidobacteria MAGs were obtained from formula-fed infants (n = 64), infant formula + GOS-fed infants (n = 52) and breastfed infants (n = 31), while only 11 bifidobacteria MAGs could be obtained from adult participants (Supplementary Materials Table S2). Among these samples, most MAGs from B. adolescentis were recovered from adults following fiber-rich dietary interventions (n = 8), while most MAGs from B. longum and B. pseudocatenulatum were recovered from infant formula-fed infants (n = 32 and n = 13, respectively). Similarly, most MAGs from B. bifidum and B. breve were recovered from breastfed (n = 11) and infant formula + GOS-fed infants (n = 16), respectively.
To deepen the metabolic potential of the MAGs species and strains obtained in this study and their variation with prebiotics consumption, glycosidase activities codified in MAGs were annotated, finding up to 80,028 functional domains belonging to 54 CAZy families of interest. These CAZy families were chosen based on their potential ability to metabolize the most common types of prebiotics (α- and β-GOS and FOS commonly added to infant formula), as well as HMOs. It must be considered that these oligosaccharide structures were present in the diet of most individuals considered in this study [16]. Specific glycosidase activities aimed at hydrolyzing these substrates were selected to find characteristic metabolic profiles of the Bifidobacterium genus depending on prebiotic consumption. Moreover, enzymatic profiles of prebiotic-exposed bifidobacterial MAGs were compared to those of bifidobacteria found in infants fed by non-supplemented formulas and adults exposed to high-fiber dietary interventions (and not specific prebiotic structures). Therefore, functional domains from CAZy families CBM32, CBM40, GH1-5, GH16, GH20, GH29, GH30-33, GH35-36, GH39, GH42, GH58-59, GH68, GH95, GH97, GH109-110, GH139, GH141, GH147 and GH151 involving α- and β-galactosidases, β-fructosyltransferases and β- fructofuranosidases, fucosidases, hexosaminidase and sialidases as well as other fiber-degrading activities were selected (Supplementary Materials Table S3). Most metabolic activities reported during the assembly-free functional analysis of infant microbiota were limited to routes related to amino acid synthesis and degradation and vitamin synthesis pathways [16]. In contrast, the present study deepens the characterization of carbohydrate-degrading enzymes present in these species, providing an extensive comparison of CAZy families found in Bifidobacterium species and their ability to metabolize specific prebiotic structures.

3.2. Unsupervised Analysis to Study Glycosidase Distribution in Metagenome-Assembled Genomes (MAGs)

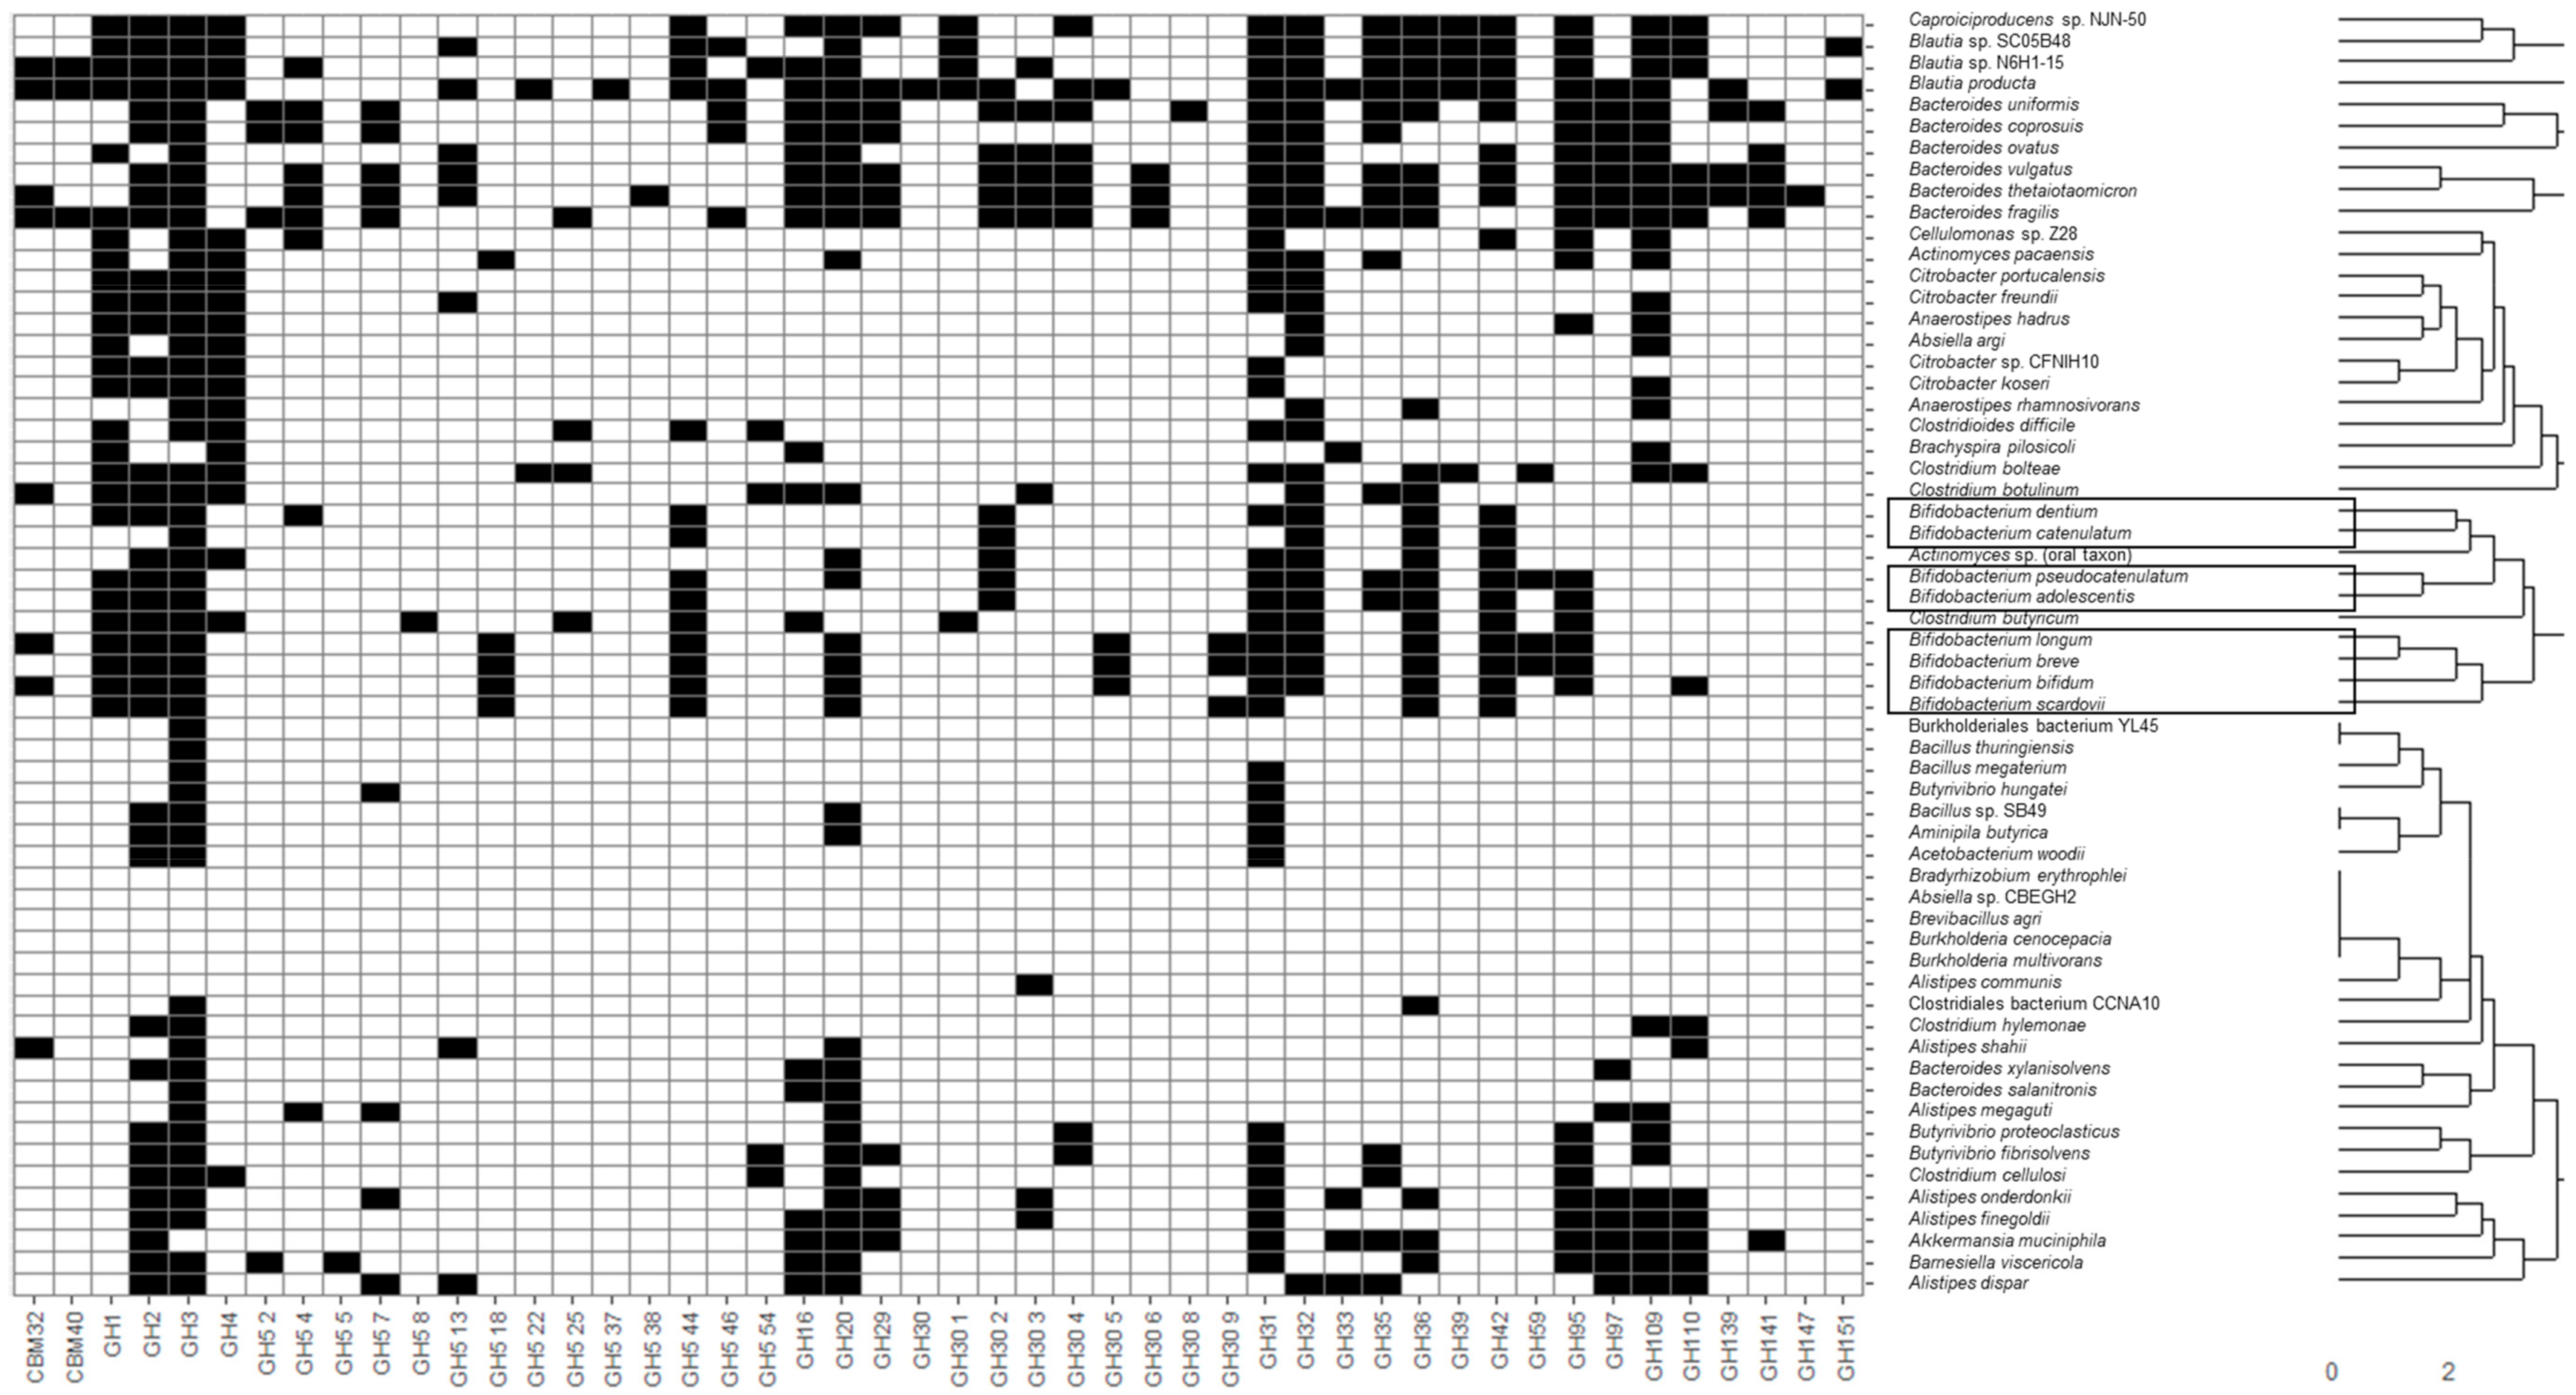
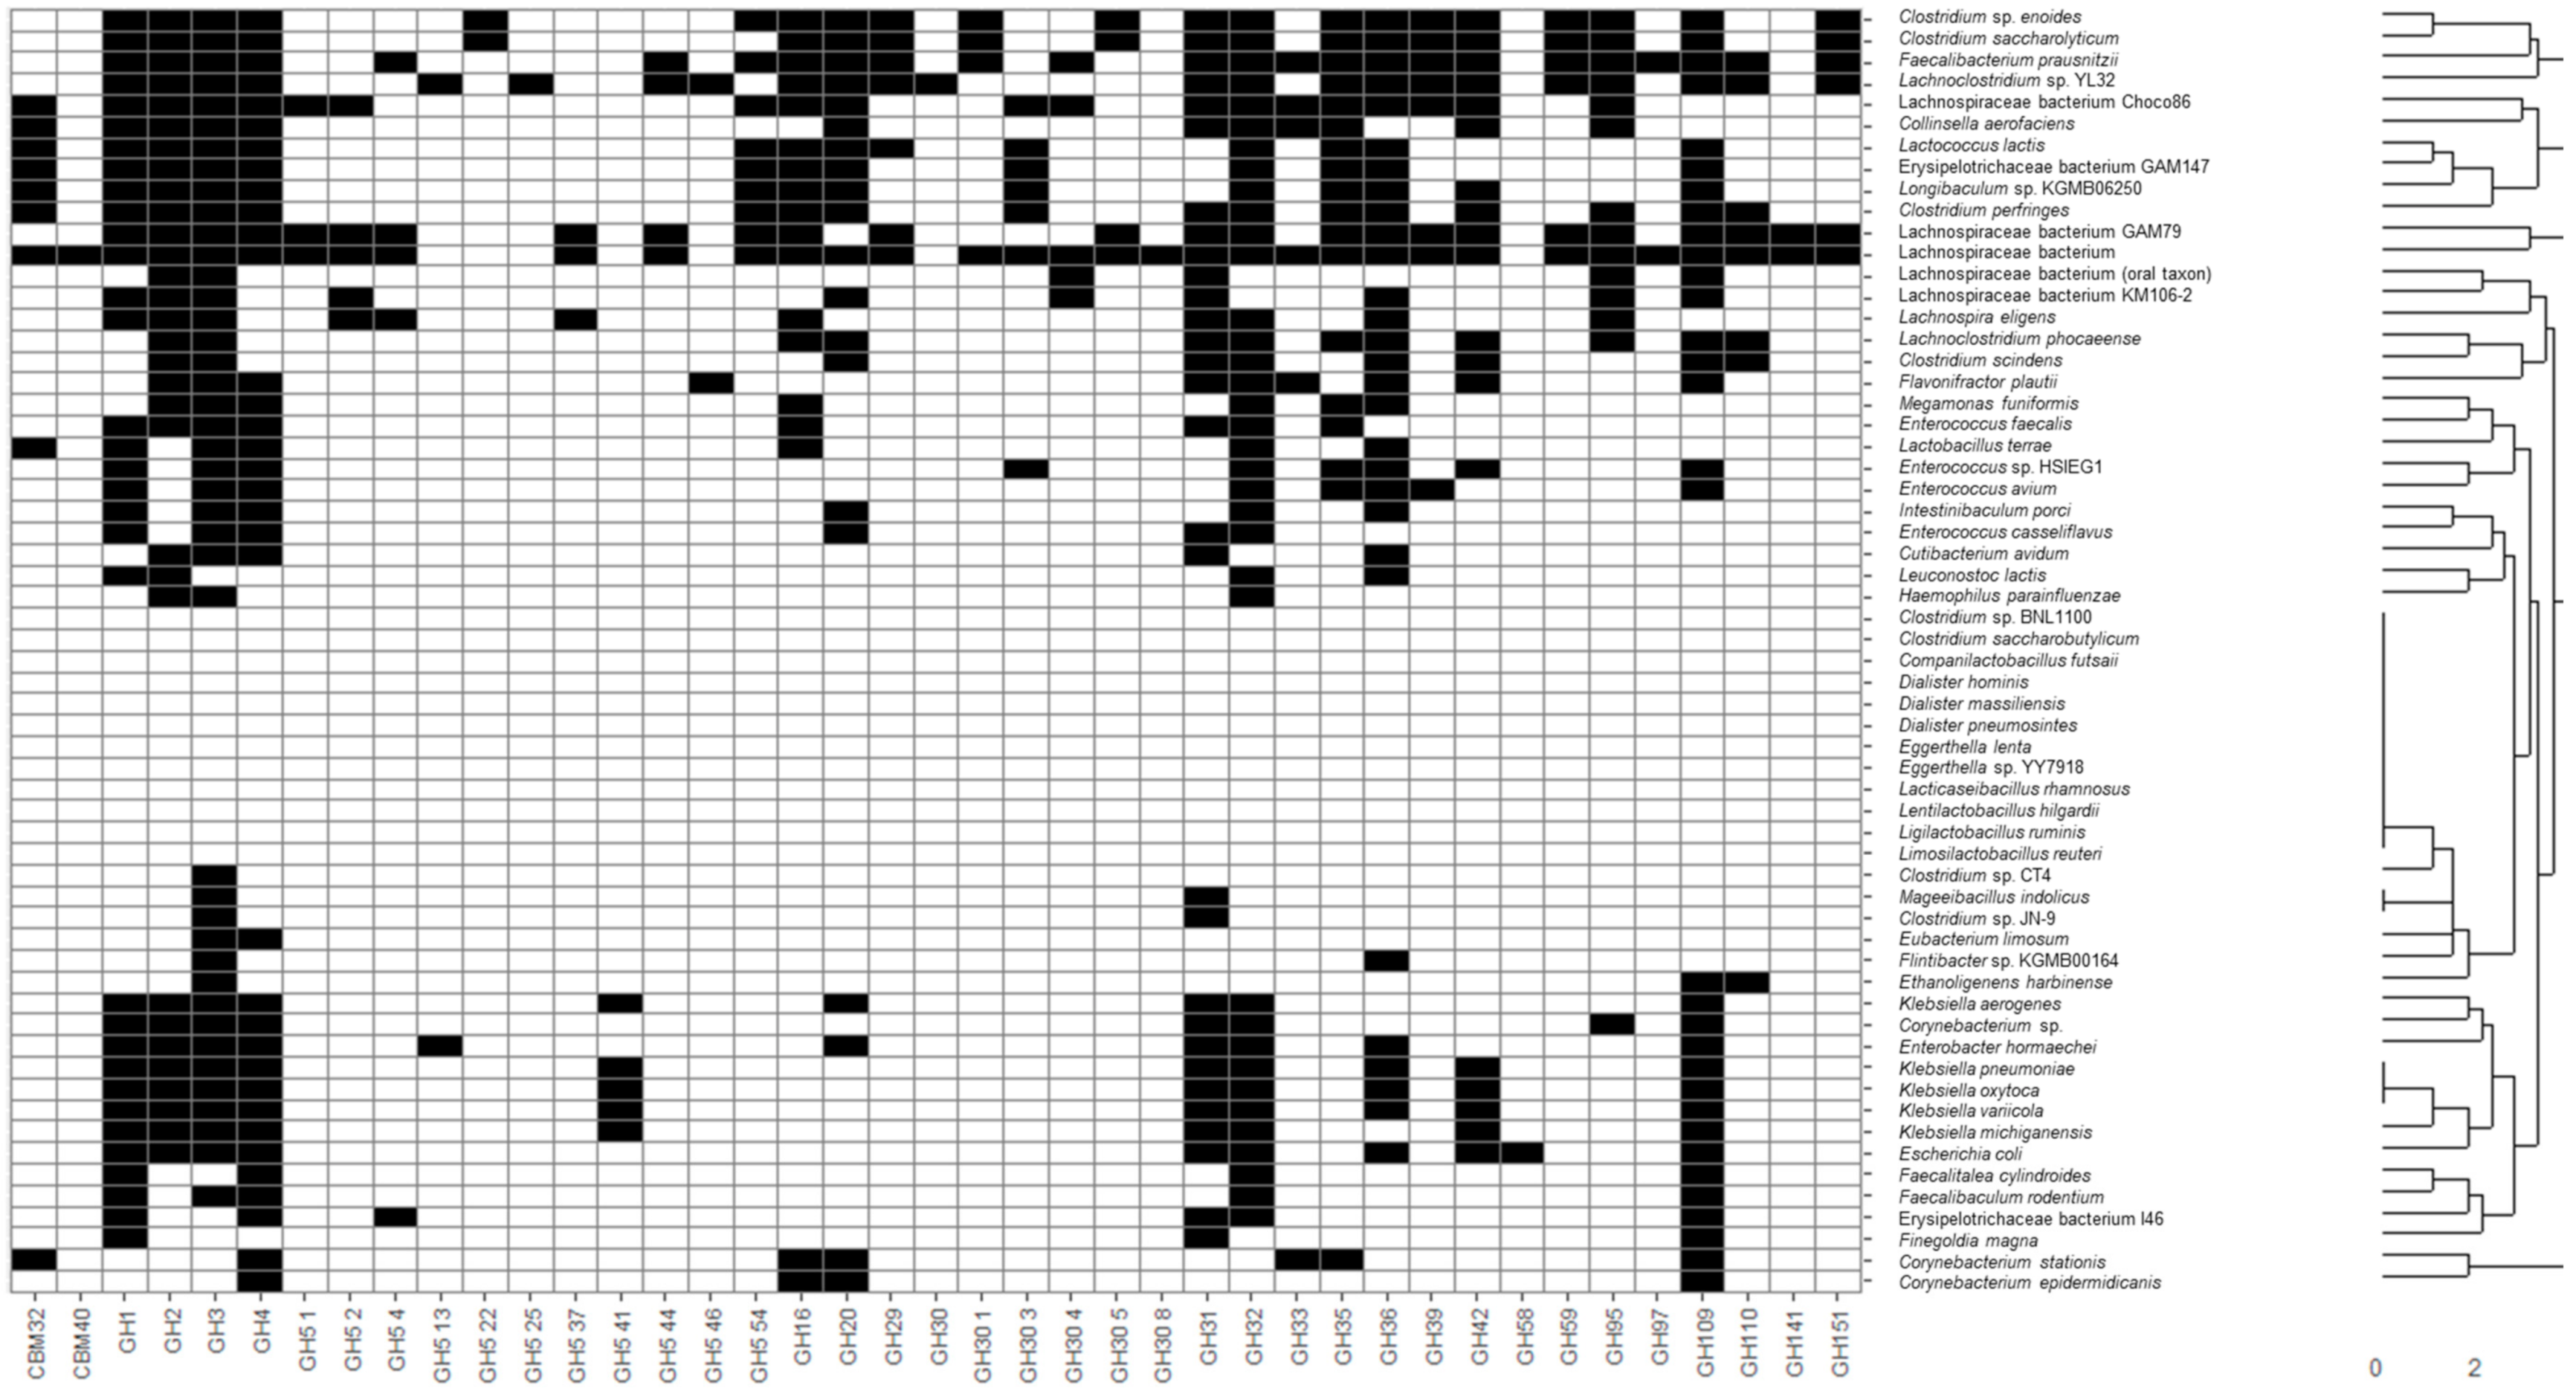
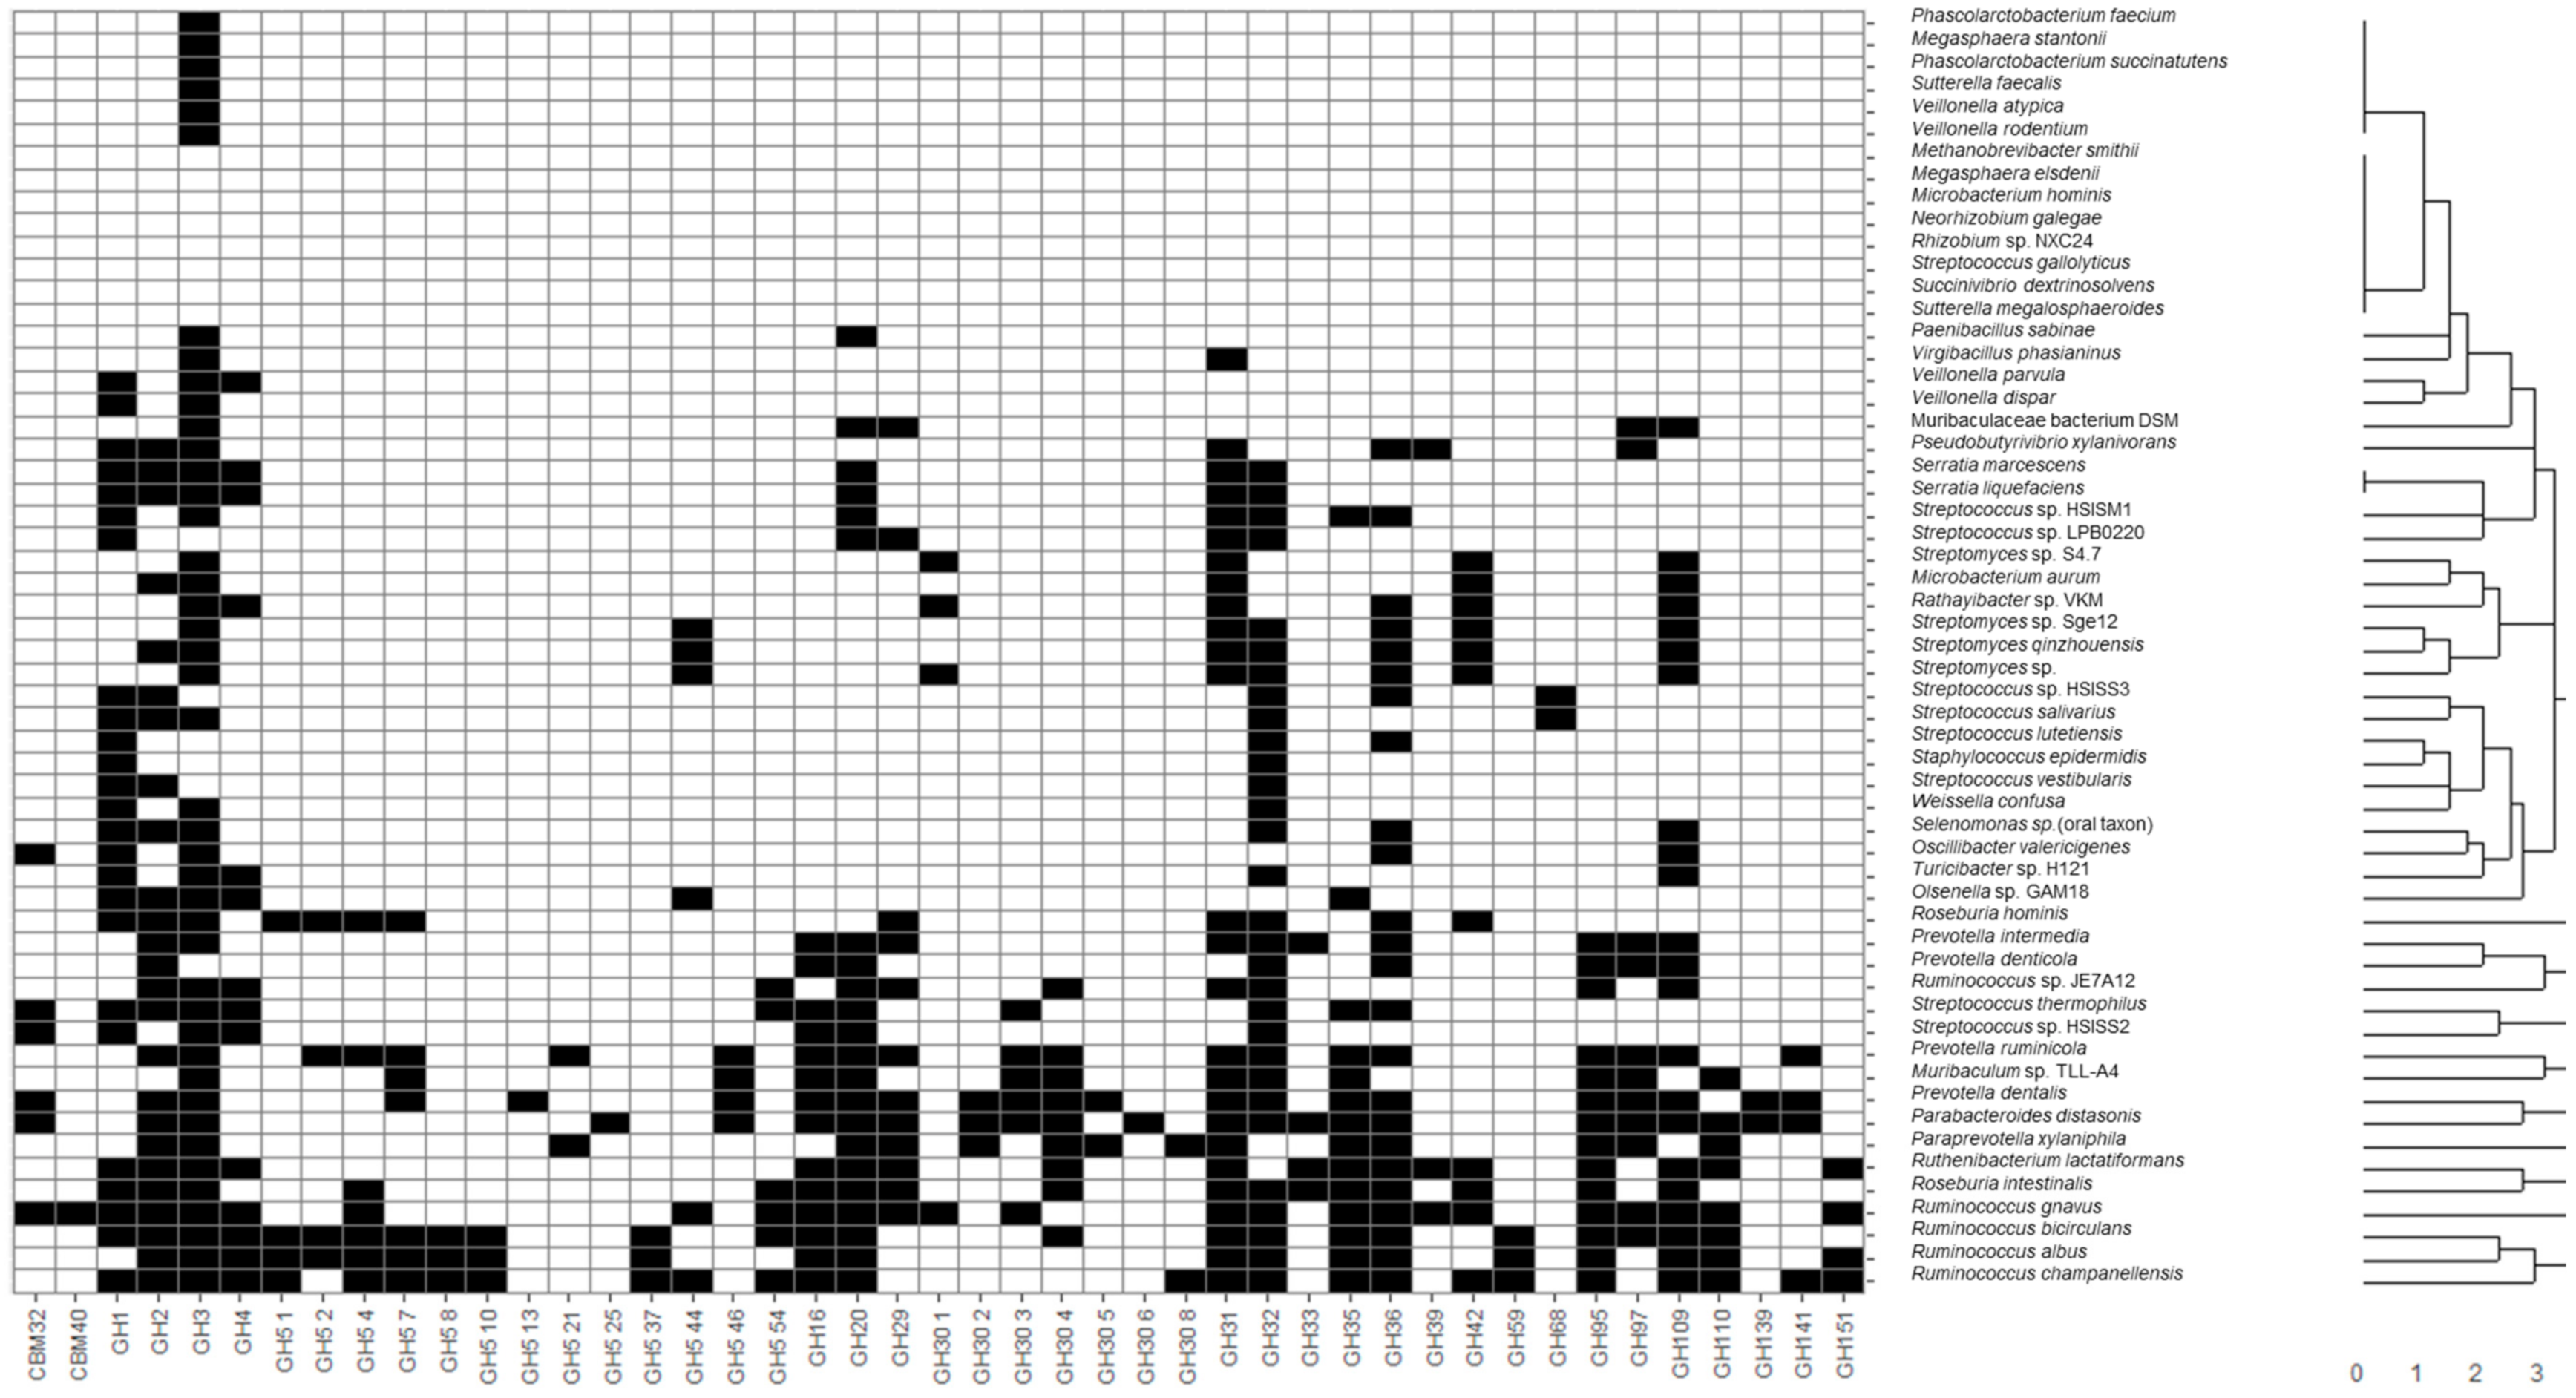
Recovered MAGs from all identified microbial species were clustered considering the presence of CAZy families of interest described in the previous section through hierarchical clustering considering a Euclidean distance metric (Figure 1). Moreover, heatmaps illustrating the presence and absence of functional domains were generated. In this sense, applications of heatmaps to represent the presence or absence of microbial taxa and genes have been extensively reported in the literature. Some recent examples include the usage of heatmaps to elucidate the presence of coincident genes across microbial genomes [34] and coincident genera in human microbiota samples [35]. In the present study, most species belonging to the same genus were clustered together, highlighting common metabolic patterns. In general, the widest number of glycosidase activities codified in MAGs was observed for the following genera: Bacteroides, Blautia, Caproiciproducens, Clostridium, Longibaculum, Paraprevotella, Prevotella, Roseburia, Ruminococcus, Ruthenibacterium, Muribaculum, as well as several species belonging to Lachnospiraceae and Erysipelotrichaceae families (Figure 1). It should be noted that Bacteroides, belonging to Bacteroidetes phyla, is one of the most relevant clades in the microbiota of adult individuals due to particular metabolic capabilities that allow Bacteroides to use a wide range of complex carbohydrates [36]. Other Bacteroidetes, such as Paraprevotella, Prevotella, Muribaculum, may play a similar role based on their glycosidase profiles. In addition, Roseburia comprises another relevant genus of the Firmicutes phyla known to metabolize dietary polysaccharides [17]. Other Firmicutes that exhibited a wide range of prebiotic-degrading enzymes include Blautia, Caproiciproducens, Clostridium, Longibaculum, Ruminococcus and Ruthenibacterium. It has been reported that the healthy gut microbiome is composed predominantly of the phyla Firmicutes and Bacteroidetes [37], and our cluster analysis highlights the prevalent role of the glycosidic metabolic activities of these two phyla, showing a wider variety of glycosidases able to hydrolyze some of the most common types of prebiotics.
Glycosidase activities from these bacteria corresponded mainly to the CBM32, CBM40, GH1-5, GH31-42, GH95-110 CAZy families comprising most enzyme classes included in this study, such as α- and β-galactosidases, fucosidases, fructosidases, hexosaminidases and sialidases. On the contrary, other species not characteristic of a healthy infant microbiota, according to Baumann-Dudenhoeffer et al. [16] and Hill et al. [38], lack several GH5 and GH30 subgroups comprising hexosaminidases and fucosidases, indicating a limited potential ability to metabolize HMOs.
A wide number of glycosidase activities were also found for Bifidobacterium, similar to those of the above-mentioned non-bifidobacteria species with high metabolic capacities, belonging to Firmicutes and Bacteroidetes. Moreover, some glycosidases were characteristic of bifidobacteria (i.e., not present in most MAGs species recovered): GH30 5 fucosidases were present in B. bifidum, B. breve and B. longum, as well as other non-bifidobacteria species like B. producta, C. sp. enoides, C. saccharolyticum, P. dentalis and P. xylaniphila, and L. bacterium strain GAM79. Similarly, GH59 β-galactosidases were characteristic of B. breve, B. longum and B. pseudocatenulatum, but were also present in C. bolteae, C. sp. enoides, C. saccharolyticum, F. prausnitzii, R. albus, R. bicirculans and R. champanellensis, and strains L. sp. YL32 and L. bacterium GAM79. As it can be seen, some characteristic glycosidases from bifidobacterial were also found in the Clostridium and Ruminococcus genera and novel strains from Lachnospiraceae, highlighting metabolic similarities between these species and a higher potential to degrade HMOs and mucins when compared to other microorganisms.
Other non- bifidobacteria species showed a limited number of CAZy families of interest, more limited than those observed for bifidobacteria. In this sense, only GH3 and GH31, comprising hexosaminidases and α-galactosidases, were found in Mageeibacillus indolicus, while GH3 was the only relevant domain analyzed in MAGs from Phascolarctobacterium and Megasphaera genera. The presence of α-galactosidases in these species could be of interest to metabolize α-GOS commonly added to infant formula due to their potential prebiotic effect [6]. Interestingly, GH30 3 family involving fucosidases was the only relevant domain determined in Alistipes communis MAGs. It should be considered that fucosidases have been described in species from the genus Alistipes [39].
Main glycosidase activities for several species and strains presented in this work were previously reported in adult metagenomes by other authors involving xylan 1,4-beta-xylosidase, glucan endo-1,3-beta-D-glucosidase, glucan 1,6-alpha-glucosidase, licheninase, and cellulase [17]. However, no attempts to elucidate glycosidase profiles of common prebiotic structures like GOS and FOS were made. Therefore, the results herein presented provide complementary information to those already reported in the bibliography and may provide a foundational basis to estimate which prebiotic structures could be more fermentable by a given species.
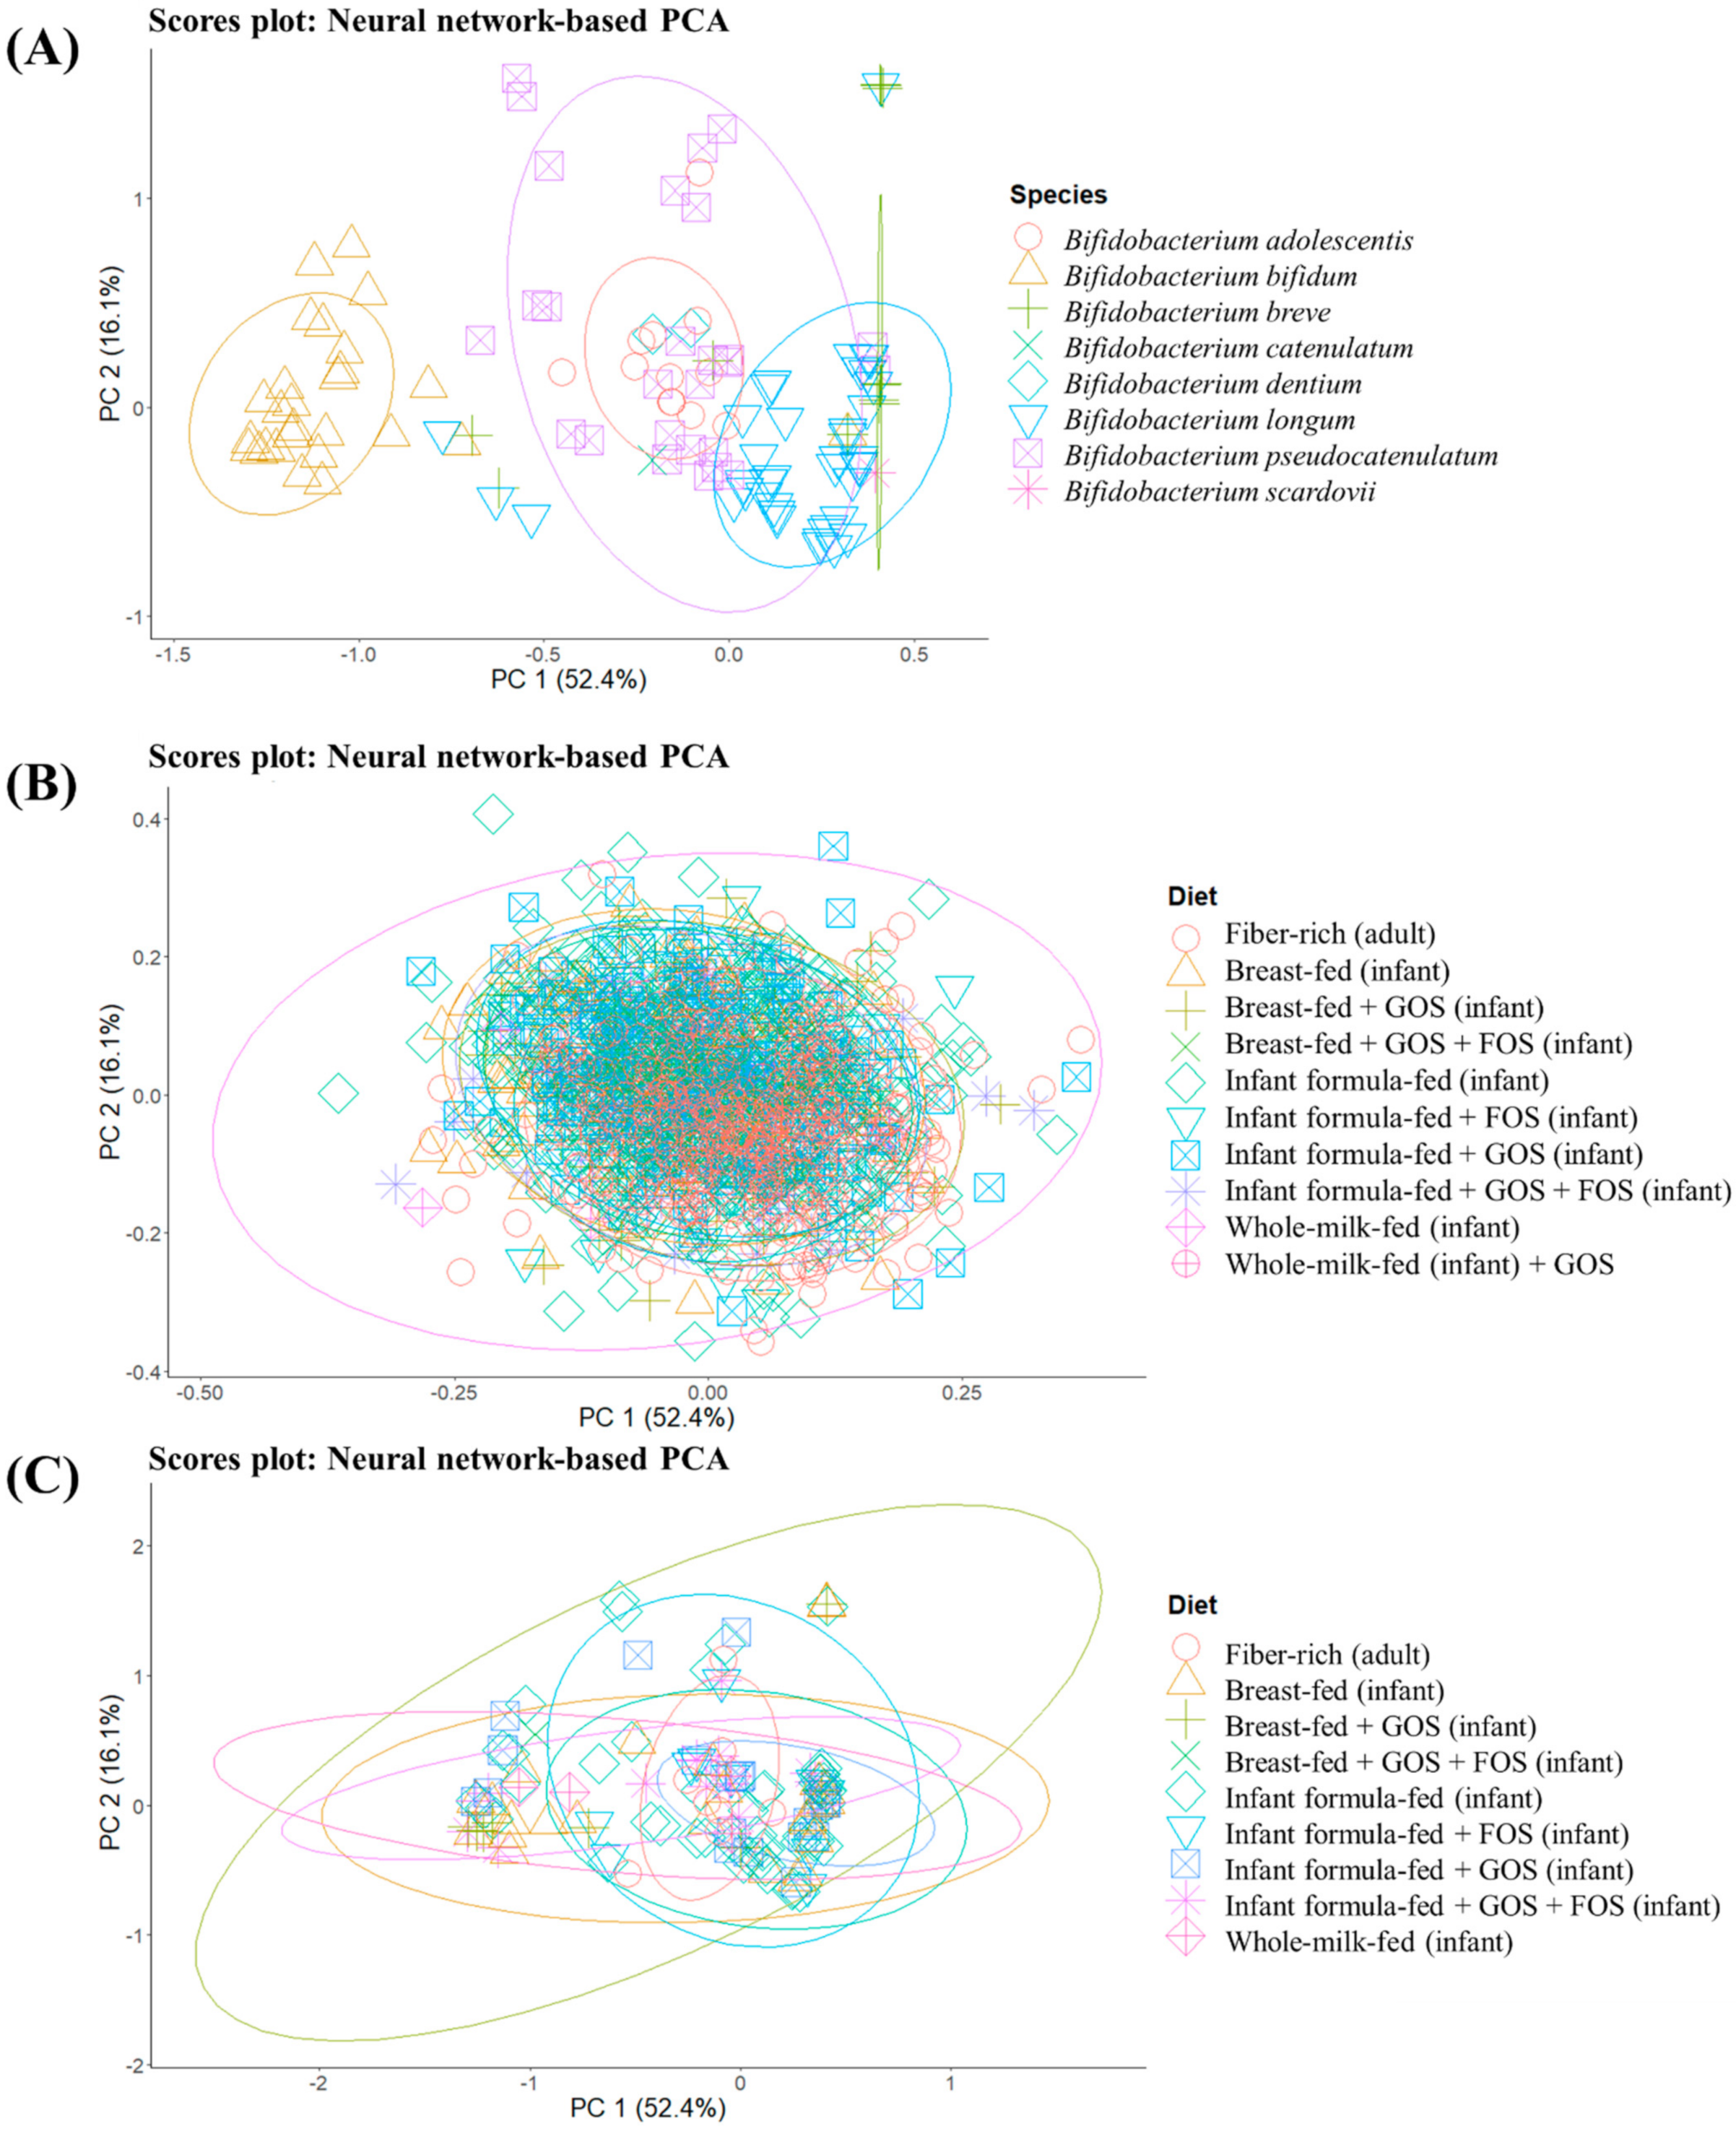
To get a general overview of glycosidase activities codified in different MAGs obtained from groups consuming different prebiotic structures, unsupervised sample distribution was evaluated by the ANN-based PCA model (Figure 2). Specifically, differences between MAGs from different Bifidobacterium species (Figure 2A) as well as glycosidase profiles of MAGs from all identified species (and not just Bifidobacterium, Supplementary Materials Table S1) according to the host diet (Figure 2B,C), are illustrated. The implementation of an ANN allows describing as much variance as possible, and the cumulative percentage of variance explained by the first five components was 89.2%, which could not be achieved by conventional PCA. Therefore, this kind of mathematical model could be especially suitable to find patterns in biological samples, which may yield sparse and heterogeneous data [26,27]. B. bifidum showed a characteristic glycosidic profile different from the rest of bifidobacteria (B. adolescentis, B. breve, B. catenulatum, B. dentium, B. longum, B. pseudocatenulatum, B. scardovii) (Figure 2A). This could be related to the potential ability of this species to degrade mucins [40]. In addition, glycosidase patterns of B. longum were distinguished from those of B. adolescentis, considering the absence of overlap in normal ellipses and the percentages of variance explained.
When interpreting these differences, it should be considered that metabolic activities of B. bifidum and B. longum subsp. infantis are tailored toward HMOs degradation, while other bifidobacteria do not encode the same HMOs-specific glycosidases and can degrade only limited HMOs [41]. In contrast, no characteristic pattern could be elucidated when grouping MAGs from bifidobacteria and other species identified (Figure 2B,C) according to the type of diet (breastfed, breastfed + GOS, breastfed + GOS + FOS, infant formula-fed, infant formula-fed + FOS, infant formula-fed + GOS, infant formula-fed + GOS + FOS and whole-milk-fed infants as well as fiber-rich diets in adults).
These results indicate the existence of different glycosidase profiles between Bifidobacterium species regardless of prebiotic exposure.

3.3. Supervised Classification to Establish Characteristic Glycosidase Profiles of Bifidobacterium Species

To deepen the study of characteristic glycosidases found in Bifidobacterium MAGs, several supervised classification algorithms were compared, allowing establishing more robust patterns than the ones suggested by unsupervised projection. The number of MAGs recovered from B. catenulatum, B. dentium and B. scardovii was not enough to train supervised algorithms (Supplementary Materials Table S1), so these models were focused on B. adolescentis, B. bifidum, B. breve, B. longum, B. pseudocatenulatum. ANN, RF and glmnet were trained on 70% of MAGs from each Bifidobacterium species and tested on 30% new samples to ensure the reproducibility of the model. 
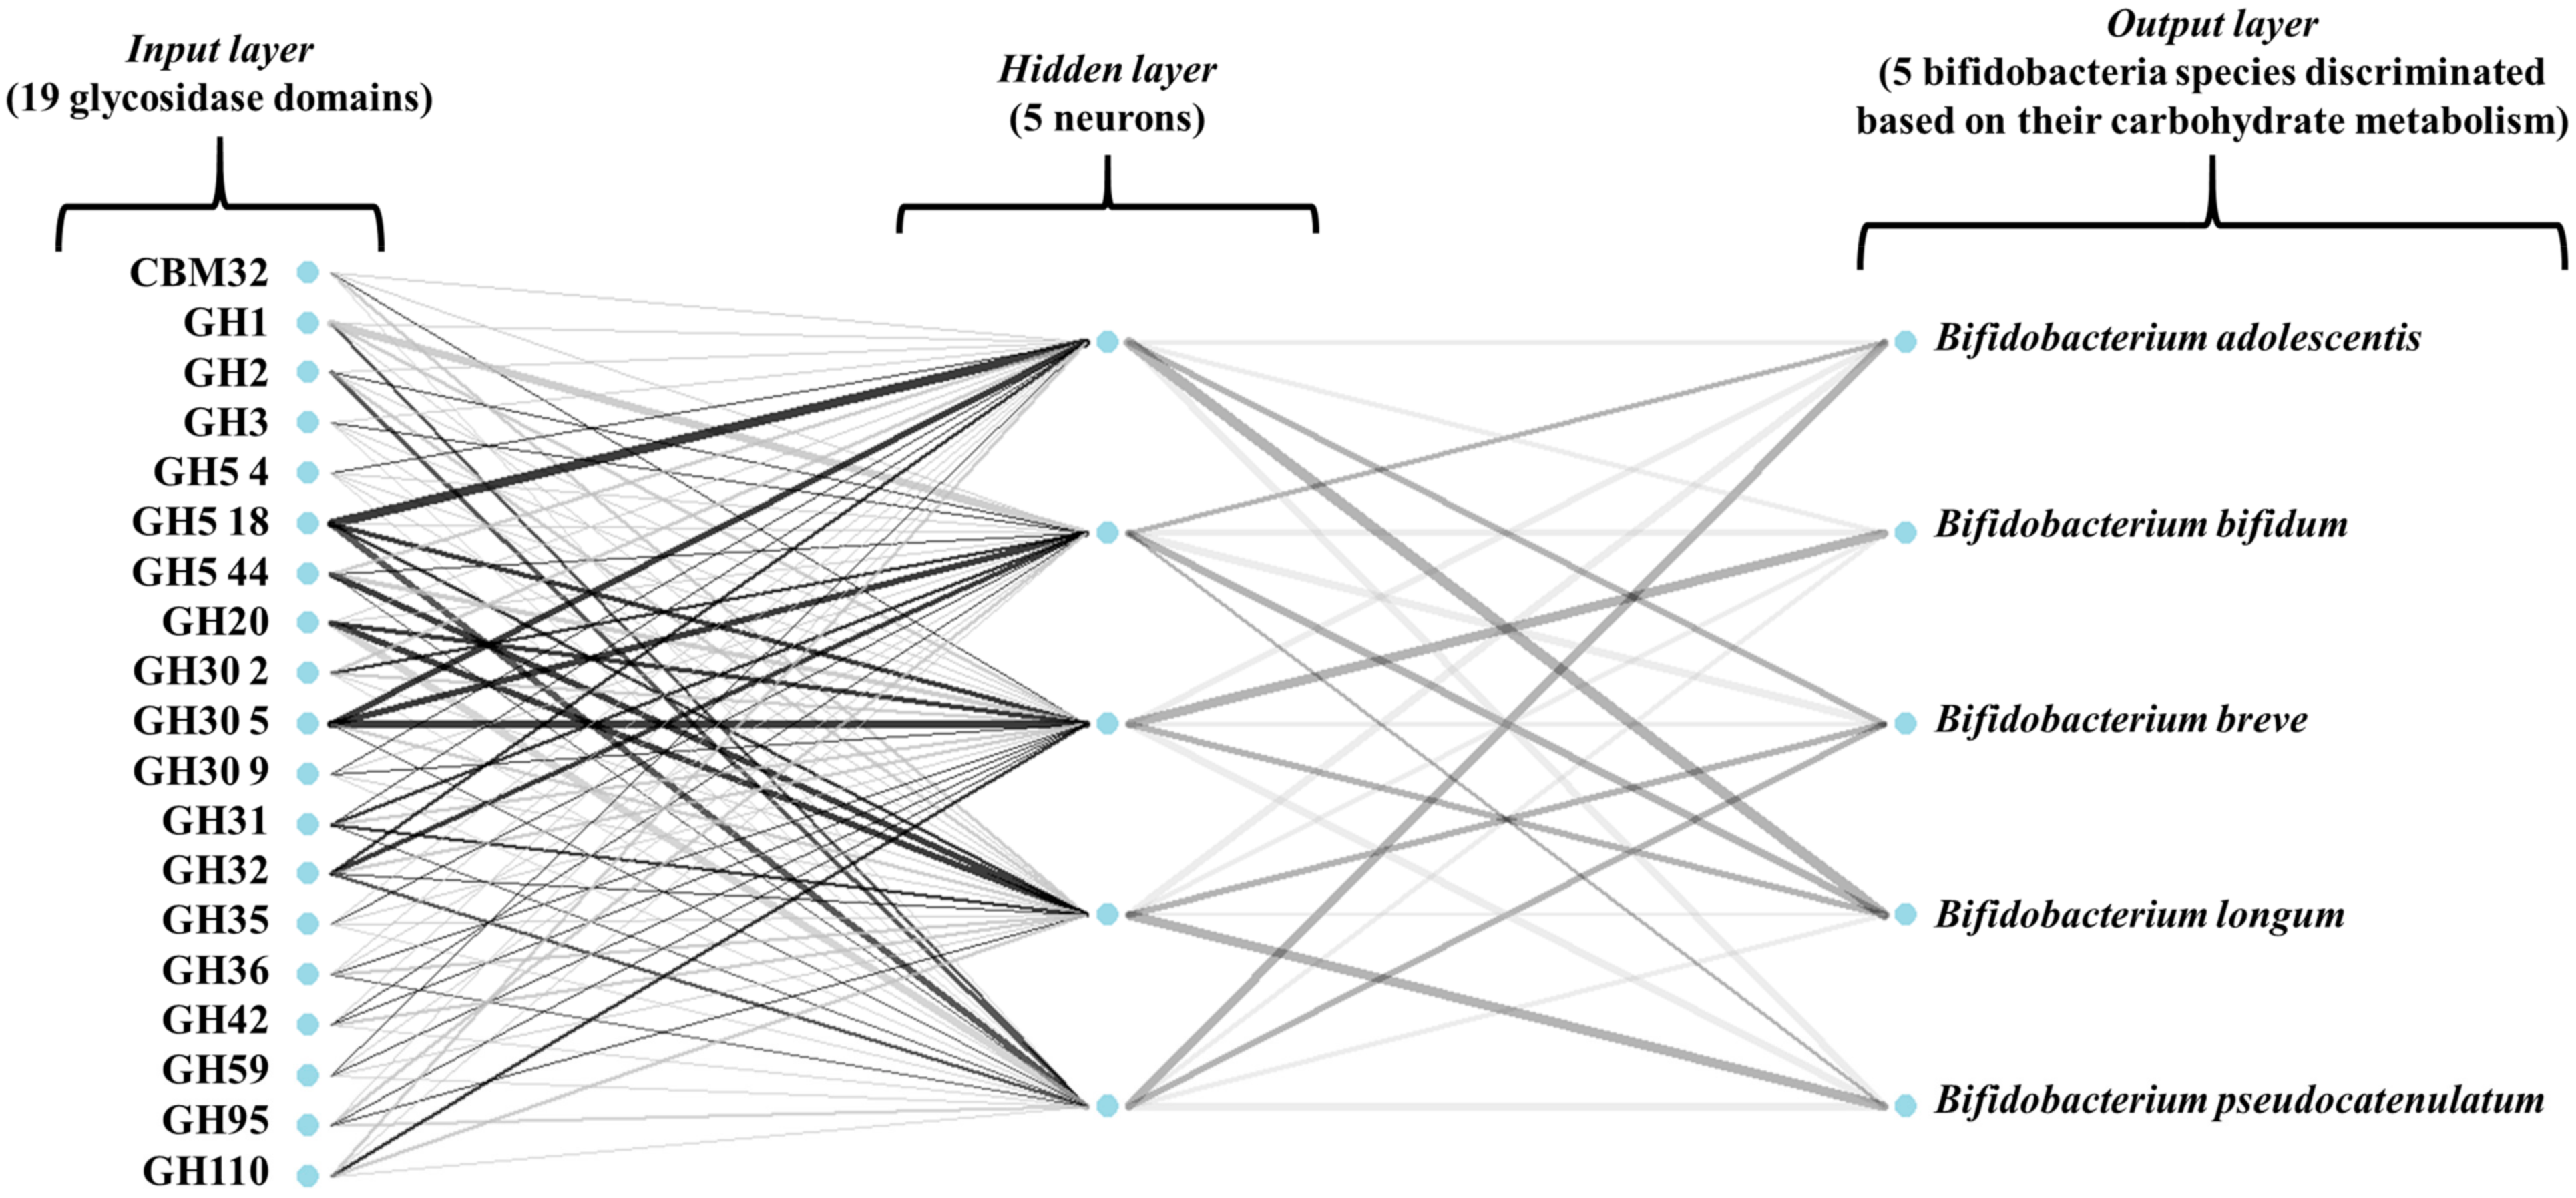
Figure 3 illustrates the architecture of the ANN model used in this study. In addition, all models were 10-fold cross-validated. To assess model performance, several estimators were calculated (Supplementary Materials Table S4). The number of correctly classified MAGs during train and test phases was 97.8 and 91.7% for all models, while cross-validation accuracies for ANN, RF and glmnet were 96.4, 96.4 and 97.1%, respectively. Cross-validation kappa values, a more robust measure of accuracy that takes into account the possibility of correct classification by chance, for ANN, RF and glmnet, were 95.2, 96.2 and 96.2%, respectively. Similarly, kappa values obtained during the test phases were 89.2, 89.1 and 89.1% for ANN, RF and glmnet. A comparative account of the models was performed (Supplementary Materials Figure S1), highlighting the absence of statistically significant differences (p > 0.05) accuracies and kappa values calculated from the resampling distributions of the three algorithms. Additional estimators calculated include model sensitivity, specificity, precision, recall, F1, and balanced accuracy during the test phase on new samples.
Sensitivity, defined as the coefficient of the number of true-positive results by the total number of positives (including false-positives), recall, defined as the coefficient of true positives between relevant elements (i.e., MAGs from the same bifidobacteria species), and F1 coefficient, which combines precision and recall in one metric, showed lower values for B. adolescentis (ranging from 0.63–0.83) than the rest of bifidobacteria in all models. This fact indicates a lower classification rate for B. adolescentis than the rest of Bifidobacterium species, revealing the absence of a unique glycosidase pattern for this species. As a consequence, characteristic glycosidases of B. adolescentis are also characteristic of other bifidobacteria. However, specificity calculated by dividing the number of true-negative results by the total number of negatives (including false negatives) presented high values for all species, above 0.95 (Supplementary Materials Table S4). Interestingly, precision, defined as the percentage of the model’s positive predictions that are accurate, showed the lowest values for B. pseudocatenulatum (0.82 for the three models). As a consequence, B. adolescentis and B. pseudocatenulatum exhibited the lowest balanced accuracies (0.81–0.86 and 0.93, respectively), defined as the sum of sensitivity and specificity divided by two.
These results could be attributed to minor differences existing in the glycosidase profiles of B. adolescentis and B. pseudocatenulatum recovered from infant or adult metagenomes and metabolic similarities between these two species, leading to misclassification of certain MAGs. Indeed, these two species belong to the same phylogenetic group [42]. Machine learning trained MAG glycosidase data showed similar performance metrics than previous models trained on carbohydrate spectral data, highlighting the suitability of this mathematical approach to elucidate complex patterns within the field of probiotics and prebiotics [27].
When interpreting these models, it should be considered that RF, glmnet and MLP are computed differently, although they yielded similar results, highlighting the characteristic activities of each Bifidobacterium species. These profiles were elucidated by complementary approaches, and the results from predictive algorithms reinforce each other. The unsupervised method could not properly discriminate between all Bifidobacterium species showing a lower performance (low percentages of variance explained by the first components). In contrast, supervised ANN, RF and MLP showed high classification accuracies, above 90% when tested on new samples. This fact may be attributed to the subtle differences existing between glycosidase domains found in MAGs that could not be properly explained by PCA-like methods. Therefore, advanced supervised pattern recognition methods are needed to elucidate the metabolic profiles of bifidobacteria.
To determine the most relevant glycosidase activities in the characteristic profile of Bifidobacterium species, a variable importance analysis of each model was carried out (Supplementary Materials Tables S5–S7). The most dominant glycosidase family from B. adolescentis was GH2 (involving β-galactosidases). The absence of GH20 (comprising hexosaminidases) was also characteristic of this species, although B. adolescentis shared the rest of its characteristic glycosidase domains with other Bifidobacterium species, leading to a lower classification rate (Supplementary Materials Table S4). Pokusaeva et al. [43] suggested that B. adolescentis is incapable of properly degrading HMOs, agreeing with our findings.
Relevant families in B. bifidum profiles include GH5 44, GH32, and GH110 (hexosaminidases, fructosidases, fructosyl transferases and α-galactosidases). It should be noted that the GH110 CAZy family was not found in MAGs from other bifidobacteria (Figure 1), indicating a different hydrolytic profile for B. bifidum that may explain metabolic differences observed in PCA analysis (Figure 2A). The role of hexosaminidases like β-N-acetylglucosaminidases on HMOs metabolism has been described by Sakanaka et al. [2]. Specifically, the presence of hexosaminidases reported in B. bifidum, B. breve and B. longum subsp. infantis genomes has been reported. Hexosaminidases from B. bifidum, showing high importance coefficients in our machine learning models, could be highly active on HMOs like lacto-N-triose (LNTri), while those from other species like B. breve could be active on lacto-N-tetraose (LNT) and lacto-N-neotetraose (LNnT). It has also been reported that B. bifidum shows a high HMOs assimilation ability that may contribute to its characteristic glycosidase profile that favors its persistence in the breastfed infant gut [2,43]. In fact, previous studies indicate that B. bifidum degrades some HMOs structures more rapidly than lactose [43]. After host glycans and HMOs degradation, mono– or disaccharides released are consumed by other species metabolically dependent on these simple sugars [4,44].
Glycosidase profiles of B. breve were characterized by GH1 and GH5 18 families (comprising β-galactosidases and hexosaminidases hydrolyzing mainly LNT and LNnT in contrast to those from B. bifidum), and those from B. longum showed high importance coefficients for β-galactosidases and fucosidases from GH1 and GH30 5 families. Finally, the presence of the glycosidase families, GH5 44 and GH20 comprising hexosaminidases and the absence of GH5 18 were characteristic traits from B. pseudocatenulatum. These enzymes may contribute to the metabolism of lacto-N-biose I (LNB), according to previous authors [2,45].
We have demonstrated that it is possible to get highly accurate classifications of glycosidase activities from some of the most common Bifidobacterium species based on several mathematical approaches. Specifically, ANN, RF and glmnet exhibited high-performance metrics, indicating a high predictive power. As explained, characteristic glycosidase profiles of each bifidobacteria have been elucidated based on the importance coefficients from the three machine learning models. These models could be generalized and applied to new genomes from bifidobacteria and related microorganisms in future studies.
Concerning the main limitations of this method, it is possible that some glycosidase domains of interest may be lost during MAG assembly. However, the study of bifidobacteria MAGs allows comparing metabolic profiles of Bifidobacterium associated with specific groups of individuals (i.e., following dietary interventions of interest) and assessing the metabolic complementarity between bifidobacteria and non-bifidobacteria species found in the same participant.

3.4. Correlation Networks to Elucidate Glycosidase Activities Commonly Associated

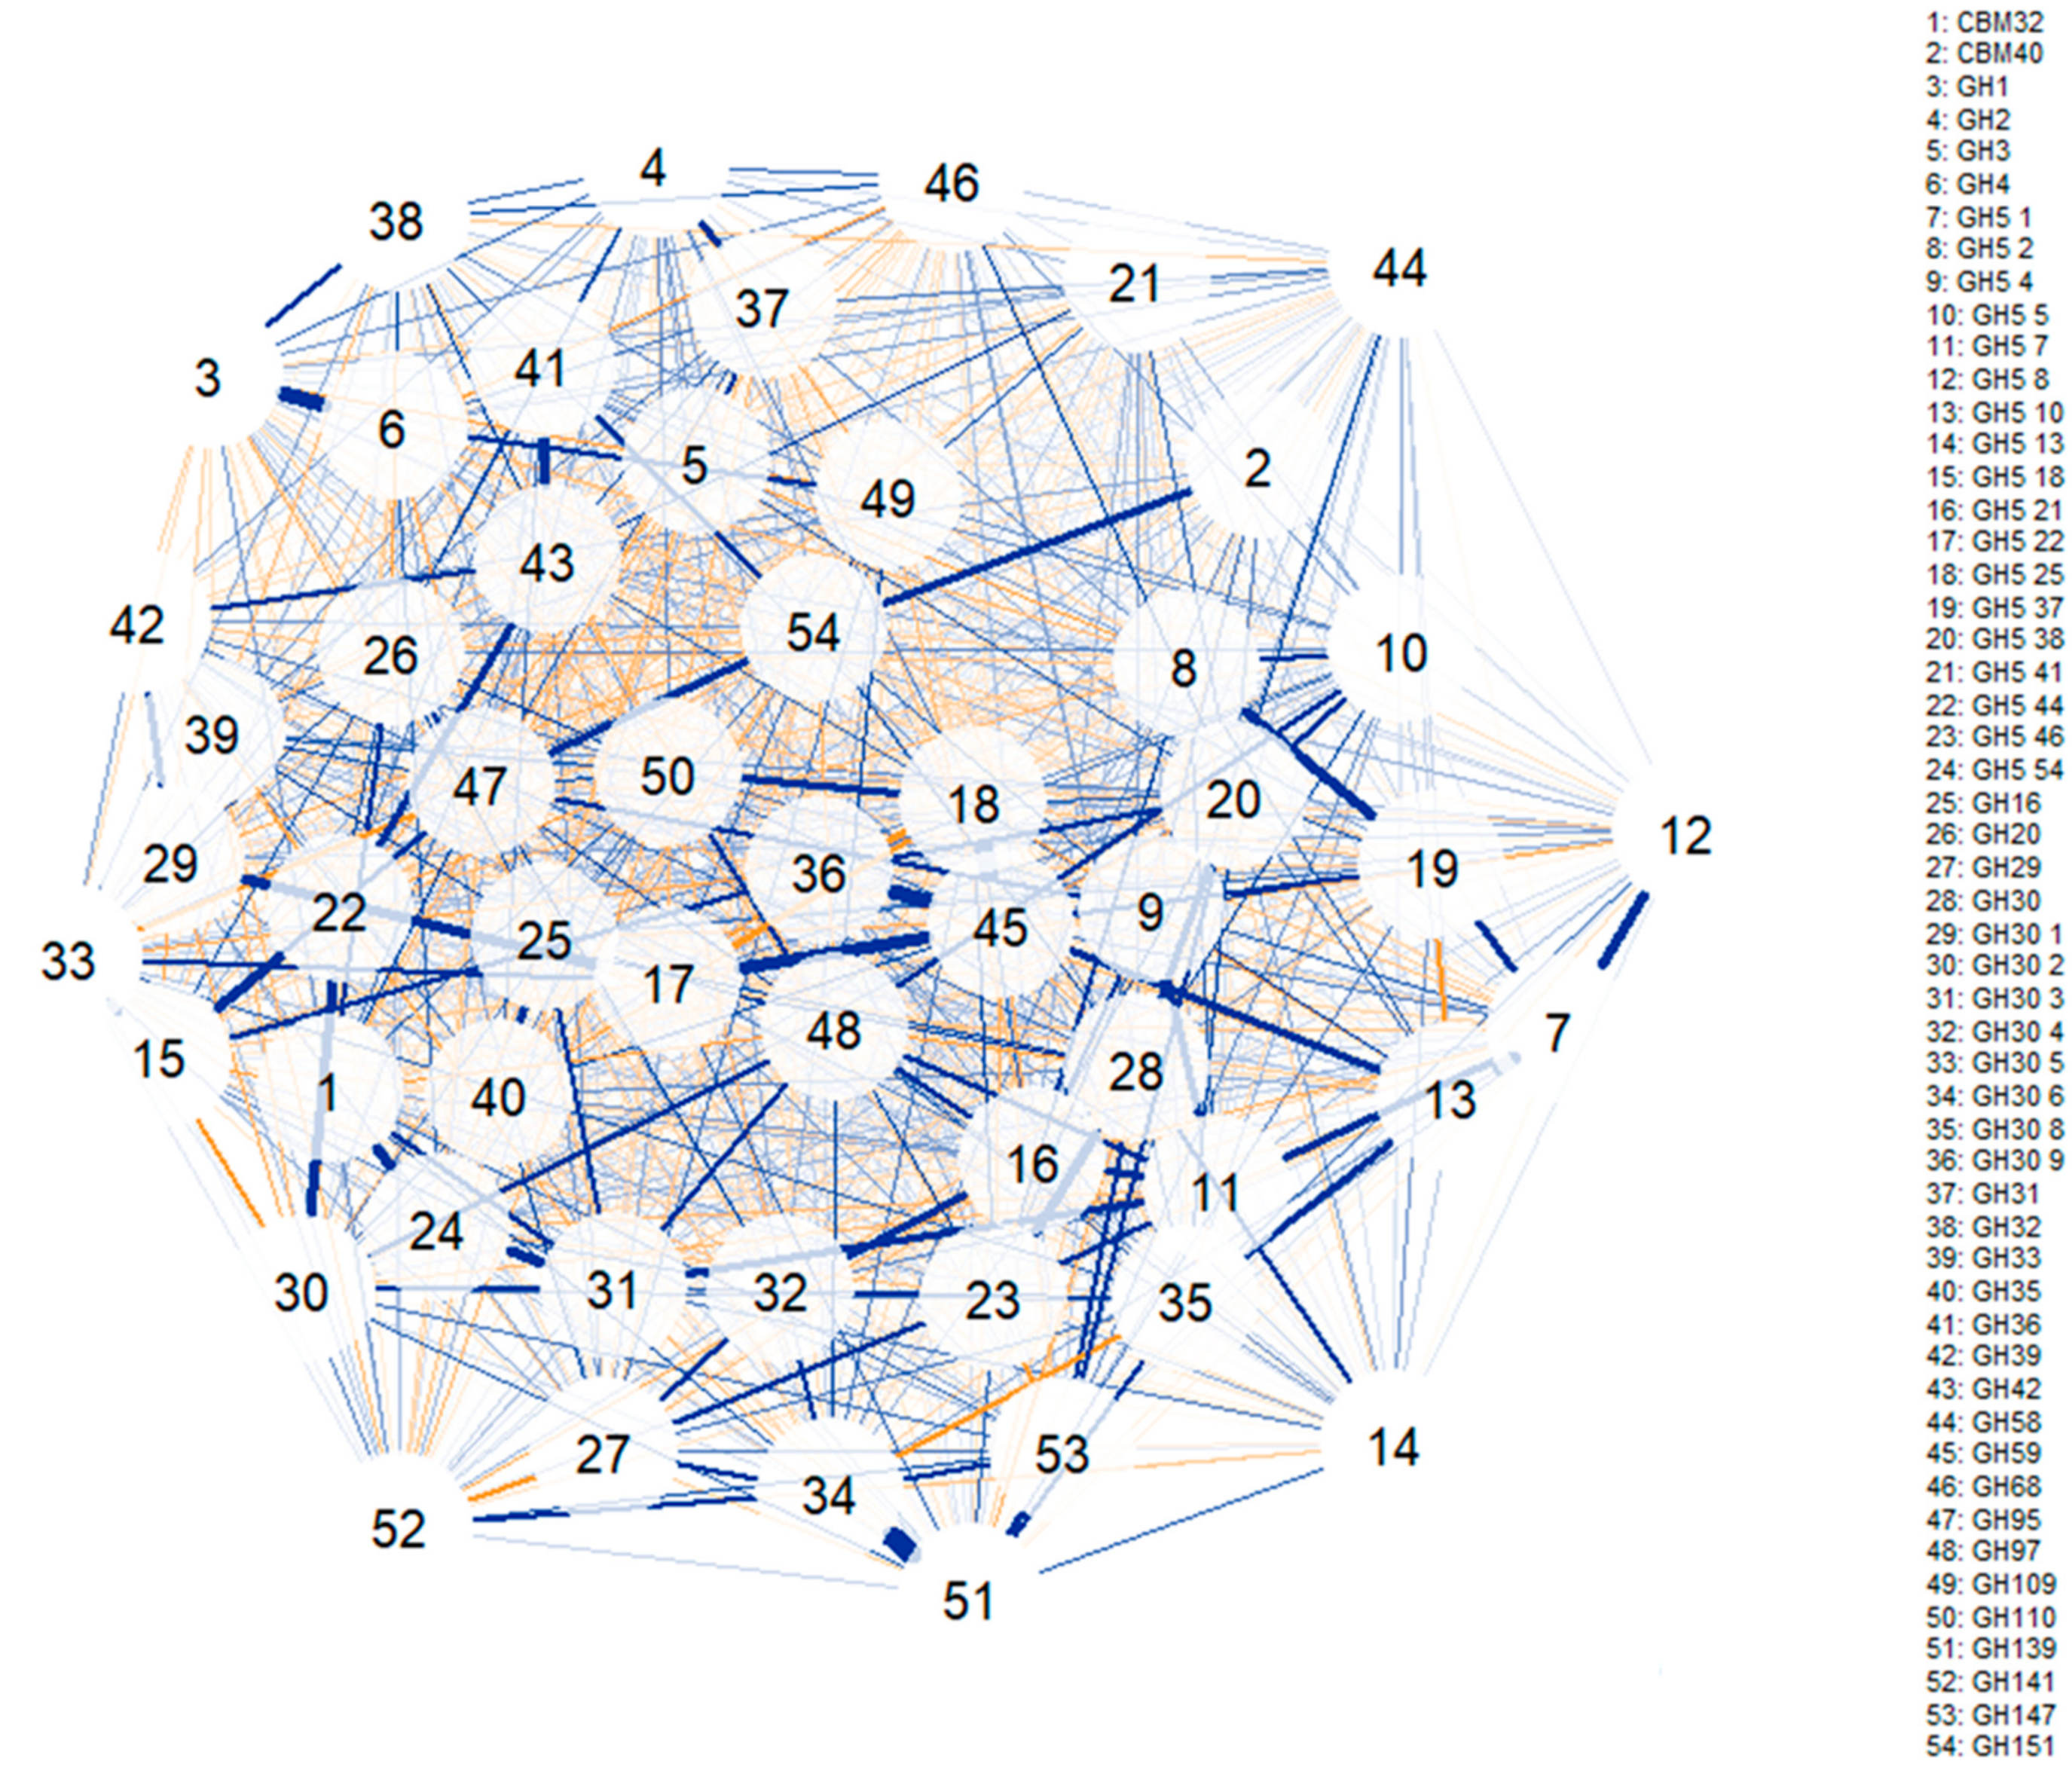
To study the associations between different glycosidase activities (i.e., which glycosidase families are usually encoded together in the same MAG), correlation network models were computed (Figure 4 and Figure 5). The first correlation model (Figure 4) was built using glycosidase activities from all species identified (bifidobacteria or not). Some of the strongest correlations observed include the positive associations between GH1 and GH4 and between GH36 and GH42 (involving α- and β-galactosidases). Furthermore, GH139 was positively associated with GH30 6 and GH147 families (involving β-galactosidases and fucosidases), and the GH151 family was correlated to CBM40 and GH97 (involving α-galactosidases, fucosidases and sialidases). In this sense, GH5 44 was associated with GH30 1, GH16, GH5 18 and GH30 2 families and GH59 was positively correlated to GH30 9 and GH5 22 families (comprising β-galactosidases, fucosidases and hexosaminidases). Similarly, several CAZy families involving hexosaminidases showed positive correlations: GH5 37 was associated with GH5 2, GH5 4 and GH5 1, while GH5 1 was associated with GH5 8, and GH5 22 was associated with GH5 9. It should be noted that all negative correlations were weaker than the positive ones, and no relevant associations were observed.
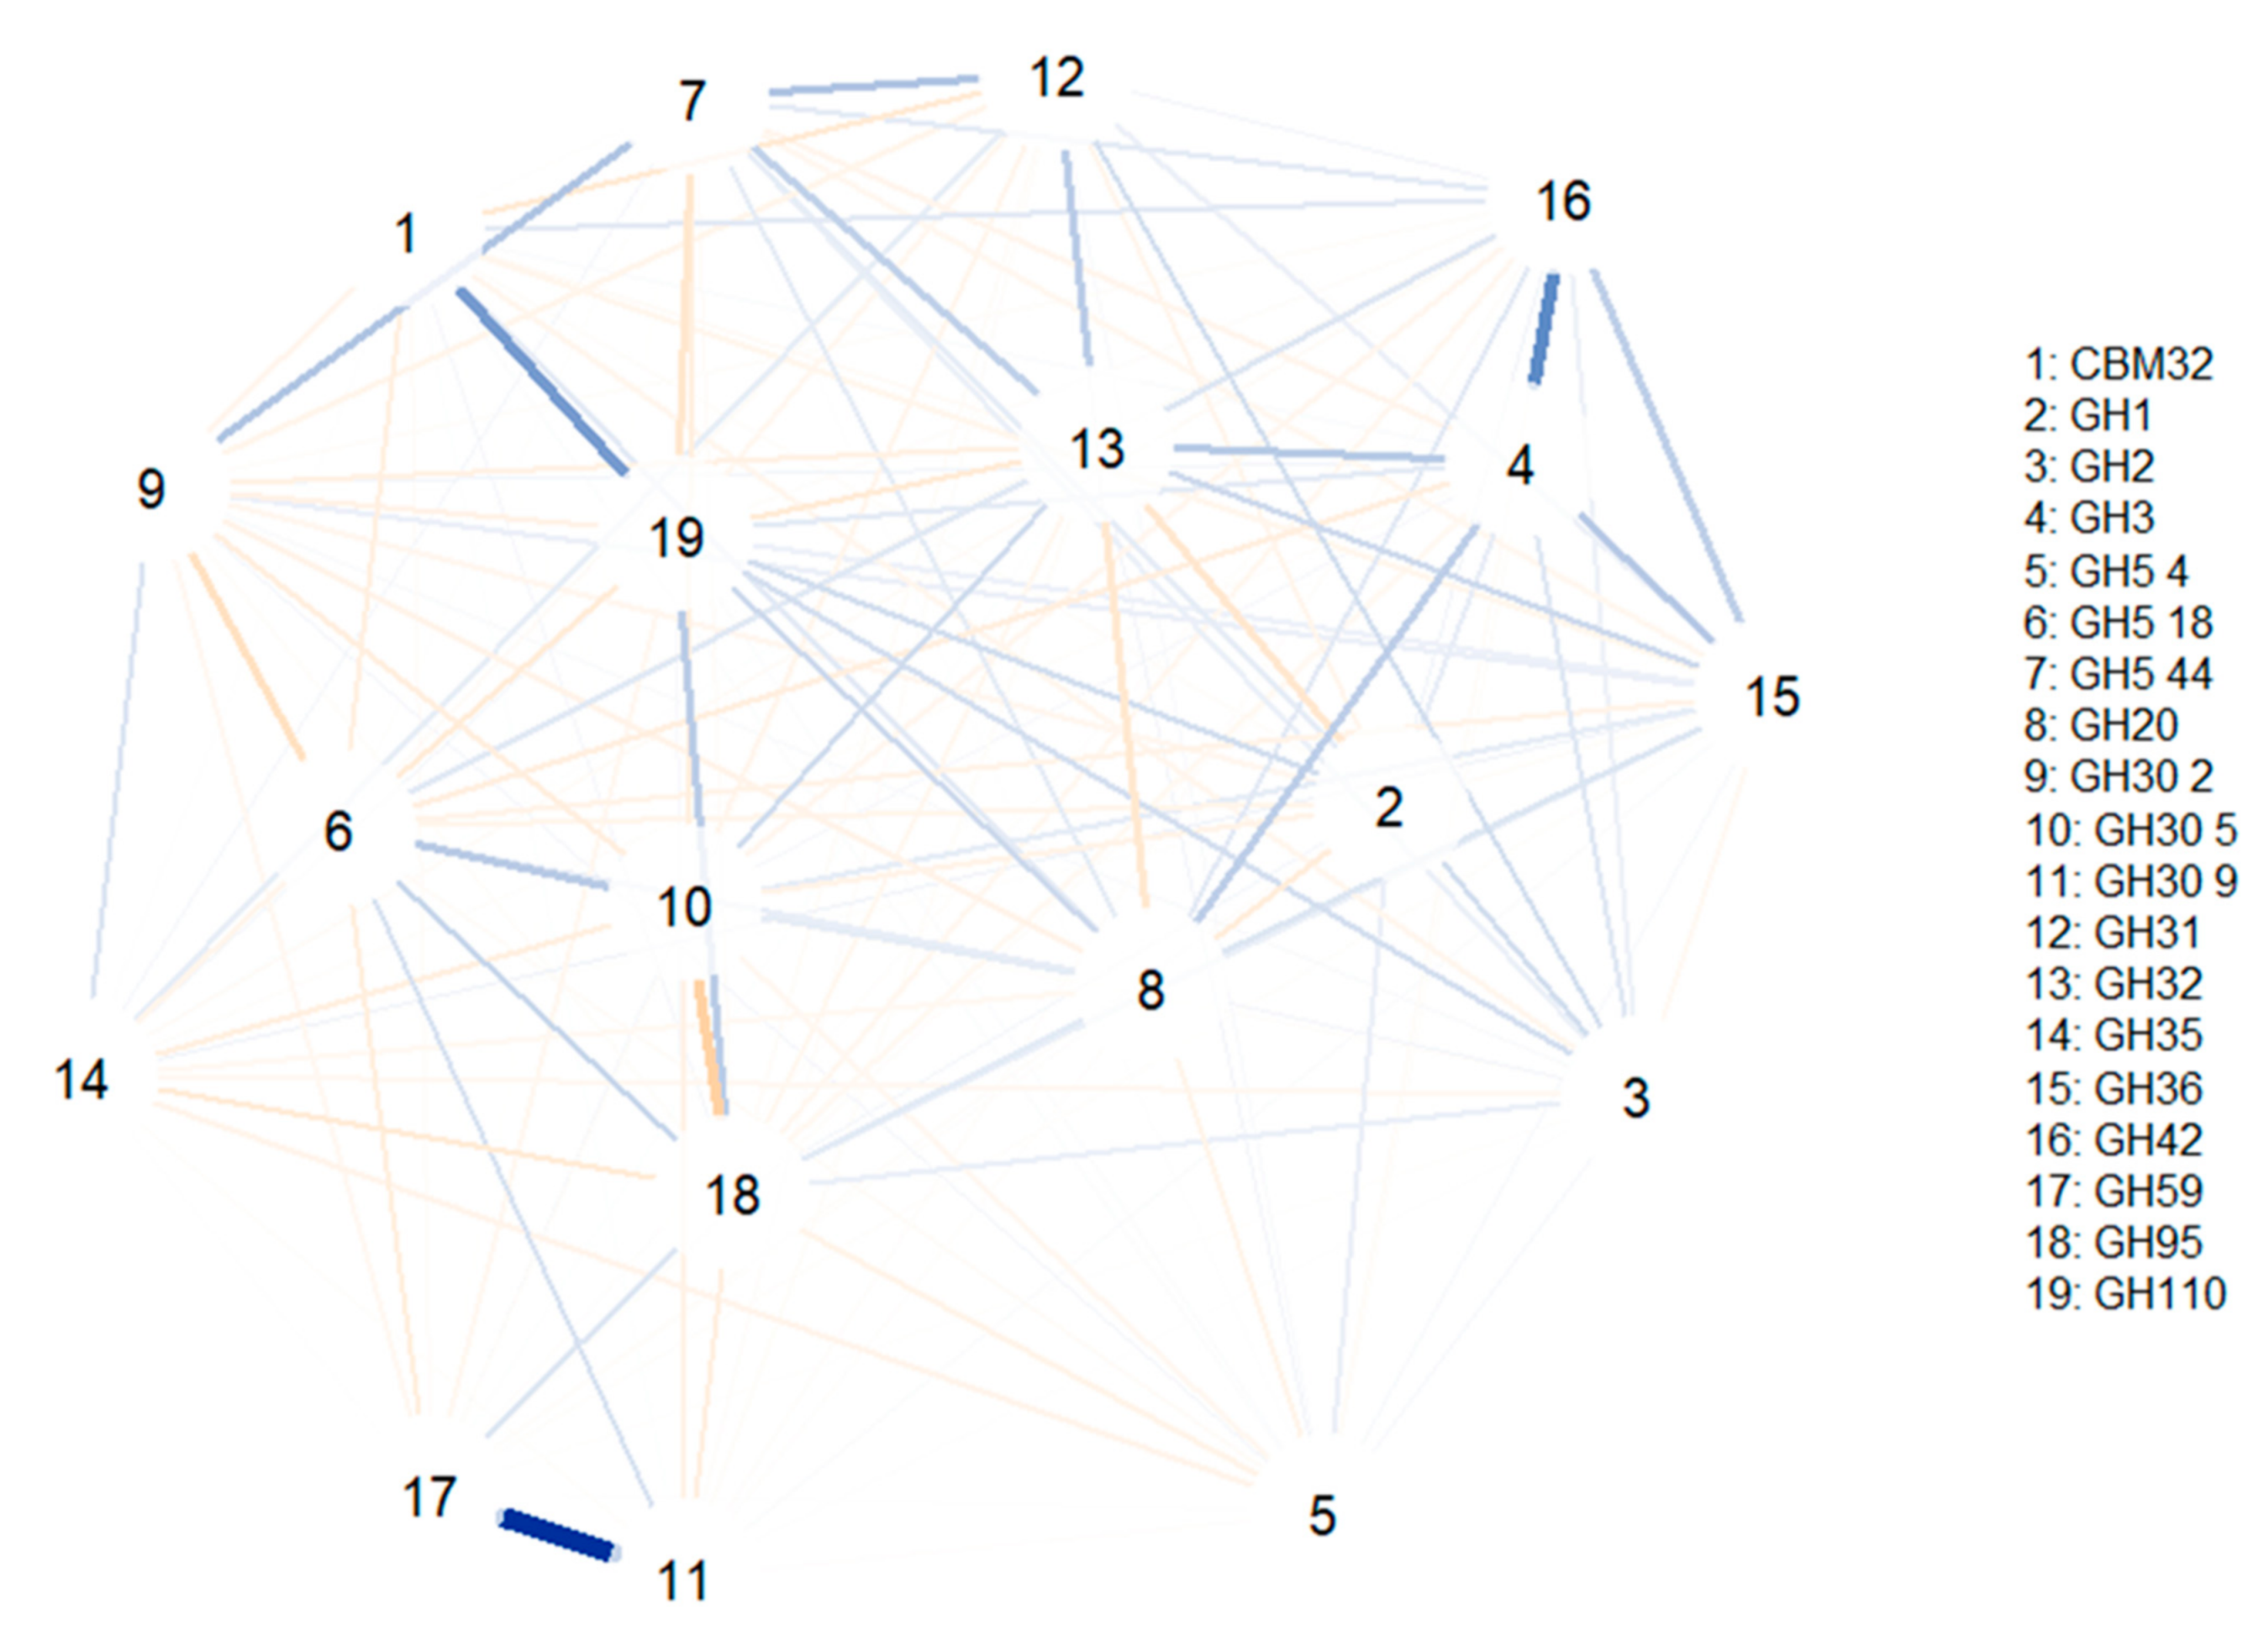
A second correlation network was computed to investigate glycosidase associations only in bifidobacteria MAGs (Figure 5). GH30 9 and GH59 families involving fucosidase and β-galactosidase activities were positively associated, while a positive association was found between CBM32 and GH110 (comprising sialidases and α-galactosidases characteristic of B. bifidum). In addition, GH3 was correlated to GH4; these two CAZy families comprising hexosaminidases and β-galactosidases. Similar to the previous study, no relevant negative correlations were observed.
As previously explained, fucosidases and β-galactosidases were strongly correlated not only in bifidobacteria but in all MAGs analyzed. It should be considered that these two enzyme families are involved in HMOs metabolism. Specifically, to degrade HMOs, both β-1,4-galactosidases and two types of fucosidases, 1,2-α-l-fucosidase and 1,3-1,4-α-l-fucosidase, are needed. Fucosidases were also correlated to sialidases, which may act on both α-2,3 and α-2,6 linkages found in sialylated HMOs [2]. These results indicate that glycosidases that may potentially hydrolyze HMOs as well as glycans associated with mucin, sharing similar monomers, are strongly correlated and frequently found in the same MAG. Some HMOs-degrading enzymes were also strongly associated with the α-galactosidases characteristic of B. bifidum, confirming the glycolytic profiles elucidated for this species in previous sections. It should be noted that α-galactosidases have been reported only in specific bifidobacterial species [43] and may play a major in the metabolism of α-GOS like raffinose or stachyose, that are commonly added to infant formula [6].

4. Conclusions

A total of 1806 metagenome-assembled genomes (MAGs) corresponding to 177 different species have been recovered from 487 infant and adult metagenomes. Most MAGs recovered were taxonomically identified as Escherichia coli, Faecalibacterium prausnitzii, and Ruminococcus gnavus. Up to 203 MAGs have been recovered from the following Bifidobacterium species: B. adolescentis, B. bifidum, B. breve, B. catenulatum, B. dentium, B. longum, B. pseudocatenulatum and B. scardovii. Glycosidase activities annotation using the carbohydrate-active enzymes database (CAZy) coupled to mathematical modeling using machine-learning algorithms allowed elucidating characteristic glycosidase profiles for B. adolescentis, B. bifidum, B. breve, B. longum and B. pseudocatenulatum MAGs, showing high accuracy rates (>90%) when tested on an independent set of samples. GH5 44, GH32, and GH110 glycosidase families comprising hexosaminidases, fructosidases, fructosyl transferases and α-galactosidases were characteristic of B. bifidum, while β-galactosidases and hexosaminidases from GH1, GH2, GH5 and GH20 were characteristic of B. adolescentis, B. breve and B. pseudocatenulatum. Potential hydrolytic profiles of B. longum were characterized by the presence of GH1 and GH30 families involving β-galactosidases and fucosidases. Correlation networks of glycosidase activities revealed that glycosidases able to metabolize α- and β-GOS as well as HMOs were strongly correlated and are frequently present within the same MAG. The study of Bifidobacterium MAGs allows comparing metabolic profiles of species found in individuals following specific dietary interventions as well as assessing metabolic complementarities between bifidobacteria and non-bifidobacteria species found in the same participant. The data analysis strategy presented in this work is of particular interest to gain a better understanding of the carbohydrate metabolism of bifidobacteria, and this design could be easily translated to other health-promoting microorganisms in future works.

Supplementary Materials

The following are available online at https://www.mdpi.com/article/10.3390/microorganisms9051034/s1, Figure S1: Comparative account of different three algorithms used for classification of metagenome-assembled genomes (MAGs) of B. adolescentis, B. bifidum, B. breve, B. longum and B. pseudocatenulatum based on their glycosidase activities: random forest (RF), generalized linear model elastic-net (glmnet) and artificial neural network (ANN). Differences between models were calculated via their resampling distributions (number of resamples = 10). a No statistically significant (p > 0.05) differences between models were found; Table S1: Number of metagenome-assembled genomes (MAGs) recovered (n = 1806) per species and strains identified (n = 177); Table S2: Number of metagenome-assembled genomes (MAGs) recovered per diet type. GOS: galacto-oligosaccharides, FOS: fructo-oligosaccharides; Table S3: Glycosidase activities of interest included in selected CAZy families; Table S4: Sensitivity, specificity, precision, recall, F1 coefficients and balanced accuracy rates for artificial neural network (ANN) random forest (RF) and generalized linear model elastic-net (glmnet) computed to classify metagenome-assembled genomes (MAGs) of B. adolescentis, B. bifidum, B. breve, B. longum and B. pseudocatenulatum based on their glycosidase activities; Table S5: Variable importance coefficients of artificial neural network (ANN) computed to classify metagenome-assembled genomes (MAGs) of B. adolescentis, B. bifidum, B. breve, B. longum and B. pseudocatenulatum based on their glycosidase activities. Importance coefficients were determined by the sum of the product of raw input-hidden and hidden-output connection weights; Table S6: Variable importance coefficients of random forest (RF) computed to classify metagenome-assembled genomes (MAGs) of B. adolescentis, B. bifidum, B. breve, B. longum and B. pseudocatenulatum based on their glycosidase activities. Importance coefficients were determined by the permutation of the out-of-bag-error; Table S7: Variable importance coefficients of generalized linear model elastic-net (glmnet) computed to classify metagenome-assembled genomes (MAGs) of B. adolescentis, B. bifidum, B. breve, B. longum and B. pseudocatenulatum based on their glycosidase activities. Importance coefficients were determined by calculating the area under the ROC (receiver operating characteristic) curve.

Author Contributions

Conceptualization, C.S., L.R. and A.M.; methodology, C.S.; software, C.S., formal analysis; C.S., investigation, C.S., L.R. and A.M.; writing—original draft preparation, C.S., writing—review and editing, C.S., L.R. and A.M.; supervision, L.R. and A.M.; funding acquisition; L.R. and A.M. All authors have read and agreed to the published version of the manuscript.

Funding

The work in our research groups was funded by the grants RTI2018-095021-J-I00 (funded by (MCIU/AEI/FEDER, UE) and AGL2016-78311-R (funded by (MINECO/AEI/FEDER, UE).

Institutional Review Board Statement

Not applicable.

Informed Consent Statement

Not applicable.

Data Availability Statement

Metagenome sequences from public repositories were used to conduct this study: infant metagenome dataset from Sequence Read Archive (SRA) deposited under BioProject identity PRJNA473126 (sample accession codes SAMN09259835–SAMN09260236) and adult metagenome dataset from MG-RAST deposited under MG-RAST identity mgp13068 (MG-RAST ID of sequences mgm4624578.3–mgm4624657.3).

Acknowledgments

Carlos Sabater acknowledges his Postdoctoral research contract funded by the Instituto de Investigación Sanitaria del Principado de Asturias (ISPA) and Postdoctoral research contract Juan de la Cierva-Formación from the Spanish Ministry of Science and Innovation (FJC2019-042125-I).

Conflicts of Interest

The authors declare no conflict of interest.

References

  1. Castro-Bravo, N.; Wells, J.M.; Margolles, A.; Ruas-Madiedo, P. Interactions of surface exopolysaccharides from Bifidobacterium and Lactobacillus within the intestinal environment. Front. Microbiol. 2018, 9, 2426. [Google Scholar] [CrossRef] [PubMed] [Green Version]
  2. Sakanaka, M.; Gotoh, A.; Yoshida, K.; Odamaki, T.; Koguchi, H.; Xiao, J.Z.; Kitaoka, M.; Katayama, T. Varied pathways of infant gut-associated Bifidobacterium to assimilate human milk oligosaccharides: Prevalence of the gene set and its correlation with bifidobacteria-rich microbiota formation. Nutrients 2020, 12, 71. [Google Scholar] [CrossRef] [PubMed] [Green Version]
  3. Turroni, F.; Milani, C.; Duranti, S.; Mahony, J.; van Sinderen, D.; Ventura, M. Glycan utilization and cross-feeding activities by bifidobacteria. Trends Microbiol. 2018, 26, 339–350. [Google Scholar] [CrossRef] [PubMed]
  4. Abdelhamid, A.G.; El-Dougdoug, N.K. Comparative genomics of the gut commensal Bifidobacterium bifidum reveals adaptation to carbohydrate utilization. Biochem. Biophys. Res. Commun. 2021, 547, 155–161. [Google Scholar] [CrossRef] [PubMed]
  5. Hidalgo-Cantabrana, C.; Delgado, S.; Ruiz, L.; Ruas-Madiedo, P.; Sánchez, B.; Margolles, A. Bifidobacteria and their health-promoting effects. Microbiol. Spectr. 2017, 5, 73–98. [Google Scholar]
  6. Sabater, C.; Prodanov, M.; Olano, A.; Corzo, N.; Montilla, A. Quantification of prebiotics in commercial infant formulas. Food Chem. 2016, 194, 6–11. [Google Scholar] [CrossRef] [PubMed] [Green Version]
  7. Asnicar, F.; Berry, S.E.; Valdes, A.M.; Nguyen, L.H.; Piccinno, G.; Drew, D.A.; Leeming, E.; Gibson, R.; Le Roy, C.; Al Khatib, H.; et al. Microbiome connections with host metabolism and habitual diet from 1,098 deeply phenotyped individuals. Nat. Med. 2021, 27, 321–332. [Google Scholar] [CrossRef]
  8. Pasolli, E.; Asnicar, F.; Manara, S.; Zolfo, M.; Karcher, N.; Armanini, F.; Beghini, F.; Manghi, P.; Tett, A.; Ghensi, P.; et al. Extensive unexplored human microbiome diversity revealed by over 150,000 genomes from metagenomes spanning age, geography, and lifestyle. Cell 2019, 176, 649–662. [Google Scholar] [CrossRef] [Green Version]
  9. Ong, I.M.; Gonzalez, J.G.; McIlwain, S.J.; Sawin, E.A.; Schoen, A.J.; Adluru, N.; Alexander, A.L.; Yu, J.J.-P. Gut microbiome populations are associated with structure-specific changes in white matter architecture. Transl. Psychiatry 2018, 8, 6. [Google Scholar] [CrossRef] [Green Version]
  10. Mukhtar, K.; Nawaz, H.; Abid, S. Functional gastrointestinal disorders and gut-brain axis: What does the future hold? World J. Gastroenterol. 2019, 25, 552. [Google Scholar] [CrossRef]
  11. McCoubrey, L.E.; Elbadawi, M.; Orlu, M.; Gaisford, S.; Basit, A.W. Harnessing machine learning for development of microbiome therapeutics. Gut Microbes 2021, 13, 1–20. [Google Scholar] [CrossRef]
  12. Westfall, S.; Carracci, F.; Estill, M.; Zhao, D.; Wu, Q.L.; Shen, L.; Simon, J.; Pasinetti, G.M. Optimization of probiotic therapeutics using machine learning in an artificial human gastrointestinal tract. Sci. Rep. 2021, 11, 1067. [Google Scholar] [CrossRef]
  13. Fukui, H.; Nishida, A.; Matsuda, S.; Kira, F.; Watanabe, S.; Kuriyama, M.; Kawakami, K.; Aikawa, Y.; Oda, N.; Arai, K.; et al. Usefulness of Machine Learning-Based Gut Microbiome Analysis for Identifying Patients with Irritable Bowels Syndrome. J. Clin. Med. 2020, 9, 2403. [Google Scholar] [CrossRef]
  14. Liu, F.; Li, P.; Chen, M.; Luo, Y.; Prabhakar, M.; Zheng, H.; He, Y.; Qi, Q.; Long, H.; Zhang, Y.; et al. Fructooligosaccharide (FOS) and galactooligosaccharide (GOS) increase Bifidobacterium but reduce butyrate producing bacteria with adverse glycemic metabolism in healthy young population. Sci. Rep. 2017, 7, 11789. [Google Scholar] [CrossRef]
  15. Sabater, C.; Blanco-Doval, A.; Margolles, A.; Corzo, N.; Montilla, A. Artichoke pectic oligosaccharide characterisation and virtual screening of prebiotic properties using in silico colonic fermentation. Carbohydr. Polym. 2021, 255, 117367. [Google Scholar] [CrossRef]
  16. Baumann-Dudenhoeffer, A.M.; D’Souza, A.W.; Tarr, P.I.; Warner, B.B.; Dantas, G. Infant diet and maternal gestational weight gain predict early metabolic maturation of gut microbiomes. Nat. Med. 2018, 24, 1822–1829. [Google Scholar] [CrossRef]
  17. Kovatcheva-Datchary, P.; Nilsson, A.; Akrami, R.; Lee, Y.S.; De Vadder, F.; Arora, T.; Hallen, A.; Martens, E.; Björck, I.; Bäckhed, F. Dietary fiber-induced improvement in glucose metabolism is associated with increased abundance of Prevotella. Cell Metab. 2015, 22, 971–982. [Google Scholar] [CrossRef] [Green Version]
  18. Li, D.; Luo, R.; Liu, C.M.; Leung, C.M.; Ting, H.F.; Sadakane, K.; Yamashita, H.; Lam, T.W. MEGAHIT v1. 0: A fast and scalable metagenome assembler driven by advanced methodologies and community practices. Methods 2016, 102, 3–11. [Google Scholar] [CrossRef]
  19. Langmead, B.; Wilks, C.; Antonescu, V.; Charles, R. Scaling read aligners to hundreds of threads on general-purpose processors. Bioinformatics 2019, 35, 421–432. [Google Scholar] [CrossRef] [Green Version]
  20. Kang, D.D.; Li, F.; Kirton, E.; Thomas, A.; Egan, R.; An, H.; Wang, Z. MetaBAT 2: An adaptive binning algorithm for robust and efficient genome reconstruction from metagenome assemblies. PeerJ 2019, 7, e7359. [Google Scholar] [CrossRef]
  21. Parks, D.H.; Imelfort, M.; Skennerton, C.T.; Hugenholtz, P.; Tyson, G.W. CheckM: Assessing the quality of microbial genomes recovered from isolates, single cells, and metagenomes. Genome Res. 2015, 25, 1043–1055. [Google Scholar] [CrossRef] [Green Version]
  22. Wood, D.E.; Lu, J.; Langmead, B. Improved metagenomic analysis with Kraken 2. Genome Biol. 2019, 20, 257. [Google Scholar] [CrossRef] [Green Version]
  23. Zhang, H.; Yohe, T.; Huang, L.; Entwistle, S.; Wu, P.; Yang, Z.; Busk, P.K.; Xu, Y.; Yin, Y. dbCAN2: A meta server for automated carbohydrate-active enzyme annotation. Nucleic Acids Res. 2018, 46, W95–W101. [Google Scholar] [CrossRef] [Green Version]
  24. Mistry, J.; Finn, R.D.; Eddy, S.R.; Bateman, A.; Punta, M. Challenges in homology search: HMMER3 and convergent evolution of coiled-coil regions. Nucleic Acids Res. 2013, 41, e121. [Google Scholar] [CrossRef] [Green Version]
  25. Mistry, J.; Chuguransky, S.; Williams, L.; Qureshi, M.; Salazar, G.A.; Sonnhammer, E.L.; Tosatto, S.C.E.; Paladin, L.; Rai, S.; Richardson, L.J.; et al. Pfam: The protein families database in 2021. Nucleic Acids Res. 2021, 49, D412–D419. [Google Scholar] [CrossRef]
  26. Sabater, C.; Ruiz, L.; Delgado, S.; Ruas-Madiedo, P.; Margolles, A. Valorization of Vegetable Food Waste and By-Products Through Fermentation Processes. Front. Microbiol. 2020, 11, 2604. [Google Scholar] [CrossRef]
  27. Sabater, C.; Sabater, V.; Olano, A.; Montilla, A.; Corzo, N. Ultrasound-assisted extraction of pectin from artichoke by-products. An artificial neural network approach to pectin characterisation. Food Hydrocoll. 2020, 98, 105238. [Google Scholar] [CrossRef]
  28. Stacklies, W.; Redestig, H.; Scholz, M.; Walther, D.; Selbig, J. pcaMethods—A bioconductor package providing PCA methods for incomplete data. Bioinformatics 2007, 23, 1164–1167. [Google Scholar] [CrossRef]
  29. Friedman, J.; Hastie, T.; Tibshirani, R. Regularization paths for Generalized Linear Models via coordinate descent. J. Stat. Softw. 2010, 33, 1–22. Available online: http://www.jstatsoft.org/v33/i01/ (accessed on 11 April 2021). [CrossRef] [Green Version]
  30. Liaw, A.; Wiener, M. Classification and Regression by randomForest. R News 2002, 2, 18–22. Available online: https://cran.r-project.org/web/packages/randomForest/index.html (accessed on 11 April 2021).
  31. Venables, W.N.; Ripley, B.D. Modern Applied Statistics with S, 4th ed.; Springer: New York, NY, USA, 2002; ISBN 0-387-95457-0. [Google Scholar] [CrossRef]
  32. Epskamp, S.; Cramer, A.O.; Waldorp, L.J.; Schmittmann, V.D.; Borsboom, D. qgraph: Network visualizations of relationships in psychometric data. J. Stat. Softw. 2012, 48, 1–18. [Google Scholar] [CrossRef] [Green Version]
  33. Schwager, E.; Bielski, C.; Weingart, G. Ccrepe: Ccrepe_And_Nc.Score. R Package Version 1.22.0. 2019. Available online: https://bioconductor.org/packages/ccrpe (accessed on 11 April 2021).
  34. Whelan, F.J.; Rusilowicz, M.; McInerney, J.O. Coinfinder: Detecting significant associations and dissociations in pangenomes. Microb. Genom. 2020, 6. [Google Scholar] [CrossRef] [PubMed]
  35. Matysiak, A.; Kabza, M.; Karolak, J.A.; Jaworska, M.M.; Rydzanicz, M.; Ploski, R.; Szaflik, J.P.; Gajecka, M. Characterization of Ocular Surface Microbial Profiles Revealed Discrepancies between Conjunctival and Corneal Microbiota. Pathogens 2021, 10, 405. [Google Scholar] [CrossRef] [PubMed]
  36. Singh, R.P. Glycan utilisation system in Bacteroides and Bifidobacteria and their roles in gut stability and health. Appl. Microbiol. Biotechnol. 2019, 103, 7287–7315. [Google Scholar] [CrossRef]
  37. Koç, F.; Mills, S.; Strain, C.; Ross, R.P.; Stanton, C. The public health rationale for increasing dietary fibre: Health benefits with a focus on gut microbiota. Nutr. Bull. 2020, 45, 294–308. [Google Scholar] [CrossRef]
  38. Hill, C.J.; Lynch, D.B.; Murphy, K.; Ulaszewska, M.; Jeffery, I.B.; O’Shea, C.A.; Watkins, C.; Dempsey, E.; Mattivi, F.; Tuohy, K.; et al. Evolution of gut microbiota composition from birth to 24 weeks in the INFANTMET Cohort. Microbiome 2017, 5, 4. [Google Scholar] [CrossRef] [Green Version]
  39. Song, Y.; Könönen, E.; Rautio, M.; Liu, C.; Bryk, A.; Eerola, E.; Finegold, S.M. Alistipes onderdonkii sp. nov. and Alistipes shahii sp. nov., of human origin. Int. J. Syst. Evol. Microbiol. 2006, 56, 1985–1990. [Google Scholar] [CrossRef]
  40. Ruas-Madiedo, P.; Gueimonde, M.; Fernández-García, M.; Clara, G.; Margolles, A. Mucin degradation by Bifidobacterium strains isolated from the human intestinal microbiota. Appl. Environ. Microbiol. 2008, 74, 1936–1940. [Google Scholar] [CrossRef] [Green Version]
  41. O’Callaghan, A.; van Sinderen, D. Bifidobacteria and their role as members of the human gut microbiota. Front. Microbiol. 2016, 7, 925. [Google Scholar] [CrossRef] [Green Version]
  42. Lugli, G.A.; Alessandri, G.; Milani, C.; Mancabelli, L.; Ruiz, L.; Fontana, F.; Borragán, S.; González, A.; Turroni, F.; Ossiprandi, M.C.; et al. Evolutionary development and co-phylogeny of primate-associated bifidobacteria. Environ. Microbiol. 2020, 22, 3375–3393. [Google Scholar] [CrossRef]
  43. Pokusaeva, K.; Fitzgerald, G.F.; van Sinderen, D. Carbohydrate metabolism in Bifidobacteria. Genes Nutr. 2011, 6, 285–306. [Google Scholar] [CrossRef] [Green Version]
  44. Urashima, T.; Asakuma, S.; Leo, F.; Fukuda, K.; Messer, M.; Oftedal, O.T. The predominance of type I oligosaccharides is a feature specific to human breast milk. Adv. Nutr. 2012, 3, 473S–482S. [Google Scholar] [CrossRef] [Green Version]
  45. Xiao, J.Z.; Takahashi, S.; Nishimoto, M.; Odamaki, T.; Yaeshima, T.; Iwatsuki, K.; Kitaoka, M. Distribution of in vitro fermentation ability of lacto-N-biose I, a major building block of human milk oligosaccharides, in bifidobacterial strains. Appl. Environ. Microbiol. 2010, 76, 54–59. [Google Scholar] [CrossRef] [Green Version]
Figure 1. Heatmap showing the presence of different glycosidases (indicated as black cells) in metagenome-assembled genomes (MAGs). Specifically, glycosidases capable of degrading galacto- and fructo-oligosaccharides (GOS and FOS), as well as human milk oligosaccharides (HMOs), are illustrated. Black and white cells indicate the presence and absence of a specific CAZy family, respectively. Codes corresponding to the CAZy family of each enzyme were assigned. MAGs from Bifidobacterium are highlighted in black. (top) Glycosidase functional domains corresponding to CAZy families GH5 1, GH5 10, GH5 21, GH5 41, GH58 and GH68 were not identified in MAGs from the species shown in this section of the heatmap (vertical axis) and are not illustrated. (middle) Glycosidase functional domains corresponding to CAZy families GH5 5, GH5 7, GH5 8, GH5 10, GH5 18, GH5 21, GH5 38, GH30 2, GH30 6, GH30 9, GH68, GH139 and GH147 were not identified in MAGs from the species shown in this section of the heatmap (vertical axis) and are not illustrated. (bottom) Glycosidase functional domains corresponding to CAZy families GH5 5, GH5 18, GH5 22, GH5 38, GH5 41, GH30, GH30 9, GH58 and GH147 were not identified in MAGs from the species shown in this section of the heatmap (vertical axis) and are not illustrated.
Microorganisms 09 01034 g001aMicroorganisms 09 01034 g001bMicroorganisms 09 01034 g001c
Figure 2. Artificial neural network-based principal component analysis (PCA) of glycosidase activities encoded in metagenome-assembled genomes (MAGs). MAG distribution is illustrated according to two different criteria: characteristic profiles of MAG-recovered Bifidobacterium species (A), differences in MAGs from all identified species (including not only bifidobacteria) (B) and only bifidobacteria species (C) depending on the diet. GOS: galacto-oligosaccharides, FOS: fructo-oligosaccharides.
Microorganisms 09 01034 g002
Figure 3. Artificial neural network (ANN) architecture computed to classify metagenome-assembled genomes (MAGs) of B. adolescentis, B. bifidum, B. breve, B. longum and B. pseudocatenulatum based on their glycosidase activities. Weights are color-coded by sign (black +, gray -); thickness is in proportion to magnitude.
Microorganisms 09 01034 g003
Figure 4. Correlation network illustrating positive and negative associations between glycosidase activities capable of degrading galacto- and fructo-oligosaccharides (GOS and FOS) as well as human milk oligosaccharides (HMOs), encoded in metagenome-assembled genomes (MAGs) from all species identified (bifidobacteria or not). Blue lines indicate positive associations, while saffron lines suggest negative associations. Line thickness is in proportion to magnitude. Specific activities included in each glycosidase family can be found in Supplementary Materials Table S3.
Microorganisms 09 01034 g004
Figure 5. Correlation network illustrating positive and negative associations between glycosidase activities capable of degrading galacto- and fructo-oligosaccharides (GOS and FOS) as well as human milk oligosaccharides (HMOs), encoded in metagenome-assembled genomes (MAGs) from Bifidobacterium. Blue lines indicate positive associations, while saffron lines suggest negative associations. Line thickness is in proportion to magnitude. Specific activities included in each glycosidase family can be found in Supplementary Materials Table S3.
Microorganisms 09 01034 g005
Publisher’s Note: MDPI stays neutral with regard to jurisdictional claims in published maps and institutional affiliations.

