Abstract
Marian Cove is experiencing some of the most rapid environmental changes in the Antarctic region; however, little is known about the response of bacterial communities to these changes. The main purpose of this study was to investigate the spatial variation of physical–biogeochemical–bacterial community features in the Marian Cove surface waters and the environmental parameters governing the spatial variation in the bacterial community composition during the summer of 2018. The Marian Cove surface waters are largely composed of two different characteristics of water masses: relatively low-temperature, -salinity, and -nutrient surface glacier water (named SGW) and relatively high-temperature, -salinity, and -nutrient surface Maxwell Bay water (named SMBW). The SGW bacterial communities were dominated by unclassified Cryomorphaceae, Sedimenticola, and Salibacter genera, while the SMBW bacterial communities were dominated by Sulfitobacter, Arcobacter, and Odoribacter genera. Spatial variations in bacterial community composition were mainly attributed to physical and biogeochemical characteristics, suggesting that the bacterial community composition of the Marian Cove surface waters is mainly determined by environmental characteristics. These findings provide a foundation to improve the understanding of bacterial community variations in response to a rapidly changing Marian Cove in the Antarctic.
1. Introduction
Antarctic regions have played an important role in regulating the earth’s climate system, not only on a glacial–interglacial timescale but also during the Anthropocene era [1,2]. In spite of harsh environmental conditions, such as low temperatures and extreme seasonal variations, the Antarctic aquatic ecosystem has shown active and diverse microbial communities [3], driving biogeochemical cycles and supporting higher trophic levels. Recently, Antarctic regions have been undergoing rapid warming at alarming rates [4], which is a serious threat to ice-based polar ecosystems. In particular, the water temperature of the western Antarctic Peninsula has risen by about 2 °C since 1950, which has had a significant effect on the reduction of the total icy area of the peninsula [5,6].
Marian Cove, which is located between Weaver and Barton Peninsulas (Figure 1), is one of the regions of the western Antarctic Peninsula where rapid environmental changes have occurred. In particular, Marian Cove has experienced a rapidly increased inflow of freshwater as a result of substantial glacier retreat (decline of 1.7 km since 1956 in summertime) [7,8,9,10,11], leading to the prediction that strong stratification will form and, in turn, result in a shift to a nutrient-limited ecosystem [12]. Previous studies pointed out that increasing freshwater inflow can alter environmental characteristics and change the community composition of living organisms (e.g., algae and benthic species) in Marian Cove [13,14,15,16,17,18]. In addition, it was reported that the bacterial community was significantly different within Maxwell Bay [19,20], possibly reflecting that bacterial community composition is substantially influenced by surrounding physical and biogeochemical properties [13,16,17].
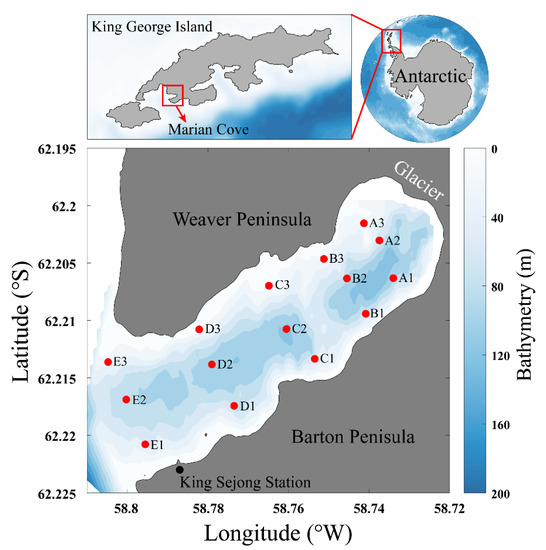
Figure 1.
Map showing the sampling locations in Marian Cove, King George Island, Antarctic. The color bar indicates water depth in meters.
Given that studies about the variations of microbial communities in various environments have profoundly increased our understanding of the responses of bacterial communities to environmental changes [17], Marian Cove can be considered an appropriate place to investigate the impact of climate change on Antarctic aquatic ecosystems via investigations of variation in bacterial communities. However, little is known about even the spatial distribution of the bacterial community and its control factors in Marian Cove to date. To predict the response of Marian Cove aqueous ecosystems to ongoing environmental changes, an intensive investigation of the spatial variation in bacterial community composition and its controlling physical and biogeochemical factors is important.
Therefore, the main purpose of this study was, for the first time, to (1) present the spatial distributions of physical–biogeochemical–bacterial community features in Marian Cove surface waters during summer, (2) investigate the environmental parameters governing the spatial variation in the bacterial community composition, and (3) provide significant insight into the alteration of the Marian Cove bacterial community in response to rapid Antarctic environmental changes.
2. Materials and Methods
2.1. Sample Collection
Marian Cove is a small cove, 4.5 km in length, 1.5 km in width, and up to 120 m deep (Figure 1 and Table 1) [7]. Marian Cove is characterized by the continuous inflows of seawater and freshwater [21]. Seawaters enter Marian Cove via Maxwell Bay along the western Antarctic Peninsula in the Bellingshausen Sea [22]. In January 2018, surface seawaters (at ~1 m depth) were collected from 15 different stations located between the glacier present inside Marian Cove and Maxwell Bay using 5 L Niskin bottles (Table 1). For bacterial community analysis, 2 L of seawater in each station was filtered through a 0.2-μm membrane (Whatman 47 mm polycarbonate membrane) to capture the microbial cells. Filtered samples were then immediately frozen and stored at −80 °C until DNA extraction.

Table 1.
Information of sampling locations, physicochemical properties, number of reads, operational taxonomic unit (OTU), richness (Chao1), and diversity (Shannon).
2.2. Measurement of Physical and Biogeochemical Parameters
Physical and biogeochemical parameters of the water samples were measured at each station. Water temperature (T), salinity (S), and dissolved oxygen were measured using a conductivity–temperature–depth instrument (CTD; RBR Ltd., Ottawa, ON, Canada). For nutrient analysis, the sample at each station was filtered through a 0.2-µm syringe filter (Sartorius, Cat. No 16532), placed in a 50-mL conical tube, and stored at −20 °C until measurement. After thawing the frozen seawater, phosphate (PO4), nitrate and nitrite (NO3 + NO2), silicate (SiO2), and ammonium (NH4) were measured using an autoanalyzer (Quaatro, Seal Analytical, Germany). Dissolved inorganic nitrogen (DIN) is represented as the sum of NH4 + NO3 + NO2.
2.3. DNA Extraction, 16S rRNA Gene Amplification, and Sequencing
To assess the bacterial community composition, DNA from the filter paper was extracted using the PowerSoil® DNA Isolation Kit (Cat. No 12888, MOBIO), according to the manufacturer’s protocol. Quantitative and qualitative analyses of DNA were carried out using PicoGreen and Nanodrop, respectively. Polymerase chain reaction (PCR) was carried out to amplify the V3–V4 regions from the extracted environmental DNA, a variable sequence of the 16S rRNA gene, using primers 341F and 805R [23]. The PCR products were standardized using PicoGreen, and the library size was verified using a TapeStation DNA screen tape D1000 (Agilent). Sequencing was performed using the MiSeq™ platform (Illumina, San Diego, CA, USA). The paired-end sequence generated as a result of the sequencing was merged using FLASH (v. 1.2.11) to obtain a single long sequence [24]. The sequence was obtained by removing low-quality sequences, ambiguous sequences, and chimera sequences, which are regarded as sequencing errors; denoising by using the operational taxonomic unit (OTU) analysis program CD-HIT-OTU, and then clustering sequences with 97% or more sequence similarity at the species level of OTU [25]. QIIME (v. 1.8.0) was used to analyze microbial populations (Alpha and Beta Diversity, Multiple Alignment, Phylogeny), and each OTU was compared to the National Center for Biotechnology Information (NCBI) DB (16S Microbial DB) [26]. Raw sequence data were deposited in the NCBI with Sequence Read Archive (SRA) accession number PRJNA533713. Finally, a total of 650,487 reads were obtained from 15 samples and were clustered into 1467 OTUs (Table 1).
2.4. Statistical Analysis
To analyze the relationship between stations and environmental parameters, principal component analysis (PCA) was performed using the R stats package (v. 3.5.2, http://www.r-project.org/) [27]. Permutational multivariate analysis of variance (PERMANOVA) was used to investigate grouping from the relationship between bacterial community composition and environmental parameters using the PERMANOVA+ in Primer6 (v. 6.1.16) program [28] and then visualized on principal coordinates analysis (PCoA) ordination using the Primer6 (ver. 6.1.16) program [29]. Heatmaps were visualized using the R packages (i.e., Heatplus v. 1.3, vegan v. 2.5-6, gplots v. 3.0.1.1, and RColorBrewer v. 1.1-2), and, for clustering analysis, Bray-Curtis dissimilarity was used to determine similarity among bacterial communities using the R package vegan (v. 2.5-6) [30,31]. The indicator species analysis was generated using R package indicSpecies (ver. 1.7.9). Spearman’s rank–order correlation coefficients were calculated for non-normally distributed data (i.e., between the relative abundance of bacterial compositions and physical and biogeochemical variables) using the R package vegan (ver. 2.5-6) [32,33].
3. Results and Discussion
3.1. Physicochemical Characteristics and Bacterial Community Composition
We used T and S data collected in Marian Cove during the summer of 2018 to investigate the physical characteristics of surface waters on a T–S diagram (Table 1 and Figure 2a). Based on the data distribution pattern, two different water masses were found to be involved in the mixing process in the study area: relatively low T and S water (named surface glacier water, SGW) and relatively high T and S water (named surface Maxwell Bay water, SMBW). The mean T and S values of surface waters were relatively low in the SGW region (~1.0 °C and 32.8, respectively) compared with those in the SMBW region (~2.2 °C and 33.3, respectively) (Figure 2b,c). SGW covered the regions of A1–C3, and SMBW covered the regions of D1–E3 (Figure 1 and Figure 2b,c). The observation of lowest S in A3 could be because the glacier collapsed at the time of sampling (Figure 2a,c), and the debris flowed directly into the surface Marian Cove waters. The physical properties of Marian Cove surface waters showed a gradual physical gradient between the cold and fresh SGW and warm and saline SMBW (Figure 2a–c).Surface waters also exhibited a nutrient gradient similar to the physical parameters in Marian Cove (Figure 2d). Differences in DIN and PO4 concentrations were also apparent between the SGW and SMBW regions (Figure 2e,f). The mean DIN and PO4 concentration were relatively low in the SGW region (~19.3 and 1.69 μM, respectively) compared with those in the SMBW region (~27.7 and 1.77 μM, respectively) (Figure 2e,f). In summary, the SGW region is characterized as having relatively low T, S, and nutrients, while the SMBW region has relatively high T, S, and nutrients. Therefore, the Marian Cove surface water samples showed a physical and biogeochemical gradient between the SGW and SMBW regions (Figure 2).
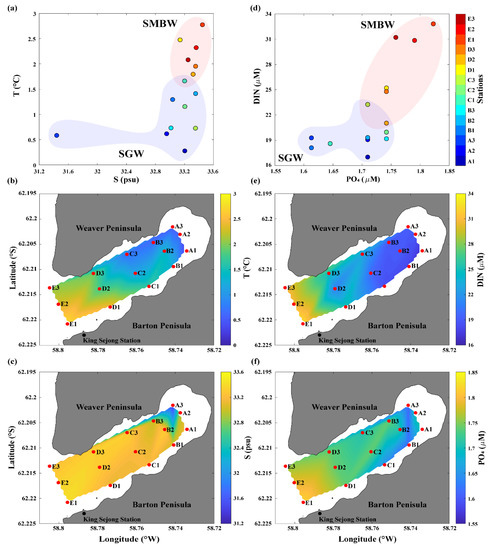
Figure 2.
Physical and biogeochemical properties of the Marian Cove surface waters during the summer of 2018: (a) temperature (T)–salinity (S) diagram, spatial distribution of (b) T and (c) S, (d) dissolved inorganic nitrogen (DIN)–phosphate (PO4) plot, and the surface distribution of (e) DIN and (f) PO4.
To characterize the difference in bacterial community compositions with space, the relative abundance (%) of bacterial communities at the class level was analyzed (Figure 3). In the SGW regions, Gammaproteobacteria (mean: 41%), unclassified Bacteroidetes (mean: 35%), Alphaproteobacteria (mean: 15%), and unclassified Cyanobacteria (mean: 5%) were the dominant classes, accounting for >90% of the relative abundance (Figure 3). Meanwhile, five classes of unclassified Bacteroidetes (mean: 37%), Alphaproteobacteria (mean: 24%), Gammaproteobacteria (mean: 20%), Epsilonproteobacteria (mean: 9%), and Bacteroidia (mean: 6%) were the dominant classes in the SMBW region, accounting for >90% of the relative abundance (Figure 3). Alphaproteobacteria and Gammaproteobacteria are known to be predominant in the ocean, and Betaproteobacteria are predominant in freshwaters, such as rivers and lakes [34,35]. The relative abundance results of this study confirmed that the bacterial taxonomy was different in the SGW and SMBW stations.
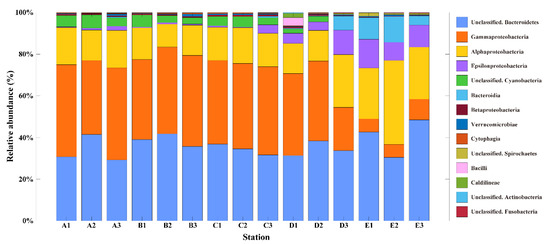
Figure 3.
The relative abundance (%) of the surface Marian Cove bacterial communities at the class level during the summer of 2018. Note that taxa occurred at >1 % in a total sum of relative abundance of all stations were represented.
Based on PCA (Figure 4a), the stations were well divided into two distinct groups of SGW and SMBW; SGW stations were closely linked to SiO2, while SMBW stations were associated with T, S, DIN, and PO4. In line with PCA, PCoA also showed that the bacterial community composition along the stations was likely to be distinctly separated into SGW and SMBW groups (Figure 4b). In addition, the investigation of the difference in dominant phylogenetic bacterial taxa at the genus level for each station revealed that they were well clustered into SGW and SMBW groups (Figure 4c), except for the D2 station. Overall, these results suggest that the environmental characteristics of the surface of the Marian Cove waters played an important role in determining the surface Marian Cove bacterial community composition during the summer of 2018 [19,20,36].
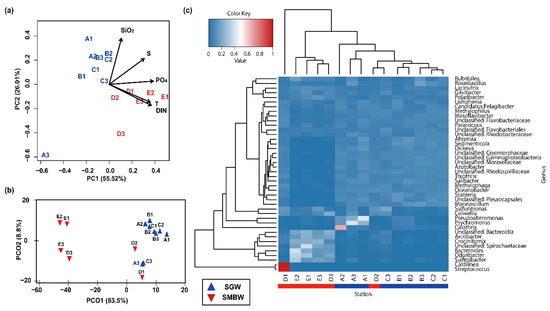
Figure 4.
(a) Principal component analysis (PCA) ordination biplot of sampling stations with environmental parameters (physical: T and S; biogeochemical: DIN, PO4, and SiO2). The two components (PC1 and PC2) explained 73.46% of the total variation in environmental data. (b) Principal coordinates analysis (PCoA) ordination plot of Bray–Curtis dissimilarity calculated from the relationship between bacterial community composition at the genus level and environmental parameters using PERMANOVA analysis (F statistic = 15.6 with p < 0.001). (c) Heatmap shows the relative abundance at the genus level (>1 % in a total sum of relative abundance of all stations), and the dendrogram shows the hierarchical clustering of each bacterial taxa and station.
Uniquely, a high relative abundance of Streptococcus (3.6%), which commonly inhabits the guts of Antarctic penguins and birds [37,38], was found at the D1 station (Figure 4c). This station is likely to be influenced by the influx of excrements from a variety of terrestrial organisms and shows the greatest richness and diversity of bacterial taxa (Table 1).
Polaribacter (of the class Bacteroidia) was one of the dominant bacterial groups in the surface of the Marian Cove waters (Figure 4c). According to indicator species analysis (Figure 5), Salibacter, unclassified Cryomorphaceae, and Sedimenticola were relatively dominant in the SGW region, whereas Arcobacter, Odoribacter, and Sulfitobacter were relatively dominant in the SMBW region. The relative abundance of Sulfitobacter (family Rhodobacteraceae), which are known to play a role in the degradation of dimethylsulfoniopropionate (DMSP) to dimethyl sulfide (DMS) in the sulfur pathway [39,40], varied from 1.9% to 34.7% in the study area, but was higher in the SMBW region (14.8%) than in the SGW region (2.5%), indicating that decomposition of organic matters is likely to be more active in the SMBW region than in the SGW region.
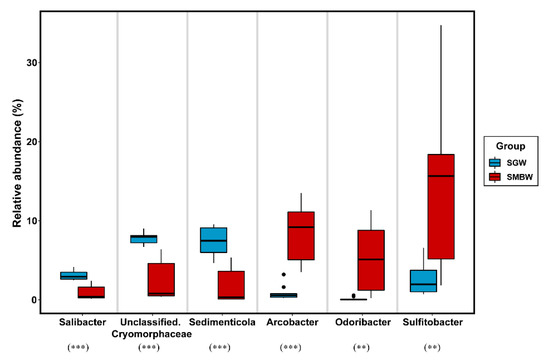
Figure 5.
Boxplots to represent indicator species analysis at the genus level in the SGW and SMBW groups. Filled dots represent outliers. The symbols of ** and *** indicate a p value of less than 0.01 and 0.001, respectively.
It is known that alteration of bacterial community composition is attributed to environmental changes [23,41,42]. Ardley and Great Wall Coves, having similar physical properties to the neighboring Marian Cove, are also experiencing increased freshwater inflows due to rapid glacier retreat [20]. The primary dominant bacteria were Alphaproteobacteria and Gammaproteobacteria, but Betaproteobacteria were commonly found in the inner regions of Ardley, Great Wall, and Marian Coves (Figure 6), which are influenced by freshwater inputs (Figure 6). This result supports the claim that the inflow of freshwater from melting glaciers has a significant impact on the surface bacterial community composition. Thus, if glacier retreat is accelerated due to global warming and climate change, the alteration of the bacterial community composition in the regions where glacier retreat takes place in polar marine environments will be obvious.
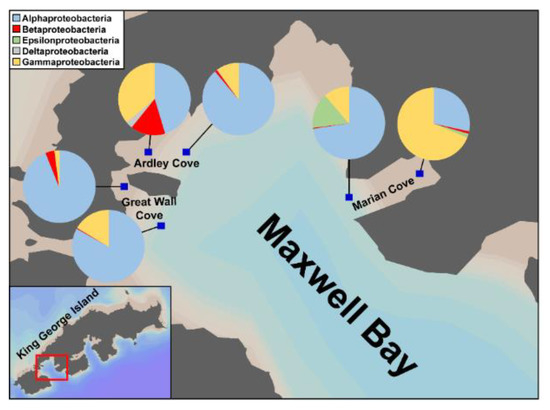
Figure 6.
Comparison of bacterial community composition in Antarctic Ardley, Great Wall, and Marian Coves. Pie charts show the relative abundance of bacterial communities at the class level (associated with the phylum level of Proteobacteria) at each location (blue squares). Note that the Ardley and Great Wall Coves data are reproduced from the results of previous study [20] and the Marian Cove data are from the results of this study.
3.2. Environmental Factors Determining Bacterial Community Compositions
In order to investigate the influence of environmental factors on surface bacterial community composition at the genus level, we conducted a correlation analysis between taxa occurred at >1% in a total sum of relative abundance of all stations and physical and biogeochemical parameters (physical: T and S; biogeochemical: DIN, PO4, and SiO2) (Figure 7). Unclassified Cryomorphaceae, Sedimenticola, and Salibacter, which are dominant in the SGW region, showed significant negative correlations with T, S, DIN, and PO4, suggesting that the SGW bacterial compositions were associated with relatively cold, fresh, and less eutrophic conditions. Dominant genera in the SMBW region were Sulfitobacter, Arcobacter, and Odoribacter, which exhibited significant positive correlations with physical and biogeochemical parameters, suggesting that the SMBW bacterial compositions were mainly influenced by the variability of physical properties and nutrient conditions [43]. These results support the claim that the composition of bacterial communities in Marian Cove surface waters is largely determined by environmental characteristics.
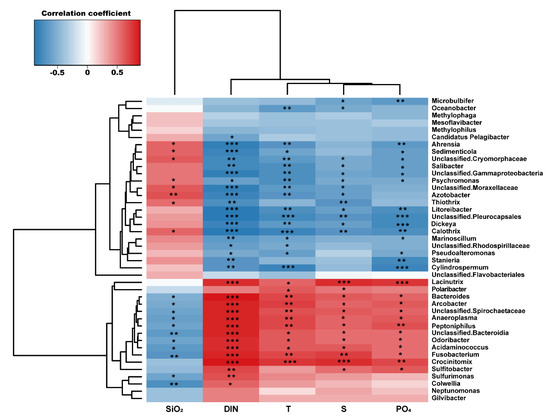
Figure 7.
Heatmap from Spearman correlations between environmental parameters (physical: T and S; biogeochemical: DIN, PO4, and SiO2) and the bacterial community at the genus level (>1% in a total sum of relative abundance of all stations). The symbols *, **, and *** indicate a p-value less than 0.05, 0.01, and 0.001, respectively.
3.3. Implication for the Surface Marian Cove Bacterial Community Change
Based on the results of this study, at present the marine bacterial community composition (e.g., Sulfitobacter, Arcobacter, and Odoribacter at the genus level) was more dominant than the freshwater composition (e.g., Sedimenticola and Salibacter at the genus level) in the Marian Cove surface waters. Rapid environmental changes in the Antarctic will directly and indirectly affect Antarctic bacterial community compositions. Marian Cove is one of the Antarctic regions undergoing rapid environmental changes due to global warming [15]. In particular, rapid glacier retreat has been found in Marian Cove [7,8,9,10,11,44,45,46,47,48,49], leading to an increase in the inflow of freshwaters into the cove. This phenomenon will, in turn, form strong vertical stratification, limiting the supply of nutrients into the euphotic zone and ultimately lowering primary production. As a result, in the future, the surface Marian Cove bacterial community composition may be shifted from marine to freshwater-dominated genera as a result of freshening environmental change. Such future changes may occur in a number of coves of the Antarctic. Therefore, there is an urgent need to examine how these changes will ultimately affect the Earth’s climate system.
4. Summary and Conclusions
We investigated physical–biogeochemical properties and bacterial community composition observed during the summer of 2018 in the Marian Cove surface waters. The SGW region is characterized as having relatively low T, S, and nutrients, while the SMBW region has relatively high T, S, and nutrients. Thus, the Marian Cove surface water samples showed a physical and biogeochemical gradient between the SGW and SMBW regions. In the SGW region, unclassified Cryomorphaceae, Sedimenticola, and Salibacter at the genus level were the dominant groups, and Sulfitobacter, Arcobacter, and Odoribacter genera were dominant in the SMBW region. Overall, the SGW bacterial community composition showed negative correlations with environmental parameters, whereas the SMBW bacterial community composition was positively correlated with environmental parameters. This contrast supports that the bacterial community composition of the Marian Cove surface waters is significantly determined by environmental characteristics. Therefore, attention should be paid to how the Marian Cove bacterial community will be altered in the future in response to rapidly changing Antarctic environments.
Author Contributions
Conceptualization, S.K. and I.-N.K.; investigation, S.K.; supervision, I.N.K. and J.-H.K.; visualization, S.K. and J.-M.H.; writing—original draft, S.K. and I.-N.K.; writing—review & editing, S.K., J.-H.K., J.-H.L., J.-H.J., J.-M.H., and I.-N.K. developed the concept and design of the manuscript. All authors have read and agreed to the published version of the manuscript.
Funding
This work was supported by a grant from the National Institute of Fisheries Science (R2020026) and the National Research Foundation of Korea (NRF) grant funded by the Korea government (MSIT) (NRF-2019R1A4A1026423).
Acknowledgments
We would like to thank the KOPRI people (King Sejong Station) for their help in many ways during the summer 2018 Marian Cove survey. Special thanks to Ki-Tae Park for in situ sampling. We would like to thank two anonymous reviewers for their valuable comments.
Conflicts of Interest
The authors declare no conflict of interest.
References
- Sigman, D.M.; Boyle, E.A. Glacial/Interglacial Variations in Atmospheric Carbon Dioxide. Nature 2000, 407, 859–869. [Google Scholar] [CrossRef] [PubMed]
- Arrigo, K.R.; van Dijken, G.; Long, M. Coastal Southern Ocean: A Strong Anthropogenic CO2 Sink. Geophys. Res. Lett. 2008, 35, L21602. [Google Scholar] [CrossRef]
- Cavicchioli, R. Microbial Ecology of Antarctic Aquatic Systems. Nat. Rev. Microbiol. 2015, 13, 691–706. [Google Scholar] [CrossRef] [PubMed]
- Schmidtko, S.; Heywood, K.J.; Thompson, A.F.; Aoki, S. Multidecadal Warming of Antarctic Waters. Science 2014, 346, 1227–1231. [Google Scholar] [CrossRef] [PubMed]
- Cook, A.J.; Holland, P.R.; Meredith, M.P.; Murray, T.; Luckman, A.; Vaughan, D.G. Ocean Forcing of Glacier Retreat in the Western Antarctic Peninsula. Science 2016, 353, 283–286. [Google Scholar] [CrossRef]
- Stenni, B.; Curran, M.A.; Abram, N.; Orsi, A.; Goursaud, S.; Masson-Delmotte, V.; Neukom, R.; Goosse, H.; Divine, D.; Van Ommen, T. Antarctic Climate Variability on Regional and Continental Scales Over the Last 2000 Years. Clim. Past 2017, 13, 1609–1634. [Google Scholar] [CrossRef]
- Yoo, K.; Kyung Lee, M.; Il Yoon, H.; Il Lee, Y.; Yoon Kang, C. Hydrography of Marian Cove, King George Island, West Antarctica: Implications for Ice-Proximal Sedimentation during Summer. Antarct. Sci. 2015, 27, 185–196. [Google Scholar] [CrossRef]
- Cook, A.J.; Fox, A.J.; Vaughan, D.G.; Ferrigno, J.G. Retreating Glacier Fronts on the Antarctic Peninsula Over the Past Half-Century. Science 2005, 308, 541–544. [Google Scholar] [CrossRef]
- Turner, J.; Overland, J.E.; Walsh, J.E. An Arctic and Antarctic Perspective on Recent Climate Change. Int. J. Climatol. 2007, 27, 277–293. [Google Scholar] [CrossRef]
- Meredith, M.P.; King, J.C. Rapid Climate Change in the Ocean West of the Antarctic Peninsula during the Second Half of the 20th Century. Geophys. Res. Lett. 2005, 32, L19604. [Google Scholar] [CrossRef]
- Vaughan, D.G. Recent Trends in Melting Conditions on the Antarctic Peninsula and their Implications for Ice-Sheet Mass Balance and Sea Level. Arct. Antarct. Alp. Res. 2006, 38, 147–152. [Google Scholar] [CrossRef]
- Doney, S.C.; Ruckelshaus, M.; Duffy, J.E.; Barry, J.P.; Chan, F.; English, C.A.; Galindo, H.M.; Grebmeier, J.M.; Hollowed, A.B.; Knowlton, N. Climate Change Impacts on Marine Ecosystems. Annu. Rev. Mar. Sci. 2011, 4, 11–37. [Google Scholar] [CrossRef] [PubMed]
- Holben, W.E.; Harris, D. DNA-Based Monitoring of Total Bacterial Community Structure in Environmental Samples. Mol. Ecol. 1995, 4, 627–632. [Google Scholar] [CrossRef] [PubMed]
- Hong, J.; Kim, K.; Lee, S.; Back, J. The Community Structure of Meiofauna in Marian Cove, King George Island, Antarctica. Ocean Polar Res. 2011, 33, 265–280. [Google Scholar] [CrossRef]
- Ahn, I.; Moon, H.; Jeon, M.J.; Kang, S. First Record of Massive Blooming of Benthic Diatoms and their Association with Megabenthic Filter Feeders on the Shallow Seafloor of an Antarctic Fjord: Does Glacier Melting Fuel the Bloom? Ocean Sci. J. 2016, 51, 273–279. [Google Scholar] [CrossRef]
- Torsvik, V.; Øvreås, L. Microbial Diversity and Function in Soil: From Genes to Ecosystems. Curr. Opin. Microbiol. 2002, 5, 240–245. [Google Scholar] [CrossRef]
- Logue, J.; Findlay, S.E.G.; Comte, J. Editorial: Microbial Responses to Environmental Changes. Front. Microbiol. 2015, 6, 1364. [Google Scholar] [CrossRef]
- Lee, W.; Kang, S.; Paul, A.M.; Kwak, I. Temporal Dynamics and Patterning of Meiofauna Community by Self-Organizing Artificial Neural Networks. Ocean Polar Res. 2003, 25, 237–247. [Google Scholar] [CrossRef]
- Moreno-Pino, M.; De la Iglesia, R.; Valdivia, N.; Henríquez-Castilo, C.; Galán, A.; Díez, B.; Trefault, N. Variation in Coastal Antarctic Microbial Community Composition at Sub-Mesoscale: Spatial Distance or Environmental Filtering? FEMS Microbiol. Ecol. 2016, 92, fiw088. [Google Scholar] [CrossRef]
- Zeng, Y.; Yu, Y.; Qiao, Z.; Jin, H.; Li, H. Diversity of Bacterioplankton in Coastal Seawaters of Fildes Peninsula, King George Island, Antarctica. Arch. Microbiol. 2014, 196, 137–147. [Google Scholar] [CrossRef]
- Yoon, H.I.; Han, M.W.; Park, B.; Oh, J.; Chang, S. Glaciomarine Sedimentation and Palaeo-Glacial Setting of Maxwell Bay and its Tributary Embayment, Marian Cove, South Shetland Islands, West Antarctica. Mar. Geol. 1997, 140, 265–282. [Google Scholar] [CrossRef]
- Yoo, K.; Yoon, H.; Oh, J.; Kim, Y.; Kang, C. Water Column Properties and Dispersal Pattern of Suspended Particulate Matter (SPM) of Marian Cove during Austral Summer, King George Island, West Antarctica. Sea 1999, 4, 266–274. [Google Scholar]
- Herlemann, D.P.R.; Labrenz, M.; Jurgens, K.; Bertilsson, S.; Waniek, J.J.; Andersson, A.F. Transitions in Bacterial Communities Along the 2000 km Salinity Gradient of the Baltic Sea. Isme J. 2011, 5, 1571–1579. [Google Scholar] [CrossRef] [PubMed]
- Magoč, T.; Salzberg, S.L. FLASH: Fast Length Adjustment of Short Reads to Improve Genome Assemblies. Bioinformatics 2011, 27, 2957–2963. [Google Scholar] [CrossRef]
- Li, W.; Fu, L.; Niu, B.; Wu, S.; Wooley, J. Ultrafast Clustering Algorithms for Metagenomic Sequence Analysis. Brief. Bioinform. 2012, 13, 656–668. [Google Scholar] [CrossRef]
- Caporaso, J.G.; Kuczynski, J.; Stombaugh, J.; Bittinger, K.; Bushman, F.D.; Costello, E.K.; Fierer, N.; Peña, A.G.; Goodrich, J.K.; Gordon, J.I.; et al. QIIME Allows Analysis of High-Throughput Community Sequencing Data. Nat. Methods 2010, 7, 335–336. [Google Scholar] [CrossRef]
- Gabriel, K.R. The Biplot Graphic Display of Matrices with Application to Principal Component Analysis. Biometrika 1971, 58, 453–467. [Google Scholar] [CrossRef]
- Anderson, M.J. A New Method for Non-parametric Multivariate Analysis of Variance. Austral Ecol. 2001, 26, 32–46. [Google Scholar]
- Clarke, K.; Gorley, R. PRIMER V6: User Manual-Tutorial; Plymouth Marine Laboratory: Plymouth, UK, 2006; pp. 1–190. [Google Scholar]
- Hamady, M.; Lozupone, C.; Knight, R. Fast UniFrac: Facilitating High-Throughput Phylogenetic Analyses of Microbial Communities Including Analysis of Pyrosequencing and PhyloChip Data. Isme J. 2009, 4, 17–27. [Google Scholar] [CrossRef]
- Wilkinson, L.; Friendly, M. The History of the Cluster Heat Map. Am. Stat. 2009, 63, 179–184. [Google Scholar] [CrossRef]
- Bonett, D.G.; Wright, T.A. Sample Size Requirements for Estimating Pearson, Kendall and Spearman Correlations. Psychometrika 2000, 65, 23–28. [Google Scholar] [CrossRef]
- Dongen, S.v.; Enright, A.J. Metric Distances Derived from Cosine Similarity and Pearson and Spearman Correlations. arXiv 2012, arXiv:1208.3145. [Google Scholar]
- Methé, B.A.; Hiorns, W.D.; Zehr, J.P. Contrasts between Marine and Freshwater Bacterial Community Composition: Analyses of Communities in Lake George and Six Other Adirondack Lakes. Limnol. Oceanogr. 1998, 43, 368–374. [Google Scholar] [CrossRef]
- Cottrell, M.T.; Kirchman, D.L. Community Composition of Marine Bacterioplankton Determined by 16S rRNA Gene Clone Libraries and Fluorescence in Situ Hybridization. Appl. Environ. Microbiol. 2000, 66, 5116–5122. [Google Scholar] [CrossRef] [PubMed]
- Dupont, C.L.; Larsson, J.; Yooseph, S.; Ininbergs, K.; Goll, J.; Asplund-Samuelsson, J.; McCrow, J.P.; Celepli, N.; Allen, L.Z.; Ekman, M.; et al. Functional Tradeoffs Underpin Salinity-Driven Divergence in Microbial Community Composition. PLoS ONE 2014, 9, e89549. [Google Scholar] [CrossRef]
- Yew, W.C.; Pearce, D.A.; Dunn, M.J.; Samah, A.A.; Convey, P. Bacterial Community Composition in Adélie (Pygoscelis Adeliae) and Chinstrap (Pygoscelis Antarctica) Penguin Stomach Contents from Signy Island, South Orkney Islands. Polar Biol. 2017, 40, 2517–2530. [Google Scholar] [CrossRef]
- Thouzeau, C.; Froget, G.; Monteil, H.; Le Maho, Y.; Harf-Monteil, C. Evidence of Stress in Bacteria Associated with Long-Term Preservation of Food in the Stomach of Incubating King Penguins (Aptenodytes Patagonicus). Polar Biol. 2003, 26, 115–123. [Google Scholar] [CrossRef]
- Curson, A.R.J.; Rogers, R.; Todd, J.D.; Brearley, C.A.; Johnston, A.W.B. Molecular Genetic Analysis of a Dimethylsulfoniopropionate Lyase that Liberates the Climate-Changing Gas Dimethylsulfide in several Marine A-Proteobacteria and Rhodobacter Sphaeroides. Environ. Microbiol. 2008, 10, 757–767. [Google Scholar] [CrossRef]
- Higuchi, T.; Agostini, S.; Casareto, B.E.; Yoshinaga, K.; Suzuki, T.; Nakano, Y.; Fujimura, H.; Suzuki, Y. Bacterial Enhancement of Bleaching and Physiological Impacts on the Coral Montipora Digitata. J. Exp. Mar. Biol. Ecol. 2013, 440, 54–60. [Google Scholar] [CrossRef]
- Lipson, D.A. Relationships between Temperature Responses and Bacterial Community Structure Along Seasonal and Altitudinal Gradients. FEMS Microbiol. Ecol. 2007, 59, 418–427. [Google Scholar] [CrossRef]
- Campbell, B.J.; Kirchman, D.L. Bacterial Diversity, Community Structure and Potential Growth Rates Along an Estuarine Salinity Gradient. Isme J. 2012, 7, 210–220. [Google Scholar] [CrossRef] [PubMed]
- Yang, J.S. Nutrients, Chlorophyll-a and Primary Productivity in Maxwell Bay, King George Island, Antarctica. KOREAN J. Polar Res. 1990, 1, 11–18. [Google Scholar]
- Lee, J.; Jin, Y.K.; Hong, J.K.; Yoo, H.J.; Shon, H. Simulation of a Tidewater Glacier Evolution in Marian Cove, King George Island, Antarctica. Geosci. J. 2008, 12, 33–39. [Google Scholar] [CrossRef]
- Ahn, I.; Chung, K.H.; Choi, H.J. Influence of Glacial Runoff on Baseline Metal Accumulation in the Antarctic Limpet Nacella Concinna from King George Island. Mar. Pollut. Bull. 2004, 49, 119–127. [Google Scholar] [CrossRef]
- Moon, H.; Wan Hussin, W.M.R.; Kim, H.; Ahn, I. The Impacts of Climate Change on Antarctic Nearshore Mega-Epifaunal Benthic Assemblages in a Glacial Fjord on King George Island: Responses and Implications. Ecol. Indic. 2015, 57, 280–292. [Google Scholar] [CrossRef]
- Vaughan, D.G.; Marshall, G.J.; Connolley, W.M.; King, J.C.; Mulvaney, R. Devil in the Detail. Science 2001, 293, 1777–1779. [Google Scholar] [CrossRef]
- Vaughan, D.G.; Marshall, G.J.; Connolley, W.M.; Parkinson, C.; Mulvaney, R.; Hodgson, D.A.; King, J.C.; Pudsey, C.J.; Turner, J. Recent Rapid Regional Climate Warming on the Antarctic Peninsula. Clim. Chang. 2003, 60, 243–274. [Google Scholar] [CrossRef]
- Park, B.; Chang, S.; Yoon, H.I.; Chung, H. Recent Retreat of Ice Cliffs, King George Island, South Shetland Islands, Antarctic Peninsula. Ann. Glaciol. 1998, 27, 633–635. [Google Scholar] [CrossRef]


© 2020 by the authors. Licensee MDPI, Basel, Switzerland. This article is an open access article distributed under the terms and conditions of the Creative Commons Attribution (CC BY) license (http://creativecommons.org/licenses/by/4.0/).