Article

Analysis of Cytoplasmic and Secreted Proteins of Staphylococcus aureus Revealed Adaptive Metabolic Homeostasis in Response to Changes in the Environmental Conditions Representative of the Human Wound Site

by
Mousa M. Alreshidi
1,*,
R. Hugh Dunstan
2,
Margaret M. Macdonald
2,
Vineet K. Singh
3 and
Tim K. Roberts
2
1
Department of Biology, College of Science, University of Ha’il, Hail P.O. 2440, Saudi Arabia
2
Metabolic Research Group, Faculty of Science, School of Environmental and Life Sciences, University Drive, Callaghan, NSW 2308, Australia
3
Microbiology and Immunology, Kirksville College of Osteopathic Medicine, A.T. Still University of Health Sciences, 800 West Jefferson Street, Kirksville, MO 63501, USA
*
Author to whom correspondence should be addressed.
Microorganisms 2020, 8(7), 1082; https://doi.org/10.3390/microorganisms8071082
Submission received: 23 June 2020 / Revised: 11 July 2020 / Accepted: 15 July 2020 / Published: 20 July 2020
(This article belongs to the Section Molecular Microbiology and Immunology)

Abstract

:
The pathogenesis of Staphylococcus aureus is mainly attributed to its capability to adjust to changes in environmental conditions, including those present on human skin or within a wound site. This study investigated the changes in the cytoplasmic and secreted proteins in S. aureus that occurred in response to alterations in the environmental parameters that could be found in the human wound site. In total, sixty differentially regulated cytoplasmic proteins were detected using a label-free quantification approach, and these proteins were classified into ten molecular functions: protein biosynthesis, glycolysis, signal transduction, metabolism, cell cycle, transport, energy generation, cell anchorage, nucleotide biosynthesis and unknown. These changes represented characteristic protein profiles when evaluated by principal component analysis. The bacterium responded to elevated NaCl at pH 6 by decreasing the abundance of the majority of cytoplasmic proteins, while at pH 8 there was an increase in the levels of cytoplasmic proteins in comparison to the untreated cells. The analysis of the secreted proteins showed that there was a high degree of difference in both the intensity and the distribution of many individual protein bands in response to environmental challenges. From these results, it was deduced that specific metabolic homeostasis occurred under each combination of defined environmental conditions.

Graphical Abstract

1. Introduction

Staphylococcus aureus is a causative agent for many diseases worldwide, ranging from mild skin and tissue infections to highly severe infections, including toxic shock syndrome, endocarditis, and osteomyelitis [1]. S. aureus is considered the leading cause of nosocomial and community infections, although it is classified as a commensal bacterium. However, the exact mechanism that enables the switch from a commensal to a pathogenic lifestyle is unclear [2]. The threat of this bacterium lies in its remarkable and rapid capacity to sense environmental signals and modulate the cellular responses; this is the major challenge for clinicians and scientists [3,4,5]. The capacity of S. aureus to adapt to fluctuations in environmental conditions was proposed to be due to its ability to induce considerable changes in cytoplasmic metabolites and proteins [4,6,7]. These changes usually result in extraordinary alterations in the external morphology. e.g., cell size, cell wall thickness and ultimately colony size and type [8,9]. Small colony variants (SCVs) represent a good model of an altered bacterial phenotype where the colonies formed are ten-fold smaller in diameter compared with normal colonies [10,11,12]. These variants are highly associated with persistent and recurrent infections, although they display attenuated virulence factors [11,13]. Previous studies have demonstrated that S. aureus colonies can be formed into SCVs after growth in less favorable conditions, including low temperature, low pH, and antibiotic exposure [8,9,12,13]. Thus, the formation of SCVs is possibly a mechanism used by staphylococcal species to combat adverse conditions, but the exact mechanism that enables the switch from a normal colony to a more resilient phenotype, such as a SCV, is unknown.
The human wound site represents a major potential avenue for pathogen invasion and colonization [14]. In fact, S. aureus is the most frequently isolated bacterium from wound infections even though the environmental conditions in the wound site are diverse and dynamic during the healing process [15]. Therefore, understanding this bacterial survival in a wound site becomes essential to developing new antimicrobial strategies. These conditions include a variable pH, osmotic pressure, and temperature. The wound pH can be acidic or neutral but it becomes basic during the first stage of the healing process [16]. The temperature varies from 35 °C to 39 °C and osmolality fluctuates from 275–300 milliosmoles/L [17,18]. Several studies have investigated how S. aureus and Staphylococcus lugdunensis adapt to changes in the environmental conditions, mimicking wound site conditions: pH 6–8, temperature 35–39 °C, and adding NaCl to increase osmolality by up to 5%. Staphylococcal species adapted to these conditions by inducing considerable alterations in the composition of membrane fatty acids and cytoplasmic amino acids, as well as changes in ribosomal proteins and cell sizes [6,19,20]. The adaptive changes also demonstrated in S. aureus under a similar design were consistent with the formation of metabolic phenotypes characteristic of the prevailing environmental conditions [21]. These results support the hypothesis that S. aureus can acclimatize to changes in the environmental conditions by inducing major changes in cellular composition and external morphology. Therefore, the current study used the same experimental design to investigate the responses of the cytoplasmic and secreted proteins after growth in the conditions representative of the skin surface and wound site. It was hypothesized that major changes in cytoplasmic and secreted proteins would occur as a part of adaptation processes to alterations in environmental conditions.

2. Experimental Procedures

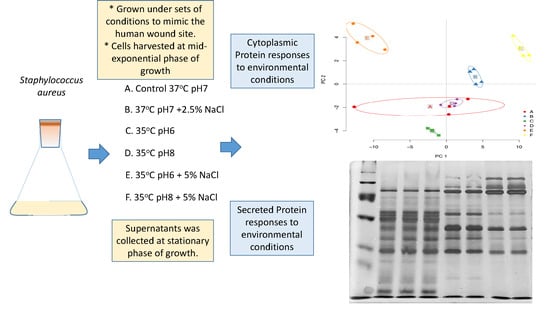
2.1. Bacterial Strain and Growth Conditions

The bacterial strain used in this study was a clinical isolate of S. aureus from patients that had been suffering from chronic muscle pain [22]. This isolate has been used in subsequent investigations to investigate metabolic responses to environmental stresses [8,9,23]. The isolate has been maintained as culture stock on horse blood agar (HBA), and preserved appropriately on sterile glass beads at −80°C with a regular sub-culturing to maintain viability [24]. The identity of the isolate was checked regularly using APITM Staph biochemistry (BioMérieux, Australia, Pty Ltd) and through polymerase chain reaction PCR [25].

2.2. Experimental Design and Statistical Rational

For the analysis of cytoplasmic proteins, bacterial cells were grown in the same conditions described in [6] as part of a larger experiment created by the MODDE software (9.0, Umetrics, Umeå, Sweden) [19]. This allowed the establishment of a multifactorial design, optimized to assess the impact of varying three factors at a time, which in this case were temperature, pH and osmotic pressure. Selected environmental conditions were chosen for the analyses of both cytoplasmic and secreted proteins. In all cases, n = 4. The reference control (A) included the cells grown under the ideal conditions of pH 7 at 37 °C, with no added NaCl in the tryptic soy broth medium (TSB); a “centroid” set of samples represented the mid-range conditions of the larger experimental design [19] with the conditions of pH 7 at 37 °C with 2.5% NaCl added in TSB (B); four sets of experimental conditions were applied with 1) 35 °C and pH6 with no added NaCl in TSB (C); 2) 35 °C and pH6 with NaCl added (5%) in TSB (D); 3) 35 °C and pH8 with no added NaCl in TSB (E); and 4) 35 °C and pH8 with NaCl added (5%) in TSB (F). The normal range of osmolality for plasma is 275–300 milliosmoles/L, the osmolarity of the TSB was measured as 300 mosmoles L−1 and the calculated osmolarity of the PBS was 306 mosmoles L−1 [26]. The sodium chloride ranged from 0 to an additional 5% loading on the TSB, taking the final concentration well beyond the plasma concentration which may occur on skin surfaces with the added electrolytes from the natural moisturizing factor and sweat [27] and has also been noted in wound site responses to traumatization [16]. The temperature range was 35–37 °C and the pH ranged from 6 to 8. An overnight starter culture (50 mL) of S. aureus was grown for 16 h in Tryptic Soy Broth (TSB) at 37 °C with constant agitation (120 rpm), to be used as an inoculum for the growth experiments. Replicates of each condition containing 95 mL TSB culture media were inoculated with 5 mL of overnight culture in 500 mL conical flasks, which were then grown until mid-exponential phase with constant agitation (120 rpm).
For the analysis of secreted proteins, the cells were grown to a stationary phase under a subset of environmental conditions including a reference control with cells grown under ideal conditions at pH 7, 37 °C and with no added NaCl in a tryptic soy broth medium (TSB). A “centroid” set of samples represented the mid-range conditions of the larger experimental design as described in [19] with conditions at pH 7, 37 °C and with NaCl added (2.5%) in the TSB. An experimental set of conditions was applied at 39 °C and pH 6 with NaCl added (5%) to the TSB.
The obtained data were analyzed using an analysis of variance; Duncan’s test was used to determine the significance of all the proteins in all experimental groups in comparison to the reference control. Principle component analysis (PCA) and a hierarchical heatmap used log transformed data by R statistical software. For the PCA, built-in packages were used, and the data were subjected to mean centering prior to the PCA calculations. The heatmap was generated using the g plots package. Two and three-dimensional PCA plots were generated by PCA3D package. The Venn diagram was designed using the InteractiVenn website [28]. Gene ontology functional enrichment analysis by the PANTHER classification system was applied to determine the putative function proteins [29].

2.3. Extraction and Estimation of Cytoplasmic Proteins

The proteins were extracted from the cytoplasm of dried cells from both the reference control and the treated samples. The cells were resuspended in 500 µL of SDS Lysis Buffer containing 2% SDS, 0.375 M Tris pH 6.8, 3.4 M sucrose (Sigma-Aldrich, St. Louis, MO, USA) and one tablet of protease inhibitor (complete Mini, Roche Diagnostics), thoroughly mixed and heated at 100 °C for 6 min. Cell debris was removed by centrifugation at 14,000 rpm for 25 min. The supernatant containing the extracted proteins was carefully removed and stored at –20 °C until further investigation. Protein concentrations in each sample were determined using the Bicinchoninic Acid (BCATM)assay (Bio-Rad, Hercules, CA, USA) following the manufacturer’s instructions, and Bovine Serum Albumin (BSA) was used as the reference standard.

2.4. Sodium Dodecyl Sulphate Polyacrylamide Gel Electrophoresis (SDS-PAGE) and Staining Procedures

SDS-PAGE gels were made according to these procedures: 4% stack gel and 12% resolving gel (30% Acrylamide, 0.5 M Tris-HCl, pH 6.8). Silver staining was performed according to the method used by [30]. Briefly, the procedure involved a gel fixation wash three times using 5% acetic acid and 10% ethanol, and subsequently washes in triplicate using 10% ethanol. The gels were then rinsed three times with distilled water and incubated in 2.9 µg of sodium thiosulphate for 2 min followed by three washes with distilled water. The gel was silver stained for 5 min, and quickly rinsed four times with distilled water before incubation in development solution (sodium bicarbonate, sodium thiosulfate and formaldehyde) till the appearance of the protein bands. The reaction was inactivated by adding 1% of acetic acid to the gel.

2.5. Protein Reduction, Alkylation and Digestion

One hundred and fifty micrograms of proteins from both the reference control and treated samples was precipitated using sample/methanol/chloroform in the ratio of 1:1:0.5 (v/v/v). The mixture was vortexed and centrifuged at 14,000 rpm for 15 min. The upper layer was discarded and 75% of the original volume of methanol was added to each replicate and centrifuged at 14,000 rpm for 20 min. The supernatant was removed without disrupting the protein pellet and was air dried for 10 min. The protein pellet was washed two times with 500 µL of cold acetone (kept at −20 °C). The precipitated proteins were resuspended with 150 µL of ammonium bicarbonate (25 mM) and 10 mM dithiothreitol (DTT) (final concentration) and boiled at 95 °C for 10 min. The samples were cooled for 5 min and subsequently 55 mM of iodacetamide was added, the sample was vortexed and kept in the dark at room temperature for 35 min. The protein was digested using trypsin enzyme (Promega sequence grade, Madison, Wisconsin, USA) in a ratio of 50:1 (protein: trypsin) in 25 mM ammonium bicarbonate, and the sample incubated overnight at 37 °C with constant shaking. The next morning, the trypsin was inactivated by adding 0.1% (v/v) formic acid. The samples were then spun at 14,000 rpm for 40 min to remove the undigested proteins.

2.6. LC–MS/MS Analysis of Cytoplasmic Proteins

The peptides yielded from the tryptic digestion of the cytoplasmic proteins were analyzed by nanoLC–MS/MS using a LTQ Orbitrap Elite mass spectrometer (Thermo Scientific, Thermo Fisher, Waltham, MA, USA) coupled to an Ultimate 3000 RSLC nanosystem (Dionex, Idstein, Germany). The nanoLC system was equipped with an Acclaim Pepmap nano-trap column (Dionex –C18, 100 Å, 75 µm × 2 cm) and a Thermo EASY-Spray column (Pepmap RSLC C18, 2 µm, 100 Å, 75 µm × 25 cm). Four µL of the peptide mix was loaded onto the enrichment (trap) column at an isocratic flow of 5 µl/min of 3% CH3CN, containing 0.1% formic acid for 5 min before the enrichment column was switched in-line with the analytical column. The eluents used for the liquid chromatography were 0.1% (v/v) formic acid (solvent A) and 100% CH3CN/0.1% formic acid (v/v). 0.1% formic acid (v/v). The following flow gradient was used: 3% to 6% B for 1 min, 6% to 10% B in 12 min, 10% to 30% B in 20 min, 30% to 45% B in 2min, 45% to 80% B in 2 min and maintained at 80% B for 3 min followed by equilibration at 3% B for 7 min before the next sample injection. The LTQ Orbitrap Elite mass spectrometer was operated in the data-dependent mode with a nano ESI spray voltage of +2.0 kv, a capillary temperature of 250 °C and an S-lens RF value of 60%.
A data-dependent mode was used, whereby the spectra were acquired first in positive mode with full scan scanning from m/z 300 to 1650 in the FT mode at 120,000 resolution, followed by Collision induced dissociation (CID) in the linear ion trap, with the ten most intense peptide ions with charge states ≥2 isolated and fragmented using a normalized collision energy of 35 and the activation Q of 0.25.

2.7. Database Search and Protein Quantification

The mass spectra were searched using Mascot 2.3 (Matrix Science, London, UK) as part of the Proteome Discoverer 1.4 Workflow (Thermo Scientific) against the Uniprot database (with 26,167,536 sequences at the time of search) and the Firmicutes taxonomy. The search parameters used were: fixed modification (carbamylation of cysteine C; 57), variable modification (oxidation of methionine M; 16), two missed tryptic cleavages, 10 ppm peptide mass tolerance and 0.6 Da fragment ion mass tolerance. The false-discovery rate (derived from corresponding decoy database search) was less than 1%.
The MS result files were imported to SIEVE (Version2.1 Thermo Scientific, San Jose, CA, USA) for the label-free relative quantification of the peptides between the reference control and the treated samples. The experiment workflow was selected as the “Control Compare Trend Analysis” which allows comparing the control samples to more than one treated sample. The three main steps include: the alignment of all peptides, which considers the reproducibility of the replicates and the correlation of all files to the reference file. The second step was to create the frames (Peptides) and the following parameters were formatted to create the frames (10,000 frames, with signal threshold > 125,000, m/z which starts at 350 and stops at 1,300, and a retention time (RT) which starts = 10 and stops = 60 min) [31]. The third step was the identification of protein and this was done by importing the Mascot 2.1 result to SIEVE 2.1. A filer was applied to the frames table and subsequently the peptides table. The Frame data generated by SEIVE was exported to an Excel® (Microsoft®, Redmond, Washington, USA) spreadsheet file for further data analysis using ANOVA analysis, principal component analysis (PCA).

2.8. Analysis of Secreted Proteins

The cells were separated by centrifugation at 6000 g for 25 min and the supernatants were collected and filtered through 0.22 μm. The supernatants were precipitated by adding 100% of cold trichloroacetic acid (TCA) kept at (4 °C) to a final concentration of 15% and incubated overnight at 4 °C. The next day, the samples were centrifuged at 12,000 rpm for 30 min and washed four times with 96% cold ethanol kept at −20 °C to ensure the removal of TCA. The samples were air-dried, and each replicate was resolved in a 500 μL SDS-PAGE loading buffer SDS Lysis Buffer containing protein concentrations in each sample, which were determined using the BCATM assay (Bio-Rad) following the manufacturer’s instructions, and bovine serum albumin (BSA) was used as the reference standard. Fifteen micrograms of protein from each sample was run in SDS-PAGE to determine any large-scale differences in the protein production between the control and treated cells. The difference between the bands was determined by sight. Gel bands of interest were then cut and analyzed by LC–MS/MS. The excised bands were washed, reduced with DTT and alkylated with iodoacetamide followed by dehydration (as shown in the reduction alkylation). The gel bands were then rehydrated with 25 mM ammonium bicarbonate containing 70 ng Trypsin and incubated with gentle agitation overnight at room temperature. The samples were subsequently acidified (pH ~2) with a 10% trifluorocetaic acid (TFA) (v/v) solution to inactivate the trypsin, and the bands were sonicated (ultrasonic water bath) in increasing amounts of Acetonitrile (0%, 30% 50% 100%) for peptide extraction [30]. The samples containing the extracted peptides were then vacuum concentrated to remove the acetonitrile and resuspended in 15 uL LC loading buffer A (2% Acetonitrile, 0/1% TFA), spun at top speed for 5 min (to remove any particulates which can block the LC columns) before the supernatant was transferred to a Waters Autosampler vial.
The samples were analyzed by nanoflow reverse phase liquid chromatography (Dionex Ultimate 3000 RSLCnano, Dionex, Idstein, Germany) attached directly to an ESI 3D Ion Trap Mass Spectrometer (AmaZon ETD, Bruker GmbH, Preston, VIC, Australia) operating in MS/MS (CID) mode. Peptides were loaded at 5 uL/min onto a 5 um C18 nanoViper trap column (100 um × 2 cm, Acclaim PepMap100, Thermo) for desalting and pre-concentration. The peptide separation was then performed at 300 nl/min through an Acclaim nanoViper analytical column (2 um C18, 75 um × 15 cm) utilizing a gradient of 2–40% Buffer B (80% acetonitrile, 0.1% formic acid) over 60 min. The peptides were eluted directly into the nanoflow ESI Ion source of the MS system for the MS/MS analysis. The AmaZon Ion Trap system was set to perform the MS/MS on the top 5 ions present in each MS scan with an Ion exclusion time of 30 s. The raw MS files were then converted into a MASCOT Generic Format using DataAnalysis 4.1 and imported into the ProteinScape 2.1 platform (both Bruker, Bremen, Germany) for database searching. The searches were performed against the SwissProt (Bacterial taxonomy) and Uniprot (S. aureus) databases using an in-house licensed MASCOT server (version 2.3.02, Matrix Science). The number of allowed trypsin missed cleavages was set to 2. The carbamidomethylation of cysteine was set as a fixed modification, whereas the deamidation of asparagine and glutamine and the oxidation of methionine were set as the variable modifications. The parent ion tolerance was set to 1.2 Da with a fragment ion tolerance set to 0.7 Da. The peptide thresholds required a false positive rate of less than 0.05% with a low stringency Mascot score greater than 35. The spectra meeting these criteria were validated by manual inspection to ensure the accurate y- and b-ion detection with overlapping sequence coverage. The identity of the proteins was considered valid if it had at least five peptides and the mascot score was > 300.

3. Results

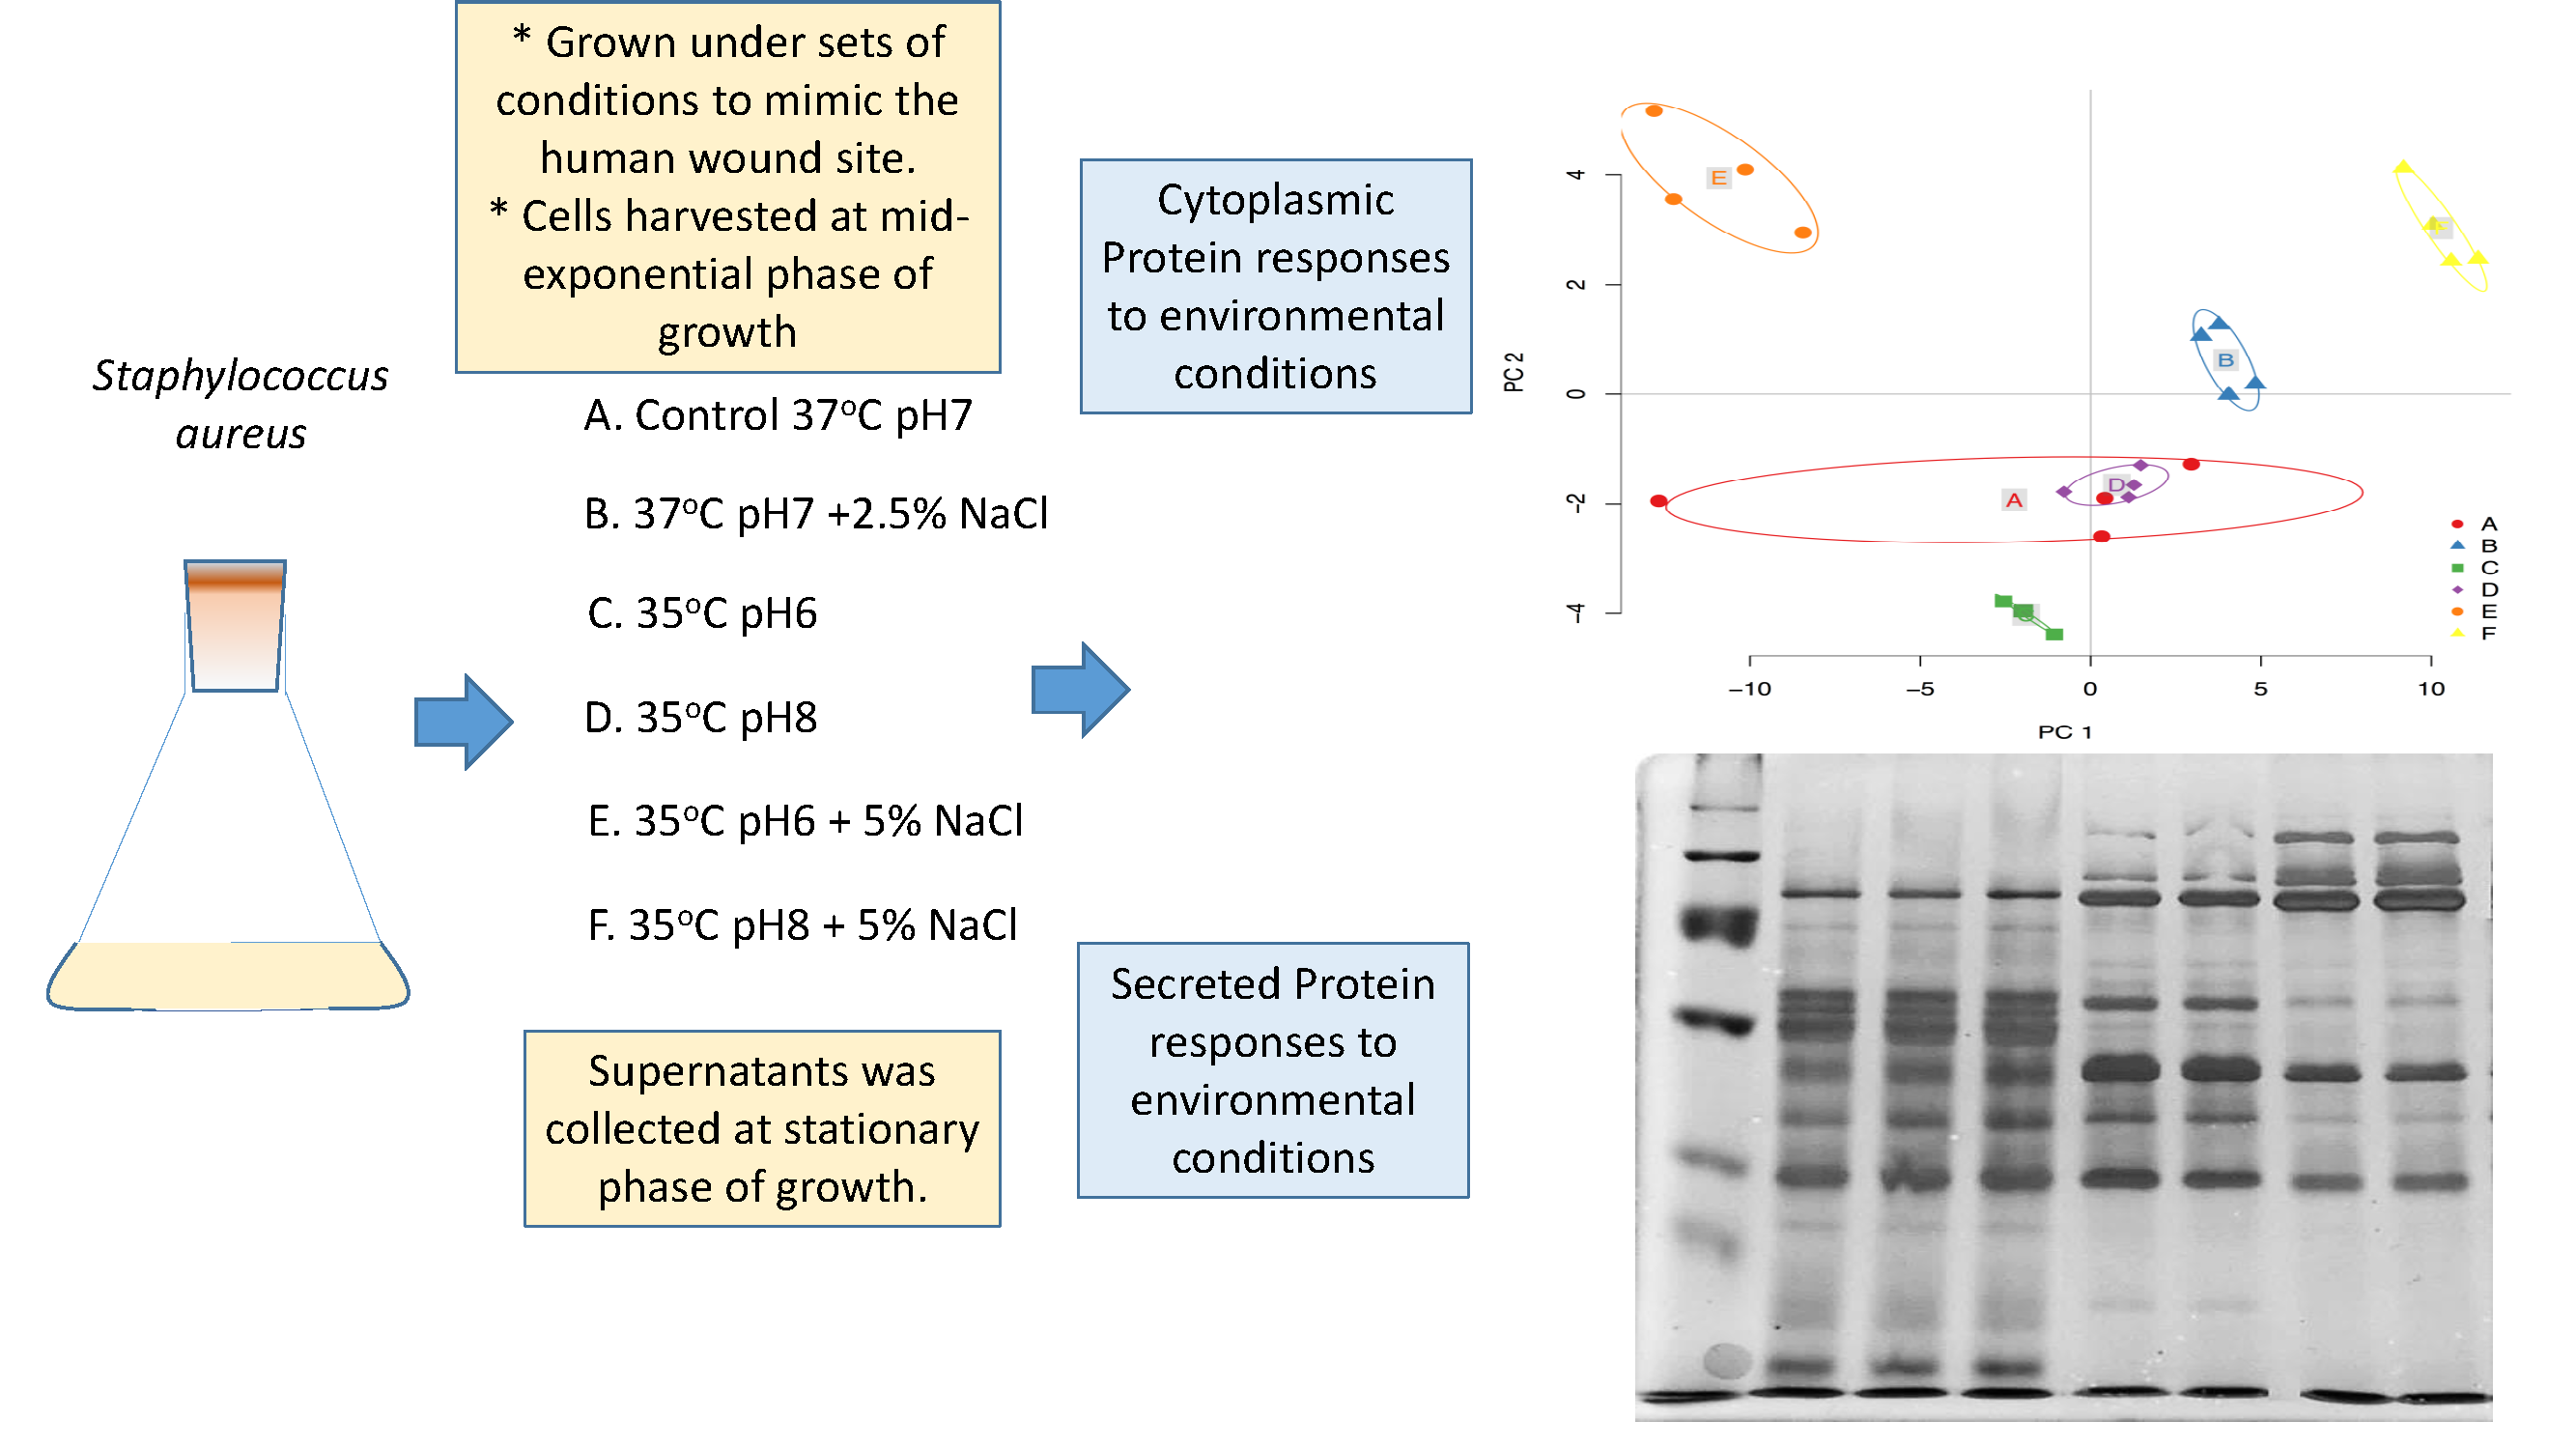
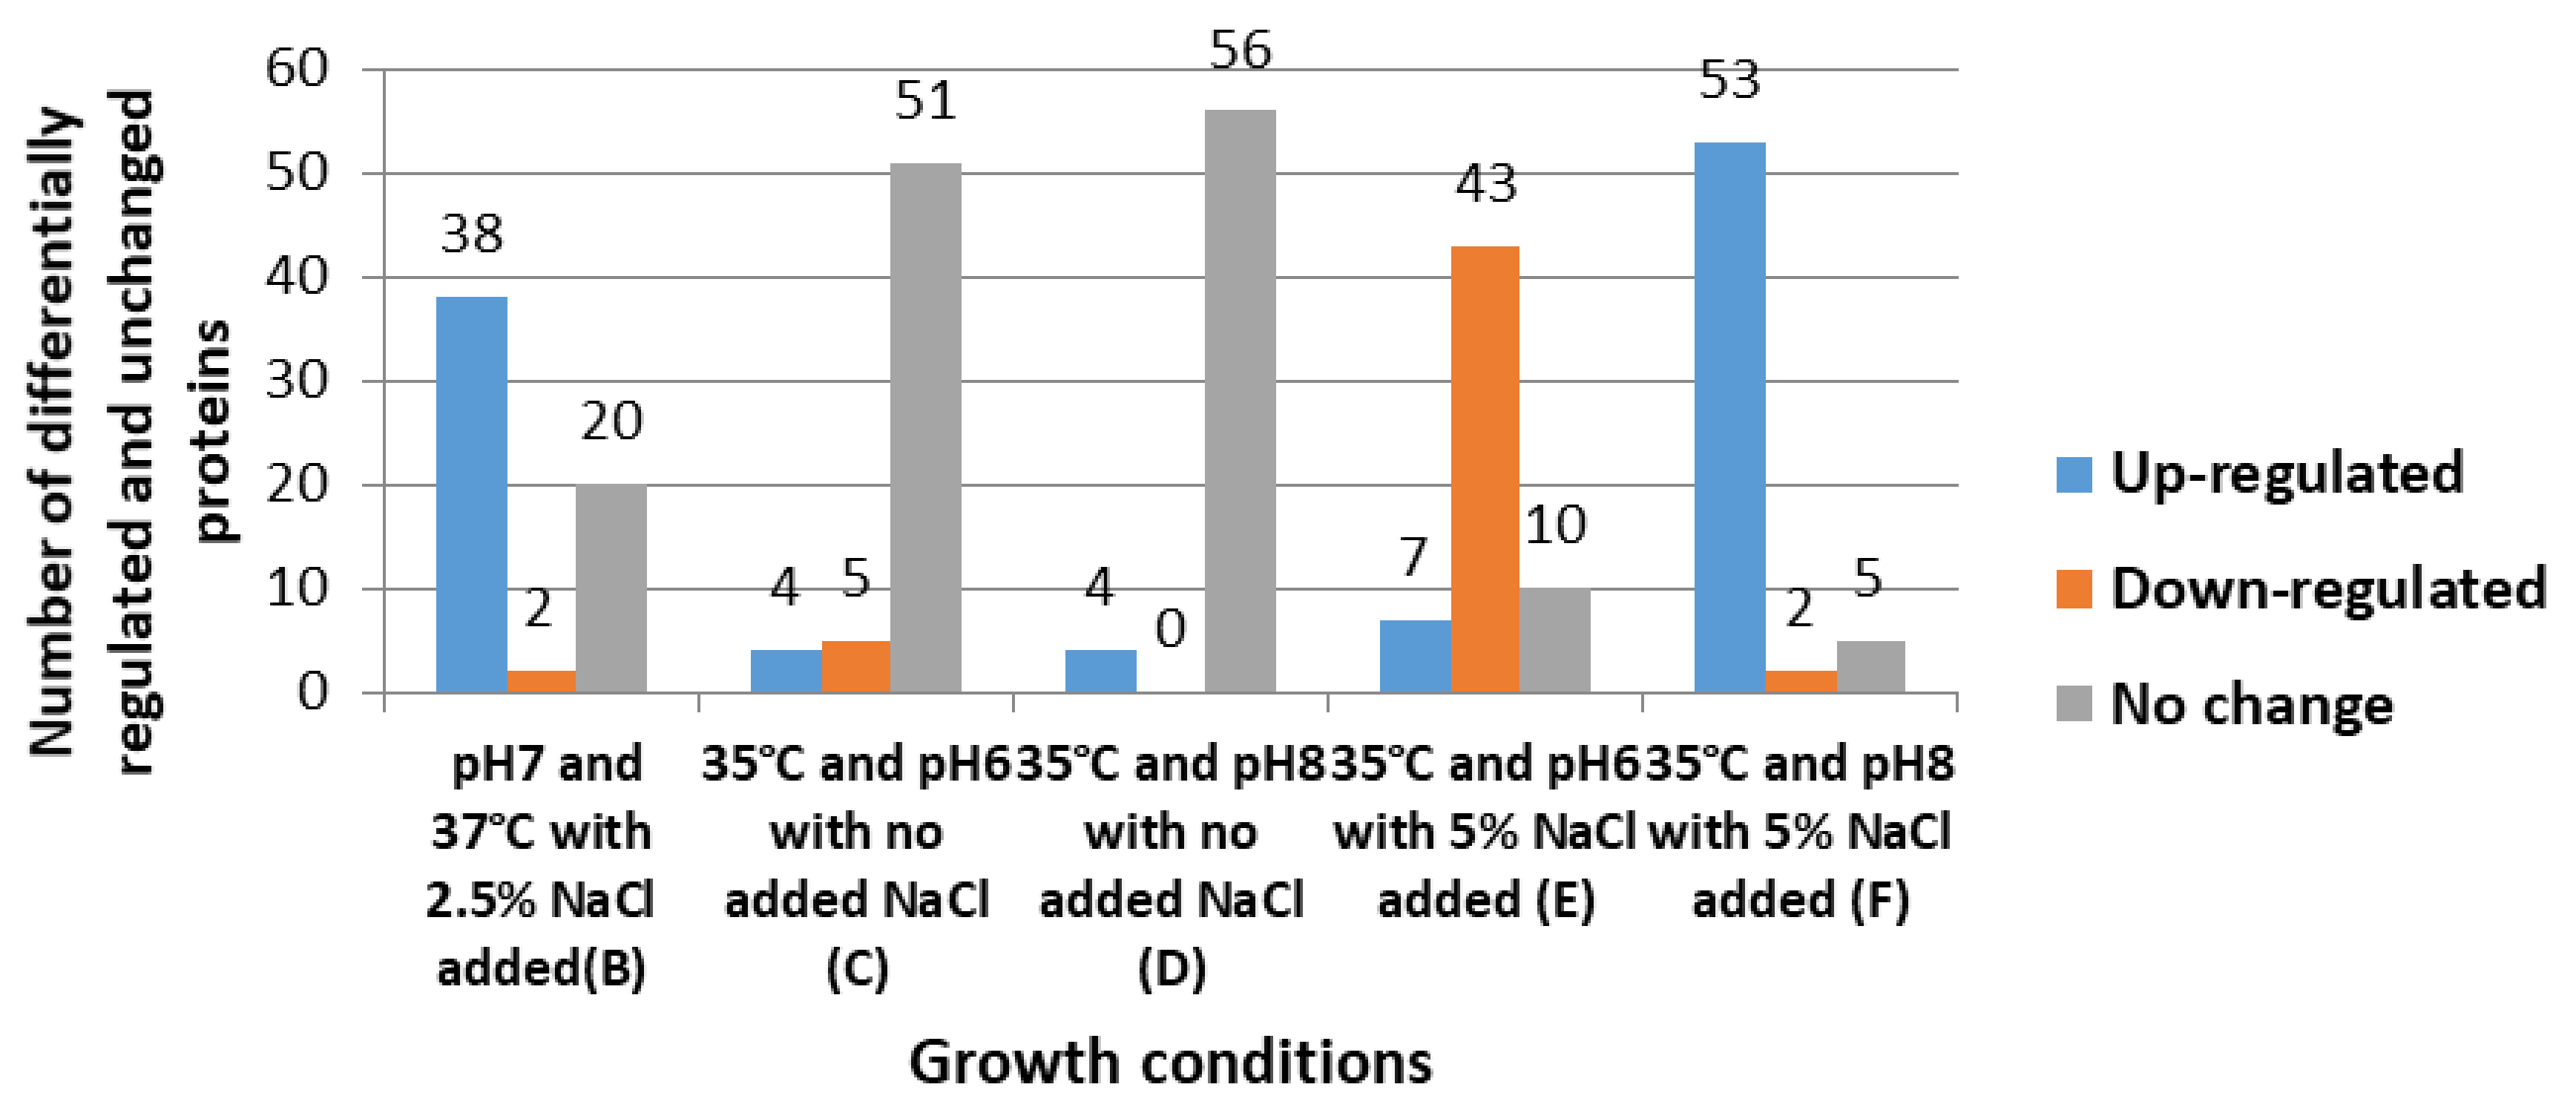
3.1. Cytoplasmic Proteomic Analysis

S. aureus (clinical strain) was cultured in tryptic soy broth to the mid-exponential phase of growth in multiple combinations of environmental conditions to mimic those on the human skin or within a wound site: pH 6–7, temperature 35–37 °C, and with 0–5% NaCl. The proteomic analysis revealed that sixty proteins were differentially regulated in one or more of the experimental groups. The protein quantification was conducted by considering the sum of all the peptide intensities per protein and at least two peptides were required to consider the protein quantification valid (the number of peptides for each protein is provided in the Supplementary Material (Table S1 and Table S2)). The profiles of the cytoplasmic proteins assessed in each of the cultures were consistent and reproducible within each replicate of the experimental groups, with certain compositional changes associated with each group (Table 1). Significant changes in the composition of cytoplasmic proteins were observed when the bacteria were grown in cultures with higher osmotic pressure (Group B, E and F). The bacterial cells responded to a high NaCl concentration at pH 8 by displaying higher abundances of most cytoplasmic proteins (F); in contrast, at pH 6 with high levels of NaCl (E), the cells showed lower abundances of proteins. indicating that at the higher NaCl concentrations, the pH had a powerful influence over the protein abundance. However, compared with the reference controls, when S. aureus was exposed to sets of conditions without additional NaCl, only a few changes occurred in the protein abundance (Table 1). For example, at pH 6 and 8 at 35 °C without NaCl (C and D), only nine and four proteins, respectively, were differentially regulated.
It is worth noting that two proteins involved in cell adhesion, identified as serine-aspartate repeat-containing protein D precursor and putative surface protein SAV2496/SAV2497 precursor, were down regulated in response to the treatments with higher levels of NaCl (B, E and F). Bifunctional autolysin was the only protein that displayed an up-regulation in its abundance across all the experimental regimens compared with control samples. The abundance of staphylococcal secretory antigen ssaA2 was increased under more acidic conditions at 35 °C with or without the addition of NaCl (groups C and E), but remained consistent under neutral or alkaline pH (B, D and F). The catalase was significantly up regulated under more alkali conditions (groups D and F), but remained at control levels under more acidic or normal pH (groups B, C and E). These results established that modifying the medium from acidic to alkaline pH reversed the cells response for maintaining ssaA2 and the catalase levels in the cytoplasm. Alkaline shock protein, which is a general stress protein, was only upregulated in experimental group (E), and no changes were observed in any other experimental groups.
Ten out of the 12 proteins that were altered in the bacterial cells exposed to an additional 2.5% NaCl at pH 7 and 37 °C (B) displayed an up-regulation compared with the controls (A) and were all associated with protein synthesis. The two proteins that did not alter included the elongation factor P and proline tRNA ligase. The addition of 5% NaCl at 35 °C at pH 8 (F) resulted in the elevated levels of all these proteins compared with the control. By contrast, however, the addition of the 5% added NaCl at 35 °C and pH 6 (E) resulted in diminished levels of eight out of 12 of this group of proteins, where valine tRNA ligase, aspartyl/glutamyl tRNA (Asn/Gln) amidotransferase subunit B and isoleucine tRNA ligase did not alter in concentration, but proline tRNA ligase was up regulated in concentration compared with the control. When the bacterial cells were subjected to the 35 °C regimes without added NaCl, no general responses were observed for the majority group of the proteins involved in the protein synthesis, but at pH 8 and 35 °C (D), a relative up-regulation was observed in glutamyl tRNA (Gln) amidotransferase subunit A.
The number of proteins differentially regulated in each experimental group varied according to the growth conditions applied (Figure 1). For example, the cells exposed to pH 8 at 35 °C with an additional 5% NaCl (F) yielded the greatest number of altered proteins (55), including 53 up regulated proteins and two down regulated proteins, whilst the expression of five proteins remained unchanged (Figure 1). The equivalent cultures grown at pH 6 and 35 °C with 5% NaCl (E) showed that the regulation of 50 proteins was altered, including 43 down regulated and seven up regulated, while the expression of 10 proteins remained unchanged. Compared with the reference controls (A), the cells grown at pH 7 and 37 °C with 2.5% NaCl (B) showed 38 up regulated and two down regulated proteins, and the expression of 20 proteins did not change. However, the bacterial cells grown in cultures without NaCl showed few changes in cytoplasmic compositions; the cells exposed to pH 6 and 35 °C (C) had four proteins up regulated and five down regulated, whereas those exposed to pH 8 and 35 °C (D) had only four proteins up regulated and none down regulated.
Figure 2 shows the distribution of the differentially regulated proteins between the experimental groups. Twelve out of 53 proteins were exclusively up regulated in the experimental group F (pH 8 and 35 °C with additional 5% NaCl), while the remaining proteins were common with other experimental groups (these proteins are listed in Table 1). Group B (pH 7 and 37 °C with 2.5% NaCl), which only differed from the control by having an additional 2.5% NaCl, had the most up regulated proteins (38), but did not show any production of unique proteins. Most of the up regulated proteins in group B were shared with the experimental group (F) (33) and five proteins with other experimental groups (C, D and E). Interestingly, experimental group C had two proteins exclusively up regulated, even though this group only had a total of four up regulated proteins. Group E had one protein uniquely up regulated. Group E (pH 6 and 35 °C and additional 5% NaCl) had the highest number of exclusively down regulated proteins (39 out of 43), followed by group C, which had three proteins uniquely down regulated. Other experimental groups (B, D, and F) did not have any proteins exclusively down regulated.
Gene ontology functional enrichment analysis by the PANTHER classification system was applied to determine the putative function of 60 proteins that showed significant differences in their abundances (Figure 3). These proteins were classified into 10 functional categories: protein biosynthesis (30%), glycolysis (18%), signal transduction (12%), metabolism (11%), cell cycle (8%), transport (5%), energy generation (3%), cell anchorage (3%), nucleotide biosynthesis (3%), and unknown (7%).

3.2. Clustering Analysis

The cytoplasmic protein data from the cells grown under the reference control (A) and experimental groups (B−F) were further evaluated, using principal component analysis (PCA) for multivariate analysis to find the cytoplasmic protein profile variances between each treatment (Figure 4a). The PCA created a two-component model (R2 = 0.7302 and Q2 = 0.6952181) representing solid significance. The assembling of scores showed that the first component contained the experimentally instilled factors, whereas the second component was modelled within factor variation (Figure 4A). The PCA loadings showed the contribution of the main differential proteins to clustering separation (Figure 4b). The analysis showed that the biological replicates were closely clustered representing great similarity between replicates with characteristic protein profiles between treatments. Furthermore, the PCA displayed that low temperature (35 °C) combined with elevated NaCl (5%) and lower or higher pH (6 or 8) (E and F) were the most significantly distanced groups from the reference control, indicating that the protein profiles were quite different in both treatments compared with the control samples. However, the cultures that did not have NaCl added (C and D) had a similar pattern to the reference control as indicated by less separation from the reference control (A).
The pattern of the global proteins was investigated using hierarchical clustering and a correlation heatmap (Figure 5), which the visualized the protein abundance for all the experimental groups. The bacterial cells grown at 5% NaCl (E and F) showed a very different cluster from those grown under ideal conditions (A). However, the experimental groups (C and D) cultured without NaCl had a pattern more similar to that of the reference control (A) and centroid (B) (Figure 4).

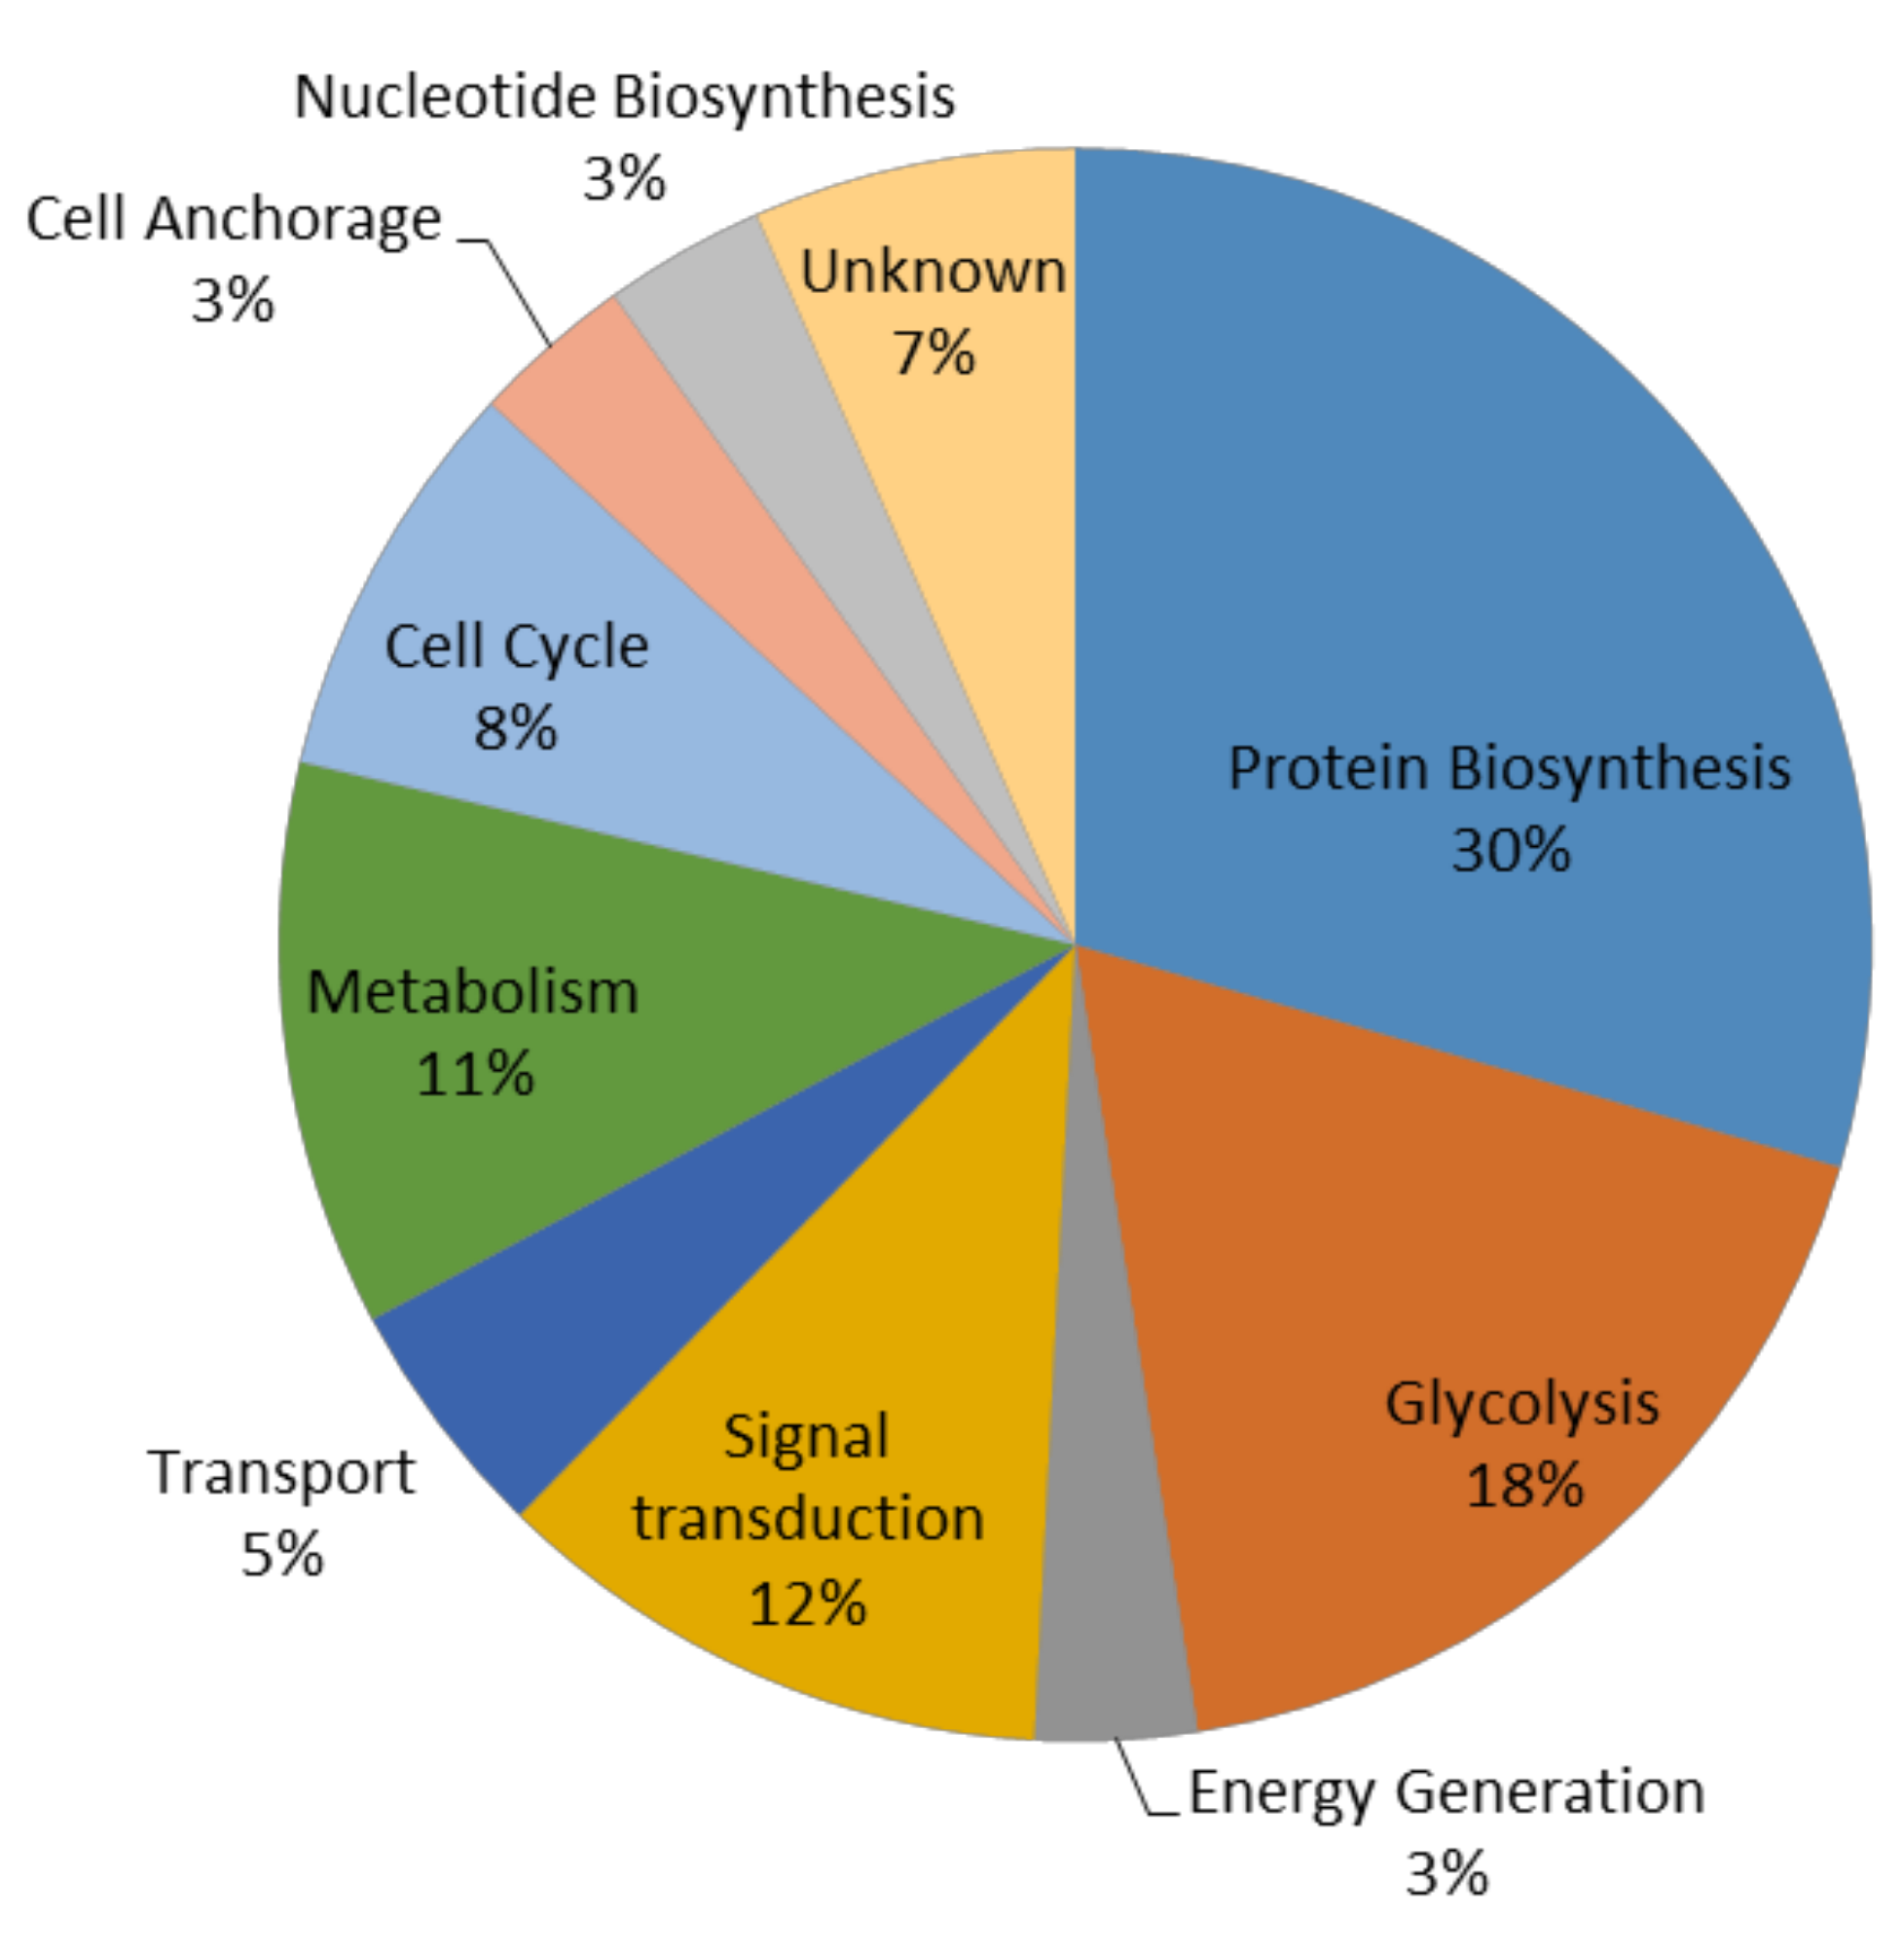
3.3. Secreted Protein Results

The aim for the final section of the investigation was to monitor the exoproteome responses of S. aureus to the changes in the environmental conditions which might be found in the human wound site conditions. S. aureus was grown to the stationary phase of growth under control conditions, centroid (additional 2.5% NaCl, pH 7, 37 °C) or with the addition of 5% NaCl at 39 °C and pH 6 representing the environmental parameters existing on the human skin or within a wound site where the temperatures can range from 37 °C–39 °C, pH 6–7, and NaCl can be elevated above the plasma levels. The SDS-PAGE analysis showed that S. aureus had secreted a number of proteins by the time the cells reached the stationary phase, but the profiles of the secreted proteins and the intensity of the bands varied between the growth regimes as shown in Figure 6. The gels were repeated for each of the replicates and consistent banding patterns were observed for both the reference controls and treatment samples. A selection of key protein bands is labeled as 1–8 in Figure 6 on the basis of where the bands appeared, in order to represent the changes in intensity for the differences in responses to growth under different conditions.
The analysis revealed that a protein band (labelled 3) which was approximately 20 KDa was seen very clearly in the cells grown under control conditions, but was absent in the cells grown in altered environmental conditions (Figure 6). This band was identified as the alkyl hydroperoxide reductase subunit. Conversely, the protein bands of approximately 142 and 137 KDa (labeled 7 and 8) were strongly apparent in the treatment samples, but were missing in the control samples (Figure 6, bands 7 and 8). These bands were mainly identified as bifunctional autolysin precursor (Atl). The secretion of these proteins appeared more intense from the cells grown with the additional 5% NaCl at pH6 and at 39 °C in comparison to the cell grown with addition of 2.5% NaCl at pH 7 and at 37 °C. The findings of this study confirm that the Atl protein, which is the major autolysin produced by S. aureus, is mostly processed into smaller fragments when this bacterium is grown in TSB with no added NaCl. The addition of salt appeared to increase the production and secretion of Atl. However, the processing of Atl seems to be inhibited with an increasing salt concentration. At 2.5% NaCl, two intermediate lengths of Atl are the predominant fragments (Figure 6, bands no. 4 and 5) with some unprocessed full-length Atl. At 5% NaCl, it seems that most of the Atl being produced was secreted unprocessed as large proteins (Figure 6, bands no. 7 and 8).
Protein bands labeled with 4 and 6 were evidently present in both the control samples and the cells treated with the additional 2.5% NaCl, but were very faint in the cells grown with the additional 5% NaCl at pH6 and at 39 °C. These bands were identified as bifunctional autolysin precursor, lipase 2 precursor, and immunodominant staphylococcal antigen A precursor (Table 2). Moreover, the protein band labelled 1 was relatively less intense in the cells grown under normal conditions compared with the equivalent bands in the treated cells. The identities of the proteins in this band were lipases and autolysin. By contrast, it was apparent that the treatment samples consistently had an absent band at approximately 50 KDa compared with the corresponding band (labeled 2 in the reference control samples). This band contained 30S ribosomal protein S1, catalase, elongation factor Tu, enolase, formate-tetrahydrofolate ligase and ATP synthase subunit beta. The exoproteome results provided evidence that S. aureus adjusted its secreted proteins after being exposed to changes in the environmental conditions.

4. Discussion

Proteomic approaches were used in this study to investigate the responses of the cytoplasmic and secreted proteins of S. aureus to a range of alterations in environmental conditions representative of the human wound site. This study exhibited that S. aureus rapidly adapted to the alterations in environmental conditions by inducing significant changes in the proteome compositions. The results provided evidence that there were synergistic interactions between the environmental factors such as temperature and pH, which would differentially manipulate how the bacterial cells would respond to alterations in any specific variable. For instance, the cells responded to an elevated NaCl at pH 6 by down regulating the abundances of cytoplasmic proteins, whereas at pH 8 there was a significant increase in the cytoplasmic proteins compared with the cells grown under normal conditions. These results supported the hypothesis that S. aureus adjusted rapidly to the changes in environmental conditions by altering its cytoplasmic proteome and ultimately releasing proteins into the external environments to obtain the optimum homeostasis.
These changes in protein composition could be argued to reflect distinct phenotypes under each experimental group, as previous research revealed that S. aureus could form distinct phenotypes after being exposed to identical growth conditions as in the current study [21]. Earlier studies have also demonstrated that colonies of staphylococcal species could grow as SCVs in response to alterations in temperature, osmotic pressure, and pH [8,9]. On this premise, a hypothesis was proposed that bacteria are persistently adapting to modifications in the environment by forming characteristic phenotypes to combat changes in environmental conditions. These significant changes within cytoplasmic and secreted proteins in the current study were interpreted as comprising a necessary component of the cell adaptation processes to enable the cell to consistently adapt to changes in the environment. Similar responses of ribosomal proteins were observed when S. aureus was grown under identical experimental design as in the current study [6]. This concept was also demonstrated in S. lugdunensis under a similar design, which revealed responses attributable to fatty acids and cell size that were characteristic of the prevailing environmental conditions [19].
The analysis of cytoplasmic proteins in the present study revealed that the major focus of adaptation to environmental challenges involved adjustments in those proteins associated with protein synthesis, which accounted for 30% of the total differentially regulated proteins. The majority of these proteins were altered following the exposure to any of the growth regimes which included the addition of 2.5% or 5% NaCl. The responses by S. aureus to growth under additional NaCl at pH 7 or 8 involved the increase in most of the proteins related to protein synthesis, whereas the response at pH 6 involved a down-regulation. It was interesting to note that at pH 6, and at 35 °C with 5% NaCl added (E), the proline tRNA ligase was up regulated when all other proteins associated with protein synthesis were either decreased or showed no significant change. These results suggested that this protein may fulfill an additional/alternative role to protein synthesis required for enabling growth and regulating homeostasis as shown by their independent responses under different environmental challenges.
An earlier study indicated that S. aureus responded to prolonged cold stress by up regulating a high number of proteins associated with proteins synthesis [7]. A similar response has been noted in the SCVs of S. aureus in response to the antibiotics [32]. This finding is also consistent with a prior study that analyzed the ribosomal proteins of S. aureus in the identical sets of growth conditions [6]. Most ribosomal proteins were up regulated in response to a higher NaCl concentration at a normal or more alkaline pH, but an adverse response was recorded when the bacterium was exposed to an additional 5% NaCl at pH 6. A recent study showed significant alterations in the protein compositions of S. aureus in response to 10% and 20% NaCl [33]. The authors proposed that in response to multiple environmental stimuli, the cells adapt as required to facilitate survival. The distribution of differentially regulated proteins in the current study was dependent on the set of growth conditions, even though some growth conditions revealed few changes in cytoplasmic proteins, but S. aureus had some exclusively regulated proteins in response to these conditions. These results provide strong evidence that protein synthesis is a vital component of the adaptive response by S. aureus to alterations in environmental conditions.
The results from this study have shown that the adaptive processes require extensive changes in the secretion of proteins shown by the differential secretions observed between the control and treated samples. The SDS-PAGE analysis of stationary phase secreted proteins of S. aureus showed that even with small alterations in the growth conditions implemented by the addition of 2.5% NaCl, differences in both the intensity and the distribution of protein bands were evident from the secretome. When bacterial cells were exposed to more intense changes in environmental conditions by altering temperature, osmolality, and pH, certain substantial changes were noted in the secretome profiles. This result suggests that the bacterium had to pump different proteins into the external media as part of the adaptation process, but it is not yet clear how these proteins would contribute to survival. The analysis indicated that control samples, with no extra NaCl, Atl was processed to various smaller fragments and that was why there was no accumulation of the large Atl and only maybe a little of the intermediate forms of the Atl. However, with the addition of 2.5% NaCl, the Atl was initially produced as an approximately 137 kDa protein, and was then processed into several smaller forms. The smaller subunits seen in bands labelled with 4 and 5 are the two fragments that have originated from the larger Atl due to processing. At 5% NaCl, it appears that the Atl processing was mostly inhibited and almost all of the Atl was present as large proteins. Atl at spot 7 may have the signal peptide and in spot 8 the signal peptide may be missing. Atl protein plays crucial roles in the pathogenicity of S. aureus as it is directly mediated in the biofilm development and the secretion of the cytoplasmic proteins from the staphylococcal cell wall [34,35,36]. S. aureus had an increased autolytic activity in response to higher NaCl [34].
The secretion of the different proteins or different quantities of proteins could suggest that S. aureus has a range of adaptation strategies for survival under various sets of environmental conditions. The elevated intensities of a certain number of proteins compared with the constant secretion of some proteins suggested that these proteins may play specific roles in the adaptation of this bacterium to the applied conditions. In earlier work, S. aureus exhibited different secretome profiles in response to silver ions [3]. It is reasonable to hypothesize that these proteins may also have a role in neutralizing the surrounding environments.
A significant reduction in the secretion of enolase and immunodominant antigen staphylococcal A was noted following the exposure to environmental challenges. It has been shown that proteins involved in pathogenicity and metabolism were substantially decreased in response to silver ions [3] suggesting that the bacterium down regulated its metabolism and virulence factors to focus on surviving harsher conditions under nutrient limitations with accumulated waste products. The secretion of lipase 1 and 2 in the current study was more by the cells growing with the addition of NaCl compared with the cells grown without salt. S. aureus reduced its ability to form biofilm in the absence of gene-encoded lipase, suggesting that this enzyme was essential for survival and pathogenicity [37,38,39]. The same reduction was noted in S. aureus SCVs. Biofilm production is a survival mechanism used by staphylococcal species in response to environmental challenges [40,41].
In the present study, the ribosomal protein S1 was found among the secreted proteins. The 50S ribosomal protein L25, a general stress protein, was secreted together with other proteins after the exposure of S. aureus to antimicrobial silver ions [3]. A number of ribosomal proteins have also been found among surface and secreted proteins [42,43], but the functions of these secreted ribosomal proteins remain unclear. Therefore, certain members of the suite of ribosomal proteins may be secreted to the cell surface or into the external environment as a defensive mechanism in response to external challenges from the host’s immune system, antibiotics, and changing environmental conditions. The release of ribosomal proteins may be the result of the increased production of these proteins in the cytoplasm. The exposure of S. aureus to extreme cold stress and alkaline conditions combined with elevated osmotic stress led to the significant up-regulation of a high number of ribosomal proteins [6,7]. These proteins may involve in the adaptation processes of S. aureus to the prolonged exposure to 4 °C or alkaline conditions combined with elevated osmotic stress.

5. Conclusions

The current study indicated that subtle alterations in environmental factors led to significant changes in bacterial cytoplasmic and secreted protein patterns. It showed that the majority of altered cytoplasmic proteins were involved in protein biosynthesis. The analysis of the secreted proteins indicated that fewer proteins were released into external media in response to the changes to environmental conditions. The key finding of the secreted protein analysis was that the Atl protein was released to two fragments under control samples, but this protein was produced at full length and at its two domains. These changes in proteomic profiles would provide the basis for the acclimation mechanisms that have controlled the evolutionary survival of S. aureus allowing it to proliferate even in a rapidly changing environment to take the benefit of dominant environments and infectious chances.

Supplementary Materials

The following are available online at https://www.mdpi.com/2076-2607/8/7/1082/s1, Table S1: Peptide sequences and relative statistical information; Table S2: The sum of all peptide intensities quantified for each proteins.

Author Contributions

M.M.A., R.H.D., M.M.M., and T.K.R. conceived and designed the experiments. M.M.A. and R.H.D. performed the experiments. M.M.A., R.H.D. and V.K.S. analyzed the data. M.M.A. and R.H.D. wrote the manuscript with support from all authors. All authors have read and agreed to the published version of the manuscript.

Funding

This work was supported by the University of Ha’il (grant No. 160984).

Acknowledgments

We would like to thank Nathan Smith for his help in analyzing secreted proteins and Ching-Seng Ang for his contribution in running cytoplasmic proteins.

Conflicts of Interest

The authors declare no conflict of interest.

References

  1. Foster, T.J. Colonization and infection of the human host by staphylococci: Adhesion, survival and immune evasion. Vet. Dermatol. 2009, 20, 456–470. [Google Scholar] [CrossRef] [PubMed]
  2. Coates, R.; Moran, J.; Horsburgh, M.J. Staphylococci: Colonizers and pathogens of human skin. Future Microbiol. 2014, 9, 75–91. [Google Scholar] [CrossRef] [PubMed]
  3. Smith, A.; McCann, M.; Kavanagh, K. Proteomic analysis of the proteins released from Staphylococcus aureus following exposure to Ag(I). Toxicol. Vitro 2013, 27, 1644–1648. [Google Scholar] [CrossRef] [PubMed] [Green Version]
  4. Onyango, L.A.; Alreshidi, M.M. Adaptive Metabolism in Staphylococci: Survival and Persistence in Environmental and Clinical Settings. J. Pathog. 2018, 2018, 1092632. [Google Scholar] [CrossRef] [Green Version]
  5. Alreshidi, M.M.; Dunstan, R.H.; Onyango, L.A.; Roberts, T.K. Staphylococcal phenomics: Metabolomic and proteomic responses to environmental stessors. In Microbial Pathogens and Strategies for Combating Them: Science, Technology and Education; Formatex Research Center: Badajoz, Spain, 2013; pp. 690–701. [Google Scholar]
  6. Alreshidi, M.M.; Dunstan, R.H.; Gottfries, J.; Macdonald, M.M.; Crompton, M.J.; Ang, C.S.; Williamson, N.A.; Roberts, T.K. Changes in the Cytoplasmic Composition of Amino Acids and Proteins Observed in Staphylococcus aureus during Growth under Variable Growth Conditions Representative of the Human Wound Site. PLoS ONE 2016, 11, e0159662. [Google Scholar] [CrossRef] [Green Version]
  7. Alreshidi, M.M.; Dunstan, R.H.; Macdonald, M.M.; Smith, N.D.; Gottfries, J.; Roberts, T.K. Metabolomic and proteomic responses of Staphylococcus aureus to prolonged cold stress. J. Proteomics. 2015, 121, 44–55. [Google Scholar] [CrossRef]
  8. Onyango, L.A.; Dunstan, R.H.; Gottfries, J.; Eiff, C.V.; Roberts, T.K. Effect of Low Temperature on Growth and Ultra-Structure of Staphylococcus spp. PLoS ONE 2012, 7, e29031. [Google Scholar] [CrossRef] [Green Version]
  9. Onyango, L.A.; Dunstan, R.H.; Roberts, T.K.; Macdonald, M.M.; Gottfries, J. Phenotypic variants of staphylococci and their underlying population distributions following exposure to stress. PLoS ONE 2013, 8, e77614. [Google Scholar] [CrossRef] [Green Version]
  10. Tuchscherr, L.; Hussain, M.; Völker, W.; Heitmann, V.; Niemann, S.; Holzinger, D.; Rorh, J.; Proctor, R.A.; Becker, K.; Peters, G.; et al. Staphylococcus aureus phenotype switching: An effective bacterial strategy to escape host immune response and establish a chronic infection. EMBO Mol. Med. 2011, 3, 129–141. [Google Scholar] [CrossRef]
  11. Proctor, R.A.; Kriegeskorte, A.; Kahl, B.C.; Becker, K.; Löffler, B.; Peters, G. Staphylococcus aureus Small Colony Variants (SCVs): A road map for the metabolic pathways involved in persistent infections. Front. Cell Infect. Microbiol. 2014, 4, 99. [Google Scholar] [CrossRef]
  12. Tuchscherr, L.; Loffler, B.; Proctor, R.A. Persistence of Staphylococcus aureus: Multiple Metabolic Pathways Impact the Expression of Virulence Factors in Small-Colony Variants (SCVs). Front. Microbiol. 2020, 11, 1028. [Google Scholar] [CrossRef] [PubMed]
  13. Von Eiff, C. Staphylococcus aureus small colony variants: A challenge to microbiologists and clinicians. Int. J. Antimicrob. Agents 2008, 31, 507–510. [Google Scholar] [CrossRef] [PubMed]
  14. Sotto, A.; Lina, G.; Richard, J.L.; Combescure, C.; Bourg, G.; Vidal, L.; Jourdan, N.; Etienne, J.; Lavihne, J.P. Virulence potential of Staphylococcus aureus strains isolated from diabetic foot ulcers: A new paradigm. Diabetes Care 2008, 31, 2318–2324. [Google Scholar] [CrossRef] [PubMed] [Green Version]
  15. Almeida, G.C.; Santos, M.M.; Lima, N.G.; Cidral, T.A.; Melo, M.C.; Lima, K.C. Prevalence and factors associated with wound colonization by Staphylococcus spp. and Staphylococcus aureus in hospitalized patients in inland northeastern Brazil: A cross-sectional study. BMC Infect. Dis. 2014, 14, 328. [Google Scholar] [CrossRef] [PubMed] [Green Version]
  16. Schneider, L.A.; Korber, A.; Grabbe, S.; Dissemond, J. Influence of pH on wound-healing: A new perspective for wound-therapy? Arch. Dermatol. Res. 2007, 298, 413–420. [Google Scholar] [CrossRef]
  17. Lenhardt, R.; Sessler, D.I. Estimation of mean body temperature from mean skin and core temperature. Anesthesiology 2006, 105, 1117–1121. [Google Scholar] [CrossRef] [Green Version]
  18. Celeste, C.J.; Deschesne, K.; Riley, C.B.; Theoret, C.L. Skin Temperature during Cutaneous Wound Healing in an Equine Model of Cutaneous Fibroproliferative Disorder: Kinetics and Anatomic-Site Differences. Vet. Surg. 2013, 42, 147–153. [Google Scholar] [CrossRef]
  19. Crompton, M.J.; Dunstan, R.H.; Macdonald, M.M.; Gottfries, J.; von Eiff, C.; Roberts, T.K. Small changes in environmental parameters lead to alterations in antibiotic resistance, cell morphology and membrane fatty acid composition in Staphylococcus lugdunensis. PLoS ONE 2014, 9, e92296. [Google Scholar] [CrossRef] [Green Version]
  20. Alreshidi, M.M.; Dunstan, R.H.; Macdonald, M.M.; Gottfries, J.; Roberts, T.K. The Uptake and Release of Amino Acids by Staphylococcus aureus at Mid-Exponential and Stationary Phases and Their Corresponding Responses to Changes in Temperature, pH and Osmolality. Front. Microbiol. 2020, 10, 3059. [Google Scholar] [CrossRef]
  21. Wehrli, P.M.; Lindberg, E.; Svensson, O.; Sparén, A.; Josefson, M.; Dunstan, R.H.; Wold, A.E.; Gottfries, J. Exploring bacterial phenotypic diversity using factorial design and FTIR multivariate fingerprinting. Chemometrics 2014, 30, 283–289. [Google Scholar] [CrossRef]
  22. Butt, H.L.; Dunstan, R.H.; McGregor, N.R.; Roberts, T.K.; Zerbes, M.; Klineberg, I.J. An association of membrane-damaging toxins from coagulase-negative staphylococci and chronic orofacial muscle pain. J. Med. Microbiol. 1998, 47, 577–584. [Google Scholar] [CrossRef]
  23. Alreshidi, M.M. Selected Metabolites Profiling of Staphylococcus aureus Following Exposure to Low Temperature and Elevated Sodium Chloride. Front. Microbiol. 2020, 11, 834. [Google Scholar] [CrossRef] [PubMed]
  24. Missiakas, D.M.; Schneewind, O. Growth and laboratory maintenance of Staphylococcus aureus. Curr. Protoc. Microbiol. 2013. Chapter 9, Unit 9C 1. [Google Scholar] [CrossRef]
  25. Brown, G.K.; Martin, A.R.; Roberts, T.K.; Aitken, R.J. Detection of Ehrlichia platys in dogs in Australia. Aust. Vet. J. 2001, 79, 554–558. [Google Scholar] [CrossRef]
  26. Scharfman, A.; Kroczynski, H.; Carnoy, C.; Brussel, E.V.; Lamblin, G.; Ramphal, R.; Roussel, P. Adhesion of Pseudomonas aeruginosa to respiratory mucins and expression of mucin-binding proteins are increased by limiting iron during growth. Infect. Immun. 1996, 64, 5417–5420. [Google Scholar] [CrossRef] [PubMed] [Green Version]
  27. Weschler, L.B. Sweat electrolyte concentrations obtained from within occlusive coverings are falsely high because sweat itself leaches skin electrolytes. J. Appl. Physiol. 2008, 105, 1376–1377. [Google Scholar] [CrossRef] [Green Version]
  28. Heberle, H.; Meirelles, G.V.; Silva, F.R.; Telles, G.P.; Minghim, R. InteractiVenn: A web-based tool for the analysis of sets through Venn diagrams. BMC Bioinform. 2015, 16, 169. [Google Scholar] [CrossRef]
  29. Thomas, P.D.; Campbell, M.J.; Kejariwal, A.; Mi, H.; Karlak, B.; Daverman, R.; Diemer, K.; Muruganujan, A.; Narechania, A. PANTHER: A library of protein families and subfamilies indexed by function. Genome Res. 2003, 13, 2129–2141. [Google Scholar] [CrossRef] [Green Version]
  30. Shevchenko, A.; Wilm, M.; Vorm, O.; Mann, M. Mass spectrometric sequencing of proteins silver-stained polyacrylamide gels. Anal. Chem. 1996, 68, 850–858. [Google Scholar] [CrossRef]
  31. Siqueira, W.L.; Bakkal, M.; Xiao, Y.; Sutton, J.N.; Mendes, F.M. Quantitative proteomic analysis of the effect of fluoride on the acquired enamel pellicle. PLoS ONE 2012, 7, e42204. [Google Scholar] [CrossRef]
  32. Kriegeskorte, A.; König, S.; Sander, G.; Pirkl, A.; Mahabir, E.; Proctor, R.A.; von Eiff, C.; Peters, G.; Becker, K. Small colony variants of Staphylococcus aureus reveal distinct protein profiles. Proteomics 2011, 11, 2476–2490. [Google Scholar] [CrossRef] [PubMed]
  33. Ming, T.; Geng, L.; Feng, Y.; Lu, C.; Zhou, J.; Li, Y.; Zhang, D.; He, S.; Li, Y.; Cheong, L.; et al. iTRAQ-Based Quantitative Proteomic Profiling of Stapfhylococcus aureus Under Different Osmotic Stress Conditions. Front. Microbiol. 2019, 10, 1082. [Google Scholar] [CrossRef] [PubMed] [Green Version]
  34. Tobin, P.J.; Mani, N.; Jayaswal, R.K. Effect of physiological conditions on the autolysis of Staphylococcus aureus strains. Antonie Van Leeuwenhoek 1994, 65, 71–78. [Google Scholar] [CrossRef] [PubMed]
  35. Sugai, M.; Komatsuzawa, H.; Akiyama, T.; Hong, Y.M.; Oshida, T.; Yamaguchi, T.; Suginaka, H. Identification of endo-beta-N-acetylglucosaminidase and N-acetylmuramyl-L-alanine amidase as cluster-dispersing enzymes in Staphylococcus aureus. J. Bacteriol. 1995, 177, 1491–1496. [Google Scholar] [CrossRef] [Green Version]
  36. Singh, V.K. High Level Expression and Purification of Atl, the Major Autolytic Protein of Staphylococcus aureus. Int. J. Microbiol. 2014, 2014, 615965. [Google Scholar] [CrossRef] [Green Version]
  37. Sudagidan, M.; Cavusoglu, C.; Bacakoglu, F. Investigation of the virulence genes in methicillin-resistant Staphylococcus aureus strains isolated from biomaterial surfaces. Mikrobiyol. Bul. 2008, 42, 29–39. [Google Scholar]
  38. Merghni, A.; Nejma, M.B.; Hentati, H.; Mahjoub, A.; Mastouri, M. Adhesive properties and extracellular enzymatic activity of Staphylococcus aureus strains isolated from oral cavity. Microb. Pathog. 2014, 73, 7–12. [Google Scholar] [CrossRef] [PubMed]
  39. Hu, C.; Xiong, N.; Zhang, Y.; Rayner, S.; Chen, S. Functional characterization of lipase in the pathogenesis of Staphylococcus aureus. Biochem. Biophys. Res. Commun. 2012, 419, 617–620. [Google Scholar] [CrossRef]
  40. Resch, A.; Rosenstein, R.; Nerz, C.; Gotz, F. Differential gene expression profiling of Staphylococcus aureus cultivated under biofilm and planktonic conditions. Appl. Environ. Microbiol. 2005, 71, 2663–2676. [Google Scholar] [CrossRef] [Green Version]
  41. Monzon, M.; Oteiza, C.; Leiva, J.; Amorena, B. Synergy of different antibiotic combinations in biofilms of Staphylococcus epidermidis. J. Antimicrob. Chemother. 2001, 48, 793–801. [Google Scholar] [CrossRef] [Green Version]
  42. Jeffery, C.J. Moonlighting proteins--an update. Mol. Biosyst. 2009, 5, 345–350. [Google Scholar] [CrossRef] [PubMed]
  43. Squires, C.L.; Zaporojets, D. Proteins shared by the transcription and translation machines. Annu. Rev. Microbiol. 2000, 54, 775–798. [Google Scholar] [CrossRef] [PubMed]
Figure 1. Bacterial proteins differentially regulated or unchanged in each experimental group (BF) in comparison to the reference control samples (A).
Microorganisms 08 01082 g001
Figure 2. Venn diagram of the differentially regulated proteins. The sum of the number of non-overlapping circles represents the total number of differentially regulated proteins found only in that respective treatment; the overlapping parts of the circles indicate the differentially regulated proteins common between the experimental groups.
Microorganisms 08 01082 g002
Figure 3. Gene ontology enrichment analysis of the molecular function of the differentially regulated proteins.
Microorganisms 08 01082 g003
Figure 4. (a) PCA analysis of the differentially regulated proteins’ (A) control cultures grown under ideal conditions at pH 7 and 37 °C with no added NaCl; (B) the centroid cultures grown at pH 7 and 37 °C with additional 2.5% NaCl, and the four experimental groups: (C) 35 °C and pH 6 with no added NaCl; (D) 35 °C and pH 8 with no added NaCl; (E) 35 °C and pH 6 with 5% NaCl added; (F) 35 °C and pH 8 with 5% NaCl. (b) The loadings PC1, PC2, and PC3 demonstrated the contributions of the proteins to the model.
Microorganisms 08 01082 g004
Figure 5. Heatmap represents the abundance of altered proteins extracted from the cells harvested at mid-exponential phase, grown under normal conditions (reference control, A) compared to the five different sets of experimental conditions (BF). The key color indicates the protein abundance.
Microorganisms 08 01082 g005
Figure 6. SDS-PAGE analysis of the stationary phase secreted proteins of S. aureus grown under the control conditions, compared with the two different experimental treatments. The numbers indicate the bands that were sliced for the identification by LC–MS/MS.
Microorganisms 08 01082 g006
Table 1. Bacterial proteins differentially regulated following the exposure to changing environmental conditions (B–E) in comparison to the reference control samples (A).
Biological ProcessMolecular FunctionUniprot Entry NameProteins IDExperimental Conditions
BCDEF
37 °C 2.5%NaCl pH7; Centroid35 °C 0%NaCl pH6; 35 C 0%NaCl pH8; 35 °C 5%NaCl pH6; 35 °C 5%NaCl pH8;
Protein biosynthesis Elongation factorEFG_STAA1Elongation factor GUp regulatedNCNCDown regulatedUp regulated
Protein biosynthesis Elongation factorEFTS_STAA1Elongation factor Ts Up regulatedNCNCDown regulatedUp regulated
Protein biosynthesisElongation factorEFTU_STAA1Elongation factor TuUp regulatedNCNCDown regulatedUp regulated
Protein biosynthesis Elongation factorEFP_STAA1 Elongation factor P NCNCNCDown regulatedUp regulated
Protein biosynthesis Aminoacyl–tRNA synthetase and ligaseSYV_STAA1Valine__tRNA ligaseUp regulatedNCNCNCUp regulated
Protein biosynthesis Initiation factorIF2_STAA1IF2_STAA1 translation initiation factor IF–2Up regulatedNCNCDown regulatedUp regulated
Protein biosynthesis Ligase GATA_STAA2 Glutamyl_tRNA (Gln) amidotransferase subunit AUp regulatedNCUp regulatedDown regulatedUp regulated
Protein biosynthesis LigaseGATB_STASPAspartyl/glutamyl_tRNA (Asn/Gln) amidotransferase subunit B Up regulatedNCNCNCUp regulated
Protein biosynthesisAminoacyl–tRNA synthetase and ligaseSYI1_STAAUIsoleucine__tRNA ligaseUp regulatedNCNCNCUp regulated d
Protein biosynthesis Aminoacyl–tRNA synthetase, ligaseSYP_STAA1Proline__tRNA ligaseNCNCNCUp regulatedUp regulated
Protein biosynthesis Glycine–tRNA ligase SYG_STAA1Glycine__tRNA ligase Up regulatedNCNCDown regulatedUp regulated
Protein biosynthesisAminoacyl–tRNA synthetase and ligaseSYS_STAA1Serine__tRNA ligaseUp regulatedNCNCDown regulatedUp regulated
Glycolysis OxidoreductaseG3P1_STAACGlyceraldehyde_3_phosphate dehydrogenase 1 Up regulatedNCNCDown regulatedUp regulated
GlycolysisKinase and transferase KPYK_STAA3Pyruvate kinase Up regulatedNCNCDown regulatedUp regulated
GlycolysisOxidoreductaseDLDH_STAACDihydrolipoyl dehydrogenaseUp regulatedNCNCDown regulatedUp regulated
Glycolysis OxidoreductaseODPB_STAAM Pyruvate dehydrogenase E1 component subunit beta NCNC NCDown regulatedNC
GlycolysisLyaseALF2_STAACFructose_bisphosphate aldolase NCNCNCDown regulatedUp regulated
GlycolysisAllosteric enzyme, kinase and transferaseK6PF_STAA2 Dependent 6_phosphofructokinase Up regulatedNCNCDown regulatedUp regulated
Gluconeogenesis and glycolysisIsomeraseG6PI_STAA1Glucose_6_phosphate isomerase Up regulatedNCNCDown regulated Up regulated
Glycolysis and virulence Lyase ENO_STAA1 Enolase NCNCNCDown regulated Up regulated
Virulence Chaperon CLPL_STAA3ATP_dependent Clp protease ATP_binding subunit ClpLNCNCNCDown regulatedUp regulated
Transcription regulation and virulenceActivator, DNA-binding and repressorMGRA_STAA8HTH_type transcriptional regulator MgrA Up regulatedNCNCNCUp regulated
Transcription Nucleotidyltransferase and transferaseRPOB_STAA9 DNA directed RNA polymerase subunit betaUp regulatedNCNCNCUp regulated
Stress responseOxidoreductaseLDH1_STAA1L_lactate dehydrogenase 1 Up regulatedNCNCDown regulated Up regulated
Stress responseChaperoneDNAK_STAA1Chaperone protein DnaK NCDown regulatedNCDown regulatedUp regulated
General stress proteinAlkaline pH toleranceASP23_STAA3Alkaline shock protein 23 NCNCNCUp regulatedNC
DNA damage repair and stress response HydrolaseHCHA_STAAWProtein/nucleic acid deglycase HchAUp regulatedDown regulatedNCUp regulatedUp regulated
ATP synthesis, hydrogen ion transport, ion transport, transportTranslocaseATPA_STAA1ATP synthase subunit alpha NCDown regulatedNCDown regulatedUp regulated
Ion storage OxidoreductaseFTN_STAA3FerritinUp regulatedNCNCNCUp regulated
Alcohol metabolic processOxidoreductaseADH_STAA3Alcohol dehydrogenaseUp regulatedNCNCDown regulated Up regulated
Hydrogen peroxide catabolic process aOxidoreductase and peroxidaseCATA_STAA3Catalase; Up regulatedNCUp regulatedNC Up regulated
DNA recombination TransferaseTKT_STAACTransketolase Up regulatedNCNCDown regulated Up regulated
Glycine betaine biosynthetic process from cholineOxidoreductaseBETA_STAA1Choline dehydrogenaseNCNCNCNCUp regulated
mRNA catabolic process and RNA processing Nucleotidyltransferase RNA-binding and transferasePNP_STAA1Polyribonucleotide nucleotidyltransferase Up regulatedNCNCDown regulatedUp regulated
Glycerol metabolismOxidoreductaseGLPD_STAA3Aerobic glycerol_3_phosphate dehydrogenaseUp regulatedNCNCDown regulatedUp regulated
GMP biosynthesisOxidoreductaseIMDH_STAA3Inosine_5__monophosphate dehydrogenaseUp regulatedNCNCDown regulatedUp regulated
Carbohydrate metabolismAcyltransferasePFLB_STAA3Formate acetyltransferase Up regulatedNCNCDown regulatedUp regulated
Carbohydrate metabolic processMagnesium ion binding and phosphoglucosamine mutase activityGLMM_STAA1Phosphoglucosamine mutaseUp regulatedNCNCDown regulatedUp regulated
Acetyl-CoA biosynthetic process and organic acid metabolic processKinase transferase ACKA_STAA1Acetate kinase NCNCNCDown regulatedNC
Protein transport, translocation and transportATPase-coupled protein transmembrane transporter activity, ATP binding and metal ion binding SECA1_STAA1Protein translocase subunit SecA 1Up regulatedNCNCDown regulatedUp regulated
Uncharacterized UncharacterizedY1663_STAANUPF0342 protein SA1663 NCDown regulatedNCUp regulatedUp regulated
Uncharacterized Uncharacterized Y1402_STAANUPF0365 protein SA1402NCNCNCDown regulatedUp regulated
Uncharacterized UncharacterizedY1582_STAA3UPF0337 protein SAUSA300_1582 Up regulatedDown regulatedNCUp regulatedUp regulated
Amino acid biosynthesis TransferaseCYSK_STAACCYSK_STAAC cysteine synthase NCNCNCDown regulatedNC
Amino acid biosynthesis LigaseGLNA_STAACGLNA_STAAC glutamine synthetase Up regulatedNCNCDown regulatedUp regulated
Cell wall biogenesis/degradation Hydrolase ATL_STAARBifunctional autolysin precursor Up regulatedUp regulatedUp regulatedUp regulated Up regulated
Cell wall biosynthesis Adhesion SDRD_STAAESerine_aspartate repeat_containing protein D Down regulatedUp regulatedNCDown regulatedDown regulated
Cell redox homeostasis and response to reactive oxygen species OxidoreductaseAHPF_STAA8Alkyl hydroperoxide reductase subunit F NCNCNCNCUp regulated
Energy production and conversion OxidoreductaseY807_STAABNADH dehydrogenase_like protein SAB0807 Up regulatedNCNCDown regulatedUp regulated
Energy production and conversion HydrolasePPAC_STAA1Probable manganese_dependent inorganic pyrophosphataseUp regulatedNCUp regulatedDown regulatedUp regulated
Uncharacterized Uncharacterized PLS_STAAMPutative surface protein SAV2496/SAV2497; Flags: PrecursorDown regulatedUp regulatedNCDown regulatedDown regulated
Asparaginyl–tRNA aminoacylationAsparagine–tRNA ligase activity, ATP binding and nucleic acid bindingSYN_LISINAsparagine__tRNA ligaseUp regulatedNCNCDown regulatedUp regulated
Protein folding peptidyl-prolyl cis-trans isomerase activityPRSA_STAA1Foldase protein PrsANCNCNCDown regulatedUp regulated
Cell cycle, cell division, and SeptationGTPase activity and GTP bindingFTSZ_STAA8Cell division protein FtsZNCNCNCDown regulatedUp regulated
Cell cycle and cell divisionChaperone, isomerase and rotamaseTIG_STAA1Trigger factorNCNCNCDown regulatedUp regulated
Cell cycle, cell division, cell shape, cell wall biogenesis/degradation, peptidoglycan synthesisTransferaseMURA2_STAANUDP_N_acetylglucosamine 1_carboxyvinyltransferase 2Up regulatedNCNCNCUp regulated
Virulence Hydrolase SSAA2_STAA8Staphylococcal secretory antigen ssaA2NCUp regulatedNCUp regulatedNC
Removal of superoxide radicalsOxidoreductaseTRXB_STAEQThioredoxin reductase Up regulatedNCNCDown regulatedUp regulated
Phosphotransferase system, sugar transport and transportKinase and transferasePT1_STAACPhosphoenolpyruvate_protein phosphotransferase Up regulatedNCNCDown regulated Up regulated
Pyrimidine biosynthesisAllosteric enzyme, kinase and transferasePYRH_STAAEUridylate kinase Up regulatedNCNCDown regulatedUp regulated
Table 2. Identified proteins within the bands that varied in abundance between the strains and treatments.
Band #AccessionProteinScoresMW (kDa)Peptides
1LIP1_STAACLipase 1 1675.5 76.628
LIP2_STAAMLipase 2 precursor 1592.0 76.525
tr|F0D7U9|F0D7U9_STAAUAutolysin 810.9 137.015
AccessionProteinScoresMW (kDa)Peptides
2CATA_STAABCatalase 710.7 58.328
RS1_STAAC30S ribosomal protein S1 615.1 43.39
H0AR71_STAAUElongation factor Tu 431.5 43.120
tr|T1Y7Q4|T1Y7Q4_STAAUEnolase 406.0 47.08
tr|T1YAV3|T1YAV3_STAAUFormate-tetrahydrofolate ligase 349.2 61.18
tr|N5DN28|N5DN28_STAAUATP synthase subunit beta 309.1 51.46
3AccessionProteinScoresMW (kDa)Peptides
tr|S9RPT3|S9RPT3_STAAUAlkyl hydroperoxide reductase subunit C 518.2 20.97
4AccessionProteinScoresMW (kDa)Peptides
ATL_STAAMATL_STAAM Bifunctional autolysin precursor (includes: N-acetylmuramoyl-L-alanine amidase (EC 3.5.1.28); mannosyl-glycoprotein endo-beta-N-acetylglucosaminidase (EC 3.2.1.96))3684.0136.747
5AccessionProteinScoresMW (kDa)Peptides
ATL_STAAMBifunctional autolysin precursor (includes: N-acetylmuramoyl-L-alanine amidase (EC 3.5.1.28); mannosyl-glycoprotein endo-beta-N-acetylglucosaminidase (EC 3.2.1.96)3684.2 136.757
LTAS_STAACGlycerol phosphate lipoteichoic acid synthase 1940.1 74.432
tr|F3TIS4|F3TIS4_STAAUTriacylglycerol lipase 336.5 72.26
tr|G7ZSU9|G7ZSU9_STAAUProbable transglycosylase isaA 607.724.17
6AccessionProteinScoresMW (kDa)Peptides
LIP2_STAACLipase 2 precursor (EC 3.1.1.3) 620.7 76.312
ISAA_STAACImmunodominant staphylococcal antigen A precursor 441.1 24.25
7AccessionProteinScoresMW (kDa)Peptides
ATL_STAAWBifunctional autolysin precursor (includes: N-acetylmuramoyl-L-alanine amidase (EC 3.5.1.28); mannosyl-glycoprotein endo-beta-N-acetylglucosaminidase) 5871.0 137.388
SDRD_STAAESerine-aspartate repeat-containing protein D 378.3 142.76
8AccessionProteinScoresMW (kDa)Peptides
ATL_STAAWBifunctional autolysin precursor (includes: N-acetylmuramoyl-L-alanine amidase (EC 3.5.1.28); mannosyl-glycoprotein endo-beta-N-acetylglucosaminidase (EC 3.2.1.96))4932.6 137.377
LIP2_STAACLipase 2 precursor (EC 3.1.1.3) 404.2 76.39

