3.1. Soluble Substrate (Maltodextrin)
Individually,
S. cerevisiae is incapable of digesting complex substrates while
A. oryzae does not produce ethanol.
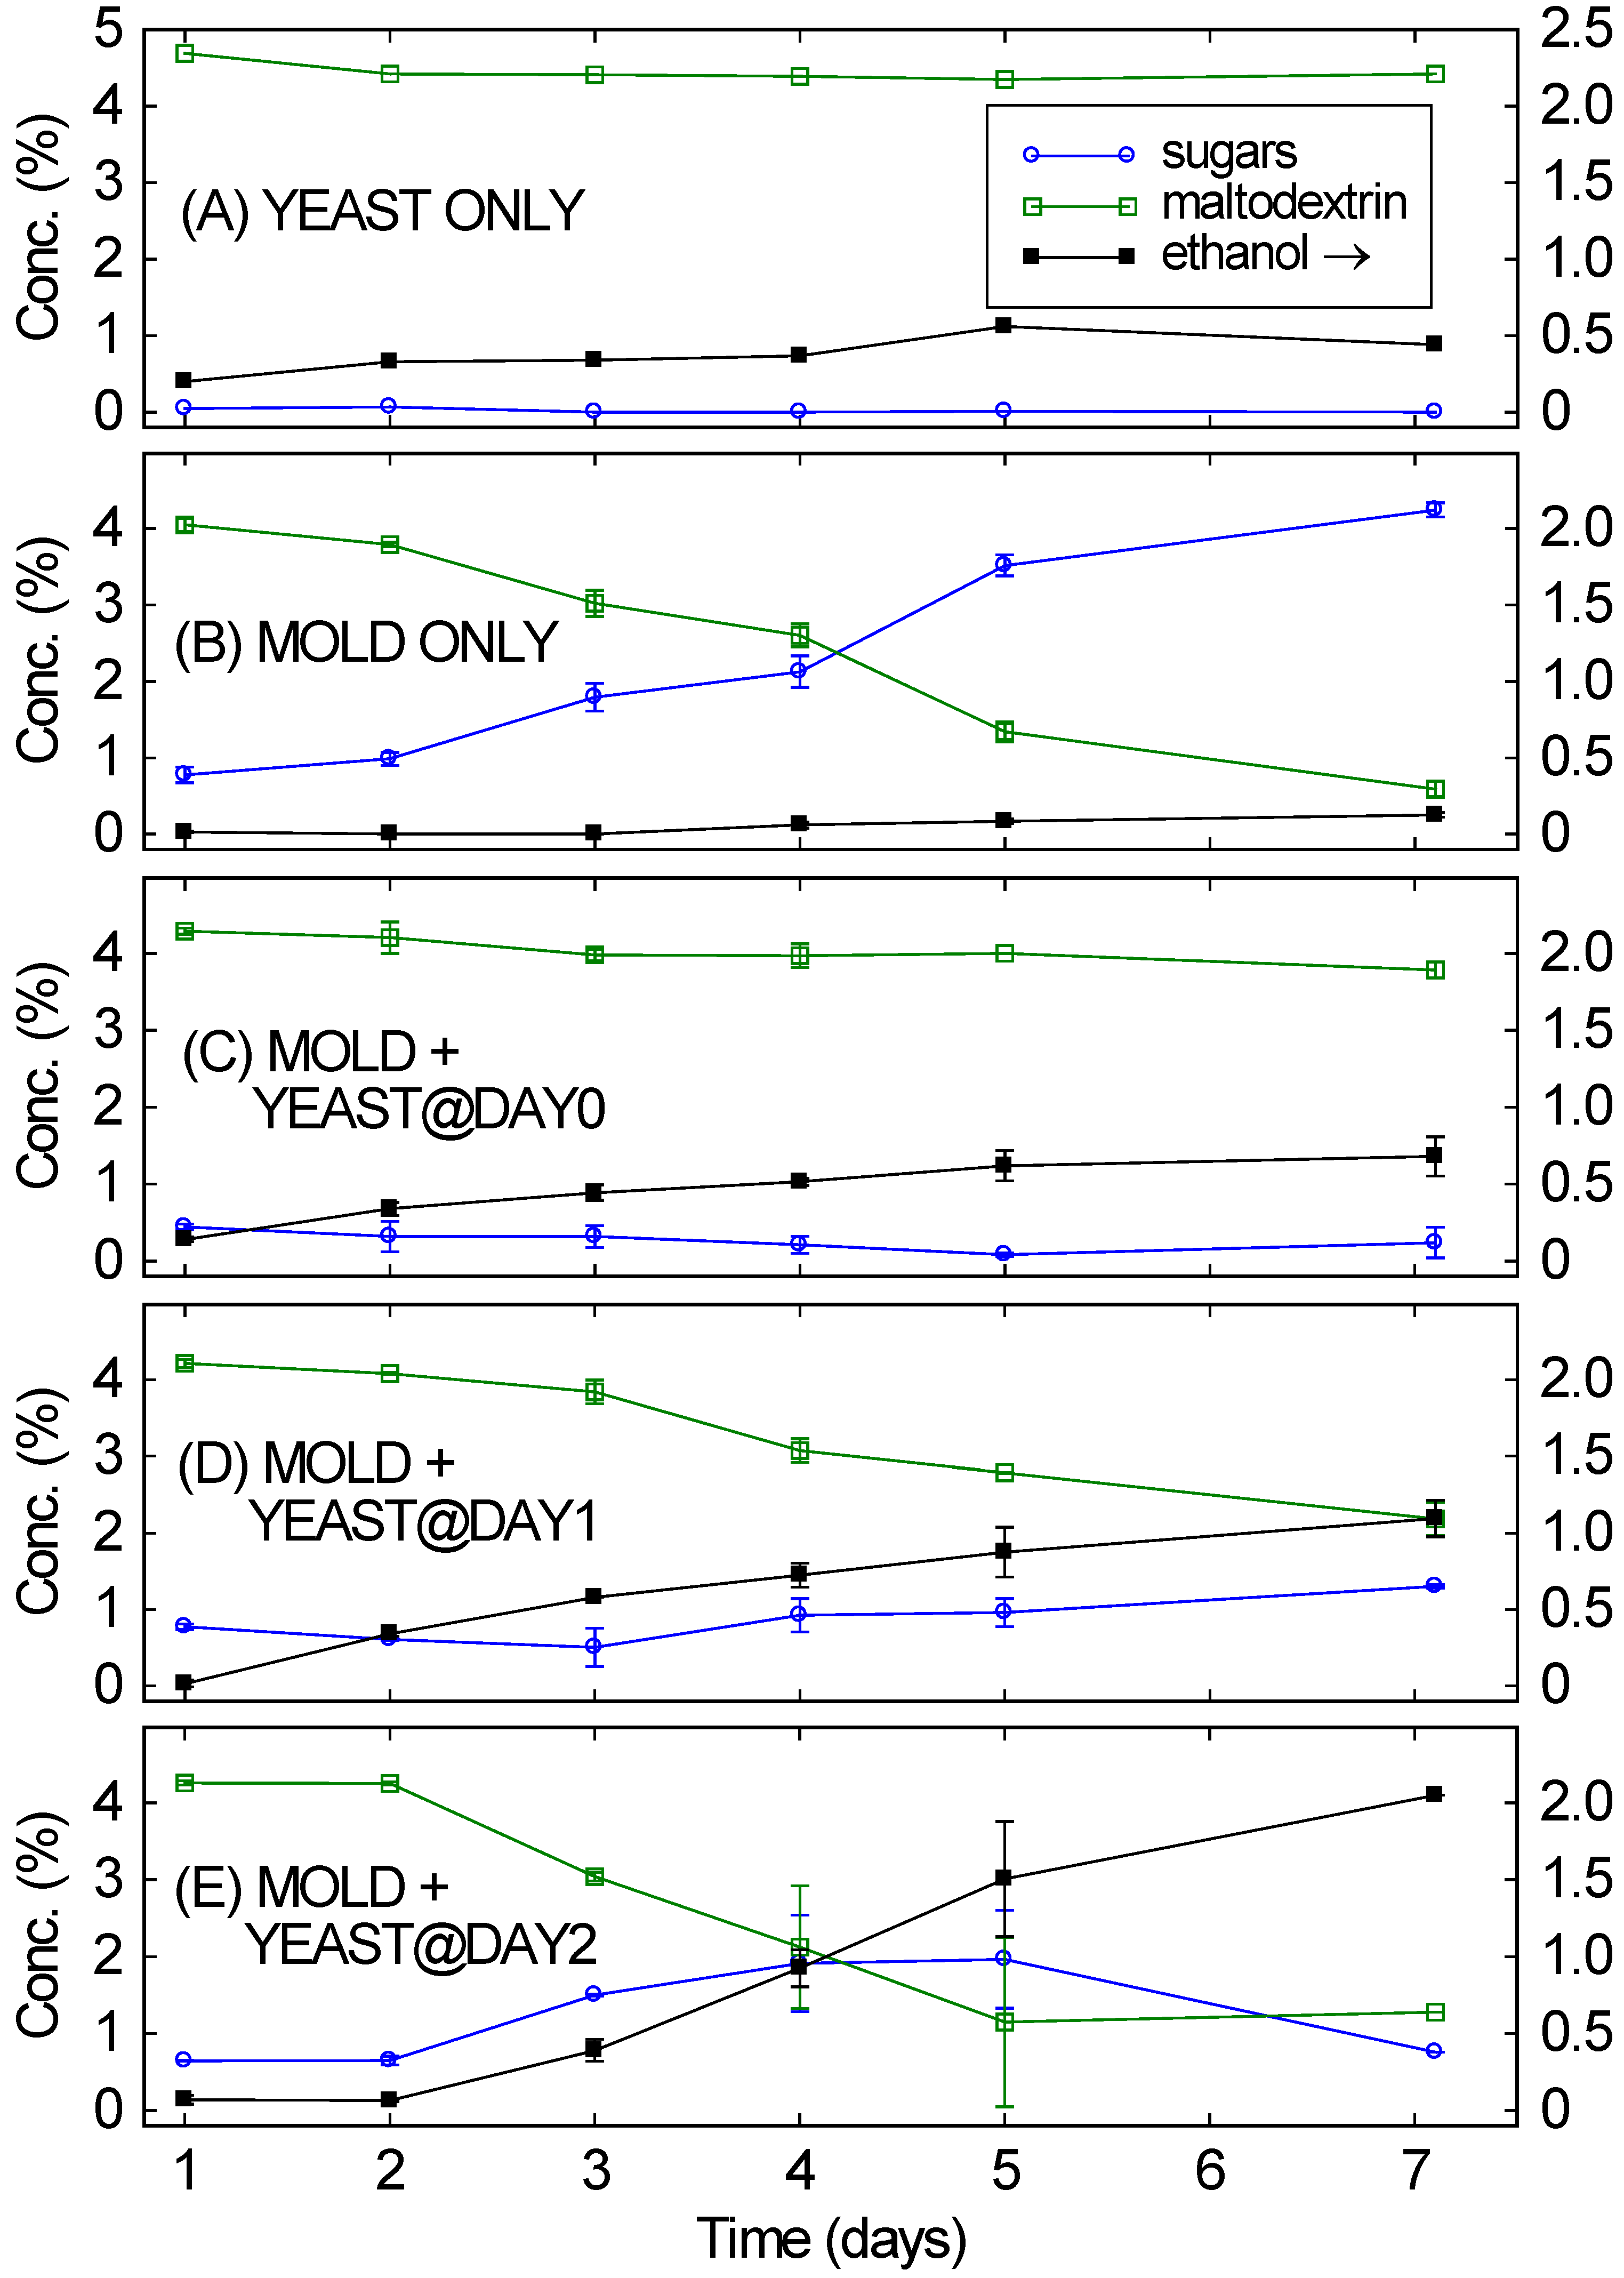
Figure 1A,B confirm that when only a single organism was added to a medium of maltodextrin, ethanol production was very limited. When only
S. cerevisiae was present (
Figure 1A), over seven days it fermented a small amount of ethanol, likely from trace amounts of simple sugars present in the maltodextrin. But its inability to break down the maltodextrin greatly limited the amount of the ethanol that was produced after seven days (0.4%). The right-hand axis’s scale is for ethanol.
When
A. oryzae was grown by itself on the same medium (
Figure 1B), the maltodextrin was nearly completely broken down into simple sugars after seven days. The rate of maltodextrin conversion into simple sugars was initially fairly slow (0.2% per day) but increased over the length of the culture, exceeding 0.5% per day by the end of the culture. Only a fraction of the broken down maltodextrin was immediately captured by
A. oryzae. Most was available in solution as simple sugars, almost entirely maltose and maltotriose. However, ethanol was not produced in any appreciable quantities and large amounts of simple sugars remained in solution.
In contrast, when both organisms are operating properly in a consortium, they are capable of digesting complex substrates to produce ethanol. Yet not all conditions are well suited to both organisms operating in a cooperative manner. For example, as
Figure 1C–E collectively show, it is beneficial to have the
A. oryzae well-established in a medium before introducing
S. cerevisiae. When
A. oryzae and
S. cerevisiae were added at the same time (
Figure 1C),
A. oryzae grew very slowly and only a small amount of the 5% maltodextrin was digested, leaving 3.8% maltodextrin after a week. No simple sugars were detected in the fermentation, likely indicating that
S. cerevisiae converted the simple sugars to ethanol as fast as they were produced by
A. oryzae. The fast-metabolizing yeast inhibited the mold, which reduced secretion of the mold’s enzymes, which reduced maltodextrin breakdown, which in turn inhibited the yeast. The final ethanol concentration was only 0.7%; only a little maltodextrin was digested. Similar results (not shown) were obtained if
S. cerevisiae was added before
A. oryzae.
Figure 1.
Concentrations of sugars and maltodextrin (left scale) and of ethanol (right scale) over time for 5 different consortia of the mold A. oryzae and the yeast S. cerevisiae, starting from 5% maltodextrin at Day 0. (A) Mold only; (B) Yeast only; (C) Mold and yeast; (D) Mold, with yeast added 1 day later; (E) Mold, with yeast added 2 days later.
Delaying the yeast gave very different results. If the
S. cerevisiae was added one or two days after the
A. oryzae, the
A. oryzae had a chance to get established and to start digesting the maltodextrin before the
S. cerevisiae began fermenting the simple sugars into ethanol. For
S. cerevisiae added one day after
A. oryzae (
Figure 1D), the rate of maltodextrin digestion increased gradually over the fermentation, reaching slightly more than 0.3% per day by the end of the fermentation. This resulted in a decrease from 4% to 2% maltodextrin over the course of the fermentation.
S. cerevisiae turned the simple sugars being produced by
A. oryzae into ethanol, resulting in 1% ethanol after seven days.
When the delay before adding
S. cerevisiae was increased to 2 days,
A. oryzae was even more effective in breaking down the maltodextrin, with the rate of maltodextrin breakdown exceeding 0.5% per day by the end of the fermentation. See
Figure 1E. This value is similar to the rate observed without any
S. cerevisiae present (
Figure 1B), indicating that
S. cerevisiae is not intrinsically inhibitory to
A. oryzae. As with the other consortia,
S. cerevisiae fermented the simple sugars into ethanol, but, since more sugars were being produced by
A. oryzae, higher ethanol concentrations were reached (>2% by day 7). This “delayed consortium” approach has been long used in sake making [
19]. Besides ensuring that
S. cerevisiae has ample simple sugars to ferment, the delay also enables
A. oryzae to be well-established before being stressed by the ethanol from
S. cerevisiae.
3.2. Solid Substrates (Crackers and Rice)
While
A. oryzae–S. cerevisiae consortia are well suited to break down soluble starches, many substrates of interest (e.g., agricultural or food waste) are present as solids [
5,
11]. The hyphae produced by
A. oryzae are particularly well suited for digesting solid substrates [
25]. Two common components of food waste that are indigestible by
S. cerevisiae were selected: crackers made with only wheat and water (here, matzo), and plain uncooked rice. When these substrates were added to 0.5% YP and inoculated with
S. cerevisiae only, no ethanol was produced, even after several weeks, as expected (not shown). In contrast, when
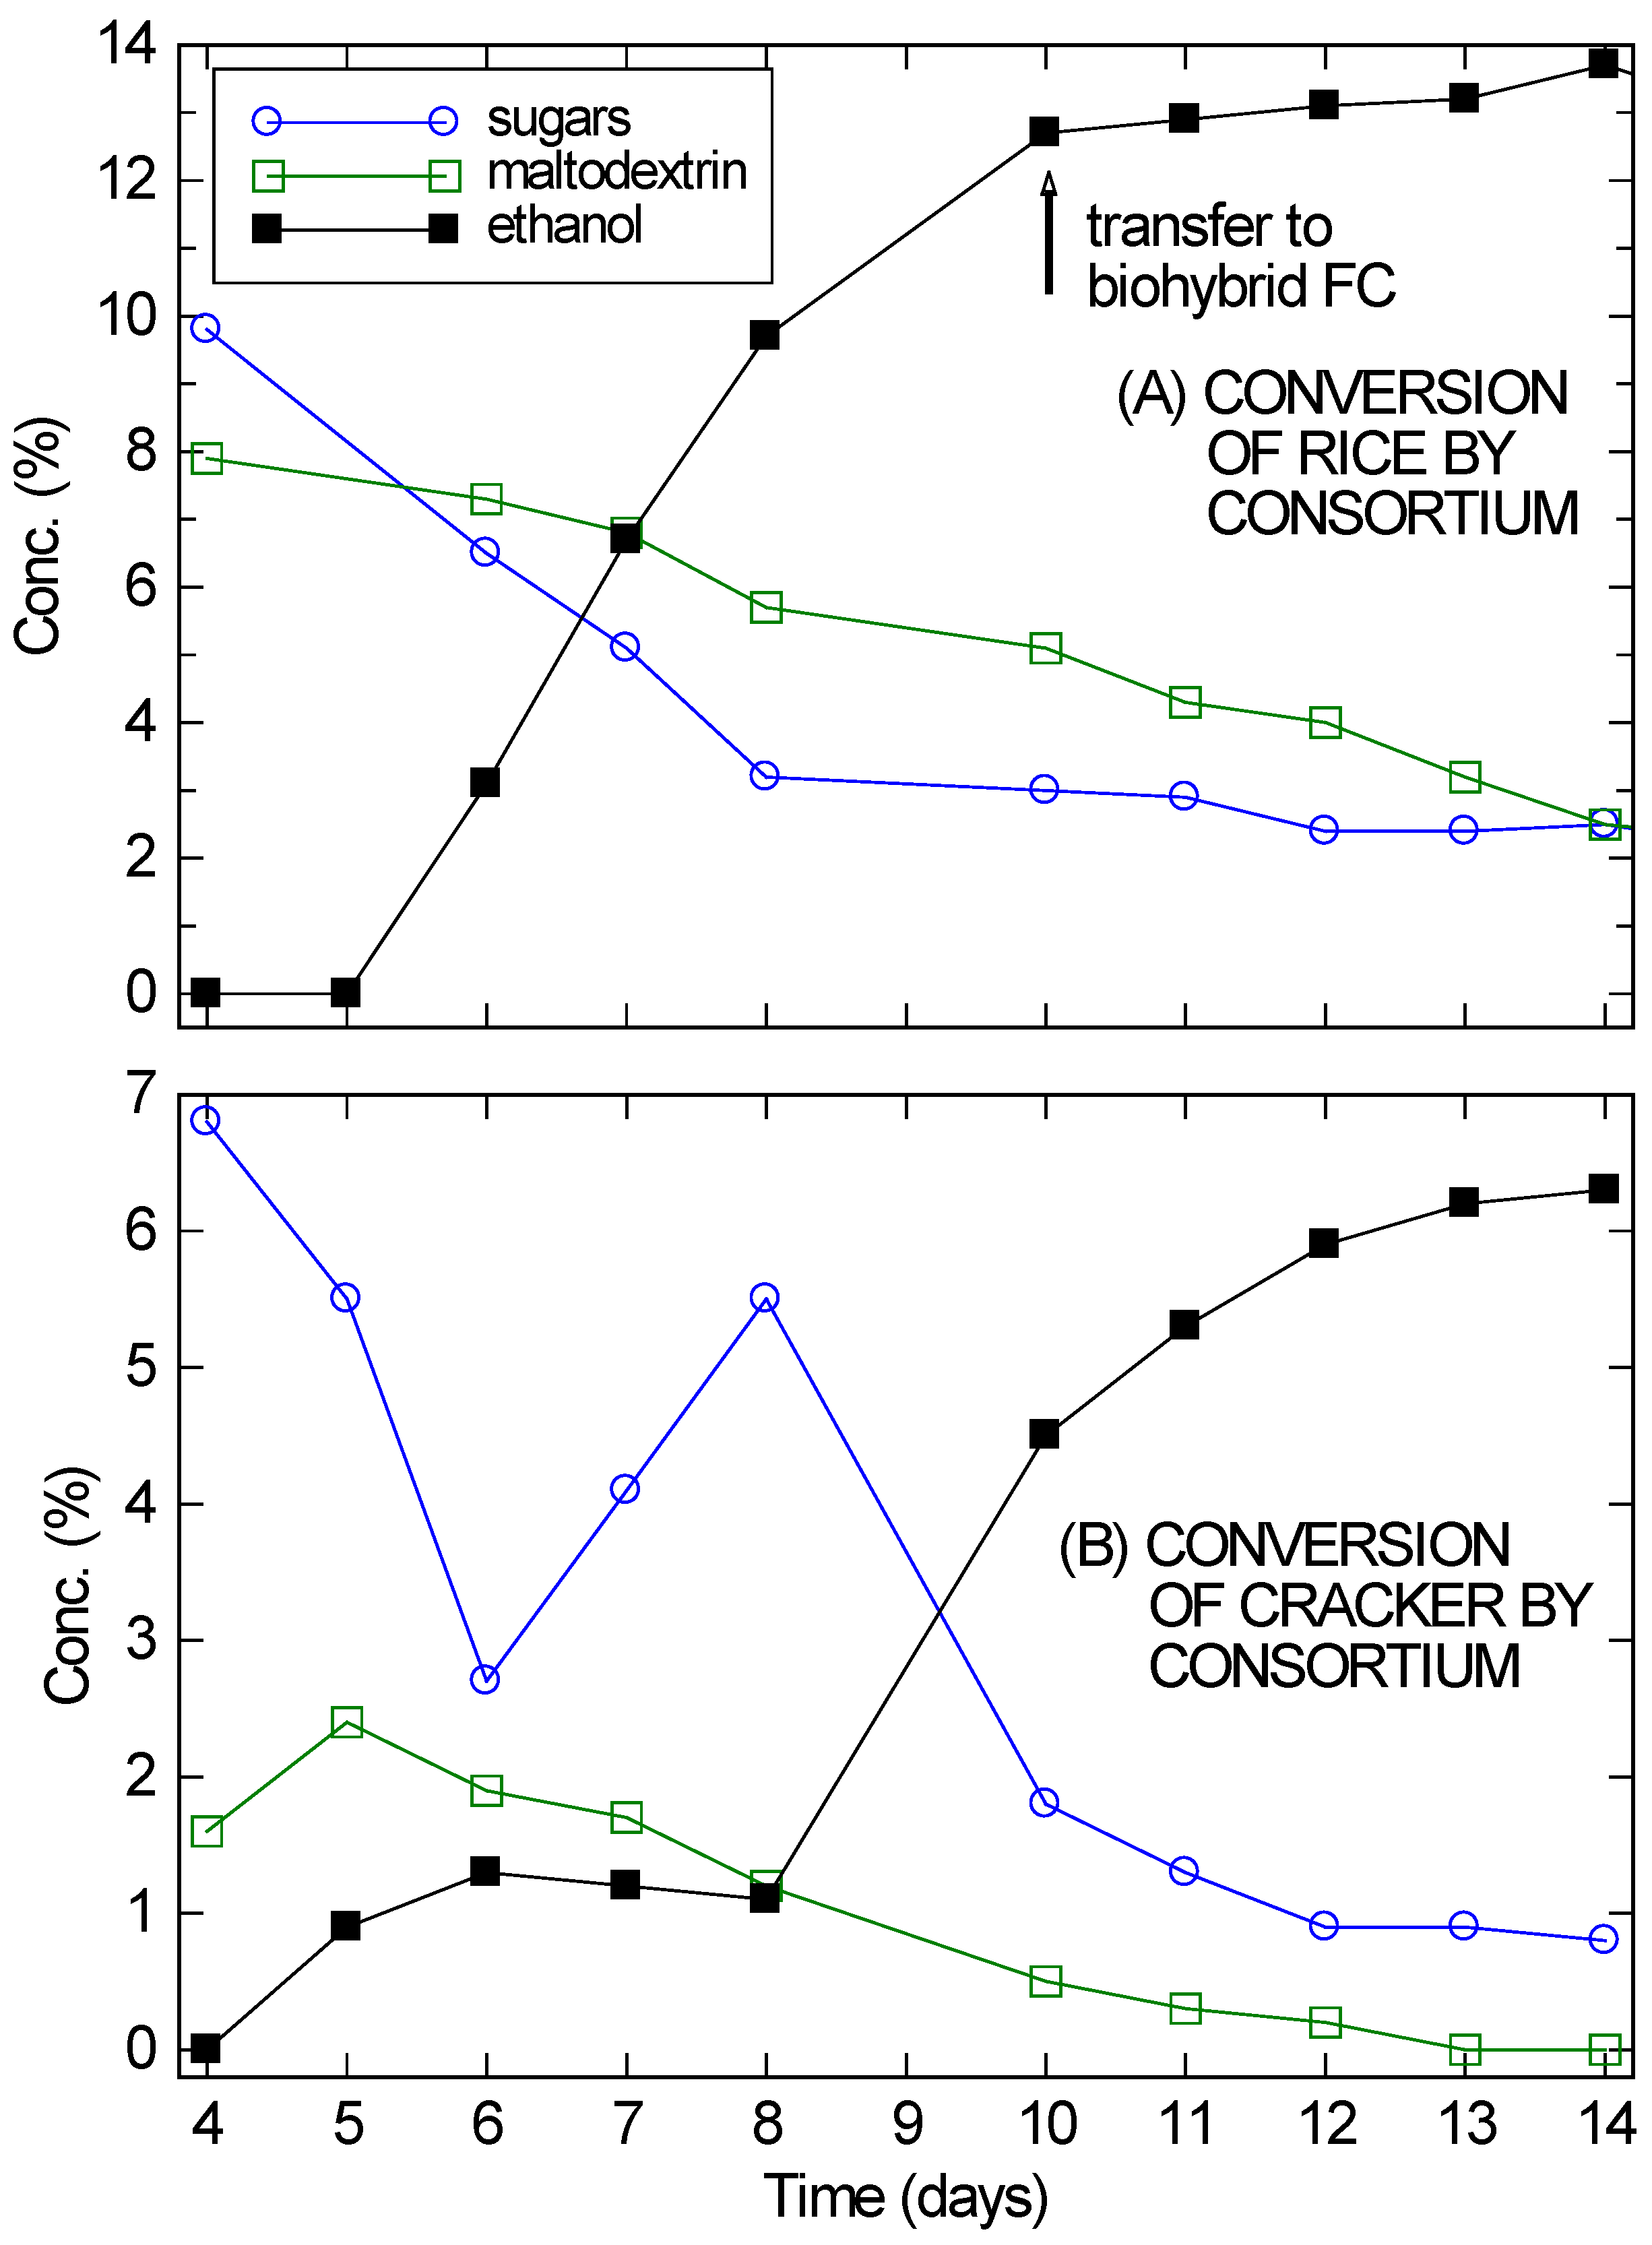
A. oryzae was added first, after four days significant amounts of simple sugars and soluble starches (fitted as maltodextrin) were observed in solution, as shown in
Figure 2. On Day 4,
S. cerevisiae was added to the culture. Four days of delay were allowed instead of the two days used with the maltodextrin to ensure that
A. oryzae was well-established in the partially submerged solids.
On Day 5 or 6 ethanol began to appear in significant quantities and the simple sugars and soluble starches began to drop. Over the next several days, the ethanol concentration continued to rise and the carbohydrate content in solution continued to drop. However, at the very least, enzymes from the
A. oryzae remained active in solution and continued to digest the substrates, since the amount of ethanol being produced was much larger than the drop in sugar concentration. By Day 14, the ethanol concentration in the cracker fermentation (
Figure 2B) was plateauing, even though 6.3% ethanol is not inhibitory for the VL3 strain of
S. cerevisiae and there was still 1% unfermented sugars present in solution. For the rice culture (
Figure 2A), ethanol had already reached inhibitory concentrations by Day 10.
Despite its problems, the cracker culture reached twice the ethanol concentrations needed for a direct ethanol FC. It was therefore incorporated with a modified bio-hybrid FC design [
16,
26] to establish that these consortium-based fermentations are compatible with use in a bio-hybrid FC. In bio-hybrid FCs, a reverse osmosis (RO) membrane allows ethanol to diffuse across, while preventing the passage of other components (e.g., peptones) that may poison the FC. For the cracker culture, the setup was allowed to fully equilibrate across the RO membrane over three days before the FC was run. Since the fermentation had mostly stopped, the ethanol concentration on the fermentation side of the RO membrane dropped from approximately 6% to 3.3%. Similarly, the ethanol concentration on the draw side rose from zero to 3.3%. The extra 0.6% ethanol was presumably from further fermentation.
Figure 2.
Conversion of rice (A) and cracker (B) by A. oryzae–S. saccharomyces consortium, showing the sugar, maltodextrin, and ethanol concentrations in solution, starting from Day 4 when the yeast was added. The absolute error in the concentration measurements was ±0.1%, roughly the size of the markers.
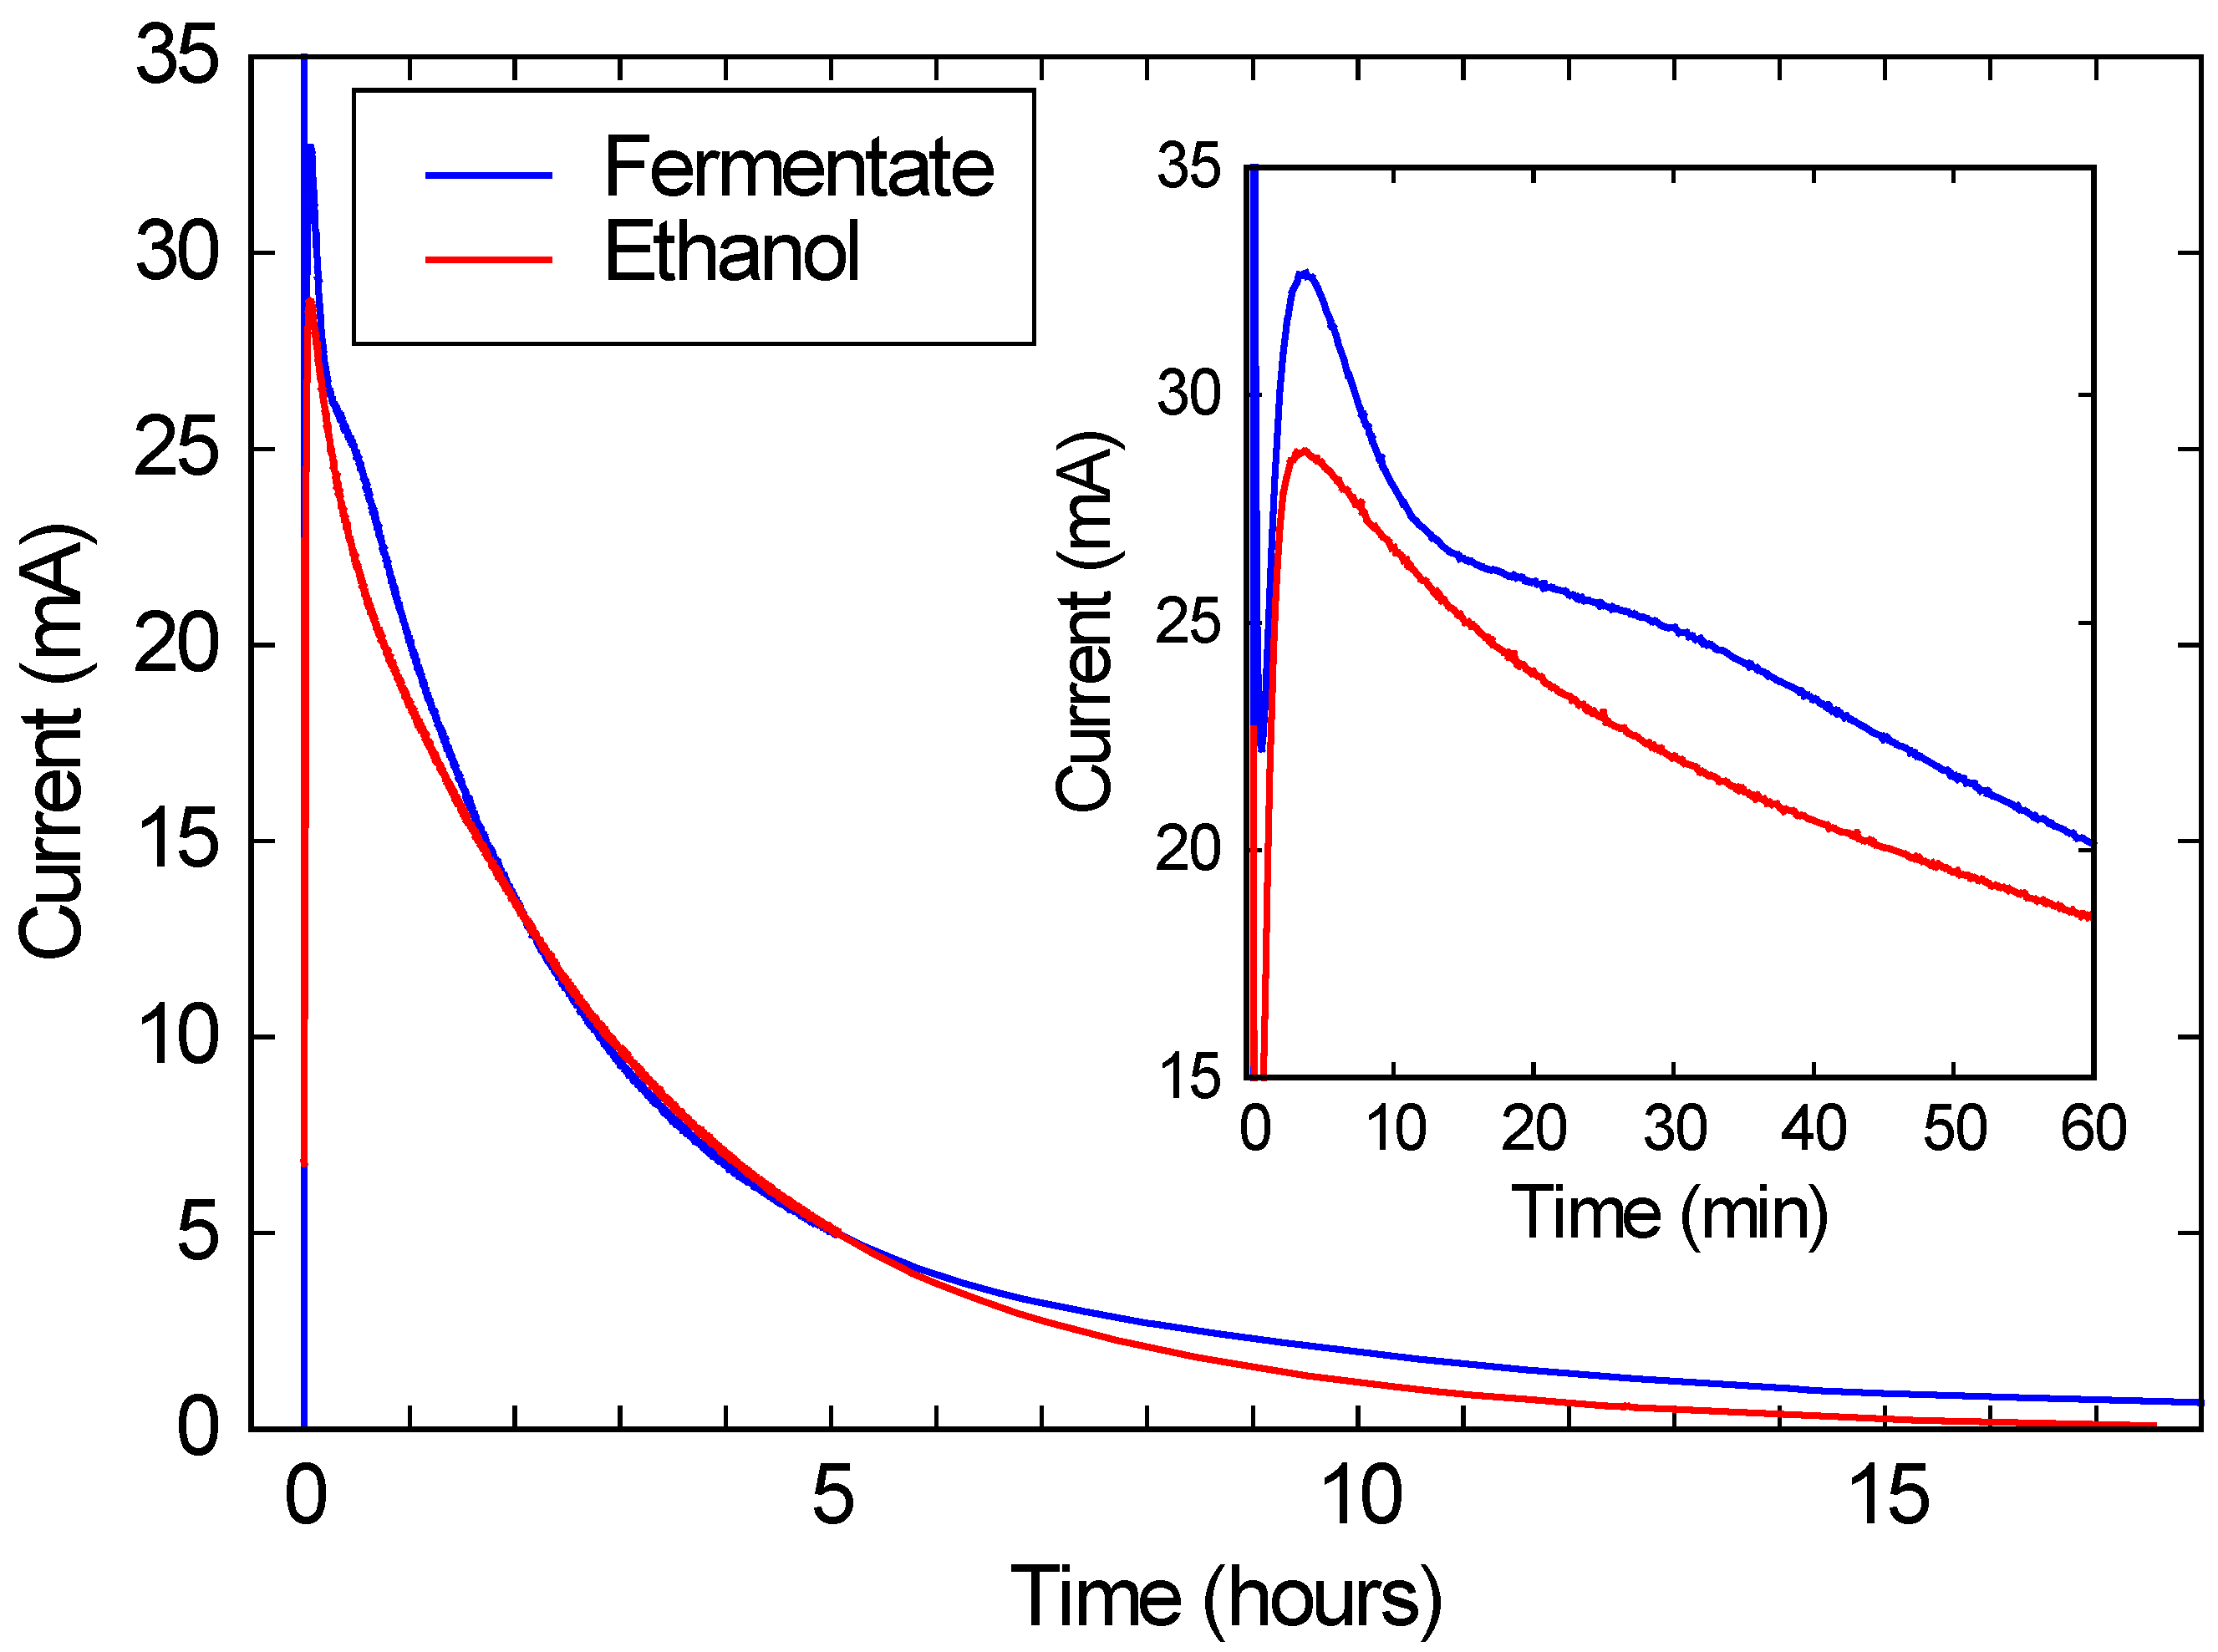
As shown in
Figure 3, when this solution was run in a commercial FC, a peak current of over 10 mA/cm
2 is observed, corresponding to over 2 mW/cm
2 of power generation. (Recall that the FC area was 2.68 cm
2, and the voltage was kept at 200 mV.) This current and power density is comparable to the typical performance for these FCs, and is roughly 3 orders of magnitude higher than power densities typically obtained with microbial fuel cells [
7,
15]. While the current drops substantially over a 24 h run, this drop is due only to the ethanol being consumed. As the red line in
Figure 3 shows, if the same FC is run with a similar concentration of ethanol in DI water, the performance is nearly identical. These results suggest that bio-hybrid FCs can be run on these consortium-based fermentations with current and power densities comparable to FCs running on ethanol water mixtures.
Figure 3.
The blue line shows the current produced by a bio-hybrid fuel cell (FC), comprising a direct alcohol FC running on the draw solution of a fermentate from a consortium of A. oryzae and S. cerevisiae. The red line shows the current from the same direct alcohol FC, running on a pure ethanol/water solution with the same initial ethanol concentration (3.3%) as the draw solution. The inset expands the first hour of the run.
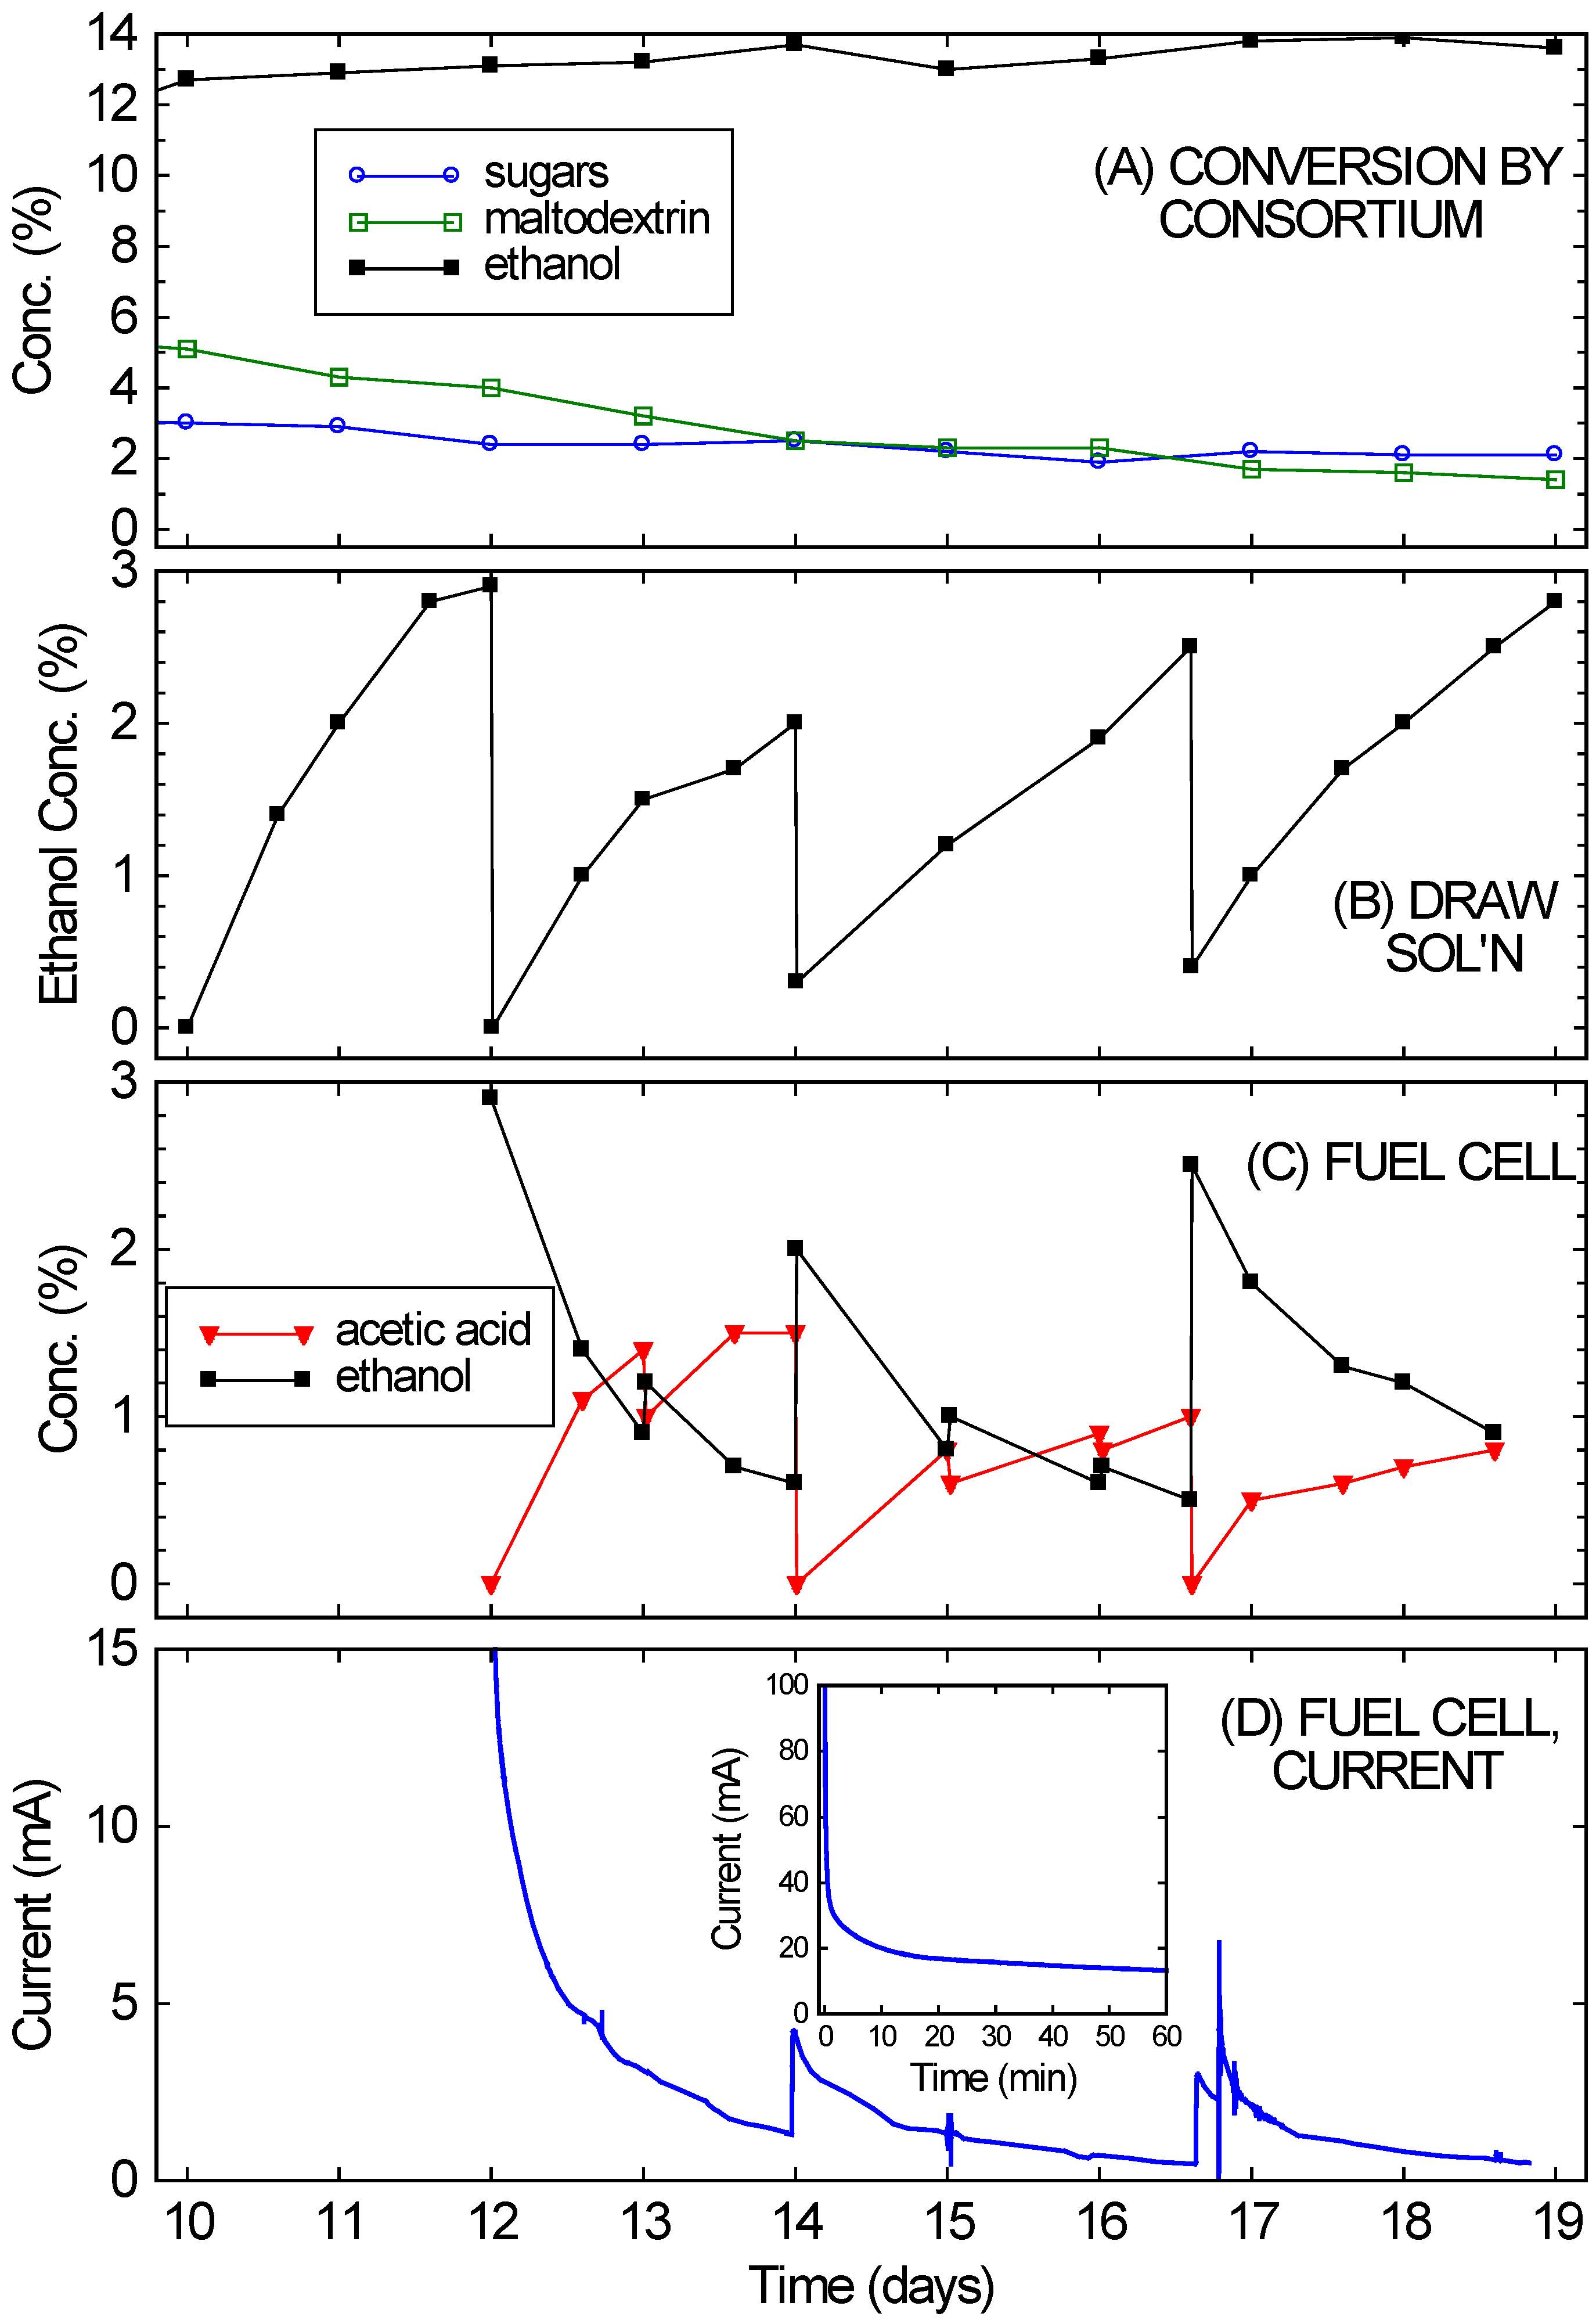
Figure 4 shows that the bio-hybrid FC runs even better with an ongoing consortium-based fermentation instead of one that is dying down (as happened with the crackers). The bio-hybrid FC provides a means to draw off and use the ethanol from the consortium so it doesn’t reach concentrations that stop the yeast from fermenting. The rice culture (refer back to
Figure 2A) was used for this, since it had reached a higher concentration of ethanol (13%), which was still increasing even at 10 days, but was approaching the VL3 strain’s limit of about 15%. Also, plenty of rice remained. Starting on Day 10, nearly all of the remaining liquid (10 ± 0.3 mL) and much of the remaining solids (10 ± 0.5 g) from the consortium-based fermentation of rice were transferred into the diffusion setup. This diffused across the RO membrane into a 5% glucose draw solution, while continuing to ferment. After 2 days (on Day 12), the ethanol in the draw solution had reached concentrations optimal for FC operation (2%–4%). (See
Figure 4B.) The ethanol-rich draw solution was transferred into the FC, and the draw chamber was refilled with fresh draw solution. This modification of the setup in [
16] prevented acetic acid produced by the FC from slowly diffusing back into the fermentation chamber and eventually killing the yeast.
The results of running the FC with the ongoing consortium-based fermentation are also shown in
Figure 4. In
Figure 4D, the FC currents observed over 1 week of operation (Days 12–19 of the culture) are shown (again, for voltage fixed at 200 mV).
Figure 4C shows the ethanol and acetic acid concentrations in the FC anode chamber, starting with the initial fill-up with draw solution on Day 12. Over the first few days the currents were in the range expected
15 for the ethanol concentrations. The current drop simply mirrored the ethanol drop (from consumption, evaporation, cross-over,
etc.). At a minimum, the FC chamber was topped off daily with liquid from the draw solution. These “topping-off” transfers occurred on Days 13, 15, and 16. Every few days (Days 14 and 16.6), the FC solution was completely replaced with draw solution. By then the draw solution (
Figure 4B) had reached 2%–4% ethanol, while the FC solution (
Figure 4C) had low ethanol concentrations.
Figure 4.
(A) Continued conversion of rice in the fermentation chamber of the bio-hybrid fuel cell (FC) by the A. oryzae–S. cerevisiae consortium, showing the concentrations of sugars, maltodextrin, and ethanol; (B) Ethanol levels in the draw solution of the bio-hybrid FC. Major transfers occurred on Days 12, 14, and 16.6; (C) Ethanol and acetic acid levels in the anode compartment of the FC. Minor transfers occurred on Days 13, 15, and 16; (D) Current generated in FC. The inset expands the first hour of the run.
Immediate current increases were observed when draw solution was added to the FC, but the currents obtained never fully returned to the initial currents. The currents observed on Day 16 were especially low compared to the expected current from the ethanol concentration. This drop in current likely arose from small amounts of sulfur-containing peptones slowly leaking across the RO membrane (from the fermentation side to the draw side) and poisoning the FC’s catalyst. Since this occurs gradually, it is feasible to alternate operation of the FC with cleaning. On Day 16.6, 5% sulfuric acid was first used to clean the FC, to try to restore its performance before refilling with draw solution. Note that this was a flush and rinse, not the standard overnight soak, so the break in current data is not noticeable on the time scale shown. After this quick cleaning, the currents returned to the values observed after the refilling with draw solution on Day 14. Alternating between two FCs, with one running and one being cleaned, would probably improve long-term performance substantially. Despite this drop in performance, the fuel cell still managed to achieve an average power density of 0.2 mW/cm2 over one week of operation, approximately 10% of the peak power density of these fuel cells. This power density also remains much higher than what could achieved than what could be achieved with a microbial fuel cell.
While the FC was running and ethanol diffusing across the RO membrane, the rice culture continued to produce ethanol, and in large amounts (equivalent to an additional 10% ethanol). As shown in
Figure 4A, the ethanol concentration in the culture actually rose slightly (gaining another 1%) over the week it was in contact with the draw solution. The draw volume was similar to the rice culture volume, and drew off 9% ethanol. Therefore, if no fresh ethanol were being fermented in the culture, the ethanol concentration would have necessarily dropped significantly (as was observed with the dying cracker culture). Further evidence for the continued activity of the
S. cerevisiae is the gradual drop in the sugar concentration over time. The viability of
A. oryzae is unknown from our data. The high ethanol concentrations could have been inhibiting its growth. It is clear, however, that at least the secreted
A. oryzae enzymes retained considerable activity. The maltodextrin-like component of the carbohydrate peaks decreased over time, which would not have occurred if only the yeast had been active. Also, the 4% combined drop in maltodextrin and sugar is not enough to explain the production of 10% ethanol. It would only account for 2% ethanol—unless it were being continually produced from the rice. The presence of these enzymes prolonged the lifetime of the fermentation, but for indefinite operation it would be desirable to maintain the viability of the
A. oryzae, either by running the fermentation at lower concentrations or by taking steps to reduce the exposure of
A. oryzae to the fermentation solution. Even without these precautions, the consortium-based rice fermentation can be operated for several weeks if coupled to a bio-hybrid FC to selectively remove ethanol. This allows more complete digestion of the substrate (rice in the case) and more ethanol production than would be possible in a simple batch configuration while simultaneously generating electricity at power densities approaching those obtained operating on pure ethanol water mixtures.

