Article

The Improved Remediation Effect of the Combined Use of Earthworms with Bacillus subtilis-Loaded Biochar in Ameliorating Soda Saline–Alkali Soil

1
College of Biological and Agricultural Engineering, Jilin University, Changchun 130022, China
2
Northeast Institute of Geography and Agroecology, Chinese Academy of Sciences, Changchun 130102, China
3
Zhanjiang Experiment Station, Chinese Academy of Tropical Agricultural Science, Zhanjiang 524000, China
4
The Electron Microscopy Center, Jilin University, Changchun 130012, China
*
Author to whom correspondence should be addressed.
Microorganisms 2025, 13(6), 1243; https://doi.org/10.3390/microorganisms13061243
Submission received: 25 March 2025 / Revised: 16 May 2025 / Accepted: 25 May 2025 / Published: 28 May 2025
(This article belongs to the Section Environmental Microbiology)

Abstract

:
High pH, Na + , and ( CO 3 2 + HCO 3 ) are the primary characteristics of soda saline–alkali soil. Current strategies for ameliorating soda saline–alkali soil often involve the combined use of cow manure and maize straw, the addition of biochar (BC), and the inoculation of Bacillus subtilis (BS). In this study, B. subtilis-loaded biochar (BSC) was prepared using an adsorption technique. An incubation experiment was conducted. The treatments were as follows: soda saline–alkali soil amended with maize straw and cow manure (T1), which was used as a control; T1 supplemented with earthworms (T2); and T2 supplemented with BS (T3), BC (T4), or BSC (T5). After a 60-day incubation, T5 showed the most significant reduction in pH, ESP, and ( H C O 3   +   C O 3 2 ) concentrations, with reductions of 0.24 units, 3.26%, and 120 mg kg−1, respectively, compared to the T1 treatment. The content of soil humic acid, available potassium, and available nitrogen and the activities of β-glucosidase and urease were highest in T5, increasing by 33.5%, 70.1%, 26.1%, 19.0%, and 17.9%, respectively. Microbial sequencing analysis revealed that the Bacillus abundance in T3 was highest during the first 45 days (2.51–3.65%), while the Bacillus abundance in T5 peaked at 3.22% after the 60-day incubation. The soil that was cultivated for 60 days in the experiments was then used for planting alfalfa. T5 showed the highest alfalfa aboveground biomass and peroxidase, increasing by 30.1% and 73.1%, respectively, compared with T1. This study demonstrated that loading onto biochar is beneficial for the survival of B. subtilis in soda saline–alkali soil. When traditional organic materials are used, the combination of earthworms and B. subtilis-loaded biochar significantly alleviates the constraints of soda saline–alkali soil.

1. Introduction

Soil salinization results from both natural and anthropogenic factors and poses a significant threat to global food security and ecosystem stability [1]. Soda saline–alkali soil represents a predominant category of saline–alkaline soils, with the Songnen Plain in northeastern China constituting one of the three major global distribution areas for this specific soil type [2]. This type of soil is characterized by an elevated pH, exchangeable sodium percentage (ESP), and ( CO 3 2 + HCO 3 ) concentration, which exacerbates its adverse impacts on agricultural productivity and environmental health. The excessive uptake of Na+ by crops disrupts metabolic processes and reduces photosynthetic efficiency [3]. High salinity and alkalinity restrict nutrient use efficiency, which limits crop growth and reduces grain yield [4]. Given the vast areas of soda saline–alkali soil, the effective management and amelioration of these soils are crucial for food security.
The application of maize straw and cow manure as organic amendments is a common method for ameliorating saline–alkali soils [5]. However, the Songnen Plain is characterized by low temperatures, soil moisture, high salinity, and limited microbial activity [6], which hinder the decomposition and mineralization of maize straw and manure, restricting the formation of bioavailable carbon and nutrients [7,8]. The introduction of earthworms to low-salinity soils can accelerate organic matter decomposition [9]. For example, Wu et al. [10] conducted a field experiment and found that adding earthworms to saline–alkali soil with a pH of 7.39 and an EC of 744 μm cm−1 improved the soil’s physical and chemical properties and significantly increased the crop yield. Similarly, Zhang et al. [11] reported that earthworms reduced the pH and EC in soil with initial values of 8.33 and 645 μm cm−1, respectively, while increasing the available phosphorus (AP), soil organic carbon (SOC), and catalase (CAT) activity. Earthworm activity not only decreases soil salinity but also enhances the organic matter content, improving both the physical–chemical and biological properties of the soil. However, information is limited about the combined effects of earthworms, maize straw, and cow manure on soil carbon fractions and on the mitigation of salinity–alkalinity [12,13].
B. subtilis belongs to the plant growth-promoting rhizobacteria (PGPR), a group of beneficial bacteria known for their multifunctional roles, including nitrogen fixation, phosphate solubilization, the secretion of indoleacetic acid (IAA), the production of siderophores, and cytokinin synthesis. PGPR enhances agricultural productivity by improving the bioavailability of soil mineral nutrients and the secretion of plant growth hormones, such as IAA and cytokinin, which directly stimulate plant growth [14,15,16]. Bacillus spp. are the most widely applied growth-promoting bacteria in agriculture [17]. Studies indicate that B. subtilis is highly effective in remediating saline–alkali soil. Fermentation products, including ionized glutamic acid, significantly lower the soil pH, reduce salt crystallization, activate phosphorus, and increase the abundance of beneficial microorganisms [13,18,19]. Additionally, Bacillus reduces salt–alkali stress, enhances stress tolerance, increases the photosynthetic capacity, regulates metabolic pathways, and promotes plant growth [19,20]. However, exogenous growth-promoting bacteria often face environmental stress and intense competition with native microbes, leading to low survival rates and limited longevity [21,22]. Therefore, selecting a biologically friendly and sustainable carrier to enhance and prolong bacterial activity is crucial.
The investigation of environmentally friendly methods and materials for soil remediation has become a popular research topic. For example, Bi et al. [23] used Bacillus halophilus BH-8 combined with coal gangue to improve saline–alkali land, and Yu et al. [24] used biochar loaded with Acinetobacter to remediate petroleum-contaminated soil. Biochar, a porous, carbonaceous material, possesses a strong adsorption capacity and chemical stability, providing a good habitat for microorganisms. Additionally, it can be efficiently loaded with microorganisms and serve as an effective amendment for degraded and polluted soils [25,26]. Biochar reduces the pH, salinity, and Na+ content while increasing the cation exchange capacity (CEC), enzyme activity, nutrient availability, and microbial diversity [12,27,28]. Under saline–alkali stress, the application of biochar has been demonstrated to significantly improve crop growth (e.g., in tomatoes, eggplants, and corn) and enhance the yield and product quality [29,30]. Emerging evidence indicates that microbial communities immobilized on biochar present an increased soil colonization capacity, prolonged viability, and improved metabolic activity, thereby significantly contributing to soil remediation processes [31,32]. However, a comprehensive understanding of the synergistic effects of biochar-mediated microbial inoculation and its impacts on both saline–alkali soil amelioration and plant productivity is lacking in the scientific literature. This knowledge gap represents a crucial research frontier in the fields of soil bioremediation and sustainable agriculture.
In this study, B. subtilis-loaded biochar (BSC) was prepared and combined with earthworms, maize straw, and cow manure to remediate soda saline–alkali soil. An incubation experiment was carried out, and the incubated soil was used to grow yellow-flowered alfalfa (Medicago falcata L.). The aims of this study were to (1) investigate whether loading onto biochar is beneficial for the survival of B. subtilis in soda saline–alkali soil amended with traditional organic materials; (2) evaluate the improved remediation effects of the combination of earthworms and B. subtilis-loaded biochar on soil fertility enhancement, carbon pool regulation, saline–alkali stress mitigation, and microbial community reshaping; and (3) assess improvements in the biomass and key antioxidant enzyme activities of alfalfa. This study proposes a novel approach for ameliorating soda saline–alkali soil and provides valuable insights into the remediation mechanisms of the combined use of earthworms and BSC.

2. Materials and Methods

2.1. Materials

This experiment utilized B. subtilis, earthworms (Eisenia fetida), biochar prepared from maize straw (BC), air-dried maize straw, and cow manure to ameliorate soda saline–alkali soil. The B. subtilis strain used in this study was separated from the rhizosphere soil of silver-haired tree roots on Yongxing Island in the South China Sea. The soda saline–alkali soil used in this study was collected from Changling County, Jilin Province, China (44°45′ N, 123°45′ E), and has the following basic physicochemical properties: pH 9.68, organic matter 9.23 g kg−1, total nitrogen 0.87 g kg−1, available phosphorus 18.2 mg kg−1, and available potassium 166 mg kg−1. The combined soil samples were collected via a standard gouge auger, which zigzagged around the experimental area. This soil is considered a typical example of soda saline–alkali soil due to natural conditions and excessive human exploitation. The soil type is classified as solonetz based on the World Reference for Soil Resources. Air-dried cow manure and maize straw were collected from local farms; their physicochemical properties are described by Chen et al. [33]. The chemical characteristics of the maize straw and cow manure mixed substrate are as follows: pH 7.00; total organic carbon (TOC) 401 g kg−1 dry matter; total nitrogen (TN) 11.2 g kg−1 dry matter. Yellow-flowered alfalfa seeds were provided by the Northeast Institute of Geography and Agroecology, the Chinese Academy of Sciences. The biochar used in this study was purchased from Liyuan Environmental Protection (Beijing) Co., Ltd., Beijing, China. The experimental flowchart is shown in Figure 1.

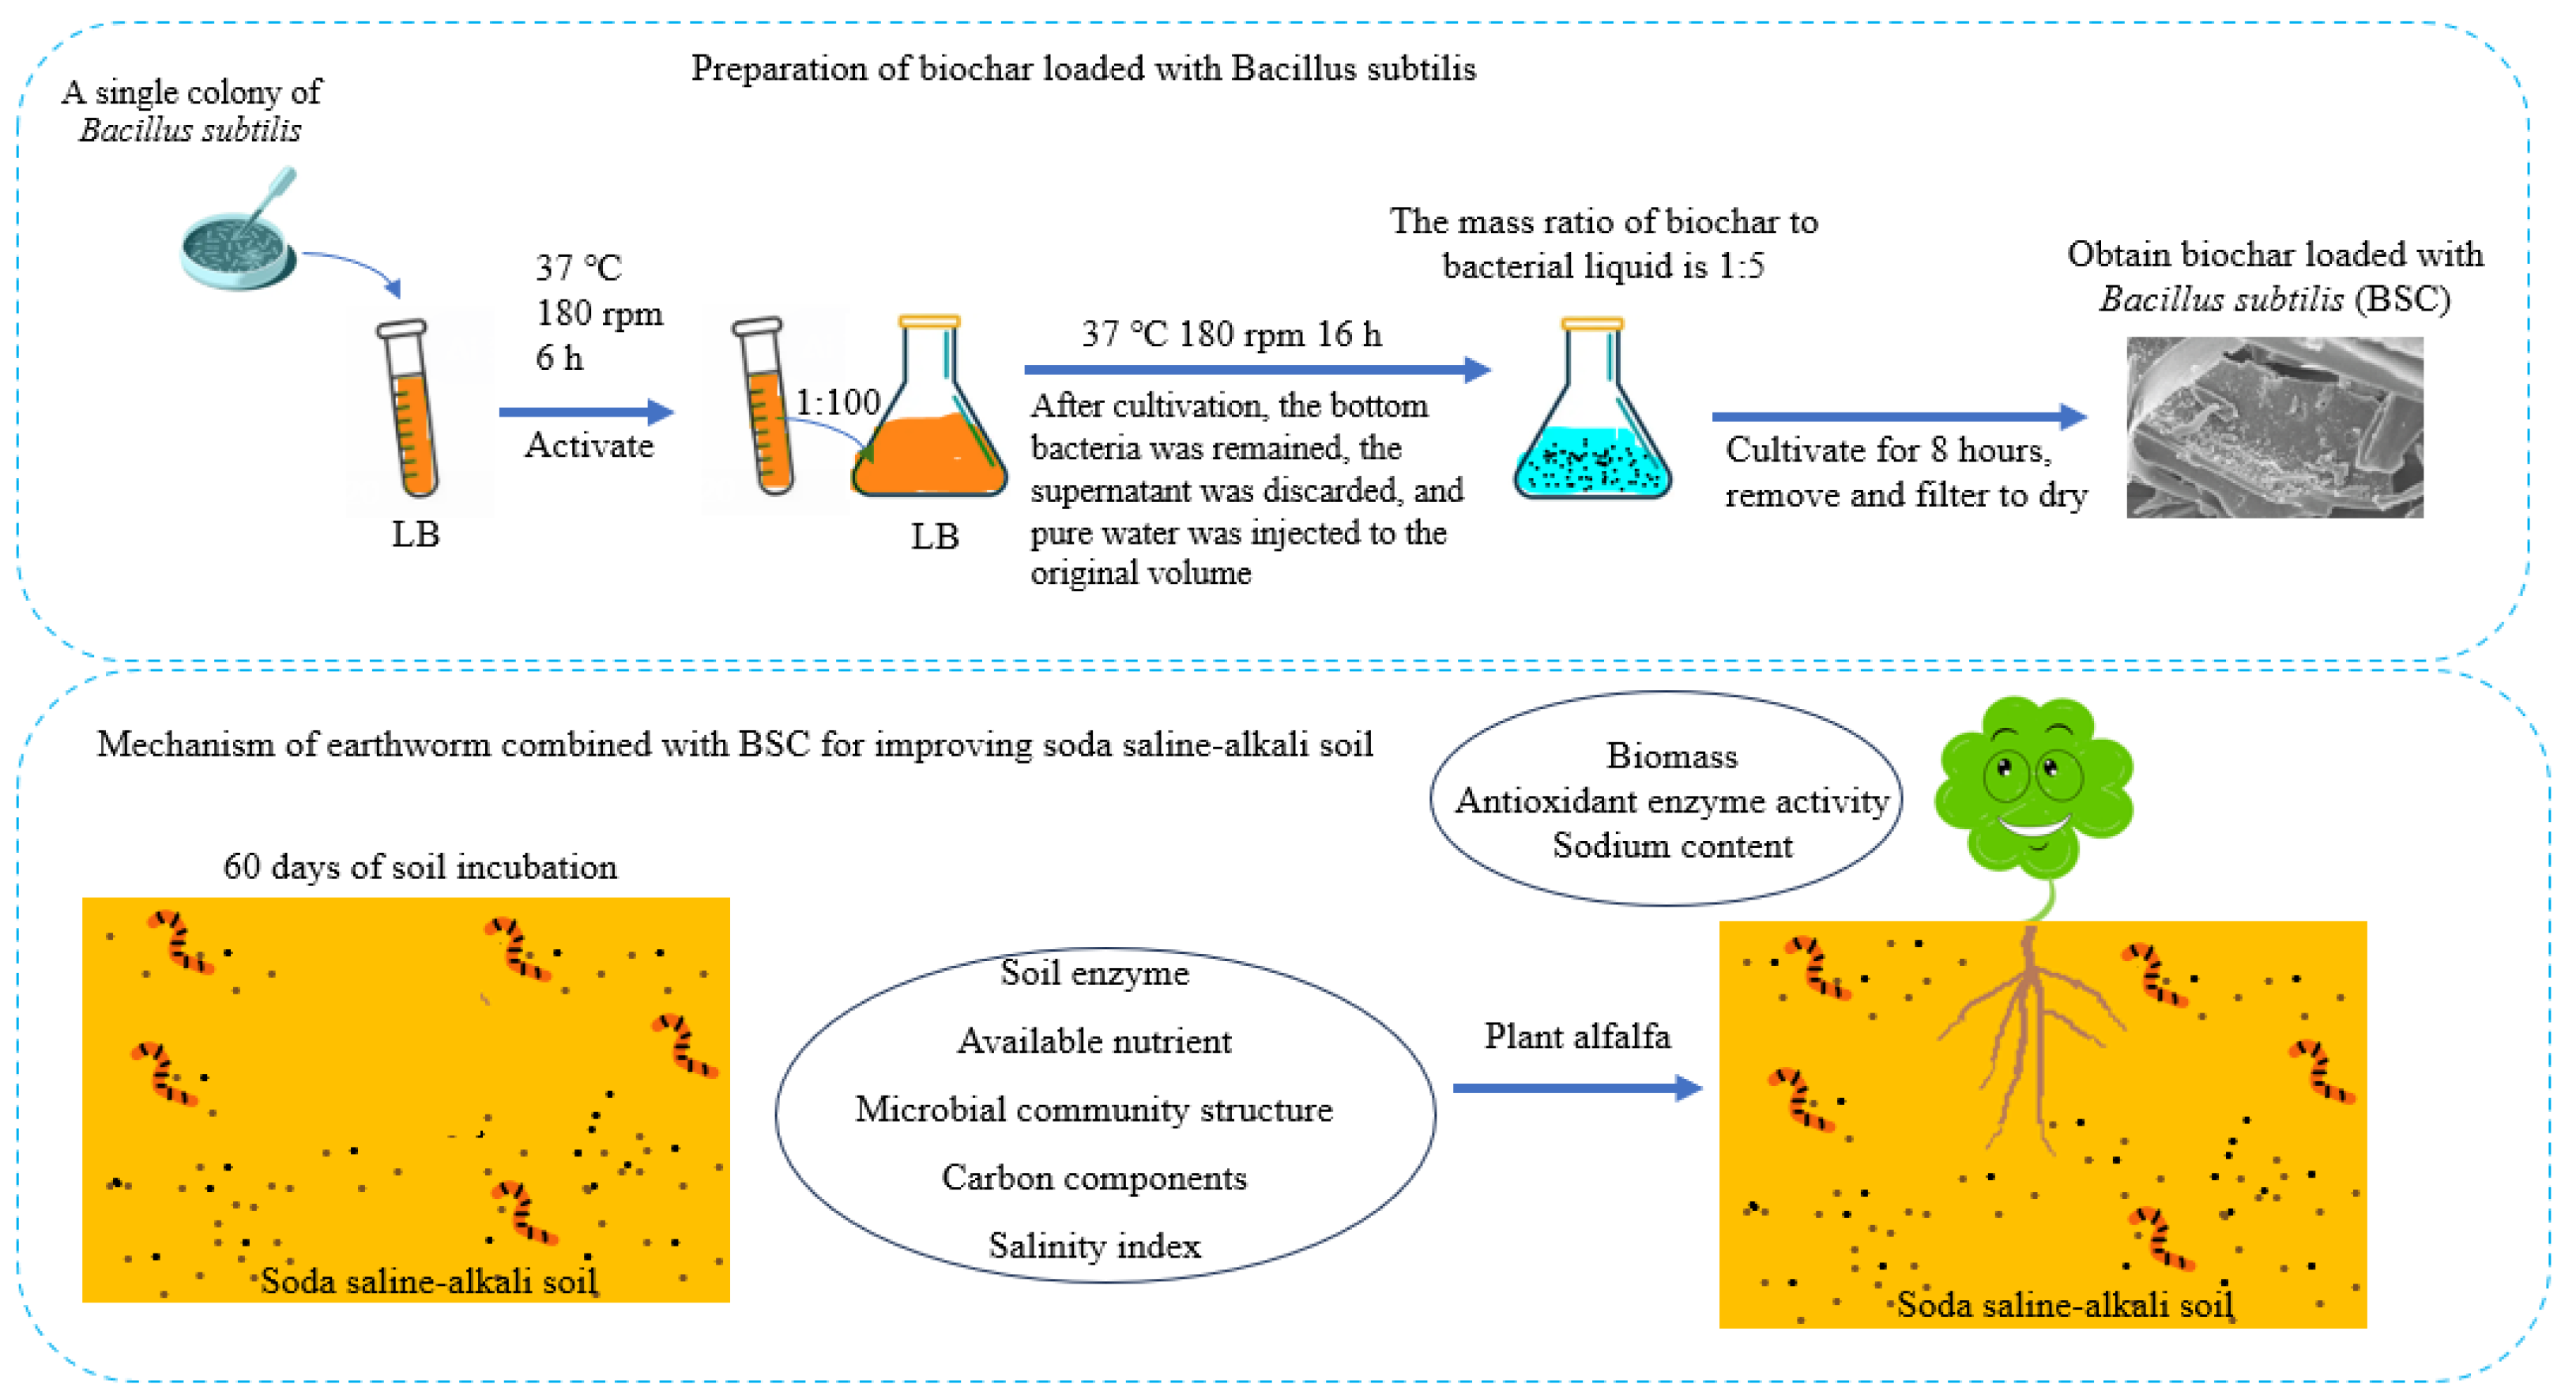
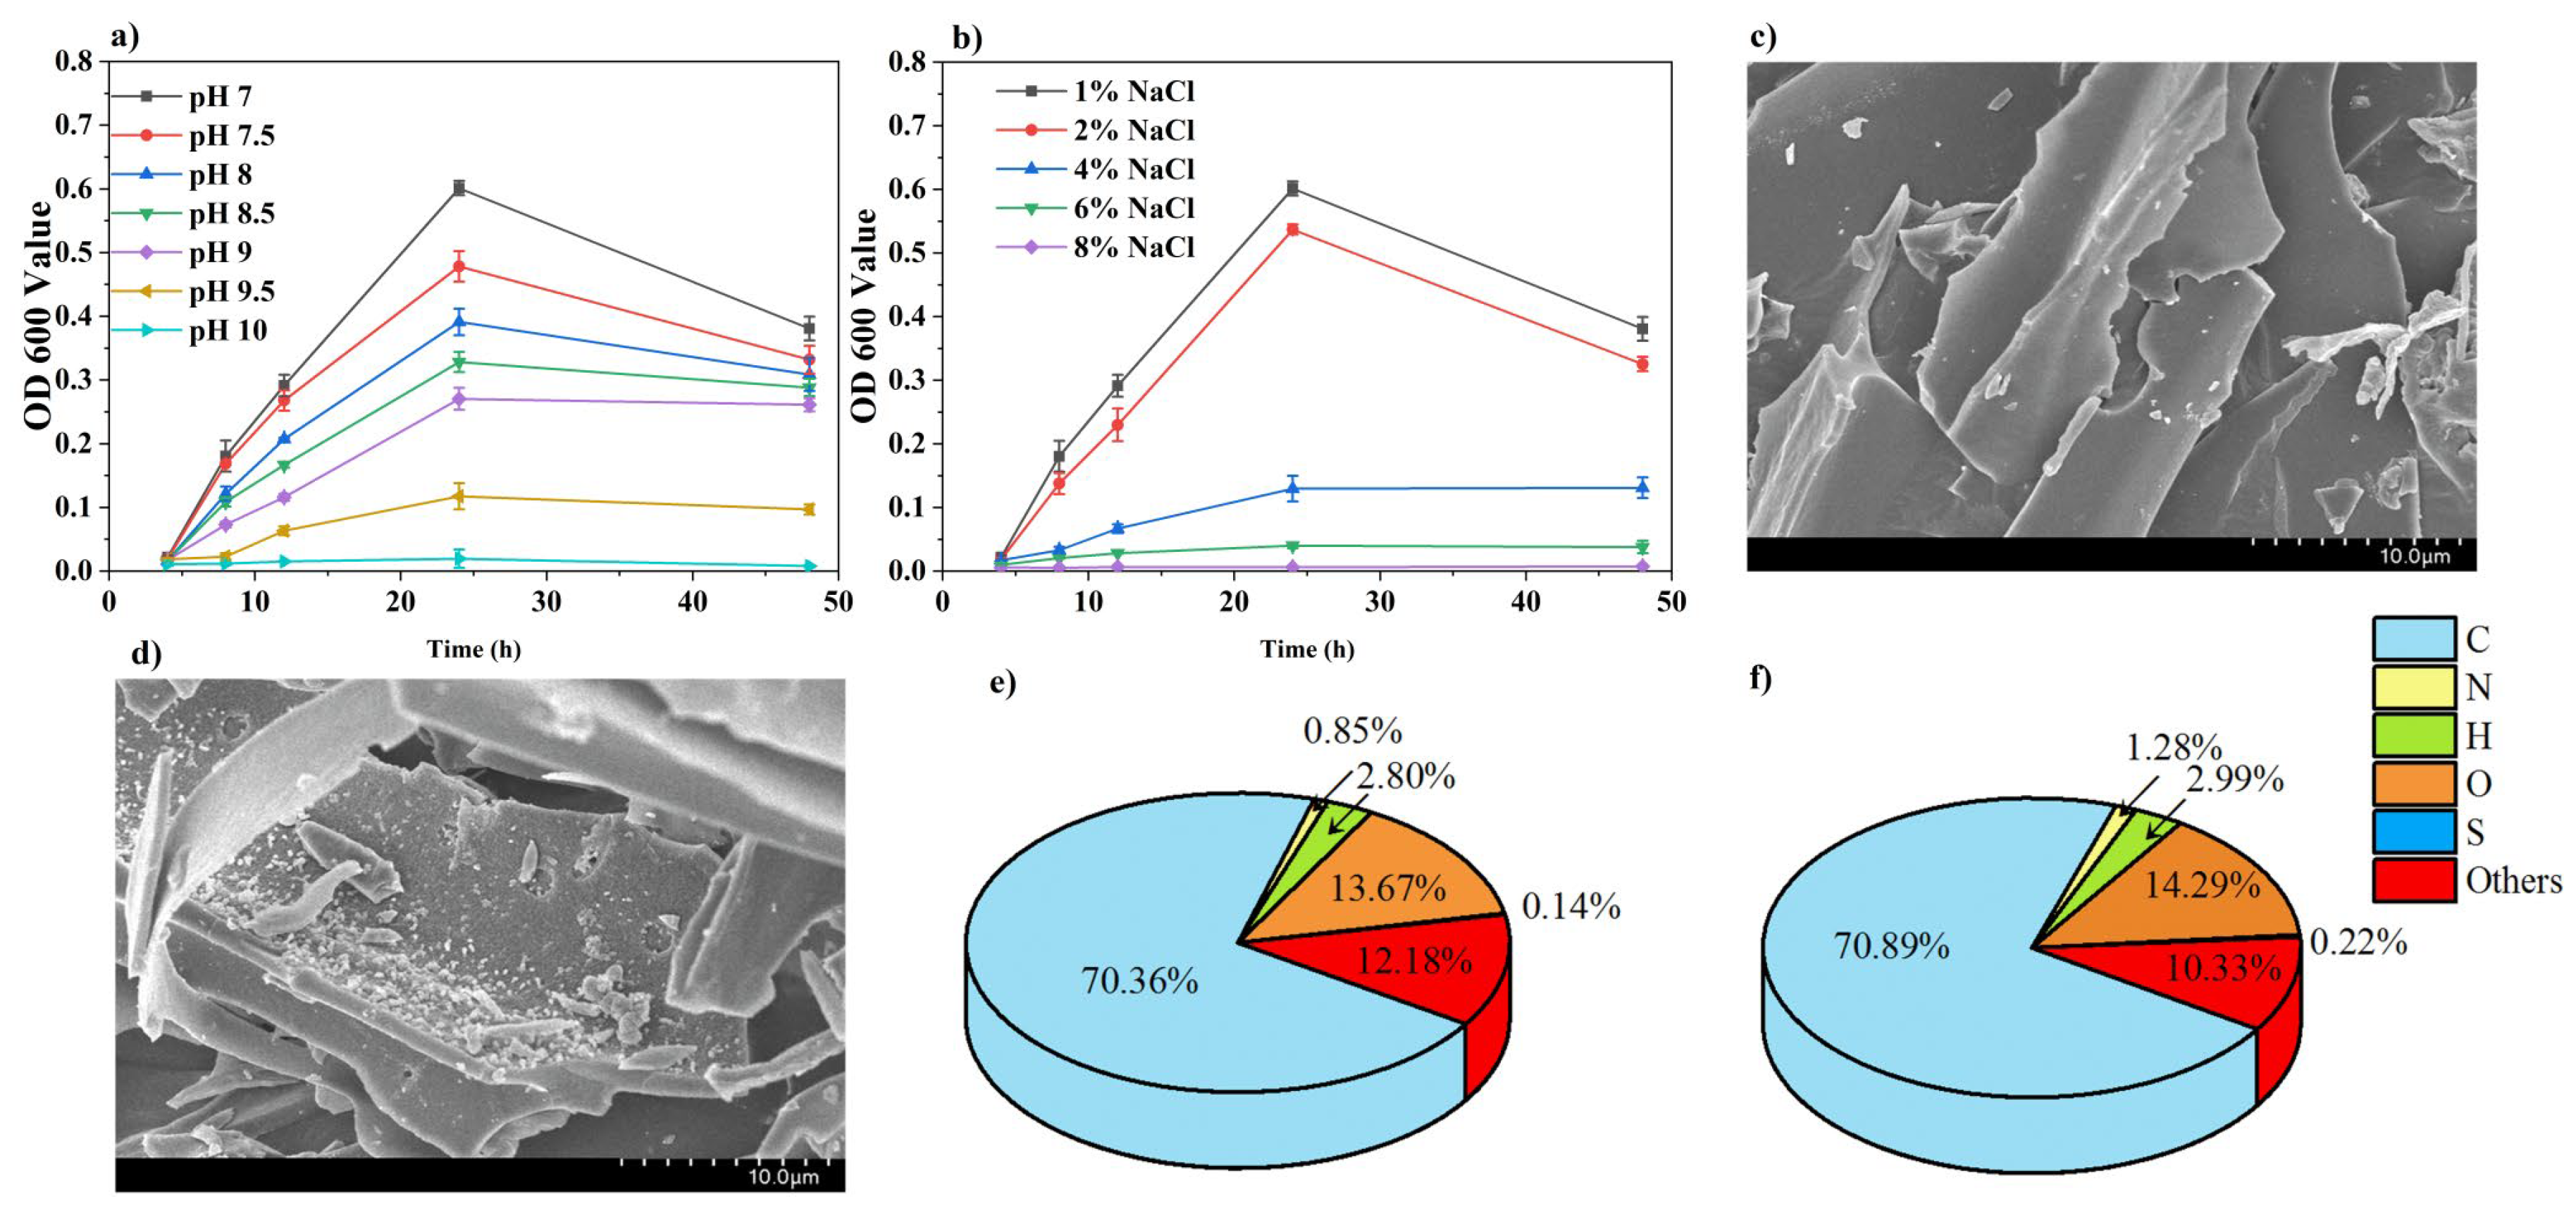
2.2. Preparation of B. subtilis-Loaded Biochar, and Salt–Alkali Tolerance of B. subtilis

A phylogenetic tree of B. subtilis based on the 16S rDNA analysis system is shown in Figure S1. A single colony of B. subtilis was selected from the LB agar medium (The reagents used in this experiment are all conventional laboratory reagents, with analytical purity) and activated by incubation at 37 °C and 180 rpm for 6 h. The culture was then transferred at a 1:100 ratio into a fresh LB medium and incubated under the same conditions for 16 h. After centrifugation at 4000 rpm for 5 min, the supernatant was discarded, and the B. subtilis pellet was resuspended in distilled water to its original volume for further use (B. subtilis suspension, BS). The suspension was diluted in a series from 10–107 using the spread plate method, yielding a final concentration of 2.7 × 10⁹ CFU mL−1. Salt and alkali tolerance tests for the strain were subsequently conducted. For the alkali tolerance test, 1% (v/v) of the activated bacterial culture were inoculated into LB media with pH values of 7.0, 7.5, 8.0, 8.5, 9.0, 9.5, and 10.0 and incubated at 37 °C for 48 h. Samples were collected at 4, 8, 12, 24, and 48 h, and their optical density (OD) at 600 nm was measured to assess bacterial growth under different pH conditions. For the salt tolerance test, the same inoculation procedure was followed using LB media containing NaCl at concentrations of 1%, 2%, 4%, 6%, and 8%, with samples collected and measured similarly. The biochar was mixed with the bacterial suspension at a mass-to-volume ratio of 1:5 and incubated for 8 h. The mixture was then filtered and dried to obtain BSC. Triplicates of 0.10 g of dried biochar were mixed with 5 mL of LB medium, followed by 10 min of ultrasonic treatment and 6 min of vortexing. The mixture was then spread on LB agar plates, and the colony-forming units were counted. The results indicated that the BSC concentration was 3.4 × 10⁹ CFU g−1, indicating high and uniform loading. Scanning electron microscopy with energy-dispersive spectroscopy (SEM-EDS) (Hitachi Regulus 8100, Hitachi, Tokyo, Janpan) was used to observe the surface morphology of the biochar. An elemental analysis was conducted using an elemental analyzer (Vario EL cube, Elementar, Hanover, Germany) to determine the contents of C, H, N, O, and S in the samples.

2.3. Experimental Design, Materials, and Sample Collection

The collected soil samples were air-dried, ground, and passed through a 2 mm sieve for further use. Earthworms were purchased from a local market, and mature earthworms weighing 0.3 to 0.5 g were selected for the experiment. The soil incubation experiment lasted 60 days, with samples taken every 15 days. After 60 days of soil incubation, the soil was used to grow alfalfa, with a growth period of 30 days. Each treatment was performed in triplicate. The samples were stored at −80 °C prior to laboratory testing. The treatments were as follows: T1, 30 g straw and 20 g manure per kilogram of soil, used as a control; T2, 6 earthworms per kilogram of soil based on T1; T3, 25 mL of BS suspension per kilogram of soil based on T2; T4, 10 g BC per kilogram of soil based on T2; and T5, 10 g BSC per kilogram of soil based on T2. After 60 days of incubation, the amended soil was transferred to polyethylene pots, each containing 2500 g of soil. Alfalfa seeds were selected and sun-dried for 1 h, followed by soaking in 10% NaClO solution for 30 min. The seeds were rinsed three times with tap water and distilled water and then soaked in distilled water overnight. Twenty seeds were sown in each pot and covered with a thin layer of soil. Seven days after germination, thinning was performed to ensure ten uniform seedlings per pot. Samples were taken for testing after 30 days of alfalfa growth. The samples were stored at −80 °C prior to laboratory testing. The plants were grown in a greenhouse with temperatures maintained at 18–25 °C, an average daily light duration of approximately 6.5 h, a relative air humidity of approximately 35%, and a soil moisture of approximately 10%.

2.4. Physical and Chemical Analyses

The incubated soil samples were suspended in pure water at ratios of 1:5 and 1:2.5 for the determination of electrical conductivity (EC) and pH, respectively. The suspensions were shaken for 10 min, and the EC and pH values were measured using conductivity and potentiometric methods, respectively. The cation exchange capacity (CEC) and exchangeable sodium (ENa) were determined using sodium acetate flame photometry [34]. The concentration of ( CO 3 2 + HCO 3 ) was measured following the method described by Wang et al. [35]. The exchangeable sodium percentage (ESP) refers to the percentage of exchangeable sodium ions in the total exchangeable cations and is calculated as
ESP = 100 %   ×   ENa / CEC
The activities of β-glucosidase, sucrase, and urease were measured using 4-nitrophenyl-β-d-glucopyranoside, sucrose, and urea as substrates, following the methods of Cai et al. [36] and Kaur et al. [37]. Under measurement conditions, sucrase activity is expressed as mg glucose g−1 (24 h)−1, β-glucosidase activity as μg p-nitrophenol g−1 h−1, and urease activity as mg N H 4 + -N g−1 (24 h)−1. The available nitrogen (AN), available phosphorus (AP), and available potassium (AK) in the soil were measured following the method described by Wan et al. [38]. The sodium content in the plant tissues was determined according to Ramandi et al. [39]. The activities of catalase (CAT), superoxide dismutase (SOD), and peroxidase (POD) were measured based on the method of Liu et al. [40], with enzyme activity defined as a change in absorbance of 0.01 per gram of sample per milliliter of the reaction system. Soil carbon fractions were determined following the method described by Ai et al. [41].

2.5. Microbial Community Structure Analysis

DNA extraction and purification were performed following the method described by Chen et al. [33]. Specific primers with barcodes were used for PCR amplification. The primers 338F (5′-ACTCCTACGGGAGGCAGCAG-3′) and 806R (5′-GGACTACHVGGGTWTCTAAT-3′) were used to amplify the V3–V4 region of the bacterial 16S rRNA gene, while ITS1F (5′-CTTGTCATTTAGAGAAGTAA-3′) and ITS2R (5′-GTGCGTTCTTCATCGATGC-3′) were used to amplify the ITS1 region of the fungal gene. The PCR products were recovered using a 2% agarose gel and purified with the AxyPrep DNA Gel Extraction Kit (Axygen Biosciences, Union City, CA, USA). The purified products were quantified using the Quantus™ Fluorometer (Promega, Madison, WI, USA). Sequencing was performed using the Sequencing equipment (Illumina MiSeq PE300, Illumina, San Diego, CA, USA). The FUNGuild (Version 1.0) tool was used to classify fungal trophic modes and functional groups [42]. The FAPROTAX database was used to predict the ecological functions of soil bacteria [43].

2.6. Statistical Analysis

The results for the soil carbon fractions, enzyme activities, available nutrients, salinity–alkalinity indices, microbial alpha diversity indices, and alfalfa-related indicators are expressed as the mean ± standard deviation (n = 3). Multiple comparisons were performed using Tukey’s HSD test to determine significant differences among groups. Different lowercase letters (e.g., a, b, c, d) indicate statistically significant differences (p < 0.05). The data on soil bacteria and fungi were processed using the Majorbio Cloud Platform (https://cloud.majorbio.com). The alpha diversity indices (Chao 1, Shannon, and Ace) were calculated using the mothur software (https://www.mothur.org/wiki/Calculators) accessed on 4 March 2025, following the method of Partrick et al. [44]. The LEfSe (Linear discriminant analysis Effect Size) (http://huttenhower.sph.harvard.edu/LEfSe) accessed on 15 March 2025, was used to identify microbial taxa with significant differences in abundance between groups, from phylum to genus levels, with LDA > 3.5 and p < 0.05. The correlation analysis picture was created through https://www.chiplot.online/, accessed on 26 March 2025.

3. Results

3.1. Growth Status of Free B. subtilis and Characterization of BSC

B. subtilis exhibited varying activity levels in LB media across pH values ranging from 7 to 9.5 (Figure 2a). During the 0–48 h period, its activity initially increased, followed by a decrease, with higher pH levels resulting in reduced activity. Optimal activity was observed at pH 7, whereas at pH 10, activity was nearly undetectable. Activity decreased as the NaCl concentration increased (Figure 2b). At 8% NaCl, the activity was minimal and nearly undetectable. At NaCl concentrations of 1–2%, the activity initially increased but later decreased, whereas at 4–6%, the activity consistently increased over time. The surface morphologies of BC and BSC were analyzed using SEM-EDS (Figure 2c,d). Uniform B. subtilis cells adhered to the rod walls of BSC. An elemental analysis revealed that, compared to BC, BSC had higher sulfur (0.14% to 0.22%), carbon (70.4% to 70.9%), and nitrogen (0.85% to 1.28%) contents (Figure 2e,f).

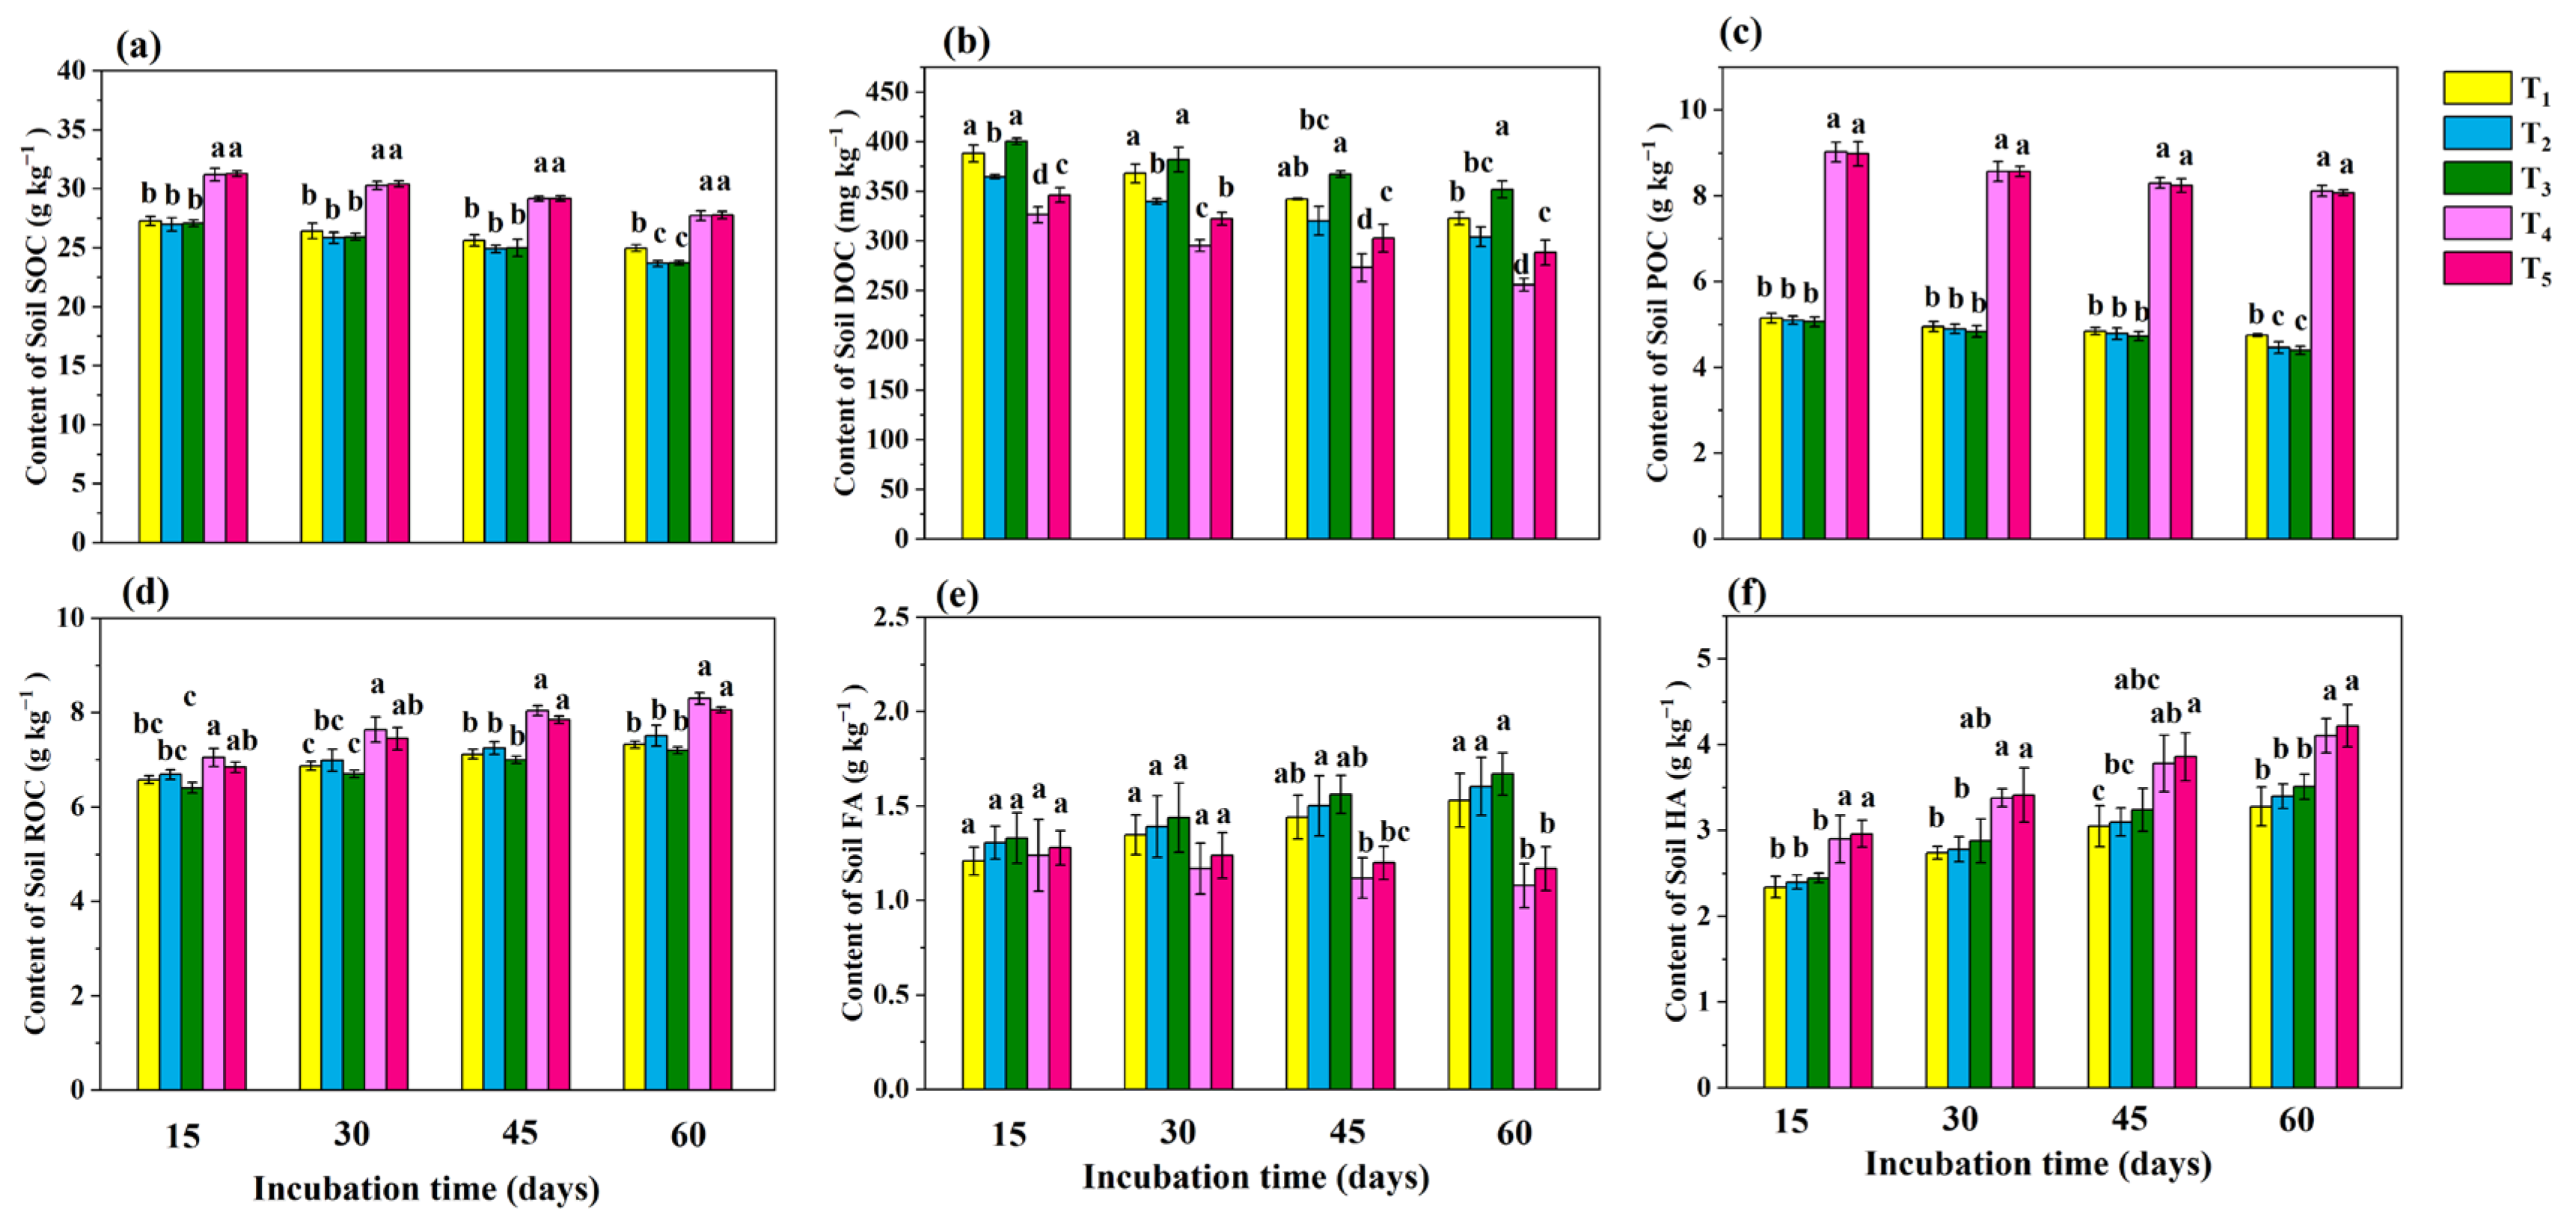
3.2. Soil Carbon Fractions

The initial soil organic carbon (SOC) content was 5.29 g kg−1 (Table S2). Compared to the T1 treatment, the T4 and T5 treatments significantly (p < 0.05) increased the SOC content at all the time points (Figure 3a). The SOC content decreased over time in all the treatments, with the largest decrease observed in T5, which decreased by 3.49 g kg−1 from day 15 to day 60 during the incubation period. The initial dissolved organic carbon (DOC) content was 178.3 mg kg−1 (Table S2). The DOC content across the treatments followed the order T3 > T1 > T2 > T4 > T5 (Figure 3b), with significant differences (p < 0.05) between treatments. The DOC content showed a decreasing trend over time for all treatments, with the greatest reduction observed in T4, which decreased by 70.4 mg kg−1 from day 15 to day 60 of the incubation period. The initial particulate organic carbon (POC) content was 0.37 g kg−1 (Table S2). During the first 45 days, the POC levels in the T4 and T5 treatments were significantly higher than those in the T1, T2, and T3 treatments (p < 0.05), with no significant differences among the T1, T2, and T3 treatments (Figure 3c). After 60 days of incubation, the POC content in the T1 treatment was significantly (p < 0.05) higher than those in the T2 and T3 treatments. The initial readily oxidizable organic carbon (ROC) content was 2.32 g kg−1 (Table S2). The ROC content increased over time for all treatments, with the highest ROC content observed in T4 (8.30 g kg−1) and the lowest in T3 (7.12 g kg−1) at the end of incubation (Figure 3d). No significant differences in the ROC content were found between the T1, T2, and T3 treatments at any time point, whereas the ROC content in the T4 treatment was significantly (p < 0.05) higher than the T1, T2, and T3 treatments. The initial fulvic acid (FA) content was 0.34 g kg−1 (Table S2). During the first 30 days, no significant differences were observed among the T1, T2, T3, T4, and T5 treatments (Figure 3e). However, after 45 days of incubation, the FA contents in the T2 treatment differed significantly (p < 0.05) from those in the T4 and T5 treatments, although there were no significant differences between the T4 and T5 treatments. At 60 days, the FA content in the T1, T2, and T3 treatments was significantly (p < 0.05) higher than that in the T4 and T5 treatments. The initial humic acid (HA) content was 1.35 g kg−1 (Table S2) and tended to increase over time among all the treatments (Figure 3f). After 60 days of incubation, the HA content in the T4 and T5 treatments was significantly (p < 0.05) higher than that in the T1, T2, and T3 treatments. The greatest increase was observed in the T5 treatment, which increased by 1.05 g kg−1 from day 15 to day 60 and increased 33.51% in comparison to T1.

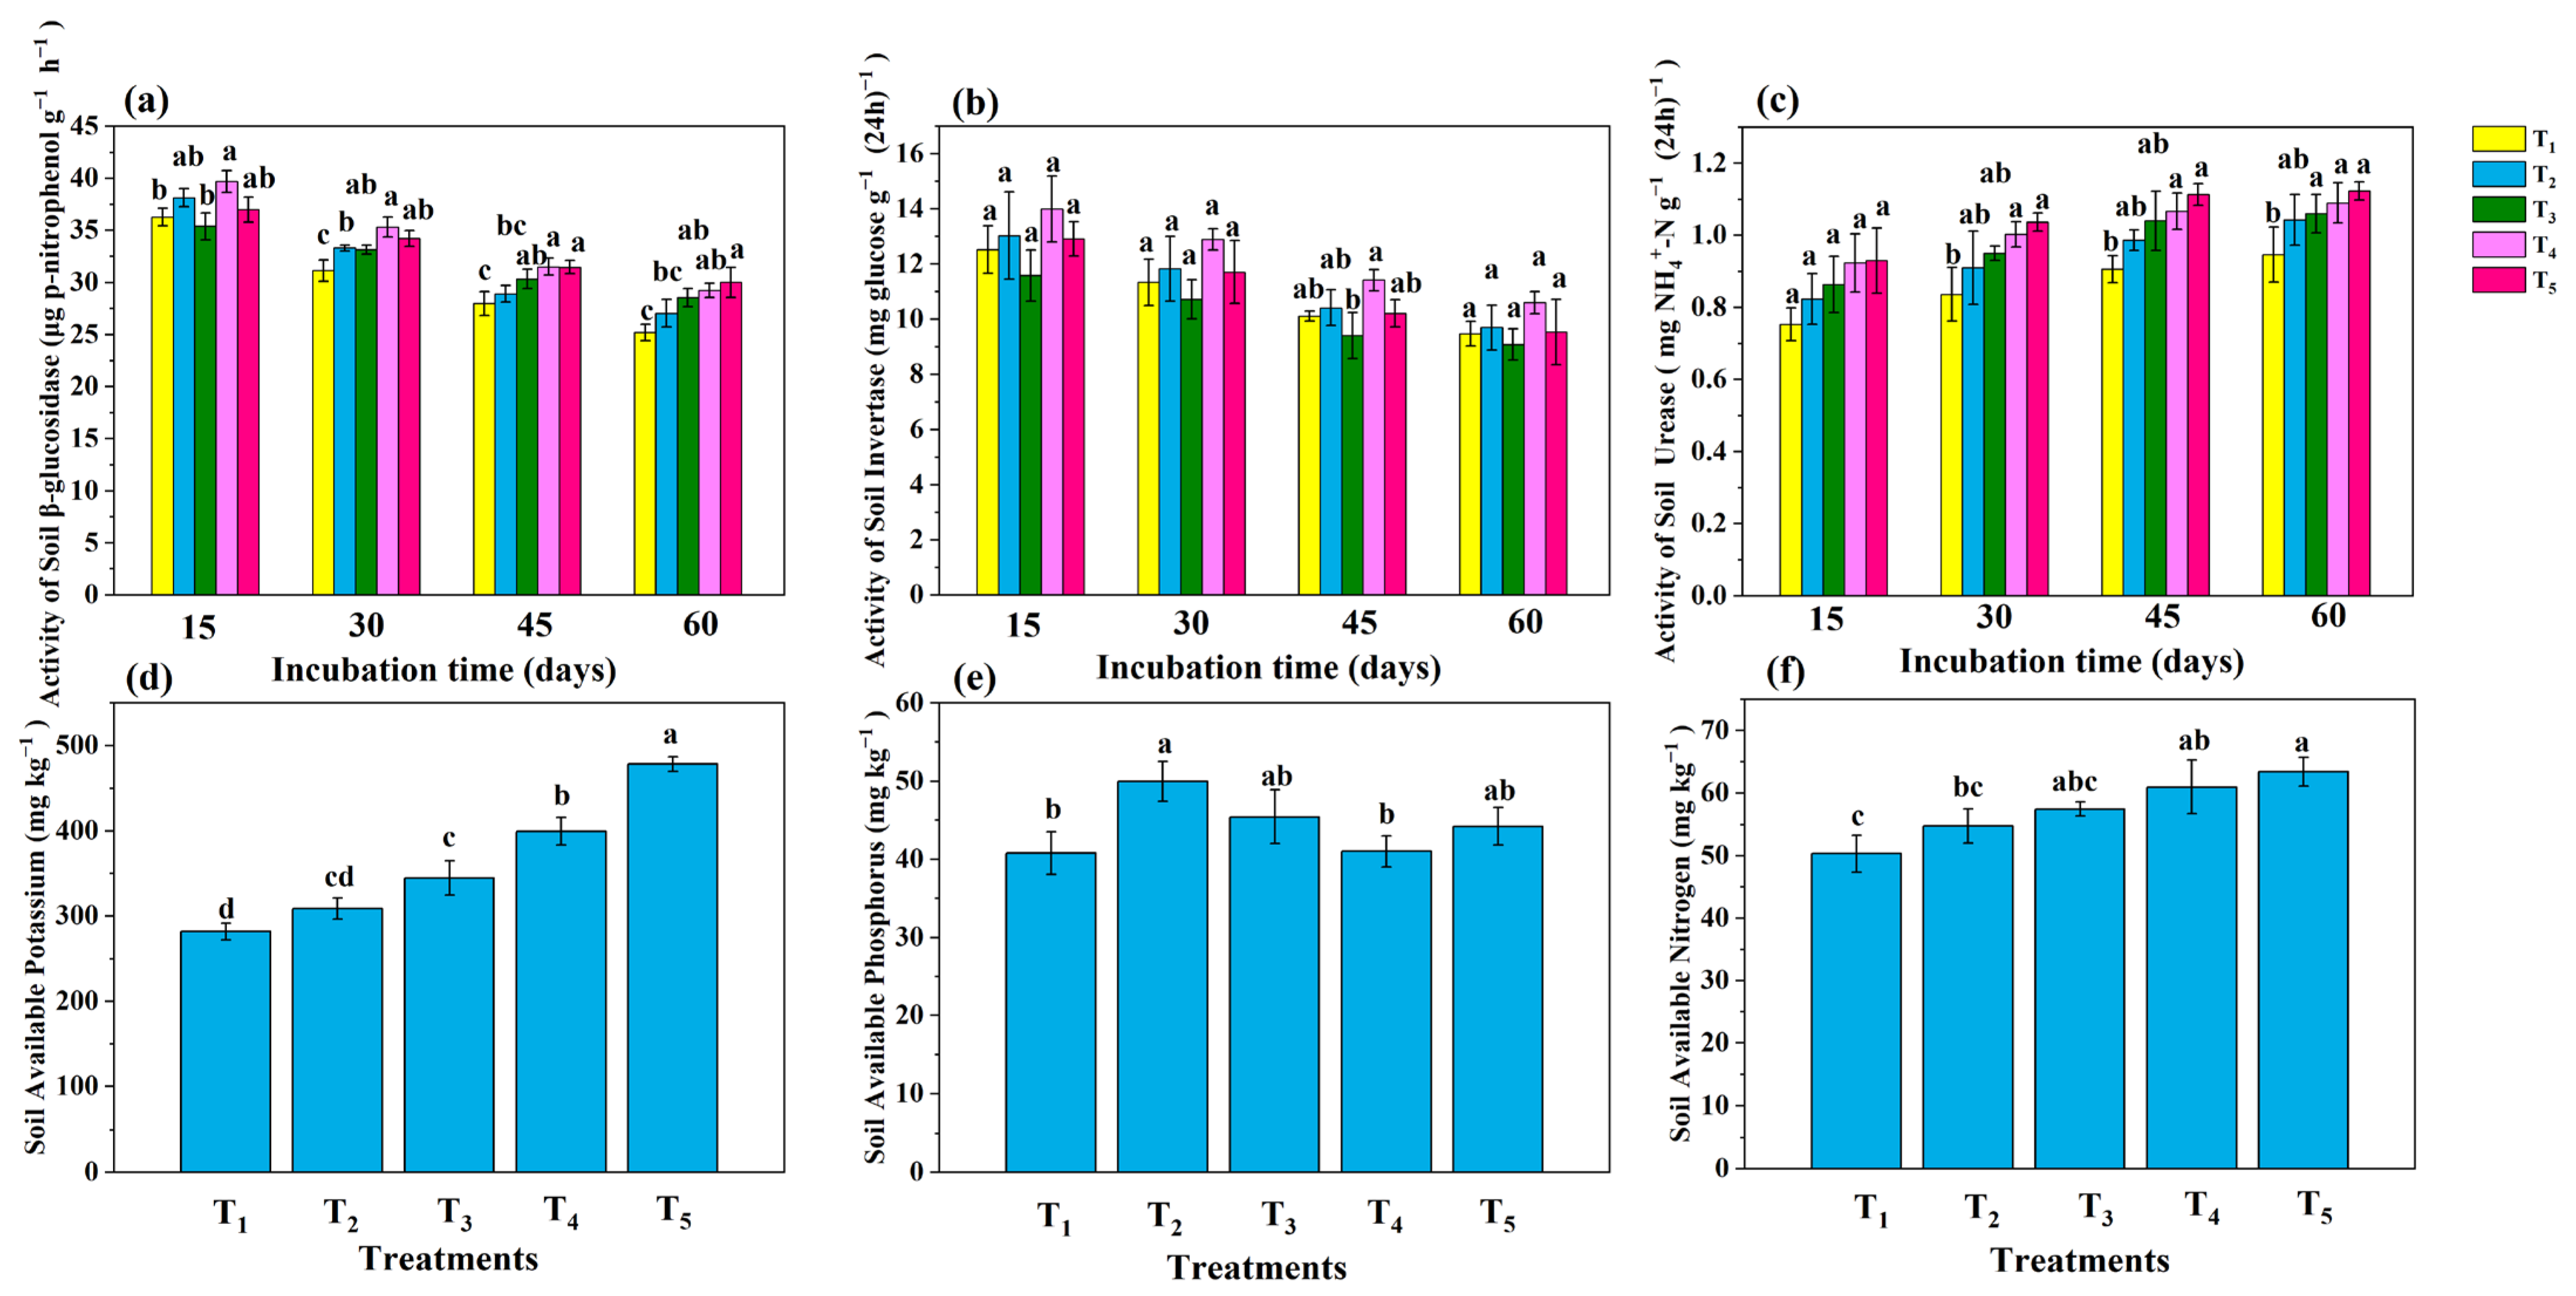
3.3. Key Soil Enzyme Activities

The initial β-glucosidase activity in the soil was 17.6 μg p-nitrophenol g−1 h−1 (Table S3). The β-glucosidase activity decreased over time in all the treatments (Figure 4a). The T4 and T5 treatments exhibited the highest β-glucosidase activity from day 15 to day 60, the T1 treatment showed the lowest activity, and the T2 and T3 treatments were higher than the T1 treatment. After 60 days of incubation, the activity of β-glucosidase in T5 was highest, increasing by 19.1% in comparison to T1. The initial invertase activity was 0.93 mg glucose g−1 (24 h)−1 (Table S3). The activity of soil invertase decreased over time in all the treatments (Figure 4b). Across all the time points, the highest invertase activity was observed in the T4 treatment, while the lowest activity was in the T3 treatment. Compared with the T1 treatment, the T2 treatment consistently resulted in greater invertase activity. After 60 days of incubation, the T4 treatment exhibited the highest invertase activity (10.6 mg glucose g−1 (24 h)−1), whereas the T3 treatment showed the lowest invertase activity (9.08 mg glucose g−1 (24 h)−1). The initial urease activity in the soil was 0.19 mg N H 4 + -N g−1 (24 h)−1 (Table S3). The urease activity tended to increase over time in all the treatments (Figure 4c). Urease activity was ranked at all the time points as T5 > T4 > T3 > T2 > T1. By the end of the 60-day incubation, the urease activity in the T3, T4, and T5 treatments was significantly (p < 0.05) higher than that in the T1 treatment. After 60 days of incubation, the activity of urease in T5 was highest, increasing by 17.9% in comparison to T1.

3.4. Available Nutrients and Elimination of Saline–Alkali Barriers

The initial available potassium (AK) content was 150 mg kg−1 (Table S3). Significant differences (p < 0.05) in the AK content were observed in the T1, T3, T4, and T5 treatments, with the following ranking: T5 > T4 > T3 > T2 > T1 (Figure 3d). The T5 treatment exhibited the highest AK content, reaching 478 mg kg−1, increasing by 70.1% in comparison to T1. The initial available phosphorus (AP) content was 18.5 mg kg−1 (Table S3). The highest AP content was found in the T2 treatment (50.0 mg kg−1) (Figure 4e). The initial available nitrogen (AN) content in the soil was 33.0 mg kg−1 (Table S3). Compared with the T1 treatment, the T4 and T5 treatments significantly (p < 0.05) increased the AN content, following the order of T5 > T4 > T3 > T2 > T1 (Figure 4f). The T5 treatment had the greatest AN content at 61.0 mg kg−1, which was significantly (p < 0.05) higher than the other treatments and an increase of 26.1% in comparison to T1. The T2 treatment significantly (p < 0.05) reduced the soil EC ( CO 3 2 + HCO 3 ) and the exchangeable sodium (ENa) (Table 1) in comparison to the T1 treatment, whereas the T3, T4, and T5 treatments reduced the soil pH, electrical conductivity (EC), and ( CO 3 2 + HCO 3 ) concentration in comparison to the T2 treatment. The T5 treatment resulted in the greatest decreases in pH, ESP, and ( CO 3 2 + HCO 3 ) concentration, with reductions of 0.24 units, 3.26%, and 120 mg kg−1, respectively, in comparison to T1. The T4 and T5 treatments exhibited the greatest increases in the cation exchange capacity (CEC), with increases of 19.9% and 24.5%, respectively.

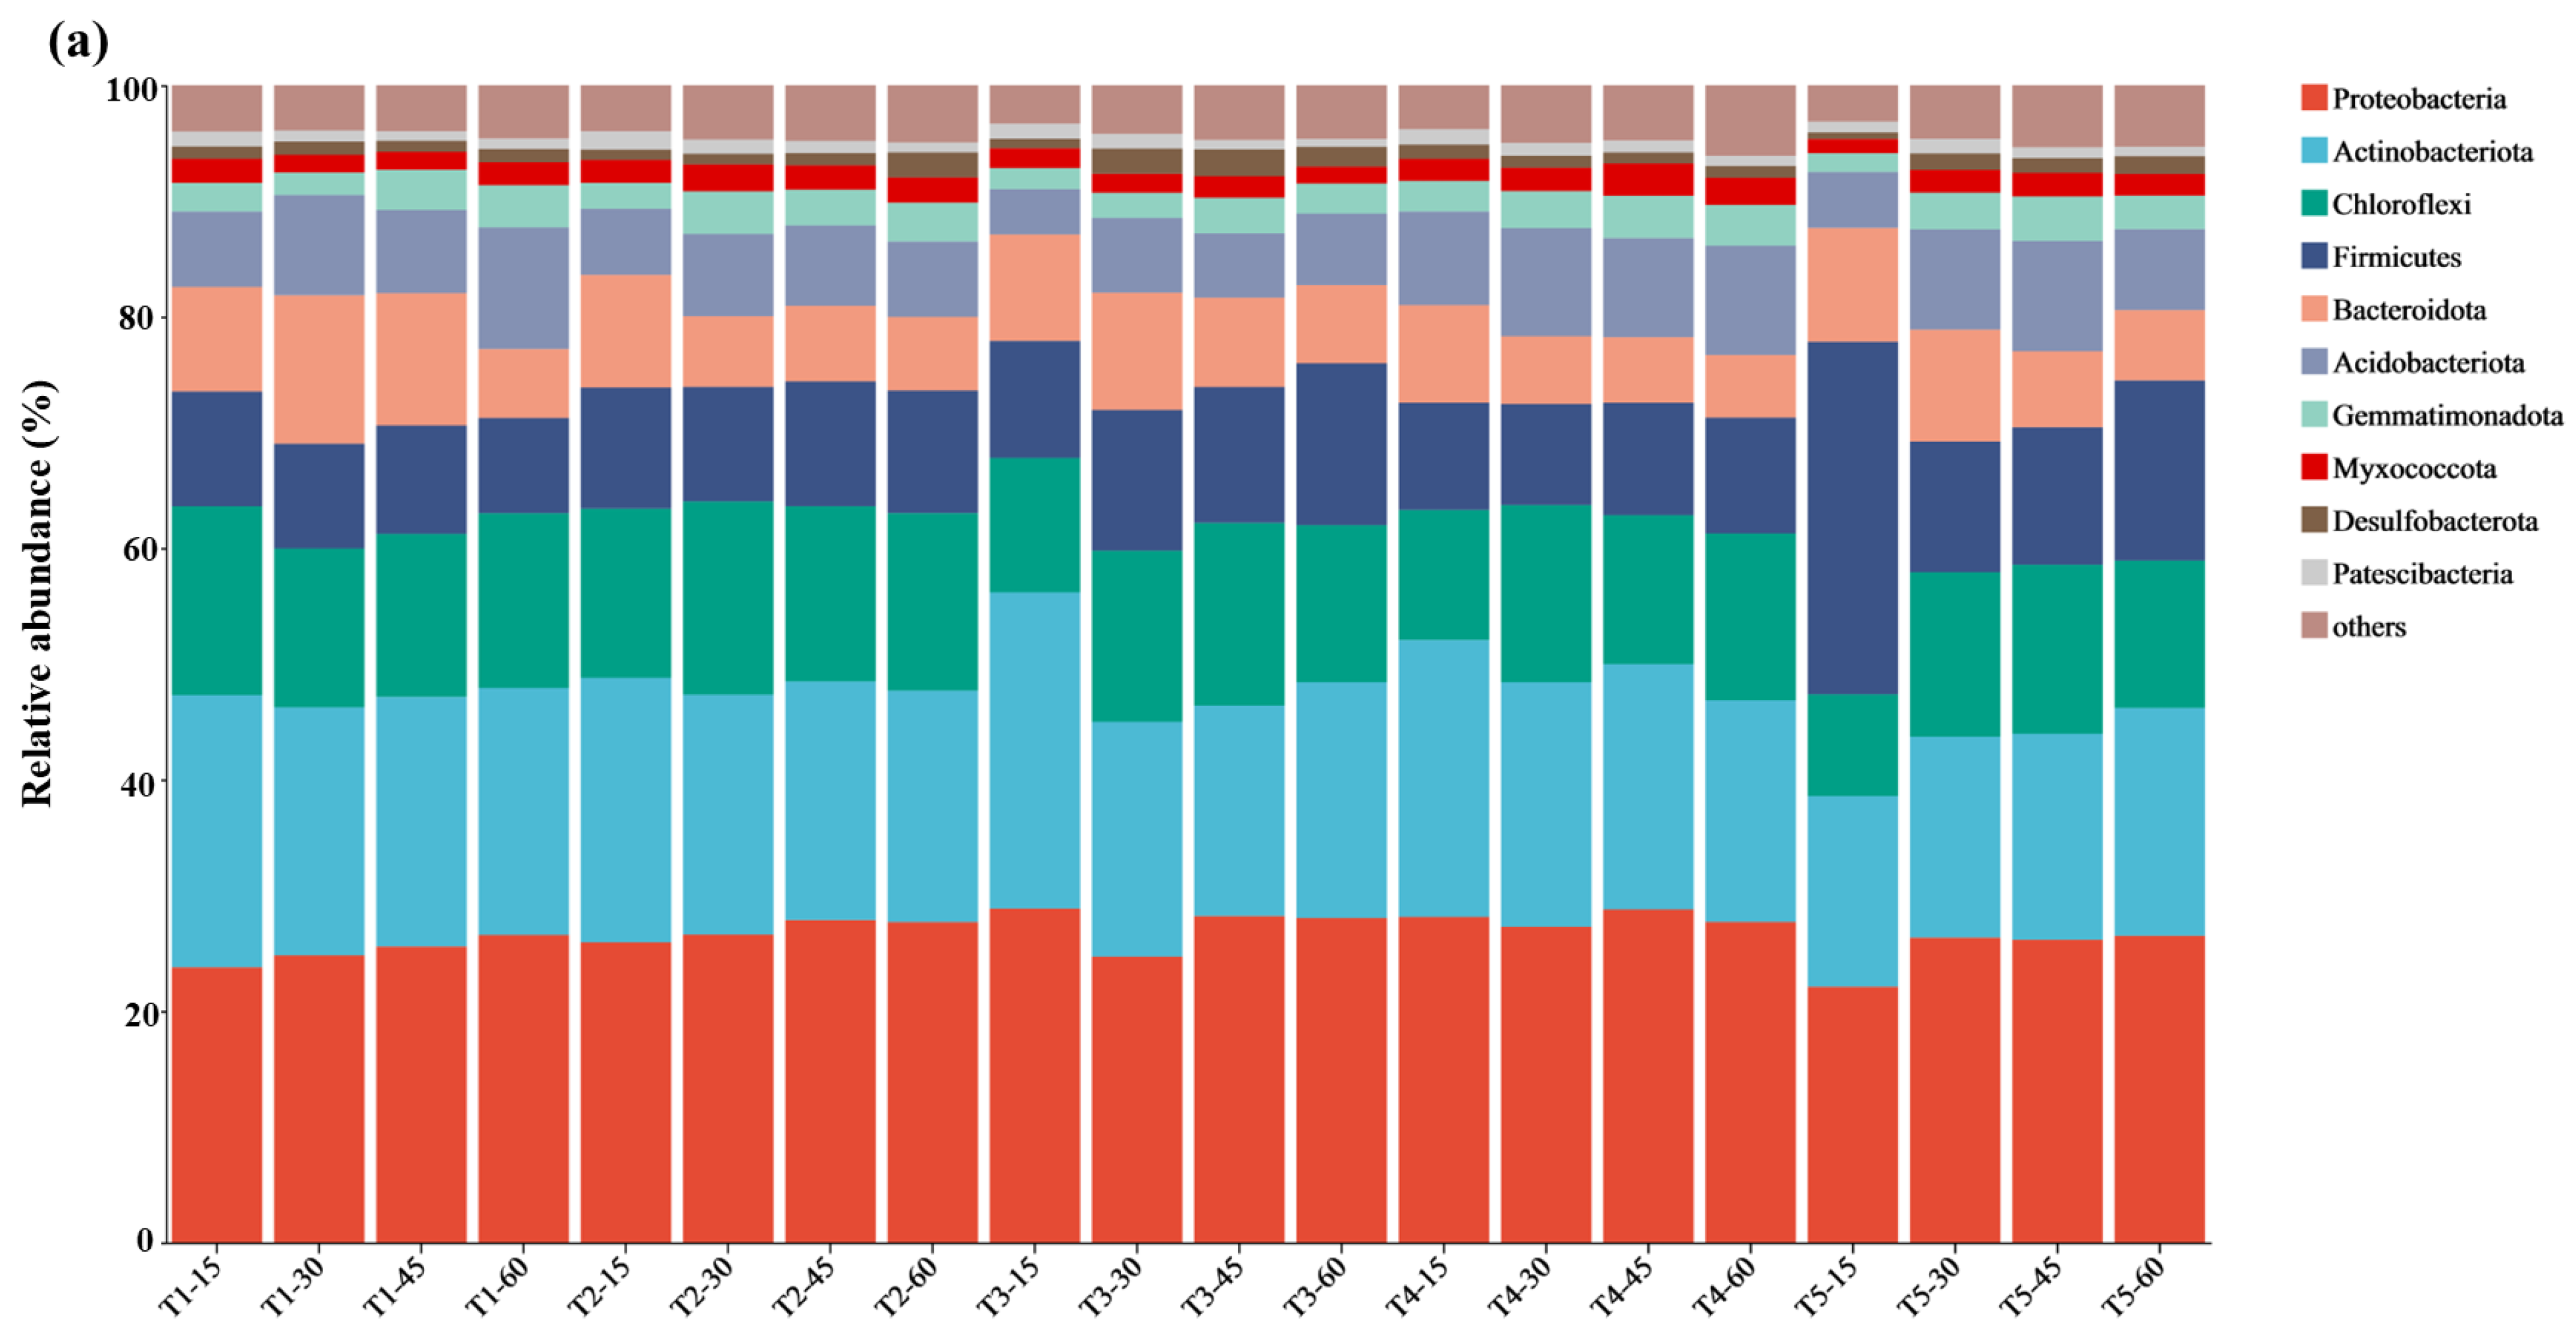
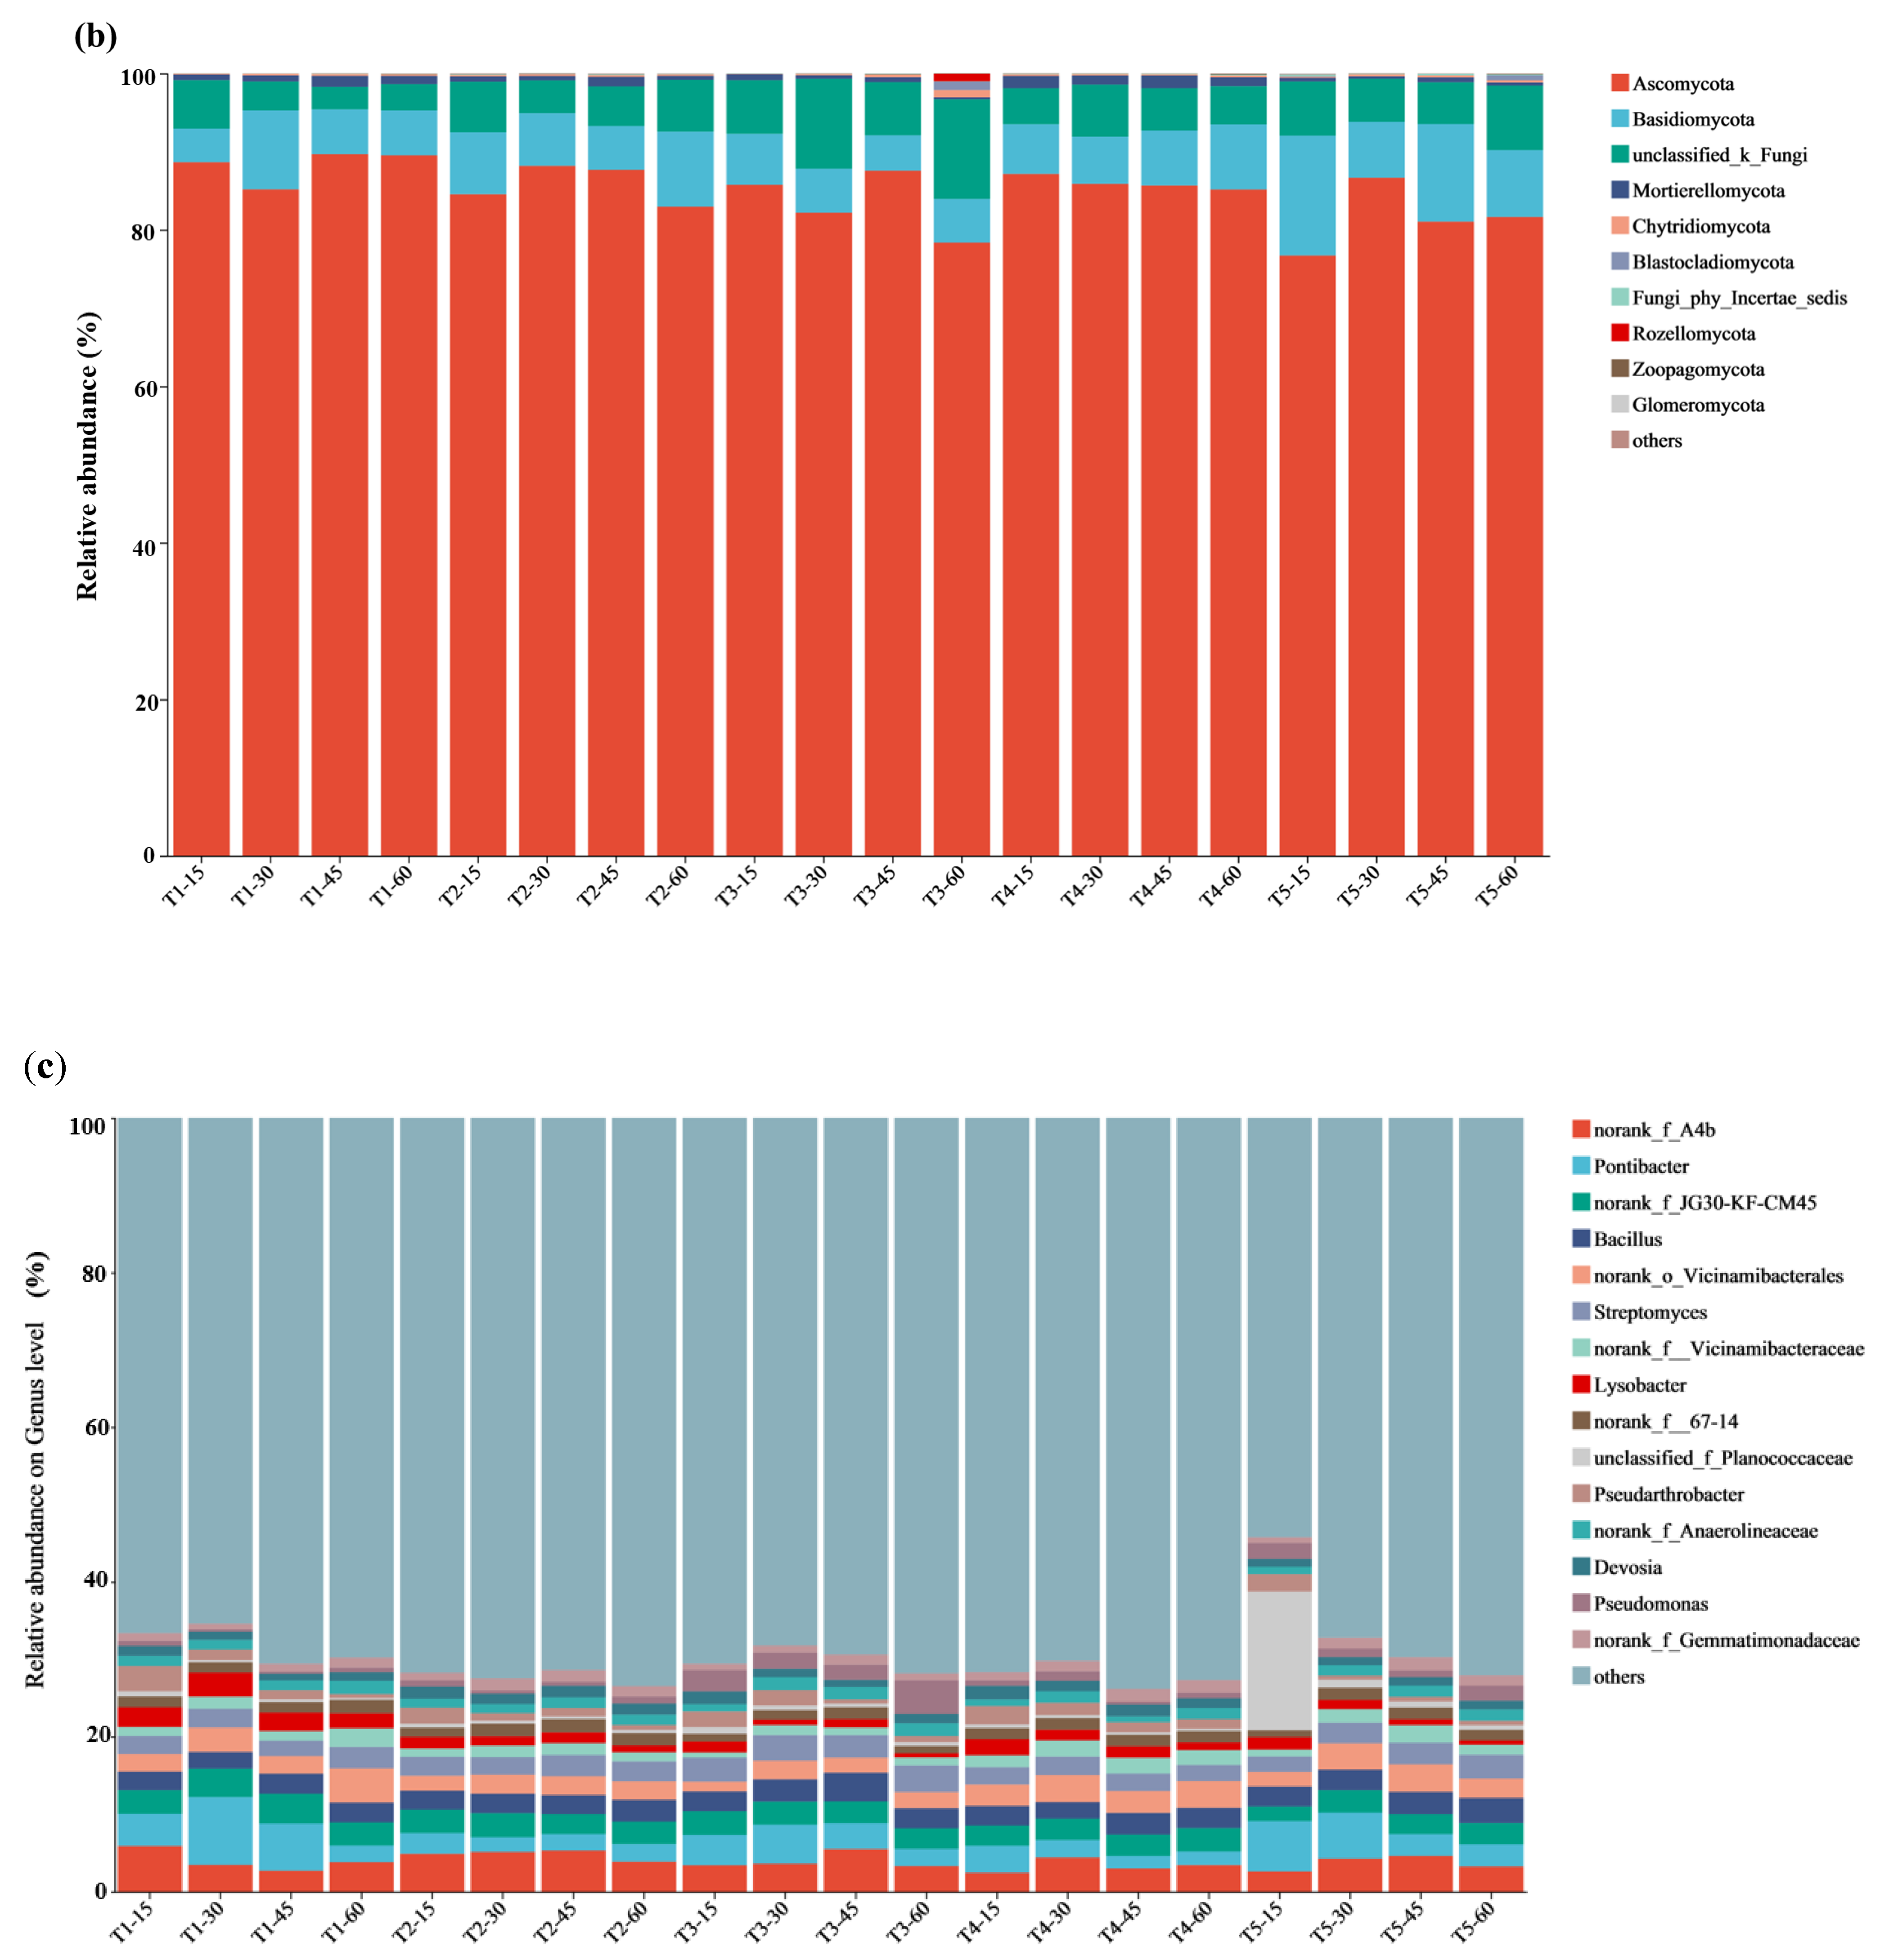
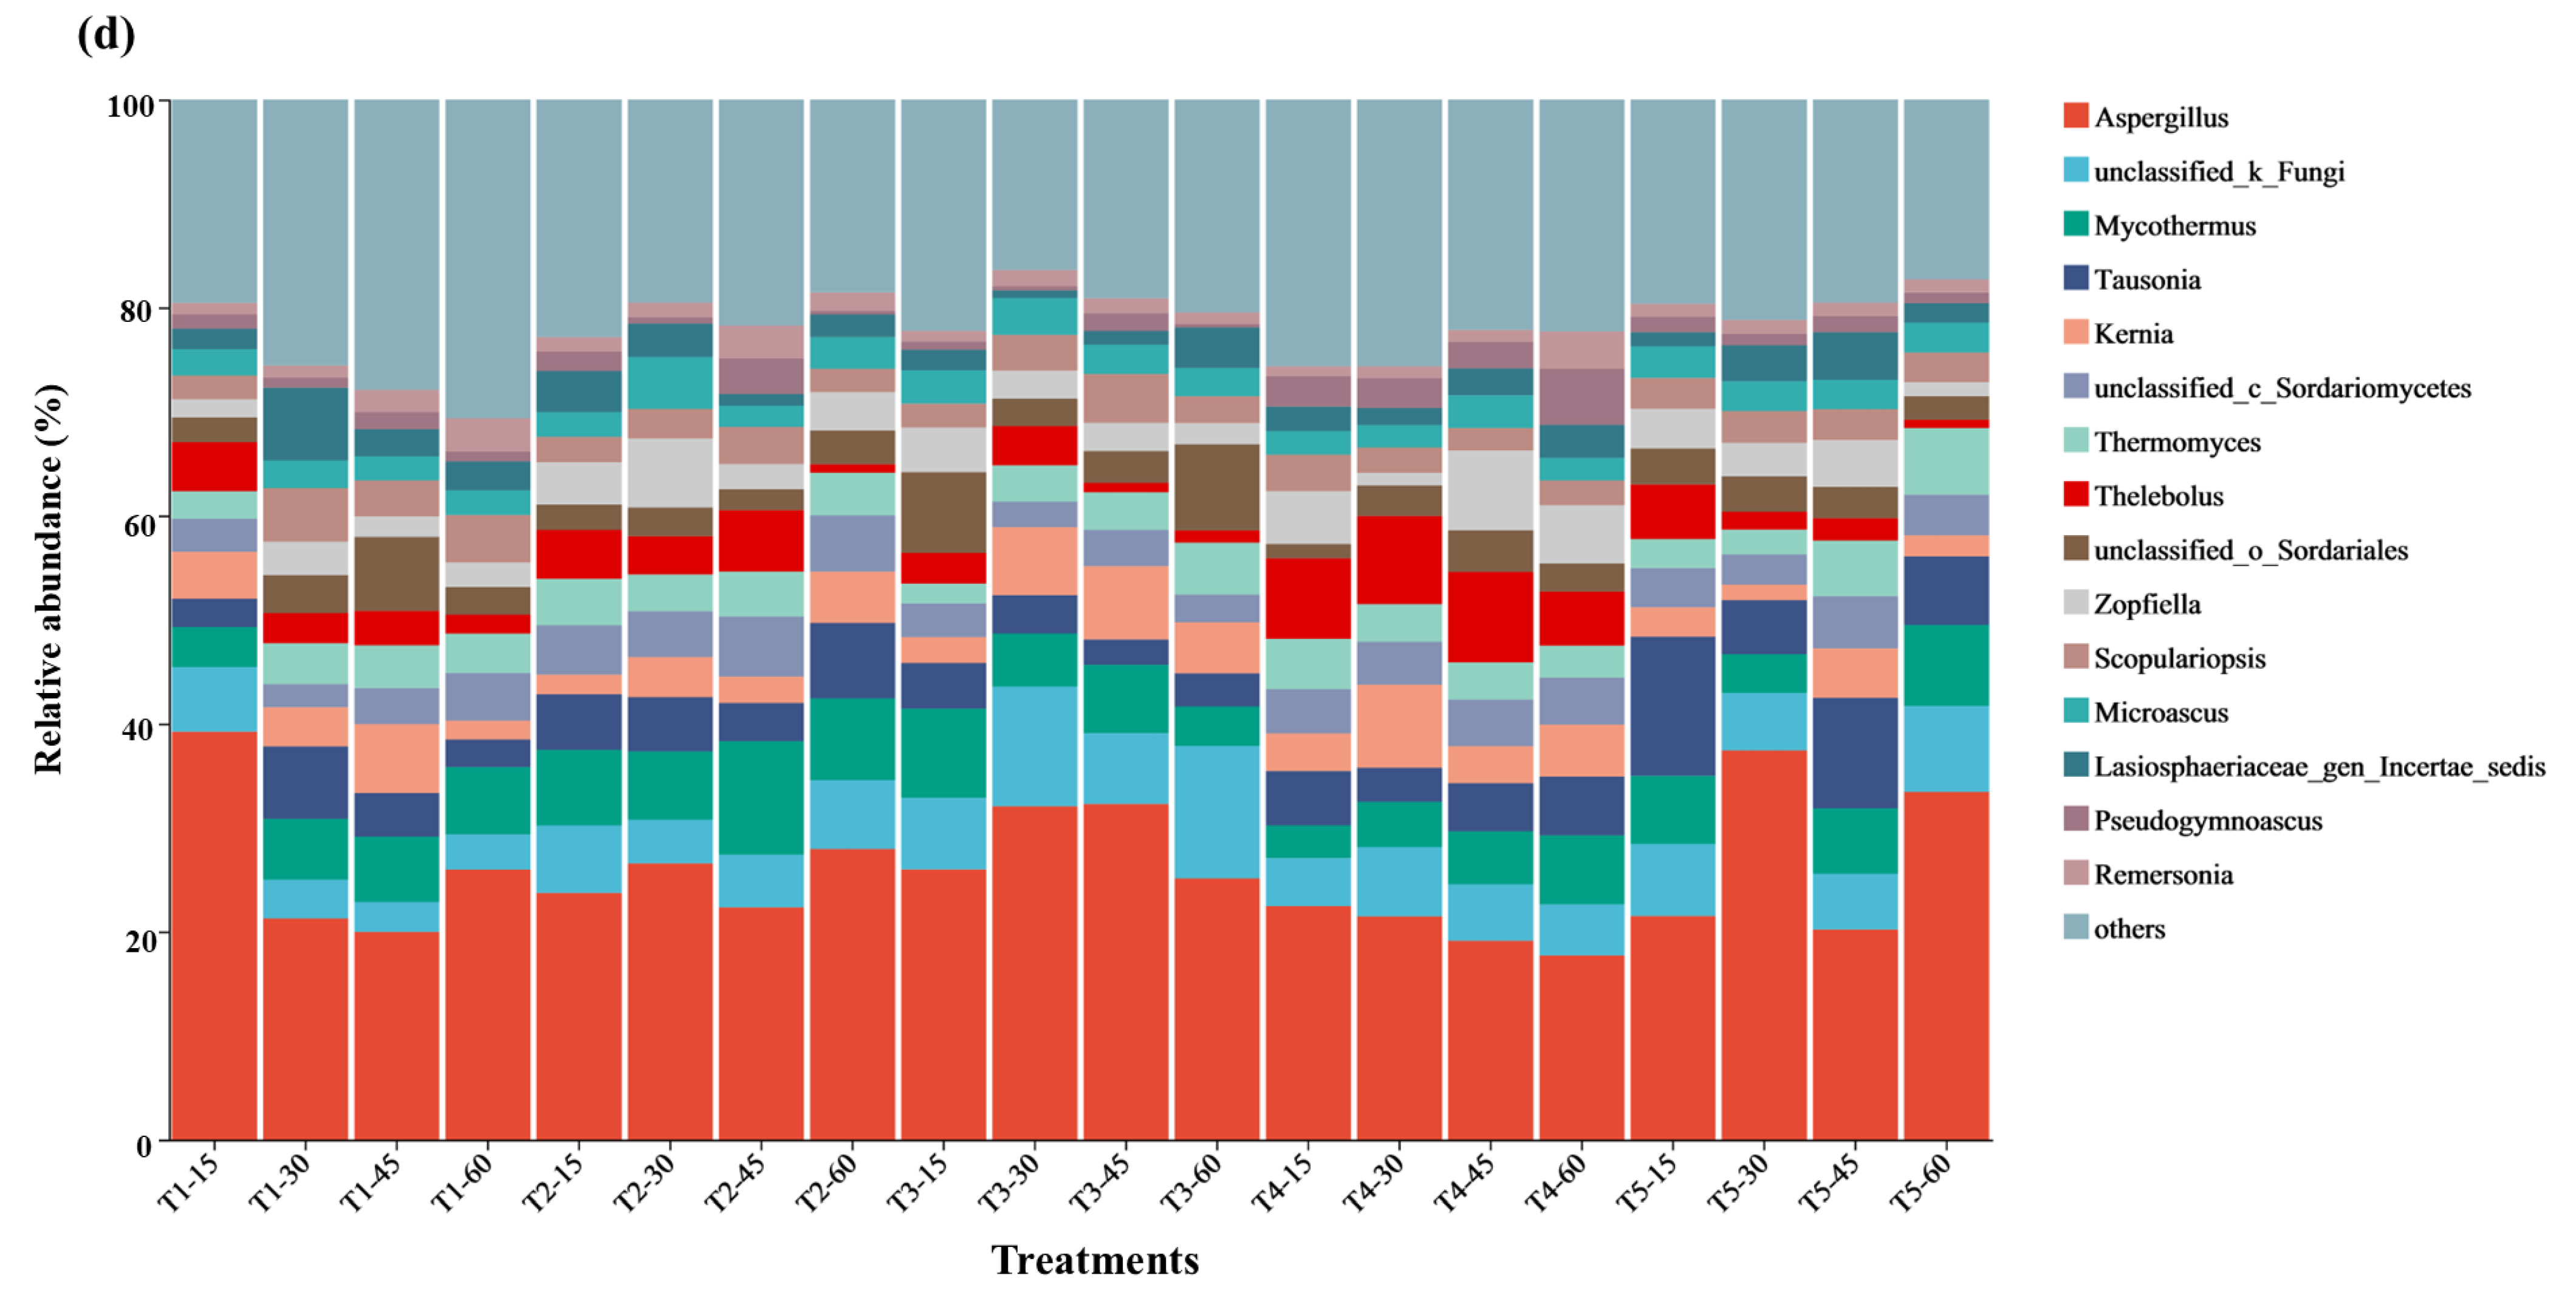
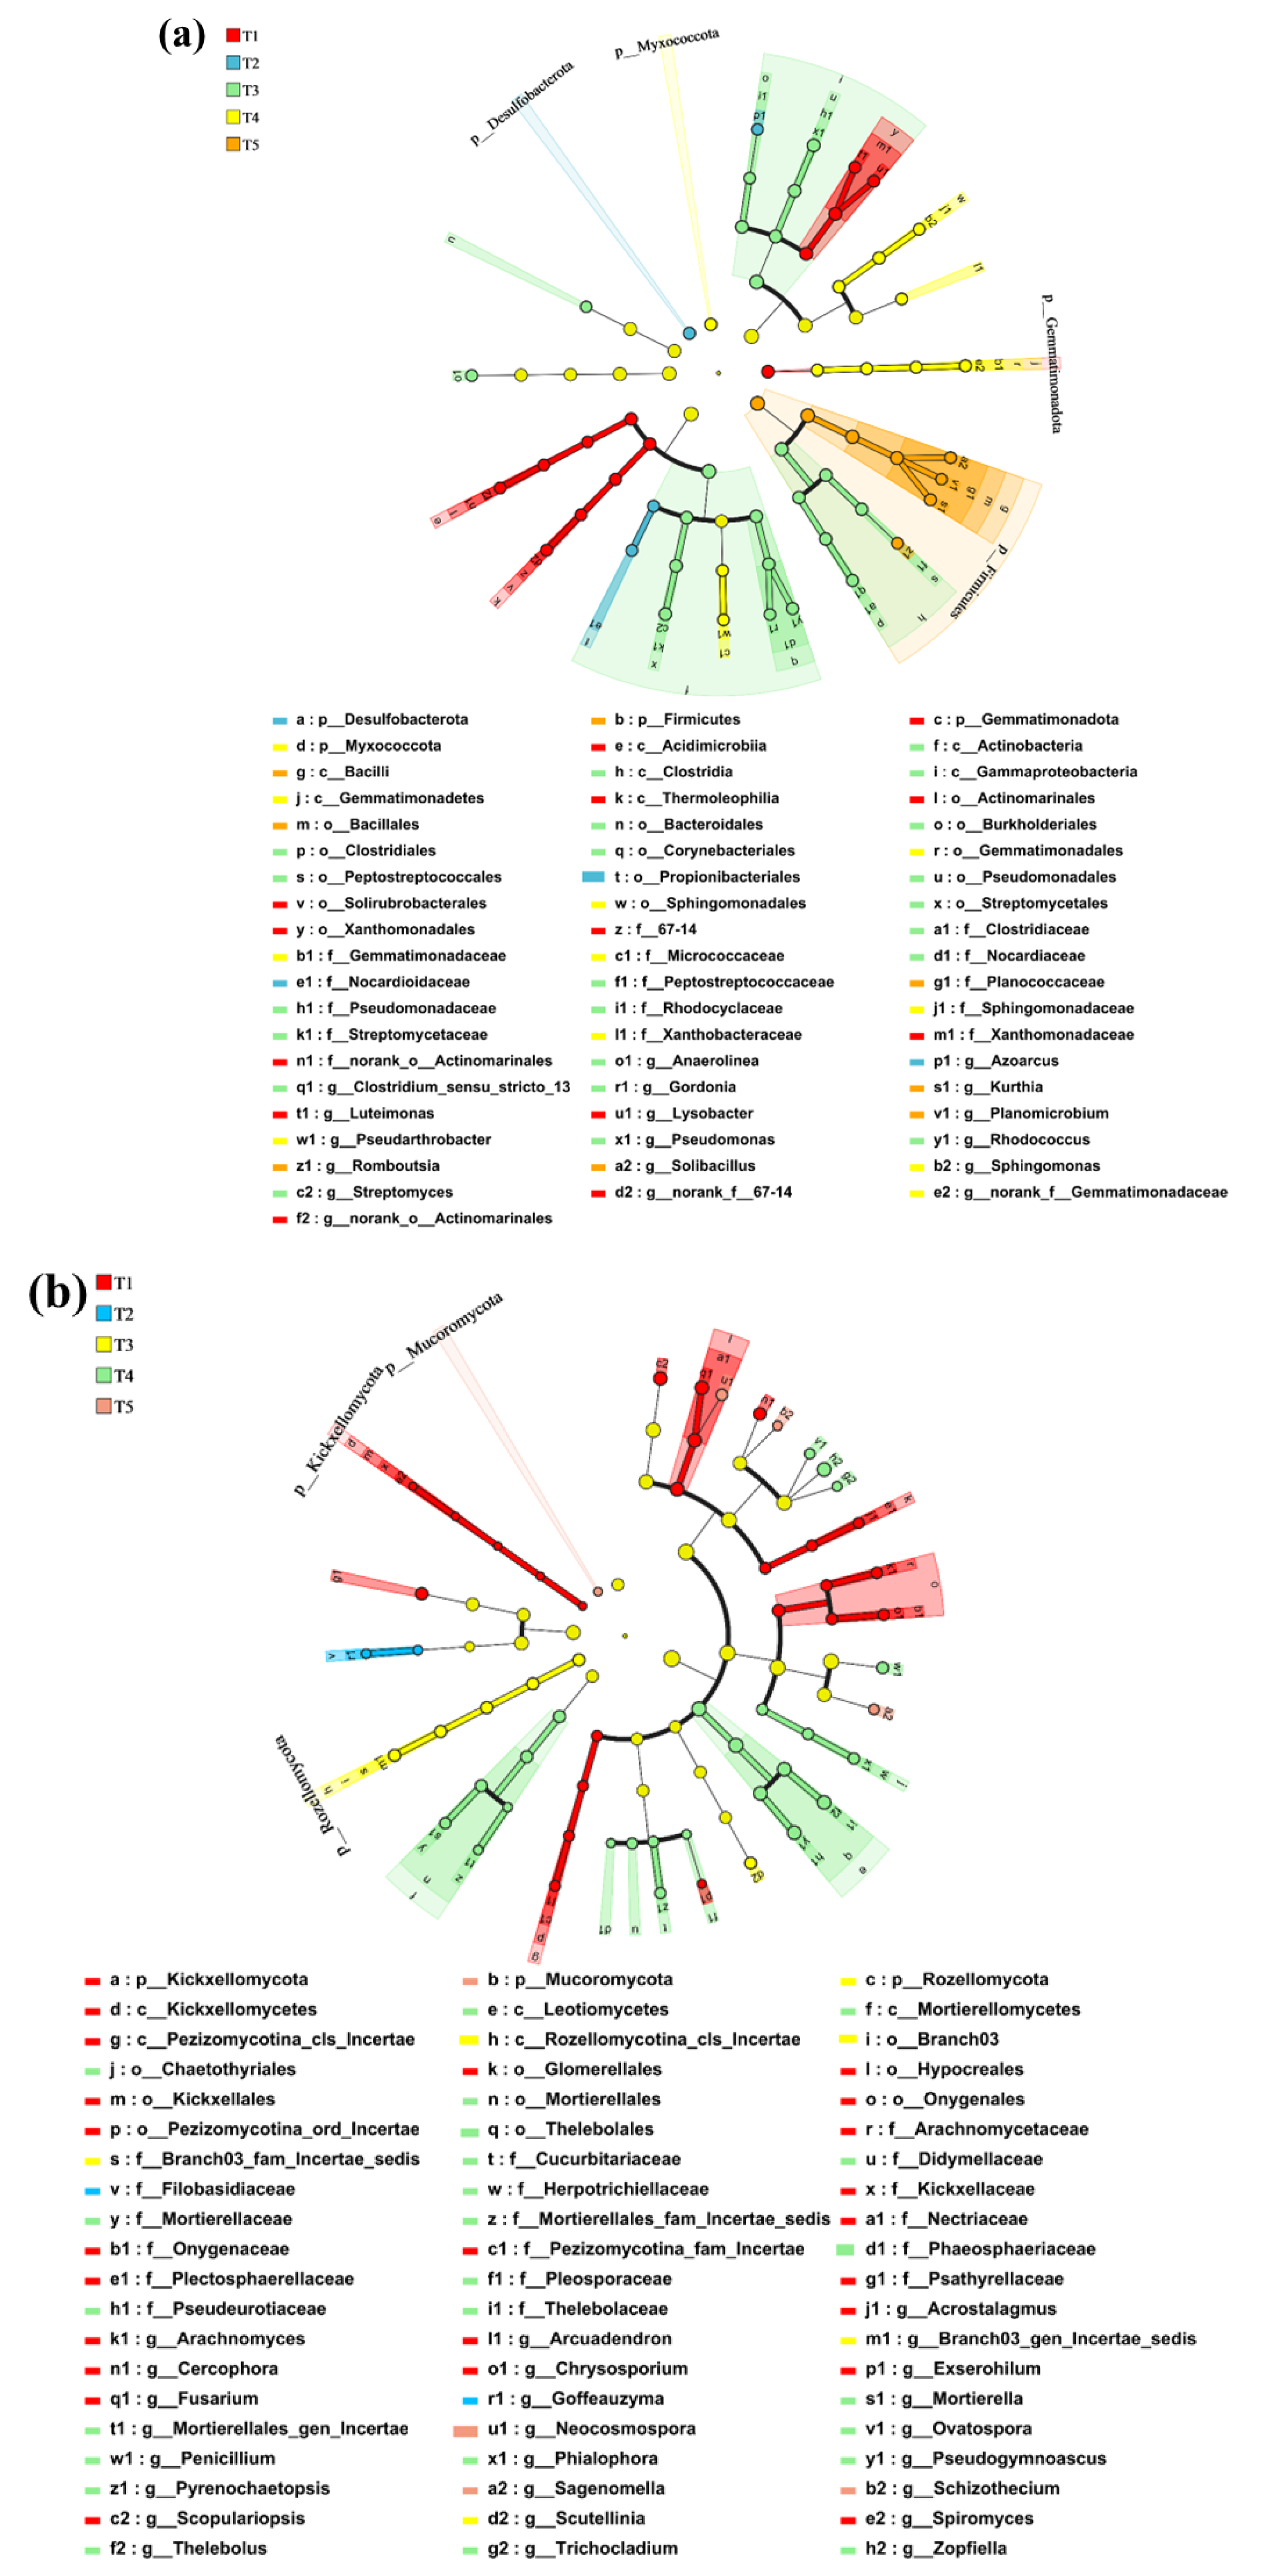
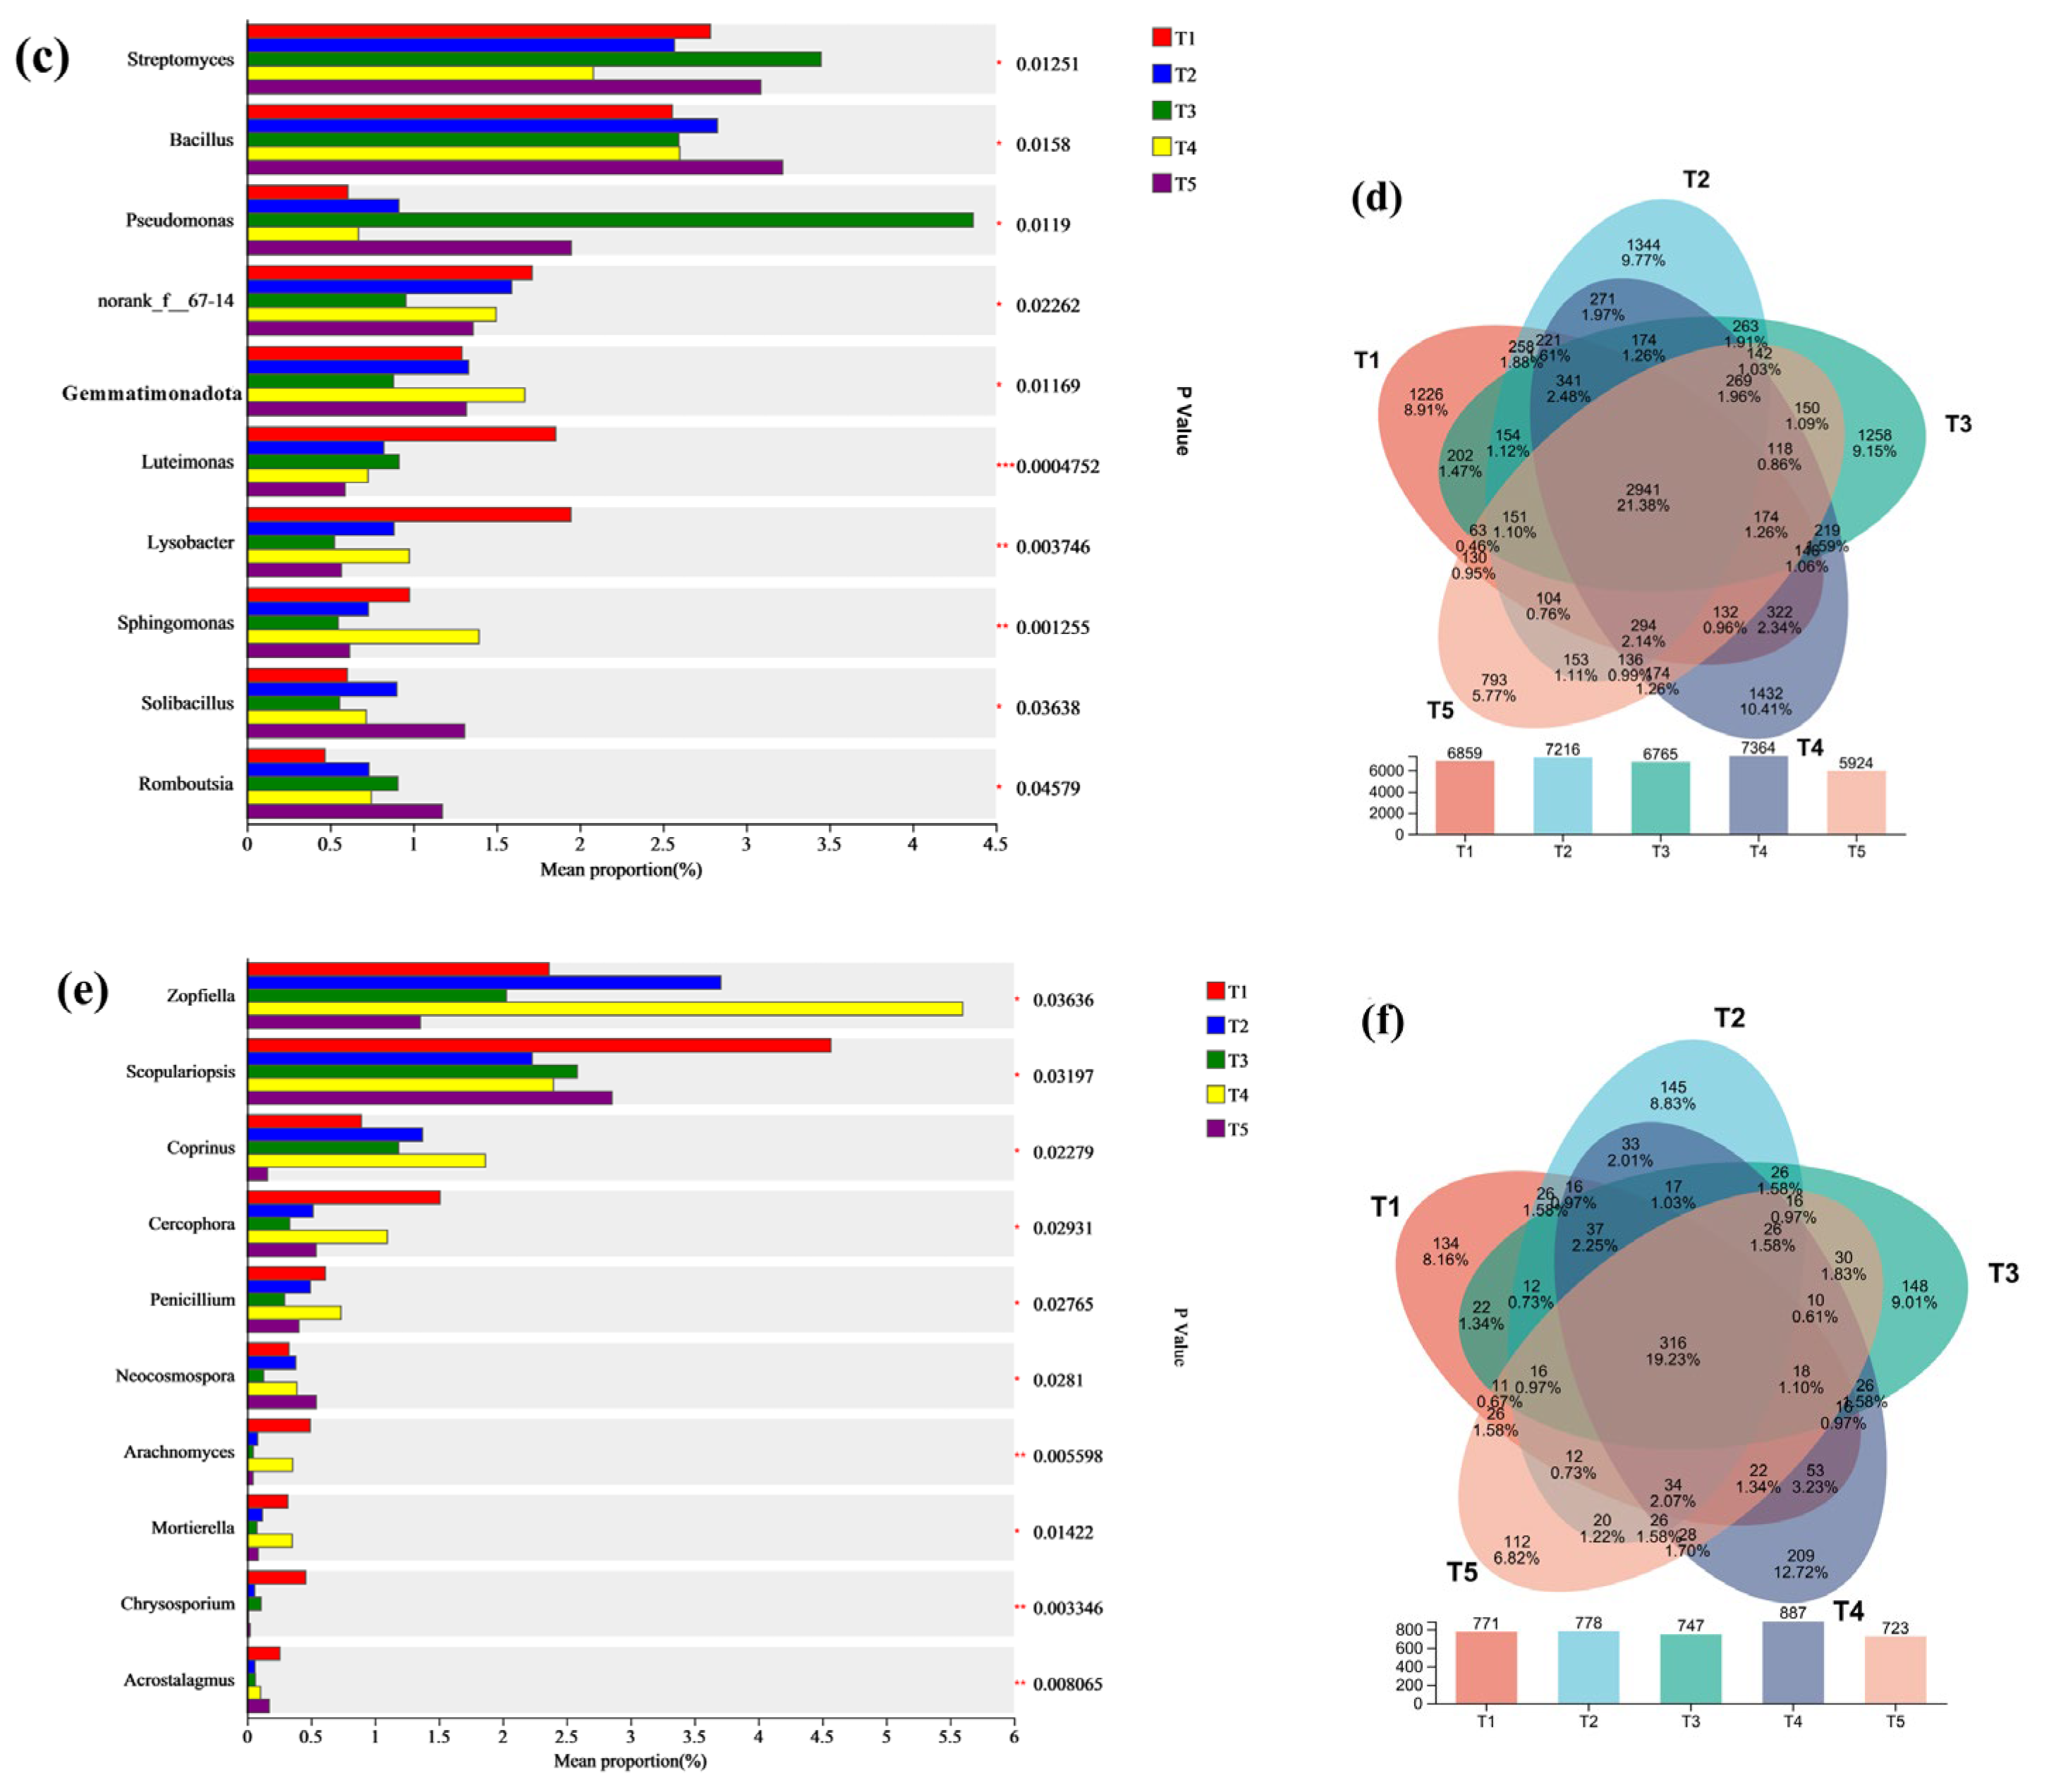
3.5. Microbial Composition and Analysis of Differences

Using the Ace index as an example, differences in alpha diversity were observed among the treatments (Table 2). The addition of earthworms increased the soil bacterial diversity at any time point, but the soil alpha diversity decreased in the T3 treatment in comparison to the T2 treatment. However, adding BC effectively enhanced the microbial diversity. The combination of earthworms, BS, and BC adjusted the soil bacterial community structure, with earthworms and BC likely increasing the relative abundance of beneficial bacteria. During the early stages of incubation, the bacterial diversity in T5 was relatively low but gradually increased over time. The Ace index was significantly lower in the T4 and T5 treatments than in the T2 treatment. On day 30, the differences between the treatments were not significant; by day 45 to 60, the Ace index of the T4 and T5 treatments was higher than that of T1. The Ace of T3 was lower than that of the T2 treatment at all the time points.
Soil samples were taken at four time points throughout the incubation period for the sequencing analysis. The relative abundances of the bacterial and fungal communities are shown in Figure 4. At the phylum level, the 10 most abundant bacteria, which included Actinobacteriota, Proteobacteria, Chloroflexi, Firmicutes, Bacteroidota, Acidobacteriota, Gemmatimonadota, and Myxococcota, accounted for 90.6–95.3% of the total bacterial abundance (Figure 5a). On day 15, the relative abundance of Actinobacteriota was highest in the T3 treatment, while Firmicutes had the highest abundance in the T5 treatment. The average relative abundance of Firmicutes followed the order T5 > T3 > T2 > T4 > T1. Among the fungal communities, Ascomycota, Basidiomycota, and unclassified_k_Fungi constituted the majority, accounting for 96.9–97.4% of the total fungal abundance (Figure 5b). Across all the treatments, Basidiomycota had the highest relative abundance, peaking at 15.4% on day 15.
At the genus level, the 15 most abundant bacterial genera included Pontibacter, norank_f_JG30-KF-CM45, norank_f_A4b, norank_f_norank_o_Vicinamibacterales, Skermanella, norank_f_Anaerolineaceae, Lysobacter, and Bacillus, accounting for 19.6–29.3% of the total bacterial abundance (Figure 5c). The relative abundance of Bacillus peaked in the T3 treatment after 45 days (3.65%) and steadily increased in the T5 treatment throughout the incubation period, reaching its highest level (3.22%) on day 60. This suggested that BS produced short-terms effects when introduced, whereas BSC maintained a higher relative abundance of Bacillus and prolonged its survival time. The relative abundance of Streptomyces was greater in the T3 treatment throughout the incubation period and in the T5 treatment from day 30 to 60. A Venn diagram (Figure 6d) showed that all the treatments shared 2941 OTUs, accounting for 21.38% of the total amount. T4 had the greatest number of unique species (1432 OTUs, 10.41%). The LefSe analysis of bacterial communities after 60 days of incubation (Figure 6a) revealed that the T2 treatment influenced Desulfobacterota, whereas the T5 treatment affected Firmicutes, Bacillales, and Bacilli. In contrast, the T3 treatment impacted Actinomarinates and Gammaproteobacteria. Although the earthworm, BS, and BSC combinations altered the bacterial community structures at the phylum level, the changes in fungal communities were less pronounced. At the genus level (Figure 6c), Bacillus, Solibacillus, and Romboutsia significantly differed in the T5 treatment compared to other treatments (p < 0.05), while Pseudomonas significantly differed in the T3 treatment (p < 0.05).
For fungal communities, the most abundant genera included Aspergillus, Tausonia, Scopulariopsis, unclassified_k_Fungi, Mycothermus, unclassified_c_Sordariomycetes, Kernia, unclassified_o_Sordariales, and Thelebolus, accounting for 40.3–71.1% of the total fungal abundance (Figure 5d). Compared to the T1 treatment, the T2 treatment increased the relative abundance of Mycothermus at all the time points. After 60 days of incubation, the relative abundance of Mycothermus was highest in T5. During the first 45 days, the T2 treatment had a higher Thelebolus abundance than the T1 treatment, with the highest abundance consistently found in the T4 treatment. The significance testing of fungal genera (Figure 6e) showed significant differences in Aspergillus between the T2 and T5 treatments and in Zopfiella between the T2 and T4 treatments (p < 0.05). A Venn diagram (Figure 6f) showed that all the treatments shared 316 OTUs, accounting for 19.2% of the total, with the highest number of unique species (209 OTUs, 12.7%) found in the T4 treatment.

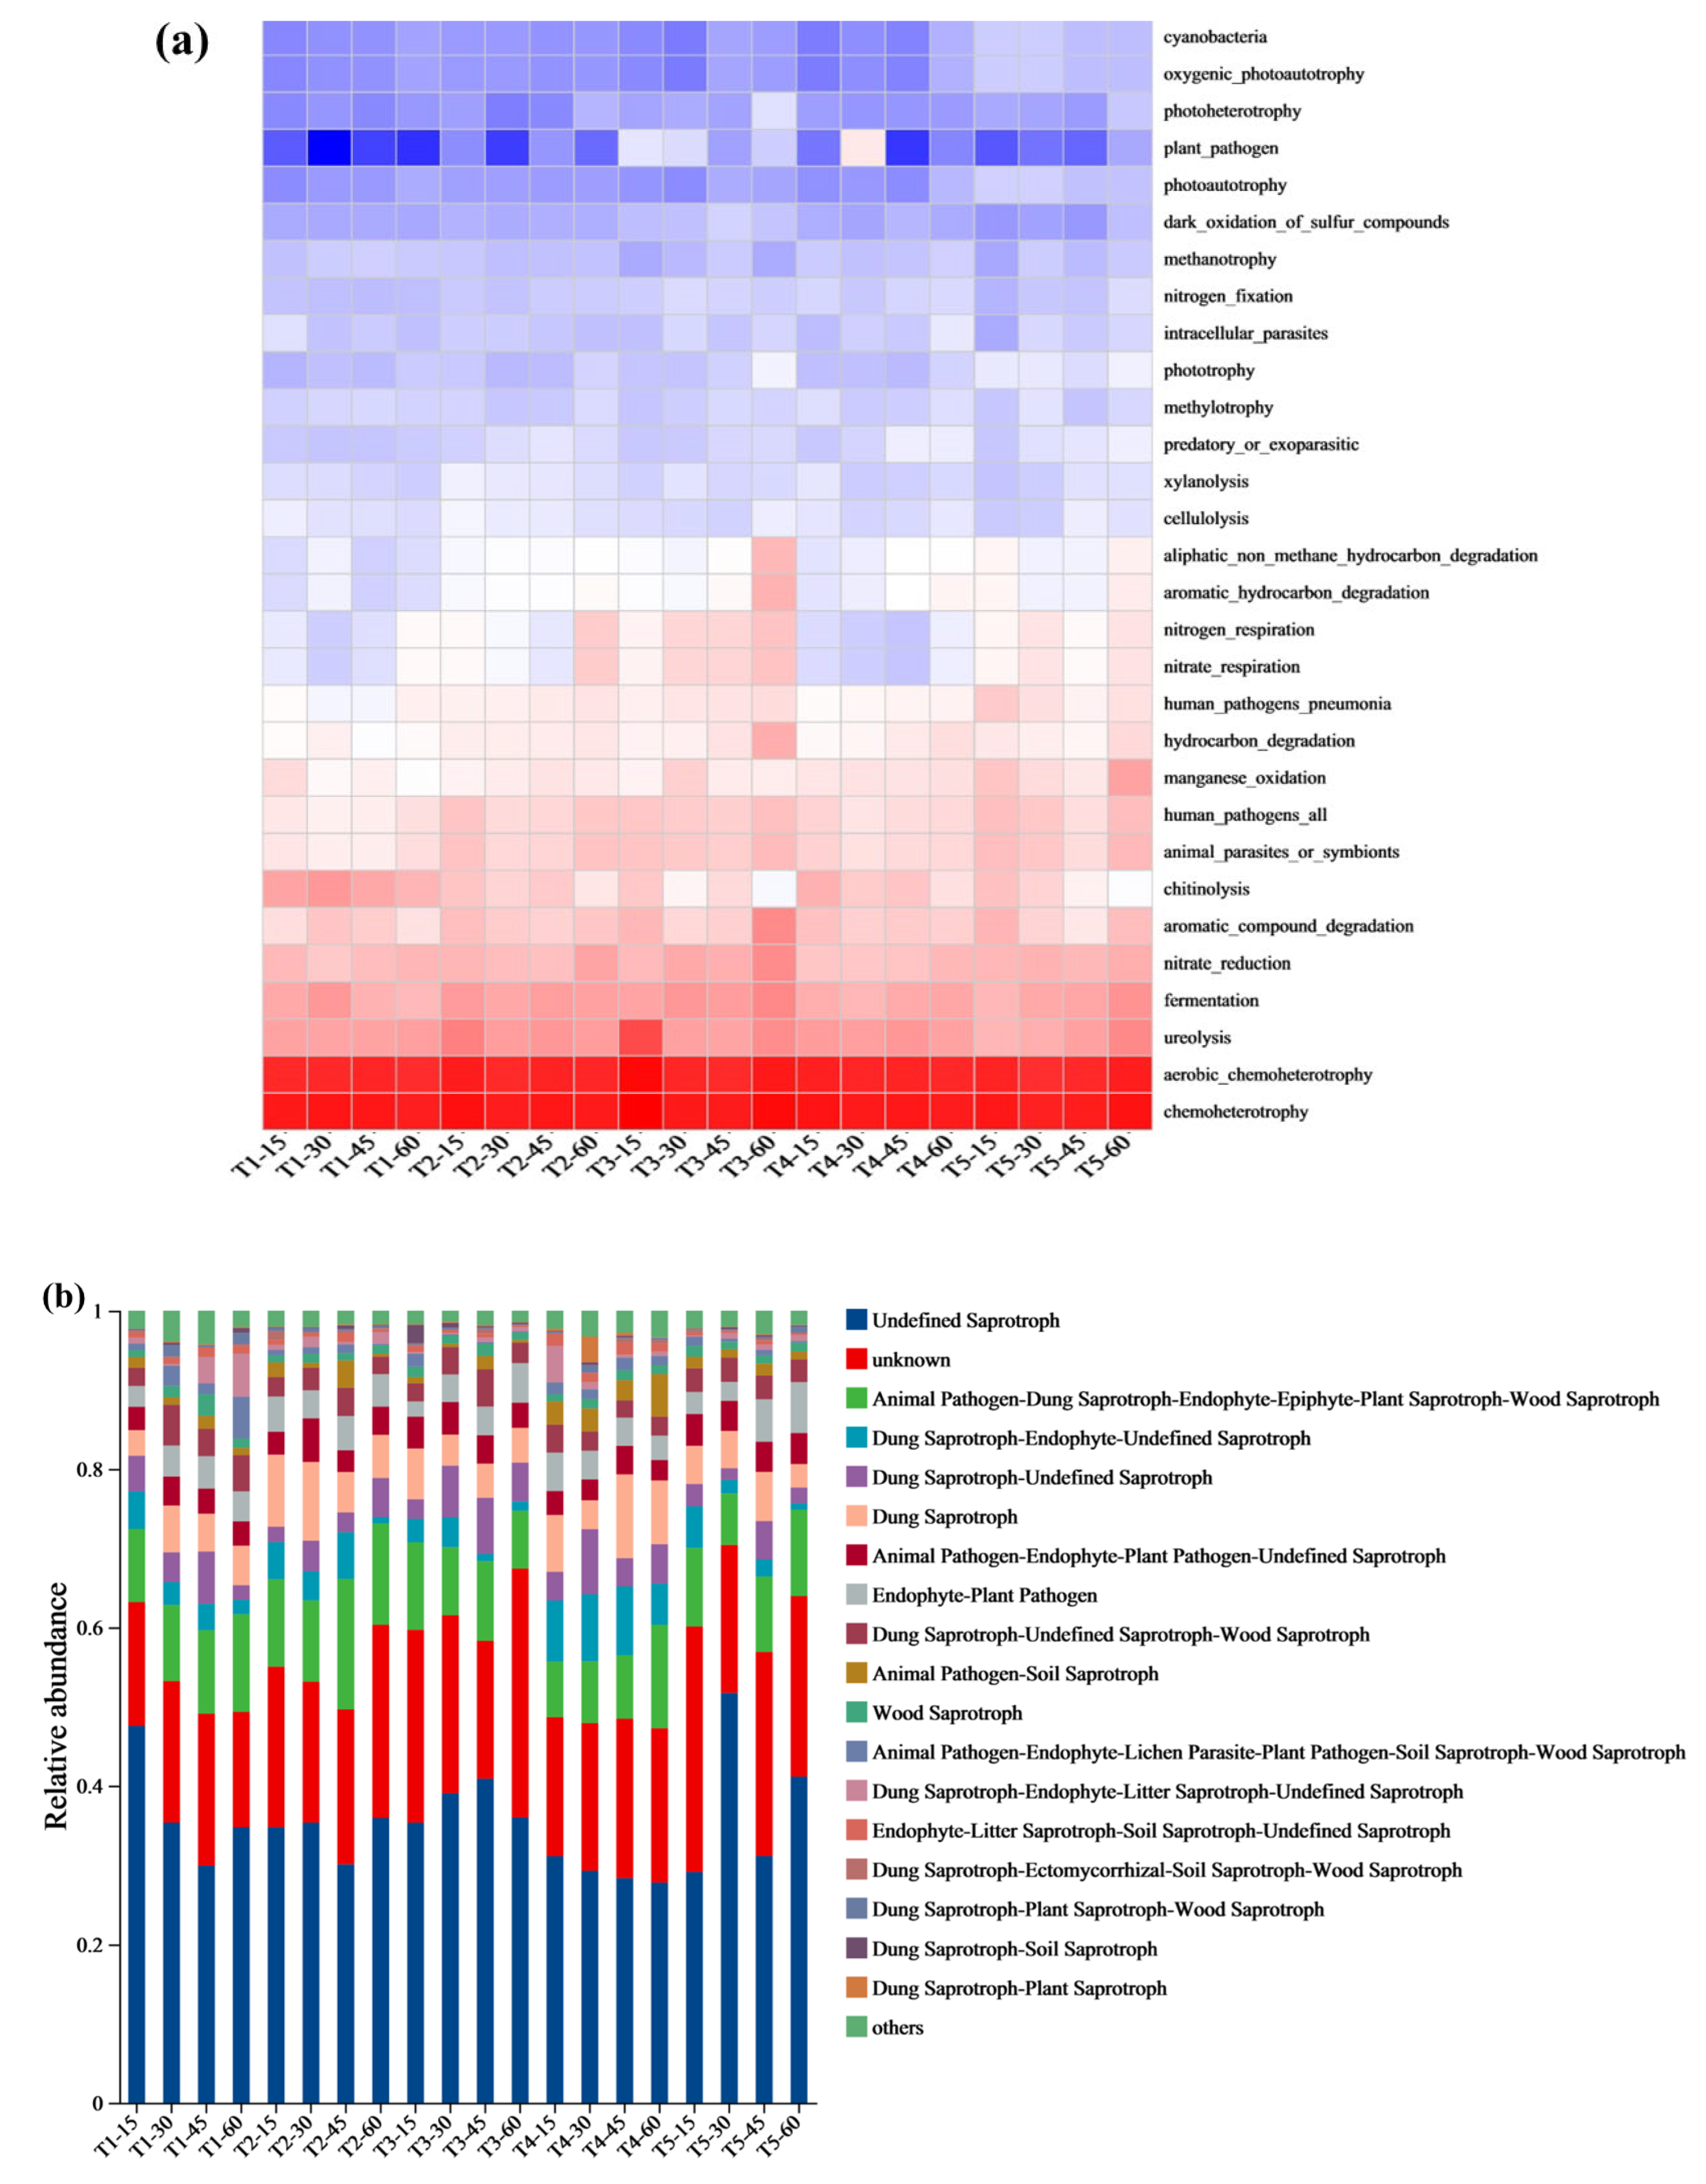
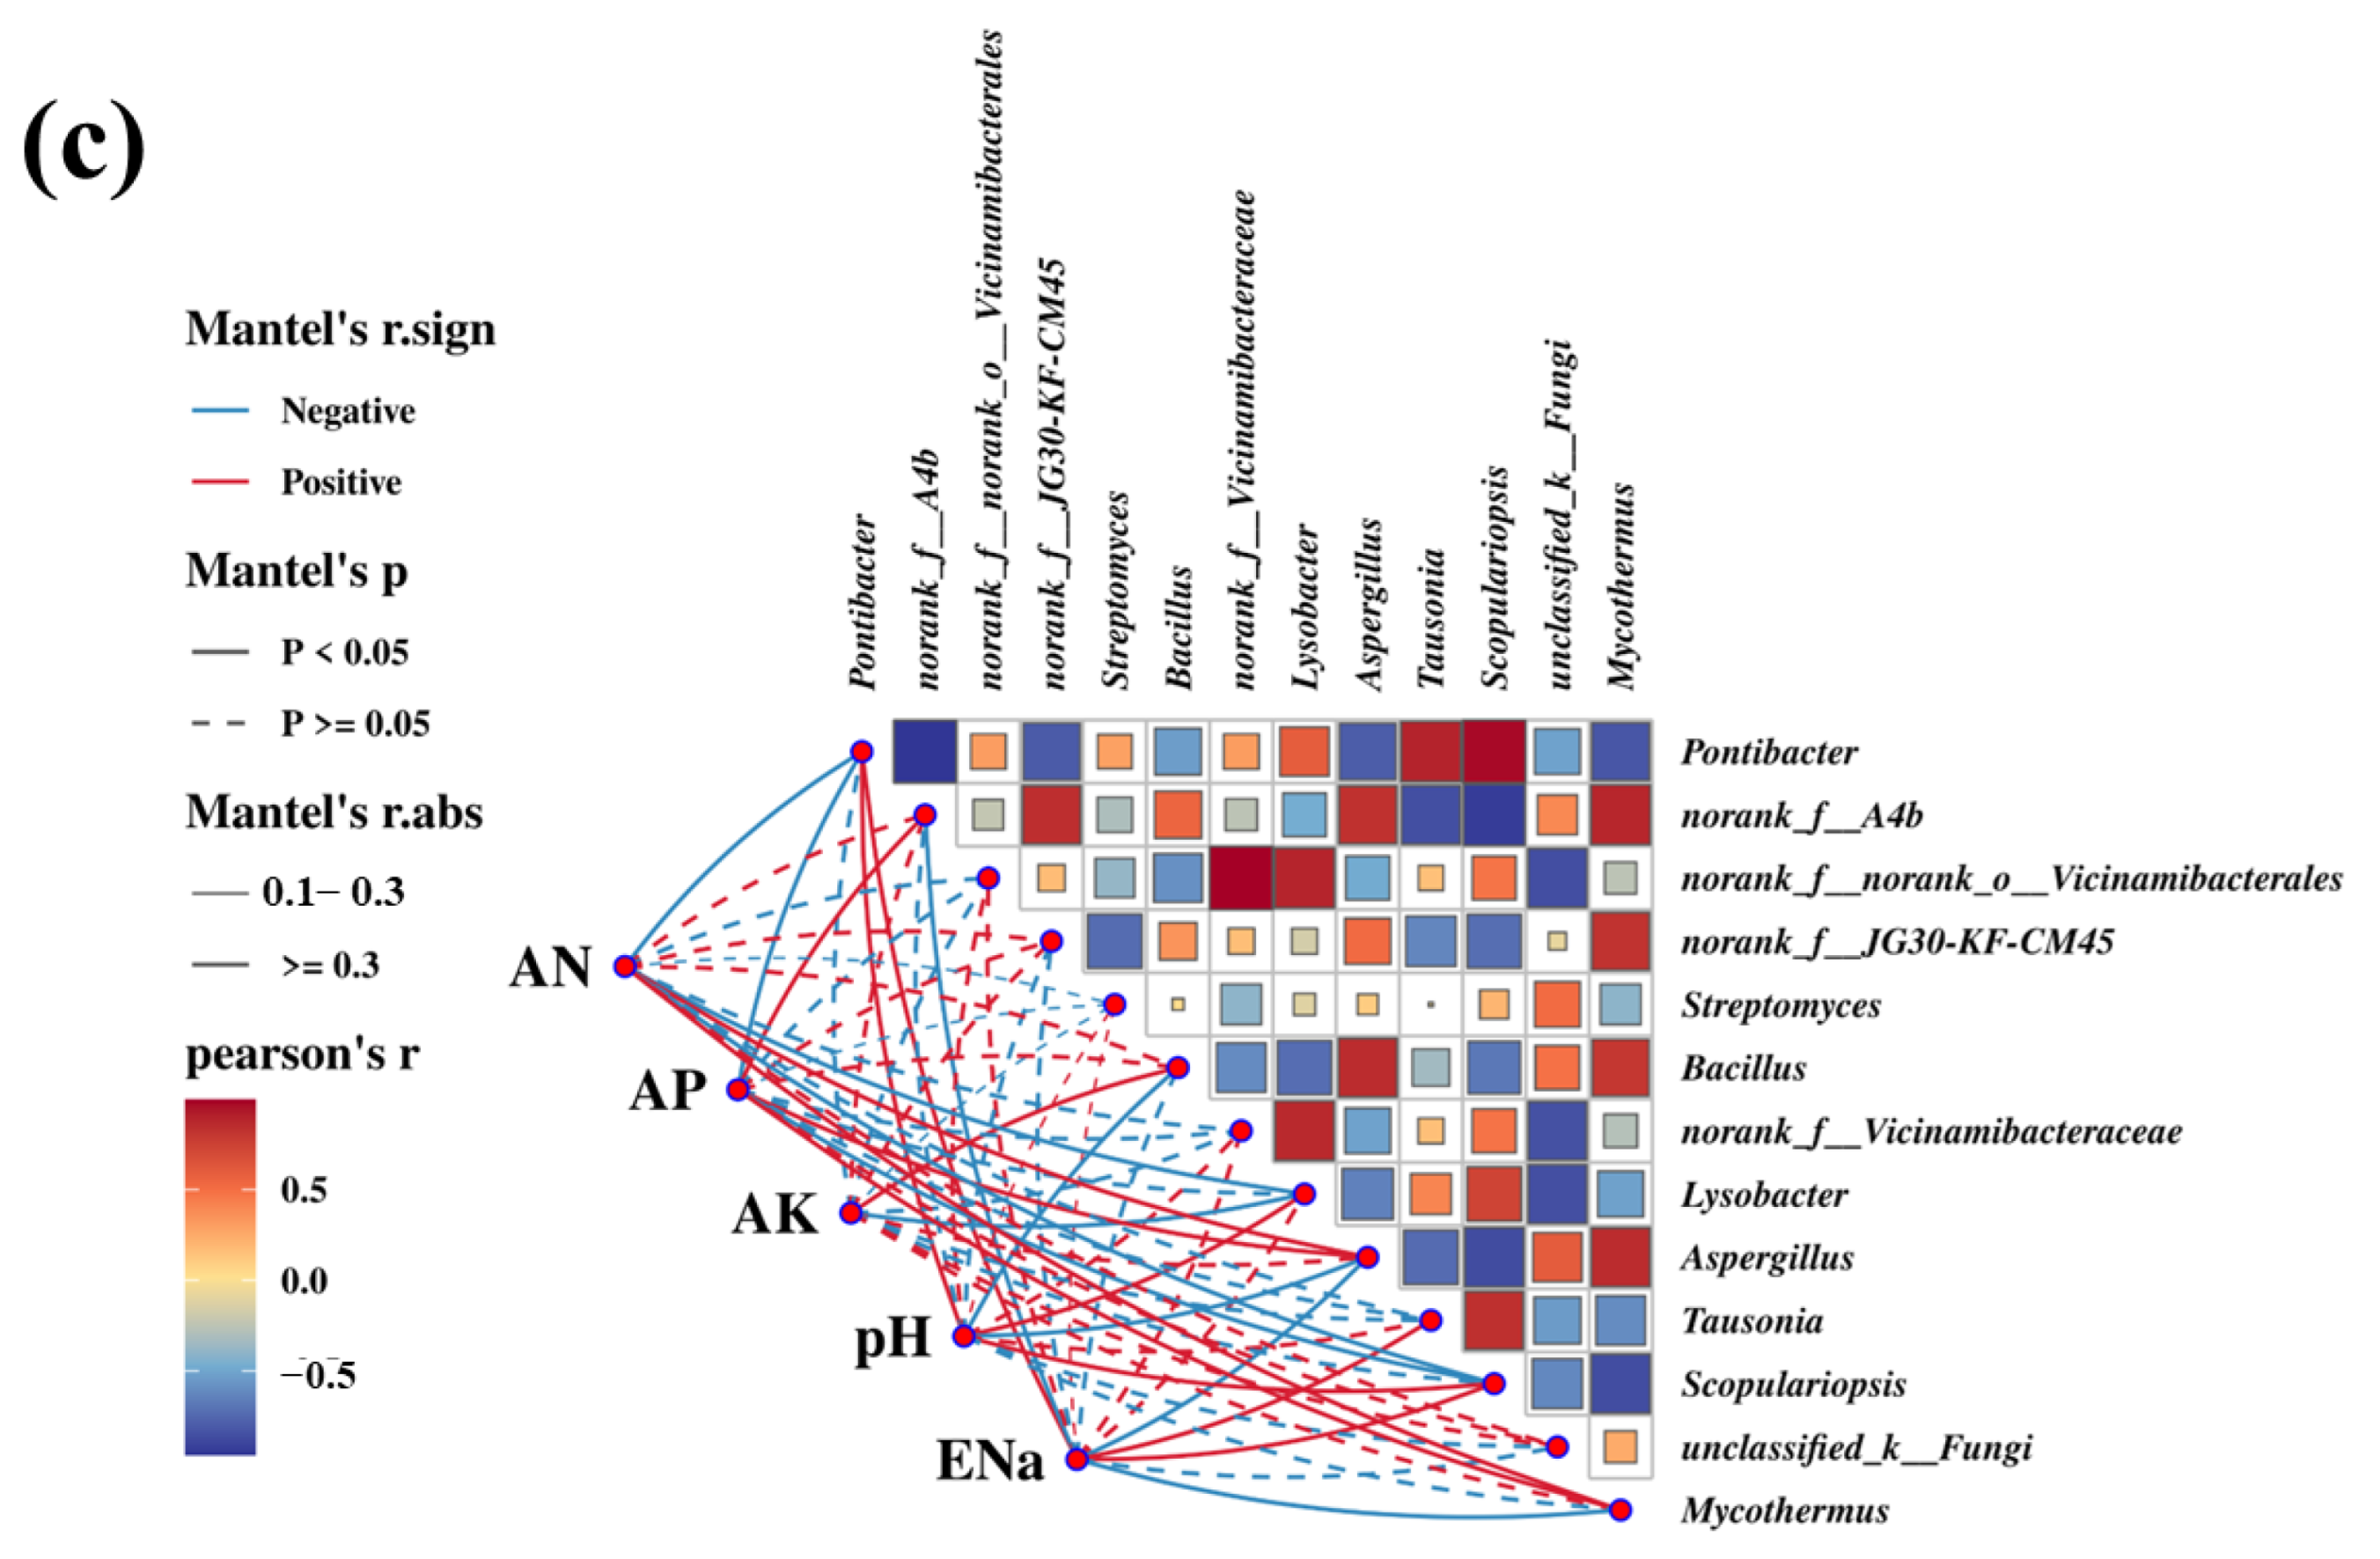
3.6. Microbial Composition Prediction and Correlation Analysis of Microbial Community Function

Using the FAPROTAX model, the functional prediction of the soil bacterial microbiota (Figure 7a) showed that the T2 treatment resulted in greater ureolysis activity than the T1 treatment at all the time points. On day 15, ureolysis in the T3 treatment was significantly (p < 0.05) higher than in the T2 treatment, and by day 60, the T5 treatment showed the highest ureolysis activity. The T2, T3, and T5 treatments exhibited higher nitrate-reduction activity than the T1 treatment, while the T3 and T5 treatments outperformed the T2 treatment. For the degradation of aromatic hydrocarbons, aliphatic compounds, and hydrocarbons, the application of earthworms, BS, and BSC effectively reduced the negative impact of these compounds. Using the FUNGuild model (Figure 7b), the functional prediction of fungal communities revealed that the T5 treatment had the highest relative abundance of saprotrophs on days 30 and 60, and the T3 treatment had the highest relative abundance on day 45. The T2 treatment exhibited higher dung saprotroph abundance and lower animal pathogen abundance in comparison to the T1 treatment.
The correlation analysis of the microbial genera and soil properties (Figure 7c) revealed strong positive correlations among Bacillus, Mycothermus, Vicinamibacterales, and Aspergillus. AN was positively correlated with Mycothermus and Aspergillus, whereas AP was correlated with Mycothermus, Aspergillus, and A4b. AK was positively correlated with Bacillus, and pH was positively correlated with Scopulariopsis, Lysobacter, and Pontibacter. ENa was positively correlated with Scopulariopsis, Tausonia, and Pontibacter (p < 0.05, r > 0.03).

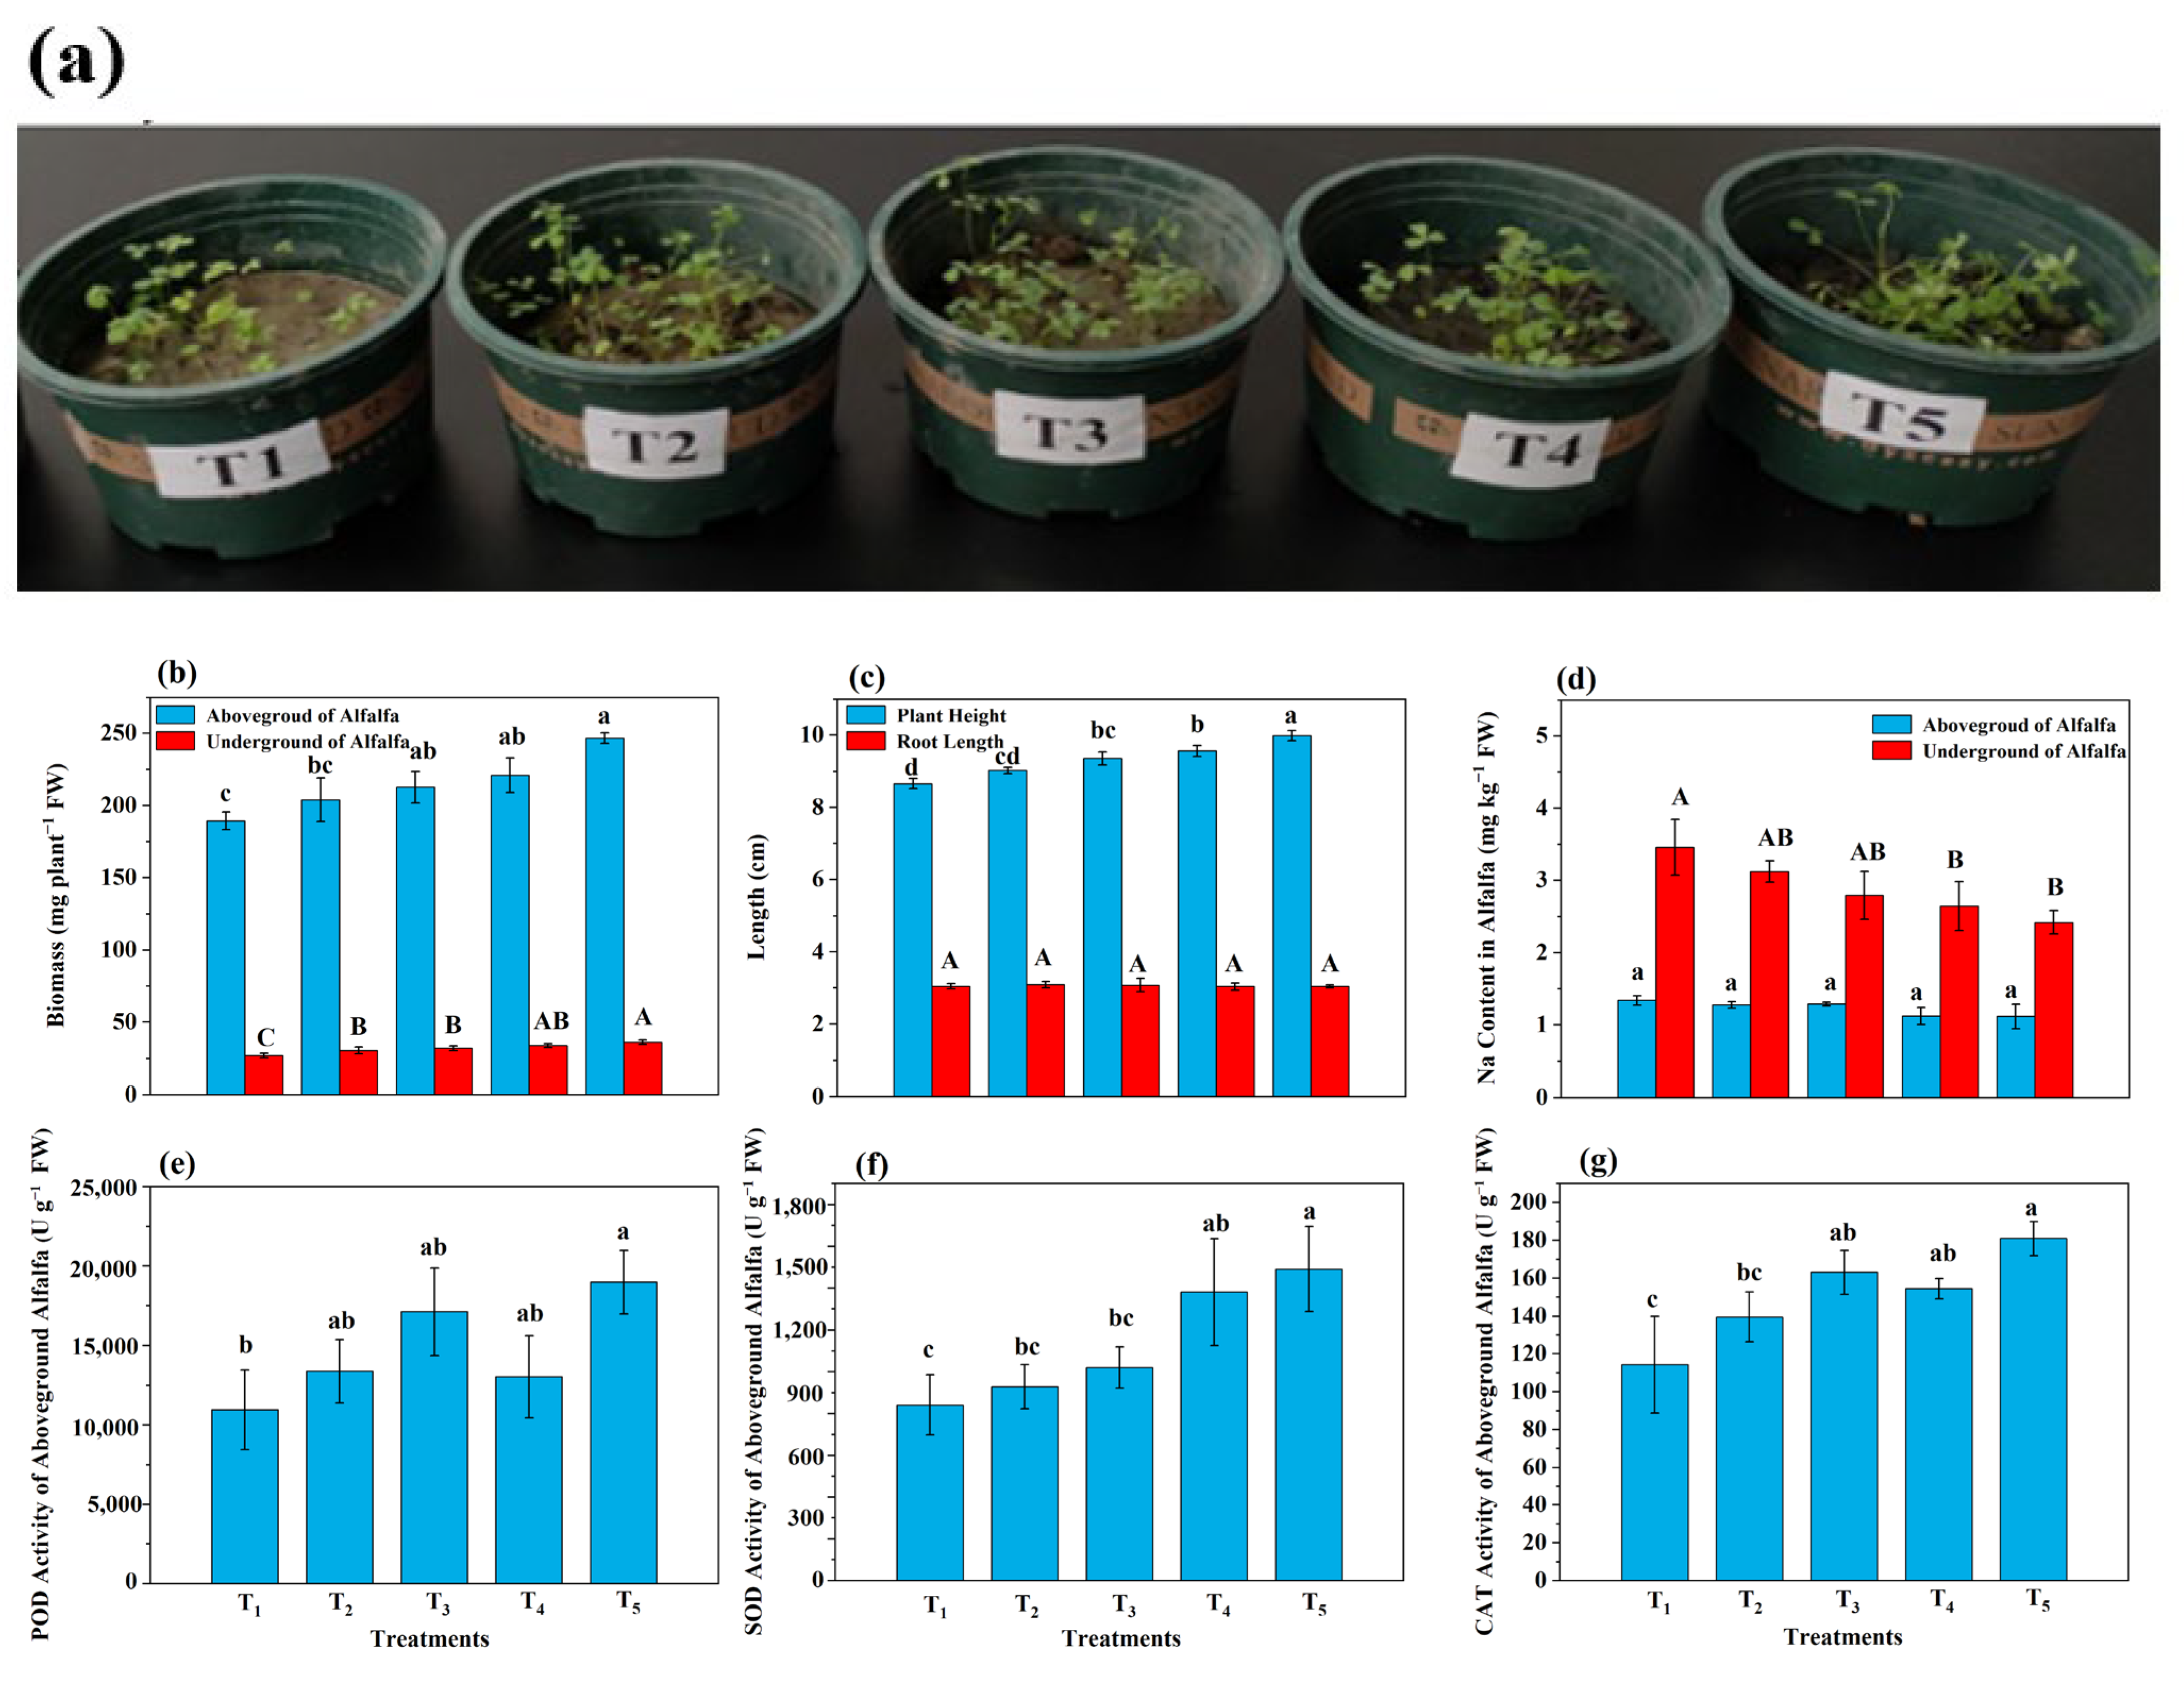
3.7. Growth and Resistance of Alfalfa

The morphology of the different alfalfa treatments after 30 days of growth is shown in Figure 8a. Compared to the T1 treatment, the T3, T4, and T5 treatments significantly (p < 0.05) increased the aboveground and underground biomass of alfalfa (Figure 8b), with the order of improvement degree following T5 > T4 > T3 > T2 > T1. Compared to the T1 treatment, the T5 treatment had the greatest improvement on aboveground and underground biomass, reaching 247 mg plant−1 and 36.2 mg plant−1, with an increase of 30.2% and 34.1%, respectively. Compared to the T1 treatment, T2, T3, T4, and T5 significantly (p < 0.05) increased the plant height of alfalfa, following the order of T5 > T4 > T3 > T2 > T1. Significant (p < 0.05) differences in plant height were observed between all the treatments, but no significant differences were observed in root length. The T5 treatment resulted in the greatest plant height, reaching 9.99 cm, whereas the T2 treatment resulted in the greatest root length, reaching 3.09 cm (Figure 8c). Compared to the T1 treatment, the T3, T4, and T5 treatments significantly (p < 0.05) reduced the sodium content in both the underground and aboveground portions of the alfalfa (Figure 8d). The aboveground alfalfa of the T5 treatment showed the greatest decline in the sodium content, with a decrease of 16.8% in comparison to T2. Compared to the T1 treatment, the T3 and T5 treatments significantly increased (p < 0.05) the POD activity in the aboveground parts of the alfalfa (Figure 8e), with increases of 56.2% and 73.1%, respectively. The POD activity in the T5 treatment was significantly greater than that in the T1, T2, and T4 treatments. Compared to the T1 treatment, the T4 and T5 treatments significantly increased (p < 0.05) the SOD activity in the aboveground part of the alfalfa (Figure 8f), reaching 1381 and 1491 U g−1, respectively. Compared to the T1 treatment, the T2, T3, T4, and T5 treatments significantly (p < 0.05) increased the CAT activity in the aboveground part of the alfalfa. T3 and T5 presented the greatest increase, at 163 and 181 U g−1, respectively.

4. Discussion

4.1. Analysis of Salt Alkali Tolerance of Free B. subtilis and Characterization of BSC

The salt and alkali tolerance tests for free-living B. subtilis showed that it was able to survive at environmental pH levels ranging from 7 to 9.5, with the highest activity observed at pH 7. It also survived NaCl concentrations of 1–6%, with activity decreasing as the NaCl concentration increased. The tubular structures of the biochar had diameters of approximately 5–10 μm, much larger than the size of the B. subtilis cells. Its porous structure and surface wrinkles provided a favorable environment for bacterial attachment and colonization. Sulfur- and nitrogen-containing compounds are known secondary metabolites of B. subtilis [45], and the elemental differences between BSC and BC further confirmed that B. subtilis was successfully loaded onto the biochar. Multiple samples of BSC were plated on LB agar to determine bacterial colony counts, indicating that the BSC concentration was 3.4 × 10⁹ CFU g−1. The loading of B. subtilis onto the biochar was efficient and uniform.

4.2. Analysis of Dynamic Changes in Soil Carbon Fractions

The maize straw and cow manure amendments supplied the soil with ample organic carbon. After 60 days of incubation, the earthworm—BSC treatment exhibited the highest degradation rates of organic carbon from straw and manure. DOC, a labile form of organic carbon, is readily utilized by soil microbes, providing essential nutrients and playing a crucial role in nutrient cycling [41]. The results indicated that straw and manure initially supplied ample DOC, but the introduction of earthworms reduced the DOC level. The application of exogenous BS further reduced the ability of the original microorganisms to utilize DOC. T4 resulted in the greatest reduction in DOC, suggesting that biochar enhanced the microbial DOC utilization efficiency. Introducing BSC and earthworms retained more DOC than BC and earthworms, preserving more available carbon for both soil microbes and plants.
POC is essential for maintaining soil structure and water-holding capacity [46]. The application of BC and BSC improved the POC level, whereas the addition of earthworms and BS led to a decrease in the POC content during the later incubation stages. Both BC and BSC enhanced the soil stability, with no significant differences between them. ROC, a highly reactive form of organic carbon, reflects early soil condition changes, serves as a primary nutrient source for plants, and plays a key role in stabilizing the soil organic carbon pool [46]. The results showed that the application of earthworms combined with BS did not significantly affect the soil organic carbon oxidation level, whereas the application of earthworms combined with BC and BSC increased the amount of plant-available organic carbon.
FA is crucial for promoting mineral decomposition and nutrient release. It has strong ion exchange and complexing abilities, enhancing soil water retention and nutrient availability. FA can transform into HA through humification [47]. HA contributes to soil fertility and plant growth, has high stability, and is a key component of soil organic matter, playing an important role in stabilizing the soil carbon pool [48]. The application of BC increased the HA content while reducing FA formation. The application of earthworms combined with BSC accelerated SOC decomposition from maize straw and manure, increasing the POC content and promoting carbon conversion into HA, thus stabilizing the soil carbon pool. This finding indicated that earthworms combined with BSC accelerated the decomposition of straw and cow manure, stabilized the soil carbon pool, and provided more available carbon for soil microorganisms and plants.

4.3. Analysis of Key Soil Enzymes, Available Nutrients, and Elimination of Salt–Alkali Barriers

β-glucosidase, a part of the cellulase degradation system, plays a key role in cellulose breakdown [49]. The application of earthworms combined with BS, BC, and BSC accelerated cellulose degradation in maize straw and manure, supplying energy for microbial activities. Earthworms combined with BSC most effectively accelerated cellulose decomposition in mixed maize straw and cow manure, generating organic carbon accessible to microbes and plants. Invertase hydrolyzed the sucrose in the soil, producing glucose and fructose [50]. Earthworms combined with BC increased the monosaccharide conversion rate, whereas BS reduced it, suggesting that earthworms combined with BC enhanced the microbial energy supply and soil metabolic activity. Urease catalyzed urea hydrolysis, generating bioavailable ammonium [51]. The application of earthworms combined with BS, BC, and BSC increased ammonium conversion rates under conventional organic amendment conditions, with the BSC combination exhibiting the highest rate. The findings demonstrated that the application of earthworms combined with BSC can effectively enhance soil nitrogen availability.
Soil AN, AP, and AK are essential plant-available nutrients that support normal growth and development [52]. The individual addition of earthworms significantly increased the AP and AN; conversely, when the earthworms were combined with BS and BC, the AK and AN increased. The combined effect of earthworms and BSC exhibited synergy, which was consistent with findings of Wu et al. [53]. However, earthworms combined with BS, BC, and BSC had no significant effect on available phosphorus levels. The application of BC supplies energy for carbon and nitrogen enzyme activities in soil [54]. Earthworms combined with BSC produced more nitrogen and phosphorus than earthworms combined with BC, providing more nutrients for the growth of plants.
The addition of earthworms effectively reduced the soil pH and concentrations of ( CO 3 2 + HCO 3 ), ENa, and ESP, whereas the combined application of BS decreased the soil pH and concentrations of EC, and ( CO 3 2 + HCO 3 ). BC reduced the pH, ( CO 3 2 + HCO 3 ) concentration and ESP, but the EC and ENa increased. The combination of earthworms and BSC was the most effective at alleviating soil salinity and alkalinity. The application of earthworms combined with BS enriched soil beneficial cations, while the addition of earthworms and BC and BSC significantly increased soil CEC, thereby reducing ESP. Compared to application of BC, the combination of earthworms and BSC showed superior effects on mitigating soil salinity and alkalinity.
The addition of earthworms combined with BC and BSC promoted the formation of HA and FA. The adsorption of Na+ on the surface of humic colloids, which contain numerous negatively charged sites, reduced ENa [55,56]. Amini et al. [57] and Wu et al. [58] reported that the application of organic materials reduced the ENa content, which was associated with the formation of macro-aggregates. Earthworms improved flocculation between soil particles, facilitating the formation of macro-aggregates and reducing capillarity [59,60]. A greater proportion of macro-aggregates was attributed to the dominance of Ca2+ over Na+ at clay exchange sites [61]. This ionic exchange enhances soil aggregation by promoting stronger bonds between soil particles, improving the soil structure and stability. The findings might explain the lower CEC values observed in the T5 treatment and the reduced ESP value in the earthworm and BSC treatment.
As shown in Figure 9, SOC, ROC, HA, POC, AN, AK, β-glucosidase, and urease were negatively correlated with pH and ESP. SOC, HA, POC, AN, AK, β-glucosidase, and urease showed a highly significant negative correlation with pH (p < 0.01), while AK, β-glucosidase, and urease showed a significant negative correlation with ESP (p < 0.01). Therefore, among the indicators measured in this study, AK, β-glucosidase, and urease significantly reduced the main soil salinity indicators, thereby improving the soil quality.

4.4. The Analysis of the Diversity, Composition, and Functional Prediction of the Microbial Community

Bacterial diversity was inversely correlated with DOC (Figure 3b), suggesting that bacterial growth depleted DOC. SOC decomposition was likely driven by increased bacterial diversity (Figure 3a), while the reduction in soil salinity and alkalinity was associated with enhanced diversity (Table 1). Fungal α-diversity responded differently to the treatments across the time points. Compared with conventional organic improvement, the introduction of earthworms increased the alpha diversity of the soil bacterial and fungal communities. Earthworms combined with BC and BSC reduced the fungal α-diversity in the early stages, but the differences diminished by day 30. The T5 treatment resulted in the highest Ace value during the later incubation stages. In contrast, BS reduced the Ace value, likely due to the invasive effects of exogenous species [62]. However, loading BS onto BC mitigated its negative effects on microbial diversity, enabling the decomposition of straw and cow manure in soil. Although the Chao1, Shannon, and Ace indices varied slightly, the trends were overall consistent.
The relative abundance and function of the bacterial communities varied across treatments and time points. Firmicutes enhanced soil health [63], whereas Basidiomycota served as an indicator of effective land use for soil carbon accumulation and functionality [64]. The LefSe analysis of microbial communities after 60 days of incubation (Figure 6a) revealed that the T2 treatment influenced Desulfobacterota. The T5 treatment affected Firmicutes and significantly increased the relative abundance of Bacillus, Solibacillus, and Romboutsia. The results demonstrated that earthworms combined with BSC increased the relative abundance of these beneficial microorganisms, whereas the addition of earthworms alone did not result in corresponding changes in these microorganisms. The application of earthworms combined with BSC improved the soil microbial community structure more effectively and demonstrated that loading onto biochar was beneficial for the survival of B. subtilis in soda saline–alkali soil. Although the application of earthworms combined with BS and BSC altered the bacterial community structures at the phylum level, the changes in fungal communities were less pronounced. When the LDA value was set to 2.0, only fungi_cls_Incertac_sedis was affected by T5. Streptomyces provides organic nitrogen and phosphorus directly to plants [65]. The treatments with BS increased the relative abundance of Streptomyces, possibly contributing to increased soil nutrient availability (Figure 3d–f). Gemmatimonadaceae, known for its phosphate-solubilizing properties and crop resistance enhancement [66], presented a greater relative abundance in T2 than in T1 at all the time points, explaining the increase in available phosphorus in T2 (Figure 4d). This finding might also explain why the addition of earthworms increases the available phosphorus content in the soil. Saccharopolyspora produces insecticidal compounds, such as spinosad, which degrade rapidly in the environment and contribute to the breakdown of carbon and nitrogen. Rhizobiaceae demonstrates nitrification ability [67], with higher relative abundances found in the T2, T3, T4, and T5 treatments compared to the T1 treatment, which could explain the increased nitrification and available nitrogen (Figure 4d). Earthworms combined with BSC could increase the soil available nitrogen.
Fungal communities varied across the treatments and the time points. Mycothermus promotes plant growth by increasing the uptake of nitrogen, phosphorus, and potassium [68]. The relative abundance of Mycothermus in T2 was significantly greater (p < 0.05) than in T1. On day 30, the relative abundance of Aspergillus was highest in the T3 and T5 treatments, suggesting that earthworms combined with BS and BSC enhanced the activity of Aspergillus, a fungus involved in organic matter mineralization and humification [69]. This might explain the rapid decrease in SOC and the increase in HA formation in the T5 and T3 treatments in comparison to the T1 and T2 treatments (Figure 3a,f). Thelebolus produces hydrolytic and oxidative enzymes that decompose organic matter, participate in nutrient cycling, and influence soil physicochemical properties and enzyme activities [70]. Compared to the T1 treatment, the T2 treatment was more positively correlated with nitrogen respiration at all stages. The T3 and T5 treatments were more positively correlated with nitrogen respiration in comparison to the T1 treatment (Figure 7a), indicating that the addition of earthworms accelerated nitrogen decomposition; the addition of BS and BSC further enhanced this effect. The application of earthworms combined with BSC resulted in greater ureolysis activity during the later stages of incubation, which might explain the differences in urease activity (Figure 4d) and available nitrogen (Figure 4e) among the treatments. The results indicated that the combination of earthworms and BSC improved the microbial community structure of the soda saline–alkali soil, increased the abundance of beneficial microorganisms, and contributed to disease suppression and soil health.
The application of earthworms accelerated SOC decomposition, and the addition of BC further enhanced this process, likely due to increases in soil nutrients and enzyme activities (Figure 3a and Figure 4a–f). Zopfiella, an important soil health indicator, was more abundant in the T2, T4, and T5 treatments than in the T1 treatment, suggesting that the application of earthworms combined with BC and BSC could improve soil health conditions. The application of earthworms combined with BS and BSC altered the microbial community structures, increased the abundance of beneficial fungi and bacteria, and promoted organic matter decomposition (Figure 5d). These changes might increase soil enzyme activity and nutrient availability (Figure 4), alleviating soil salinity and alkalinity (Table 1).

4.5. Analysis of Alfalfa Growth

The combination of earthworms and BSC resulted in the greatest improvement in the aboveground and belowground biomass of alfalfa, with significant reductions in the Na content of both. POD, SOD, and CAT are key antioxidant enzymes, and an increase in activity indicates improved plant stress resistance [71]. The aboveground alfalfa POD, SOD, and CAT activities in the T5 treatment were significantly greater than those in the T1 and T2 treatments. The findings demonstrated that the application of earthworms alone did not significantly improve the aboveground alfalfa POD and SOD activities, whereas when earthworms were combined with BSC, the activities of all three antioxidant enzymes significantly increased. The application of earthworms combined with BS, BC, and BSC effectively alleviated sodium stress in alfalfa, likely through reduced soil ENa and increased CEC. The increase in alfalfa biomass and length in the aboveground and belowground parts might be attributed to increased soil nutrient levels, the partial mitigation of salinity and alkalinity, the increased abundance of resistance-related microbes, and reduced sodium stress. These factors collectively improved alfalfa resistance, leading to increased biomass. The application of earthworms combined with BC and BS had beneficial effects on alfalfa growth, but the three antioxidant enzymes exhibited varying activity trends across the T1, T2, T3, and T4 treatments. The combination of earthworms and BSC promoted optimal alfalfa growth, resulting in the greatest improvement in biomass.

5. Conclusions

The results of the present study demonstrated that the application of earthworms was beneficial to the improvement of soda saline–alkali soil, with the B. subtilis-loaded biochar most effectively alleviating soda saline–alkali stress. At the end of the incubation period, the T5 treatment showed the greatest reductions in pH, ESP, and ( CO 3 2 + HCO 3 ) content, decreasing by 0.24 units, 3.16%, and 120 mg kg−1, respectively. The content of soil humic acid, available potassium, available nitrogen, β-glucosidase activity, and urease activity were highest in the T5 treatment, increasing by 33.5%, 70.1%, 26.1%, 19.1%, and 17.89%, respectively. After 60 days of incubation, microbial sequencing revealed that the relative abundance of Bacillus peaked at 3.22% in the T5 treatment. The application of BSC maintained a high relative abundance of Bacillus and extended its survival time. The aboveground and belowground alfalfa biomass in the T5 treatment increased by 30.16% and 34.1%, respectively. The POD, SOD, and CAT activities in the T5 treatment of the aboveground alfalfa increased significantly by 73.1%, 77.3%, and 58.8%, respectively. The results indicated that the combination of earthworms and Bacillus subtilis-loaded biochar has a strong potential for ameliorating soda saline–alkali soil. The findings of this study demonstrate that the preparation method for B. subtilis-loaded biochar is straightforward, yet effective. Both soil incubation experiments and pot trials conducted on soda saline–alkali soil have yielded promising improvement results. Future research should focus on scaling up these experiments to field-level applications. Additionally, this study highlights the need to investigate (1) the synergistic coexistence of B. subtilis with other beneficial microorganisms and (2) the potential enhancement of saline–alkali soil remediation efficacy. A promising direction would be to develop biochar composites loaded with multiple beneficial microorganisms, which could potentially achieve more comprehensive and efficient saline–alkali soil rehabilitation.

Supplementary Materials

The following supporting information can be downloaded at https://www.mdpi.com/article/10.3390/microorganisms13061243/s1. Table S1. Mapping software. Table S2. Initial carbon component content of soil. Table S3. Initial key enzyme activity in soil. Figure S1. Phylogenetic tree of BH-8 strain based on 16S rDNA analysis system.

Author Contributions

Z.L. (Zhichen Liu): Methodology, Investigation, Data Curation, and Writing—Original Draft, Review, and Editing. Y.H.: Conceptualization, Methodology, and Funding Acquisition. Q.L.: Methodology, Investigation, and Data Curation. L.Z.: Investigation and Data Curation. Z.L. (Zhenke Liu): Methodology, Investigation, and Data Curation. Z.Z.: Writing—Review and Editing. Y.C.: Conceptualization, Methodology, Supervision, Funding Acquisition, Project Administration, and Writing—Original Draft, Review, and Editing. All authors have read and agreed to the published version of the manuscript.

Funding

This work was supported by the Strategic Priority Research Program of the Chinese Academy of Sciences (XDA28110201).

Institutional Review Board Statement

Not applicable.

Informed Consent Statement

Informed consent was obtained from all subjects involved in the study.

Data Availability Statement

The original contributions presented in this study are included in the article/Supplementary Material. Further inquiries can be directed to the corresponding author.

Conflicts of Interest

The authors declare no conflicts of interest.

Abbreviations

The following abbreviations are used in this manuscript:
SOCsoil organic carbon
ROCreadily oxidizable organic carb
DOCdissolved organic carbon
HAhumic acid
FAfulvic acid
ESPExchangeable sodium saturation percentage
ENaExchange sodium s
POCparticulate organic carbon
CECcation exchange capacity
PODperoxidase
SODsuperoxide dismutase
CATcatalase
BCbiochar
BSBacillus subtilis
Eearthworm
BSCBacillus subtilis-loaded biochar
ANavailable nitrogen
APavailable phosphorus
AKavailable potassium

References

  1. Amundson, R.; Berhe, A.A.; Hopmans, J.W.; Olsen, C.; Sztein, E.A.; Sparks, D.L. Soil and human security in the 21st century. Science 2022, 348, 1261071. [Google Scholar] [CrossRef] [PubMed]
  2. Ren, J.; Xie, R.; Zhu, H.; Zhao, Y.; Zhang, Z. Comparative study on the abilities of different crack parameters to estimate the salinity of soda saline-alkali soil in Songnen Plain, China. Catena 2022, 213, 106221. [Google Scholar] [CrossRef]
  3. Lakhdar, A.; Rabhi, M.; Ghnaya, T.; Montemurro, F.; Jedidi, N.; Abdelly, C. Effectiveness of compost use in salt-affected soil. J. Hazard. Mater. 2009, 171, 29–37. [Google Scholar] [CrossRef]
  4. Zhang, Q.; Zhou, W.; Liang, G.; Sun, J.; Wang, X.; He, P. Distribution of soil nutrients, extracellular enzyme activities and microbial communities across particle-size fractions in a long-term fertilizer experiment. Appl. Soil Ecol. 2015, 94, 59–71. [Google Scholar] [CrossRef]
  5. Shaaban, M.; Wu, Y.; Delgado, A.; Kuzyakov, Y.; Peng, Q.; Lin, S.; Hu, R. Enzyme activities and organic matter mineralization in response to application of gypsum, manure and rice straw in saline and sodic soils. Environ. Res. 2023, 224, 115393. [Google Scholar] [CrossRef]
  6. Zhao, J.; Wang, X.; Zhuang, J.; Cong, Y.; Lu, Y.; Guo, M. Fine-crush straw returning enhances dry matter accumulation rate of maize seedlings in Northeast China. Agronomy 2021, 11, 1144. [Google Scholar] [CrossRef]
  7. Ouni, Y.; Ghnaya, T.; Montemurro, F.; Lakhdar, A. The role of humic substances in mitigating the harmful effects of soil salinity and improve plant productivity. Int. J. Plant Prod. 2014, 8, 353–374. [Google Scholar]
  8. Zhao, X.; Zhu, M.; Guo, X.; Wang, H.; Sui, B.; Zhao, L. Organic carbon content and humus composition after application aluminum sulfate and rice straw to soda saline-alkaline soil. Environ. Sci. Pollut. Res. 2019, 26, 13746–13754. [Google Scholar] [CrossRef] [PubMed]
  9. Wang, M.; Chu, S.; Wei, Q.; Tian, C.; Fang, Y.; Chen, G.; Zhang, S. Prediction of Salt-Tolerant Earthworms’ Cultivation Conditions Based on the Robust Artificial Intelligence Model. Sustainability 2023, 15, 6484. [Google Scholar] [CrossRef]
  10. Wu, Y.; Li, Y.; Zhang, Y.; Bi, Y.; Sun, Z. Responses of Saline Soil Properties and Cotton Growth to Different Organic Amendments. Pedosphere 2018, 28, 521–529. [Google Scholar] [CrossRef]
  11. Zhang, W.; Cao, J.; Zhang, S.; Wang, C. Effect of earthworms and arbuscular mycorrhizal fungi on the microbial community and maize growth under salt stress. Appl. Soil Ecol. 2016, 107, 214–223. [Google Scholar] [CrossRef]
  12. Huang, J.; Ma, K.; Xia, X.; Gao, K.; Lu, Y. Biochar and magnetite promote methanogenesis during anaerobic decomposition of rice straw. Soil Biol. Biochem. 2020, 43, 107740. [Google Scholar] [CrossRef]
  13. Yao, Y.; Zhou, W.; Sun, J.; Liang, G.; Liu, G.; Sun, G.; Yuan, F. Effects of different straw-decomposition inoculants on increasing the activities of extracellular enzymes and decomposition of rice straw buried into soil. J. Plant Nutr. Fertil. 2020, 26, 2070–2080. [Google Scholar]
  14. Qiu, Z.; Paungfoo, L.C.; Ye, J.; Garcia, A.G.; Petersen, I.; Di, B.L.; Hobbs, R.; Ibanez, M.; Heenan, M.; Wang, W.; et al. Biofertilizers can enhance nitrogen use efficiency of sugarcane. Environ. Microbiol. 2022, 24, 3655–3671. [Google Scholar] [CrossRef] [PubMed]
  15. Ivan, S.; Ebrahem, M.; Mostafa, A.; Mohamed, H.; Hanan, E.; Pankaj, K.; Bashir, A.; Sami, A.; Boro, M.; Madhumita, G.; et al. Combined Use of Spent Mushroom Substrate Biochar and PGPR Improves Growth, Yield, and Biochemical Response of Cauliflower (Brassica oleracea var. botrytis): A Preliminary Study on Greenhouse Cultivation. Horticulture 2022, 8, 830. [Google Scholar]
  16. Lin, S.; Wang, W.; Penuelas, J.; Sardans, J.; Martinez, M.; Su, C.; Xu, X.; Singh, B.; Fang, Y. Combined slag and biochar amendments to subtropical paddy soils lead to a short-term change of bacteria community structure and rise of soil organic carbon. Appl. Soil Ecol. 2022, 179, 104593. [Google Scholar] [CrossRef]
  17. Malik, L.; Sanaullah, M.; Mahmood, F.; Hussain, S.; Siddique, M.H.; Anwar, F.; Shahzad, F. Unlocking the potential of co-applied biochar and plant growth-promoting rhizobacteria (PGPR) for sustainable agriculture under stress conditions. Chem. Biol. Technol. Agric. 2022, 9, 58. [Google Scholar] [CrossRef]
  18. Wang, Z.; Tan, W.; Yang, D.; Zhang, K.; Zhao, L.; Xie, Z.; Xu, T.; Zhao, Y.; Wang, X.; Pan, X.; et al. Mitigation of soil salinization and alkalization by bacterium-induced inhibition of evaporation and salt crystallization. Sci. Total Environ. 2021, 755, 142511. [Google Scholar] [CrossRef]
  19. Zou, M.; Yu, K.; Liu, H.; Sheng, Q.; Zhang, Y. Effects of Bacillus subtilis on Rose Growth Promotion and Rhizosphere Microbial Community Changes Under Saline–Alkaline Stress. Agronomy 2024, 14, 730. [Google Scholar] [CrossRef]
  20. Xiao, J.; Cao, M.; Lai, K.; Sun, K.; Zhang, L.; Gao, P.; Zhang, Y.; Yan, B.; Guo, L. Unveiling key metabolic pathways in Bacillus subtilis-mediated salt tolerance enhancement in Glycyrrhiza uralensis Fisch. through multi-omics analysis. Environ. Exp. Bot. 2024, 219, 105631. [Google Scholar] [CrossRef]
  21. Wu, C.; Zhi, D.; Yao, B.; Yang, Y.; Zhou, Y. Immobilization of microbes on biochar for water and soil remediation: A review. Environ. Res. 2022, 212, 113226. [Google Scholar] [CrossRef] [PubMed]
  22. Liu, M.; Tan, X.; Zheng, M.; Yu, D.; Lin, A.; Liu, J.; Wang, C.; Gao, Z.; Cui, J. Modified biochar/humic substance/fertiliser compound soil conditioner for highly efficient improvement of soil fertility and heavy metals remediation in acidic soils. J. Environ. Manag. 2023, 325, 116614. [Google Scholar] [CrossRef] [PubMed]
  23. Bi, W.; Sun, Y.; Yao, Z.; Zhao, Z.; Niu, Y. Bacillus halophilus BH-8 Combined with Coal Gangue as a Composite Microbial Agent for the Rehabilitation of Saline-Alkali Land. Microorganisms 2025, 13, 532. [Google Scholar] [CrossRef]
  24. Yu, J.; Guo, H.; Han, S.; Chang, J.-S.; Lee, D.-J. Enhanced Remediation of Salt-Affected Petroleum-Contaminated Soil by Modified Biochar Loaded with Acinetobacter Bacteria. SSRN, 2023. Available online: https://ssrn.com/abstract=4605927 (accessed on 4 March 2025). [CrossRef]
  25. Liu, Q.; Wang, Y.; Sun, S.; Tang, F.; Chen, H.; Zhao, C.; Li, L. A novel chitosan-biochar immobilized microorganism strategy to enhance bioremediation of crude oil in soil. Chemosphere 2023, 313, 137367. [Google Scholar] [CrossRef] [PubMed]
  26. Huang, K.; Hu, C.; Tan, Q.; Yu, M.; Shabala, S.; Yang, L.; Sun, X. Highly efficient removal of cadmium from aqueous solution by ammonium polyphosphate-modified biochar. Chemosphere 2022, 305, 135471. [Google Scholar] [CrossRef]
  27. Wang, X.; Riaz, M.; Babar, S.; Eldesouki, Z.; Liu, B.; Xia, H.; Li, Y.; Wang, J.; Xia, X.; Jiang, C. Alterations in the composition and metabolite profiles of the saline-alkali soil microbial community through biochar application. J. Environ. Manag. 2024, 352, 120033. [Google Scholar] [CrossRef]
  28. Zhao, W.; Zhou, Q.; Tian, Z.; Cui, Y.; Liang, Y.; Wang, H. Apply biochar to ameliorate soda saline-alkali land, improve soil function and increase corn nutrient availability in the Songnen Plain. Sci. Total Environ. 2020, 722, 137428. [Google Scholar] [CrossRef]
  29. Kim, H.-S.; Kim, K.-R.; Yang, J.E.; Ok, Y.S.; Owens, G.; Nehls, T.; Wessolek, G.; Kim, K.-H. Effect of biochar on reclaimed tidal land soil properties and maize (Zea mays L.) response. Chemosphere 2016, 142, 153–159. [Google Scholar] [CrossRef]
  30. Parkash, V.; Singh, S. Potential of biochar application to mitigate salinity stress in eggplant. Hortscience 2020, 55, 1946–1955. [Google Scholar] [CrossRef]
  31. Yan, Z.; Wang, Z.; Si, G.; Chen, G.; Feng, T.; Liu, C.; Chen, J. Bacteria-loaded biochar for the immobilization of cadmium in an alkaline-polluted soil. Environ. Sci. Pollut. Res. 2023, 31, 1941–1953. [Google Scholar] [CrossRef]
  32. Qi, X.; Gou, J.; Chen, X.; Xiao, S.; Ali, I.; Shang, R.; Wang, D.; Wu, Y.; Han, M.; Luo, X. Application of mixed bacteria-loaded biochar to enhance uranium and cadmium immobilization in a co-contaminated soil. J. Hazard. Mater. 2021, 401, 123823. [Google Scholar] [CrossRef] [PubMed]
  33. Chen, Y.; Chang, S.; Chen, J.; Zhang, Q.; Yu, H. Characterization of microbial community succession during vermicomposting of medicinal herbal residues. Bioresour. Technol. 2018, 249, 542–549. [Google Scholar] [CrossRef]
  34. Schacht, K.; Marschner, B. Treated wastewater irrigation effects on soil hydraulic conductivity and aggregate stability of loamy soils in Israel. J. Hydrol. Hydromech. 2015, 62, 59–66. [Google Scholar] [CrossRef]
  35. Wang, H.; Chen, Y.; Zhang, Z.; Chen, H.; Li, W.; Wang, M.; Chai, H. Quantitatively estimating main soil water-soluble salt ions content based on Visible-near infrared wavelength selected using GC, SR and VIP. PeerJ 2019, 7, e6310. [Google Scholar] [CrossRef]
  36. Cai, M.; Hu, C.; Wang, X.; Zhao, Y.; Jia, W.; Sun, X.; Elyamine, A.; Zhao, H. Selenium induces changes of rhizosphere bacterial characteristics and enzyme activities affecting chromium/selenium uptake by pak choi (Brassica campestris L. ssp. Chinensis Makino) in chromium contaminated soil. Environ. Pollut. 2019, 249, 716–727. [Google Scholar]
  37. Kaur, J.; Chadha, B.; Kumar, B.; Saini, H. Purification and characterization of β-glucosidase from Melanocarpus sp. MTCC 3922. Electron. J. Biotechnol. 2007, 10, 260–270. [Google Scholar]
  38. Wan, S.M.; Hou, J.Q.; Zhao, J.S.; Clarke, N.; Kempenaar, C.; Chen, X.L. Predicting Soil Organic Matter, Available Nitrogen, Available Phosphorus and Available Potassium in a Black Soil Using a Nearby Hyperspectral Sensor System. Sensors 2024, 24, 2784. [Google Scholar] [CrossRef]
  39. Ramandi, A.; Seifi, A. Cupriavidus metallidurans bacteria enhance sodium uptake by plants. Rhizosphere 2023, 27, 100767. [Google Scholar] [CrossRef]
  40. Liu, Y.S.; Tao, Y.; Yang, X.Z.; Liu, Y.N.; Shen, R.F.; Zhu, X.F. Gibberellic acid alleviates cadmium toxicity in rice by regulating NO accumulation and cell wall fixation capacity of cadmium. J. Hazard. Mater. 2022, 439, 129597. [Google Scholar] [CrossRef]
  41. Ai, X.; Yang, H.; Ai, S.; Sheng, M.; Tian, X.; Teng, J.; Wang, Y.; Ai, Y. Effects of different restoration methods on soil organic carbon and its fractions of cut slopes in mountainous areas of southwestern China. J. Soil Sediments 2024, 24, 1933–1943. [Google Scholar] [CrossRef]
  42. Nguyen, H.; Song, Z.; Bates, T.S.; Branco, S.; Tedersoo, L.; Menke, J.; Schillinge, J.; Kennedy, P. FUNGuild: An open annotation tool for parsing fungal community datasets by ecological guild. Fungal Ecol. 2016, 20, 241–248. [Google Scholar] [CrossRef]
  43. Yang, X.; Zhao, B.; Zhang, P. Improvement in nitrogen removal and changes in community structure in a sequencing batch reactor bioaugmented with P. stutzeri strain XL-2. Bioresour. Technol. 2015, 317, 123976. [Google Scholar] [CrossRef] [PubMed]
  44. Partric, D.S.; Sarah, L.W.; Thomas, R.; Justine, R.H.; Martin, H.; Emily, B.H.; Ryan, A.L.; Brain, B.O.; Donovan, H.P.; Countney, J.R.; et al. Introducing mothur: Open-source, platform-independent, community-supported software for describing and comparing microbial communities. Appl. Environ. Microbiol. 2009, 75, 7537. [Google Scholar]
  45. Kai, M. Diversity and Distribution of Volatile Secondary Metabolites Throughout Bacillus subtilis Isolates. Front. Microbiol. 2020, 11, 559. [Google Scholar] [CrossRef] [PubMed]
  46. Xia, H.; Shen, J.; Riaz, M.; Jiang, C.; Zu, C.; Jiang, C.; Liu, B. Effects of Biochar and Straw Amendment on Soil Fertility and Microbial Communities in Paddy Soils. Plants 2024, 13, 1478. [Google Scholar] [CrossRef] [PubMed]
  47. Han, Z.; Li, J.; Zhao, Y.; Chen, Q.; Gao, X.; Hu, K.; Guo, N.; Wei, X.; Meng, R.; Zhu, C.; et al. Dissolved Mn2+ promotes microbially-catalyzed protodolomite precipitation in brackish oxidized water. Chem. Geol. 2024, 650, 121986. [Google Scholar] [CrossRef]
  48. Zhang, J.; Chi, F.; Wei, D.; Zhou, B.; Cai, S.; Li, Y.; Kuang, E.; Sun, L.; Li, L. Impacts of Long-term Fertilization on the Molecular Structure of Humic Acid and Organic Carbon Content in Soil Aggregates in Black Soil. Sci. Rep. 2019, 9, 11908. [Google Scholar] [CrossRef]
  49. Ananbeh, H.; Stojanović, M.; Pompeiano, A.; Voběrková, S.; Trasar-Cepeda, C. Use of soil enzyme activities to assess the recovery of soil functions in abandoned coppice forest systems. Sci. Total Environ. 2019, 694, 133692. [Google Scholar] [CrossRef]
  50. Han, Y.; Gao, Y.; Ye, Y.; Liu, Y.; Da, B.; Zhao, Y. Short-term effects of nitrogen deposition on soil enzyme activities in Tibet grasslands. Anim. Husb. Feed Sci. 2018, 10, 206–212. [Google Scholar]
  51. Bandick, A.; Dick, R. Field management effects on soil enzyme activities. Soil Biol. Biochem. 1999, 31, 1471–1479. [Google Scholar] [CrossRef]
  52. Kong, M.; Kang, J.; Han, C.; Gu, Y.; Siddique, K.; Li, F. Nitrogen, Phosphorus, and Potassium Resorption Responses of Alfalfa to Increasing Soil Water and P Availability in a Semi-Arid Environment. Agronomy 2020, 10, 310. [Google Scholar] [CrossRef]
  53. Wu, F.; Wan, J.; Wu, S.; Wong, M. Effects of earthworms and plant growth-promoting rhizobacteria (PGPR) on availability of nitrogen, phosphorus, and potassium in soil. J. Plant Nutr. Soil Sci. 2012, 175, 423–433. [Google Scholar] [CrossRef]
  54. Huang, K.; Li, M.; Li, R.; Rasul, F.; Shahzad, S.; Wu, C.; Shao, J.; Huang, G.; Li, R.; Almari, S.; et al. Soil acidification and salinity: The importance of biochar application to agricultural soils. Front. Plant Sci. 2023, 14, 1206820. [Google Scholar] [CrossRef] [PubMed]
  55. Mahmoud, E.; Ibrahim, M. Effect of vermicompost and its mixtures with water treatment residuals on soil chemical properties and barley growth. J. Soil Sci. Plant Nutr. 2012, 12, 431–440. [Google Scholar] [CrossRef]
  56. Huang, X.; Li, H.; Li, S.; Xiong, H.; Jiang, X. Role of cationic polarization in humus-increased soil aggregate stability. Eur. J. Soil Sci. 2016, 67, 341–350. [Google Scholar] [CrossRef]
  57. Amini, S.; Ghadiri, H.; Chen, C.; Marschner, P. Salt-affected soils, reclamation, carbon dynamics, and biochar: A review. J. Soil Sediments 2016, 16, 939–953. [Google Scholar] [CrossRef]
  58. Wu, L.; Wang, Y.; Zhang, S.; Wei, W.; Kuzyakov, Y.; Ding, X. Fertilization effects on microbial community composition and aggregate formation in saline-alkaline soil. Plant Soil 2021, 463, 523–535. [Google Scholar] [CrossRef]
  59. Li, S.; Zhao, L.; Wang, C.; Huang, H.; Zhang, M. Synergistic improvement of carbon sequestration and crop yield by organic material addition in saline soil: A global meta-analysis. Sci. Total Environ. 2023, 891, 164530. [Google Scholar] [CrossRef]
  60. Cai, J.; Liu, X.; Sun, K.; Jiang, F.; Zhang, M.; Li, H.; Yu, F. Vermicompost Application Enhances Halophyte Suaeda salsa Performance and Improves Coastal Saline Soil Quality. J. Soil Sci. Plant Nutr. 2021, 22, 294–305. [Google Scholar] [CrossRef]
  61. Zhao, S.; Yu, F.; Zhai, C.; Zhong, R.; Zhao, Y.; Wang, Y.; Zhang, J.; Meng, Q. Long-term effects of cattle manure application on the soil aggregate stability of salt-affected soil on the Songnen Plain of North-Eastern China. J. Soil Sediments 2023, 23, 344–354. [Google Scholar] [CrossRef]
  62. Gao, M.; Peng, H.; Bai, L.; Ye, B.; Qiu, W.; Song, Z. Response of wheat (Triticum aestivum L. cv.) to the coexistence of micro-/nanoplastics and phthalate esters alter its growth environment. Sci. Total Environ. 2024, 946, 174484. [Google Scholar] [CrossRef] [PubMed]
  63. Huang, X.; Liu, L.; Zhao, J.; Zhang, J.; Cai, Z. The families Ruminococcaceae, Lachnospiraceae, and Clostridiaceae are the dominant bacterial groups during reductive soil disinfestation with incorporated plant residues. Appl. Soil Ecol. 2019, 135, 65–72. [Google Scholar] [CrossRef]
  64. Manici, L.M.; Caputo, F.; Fornasier, F.; Paletto, A.; Ceotto, E.; Meo, I.D. Ascomycota and Basidiomycota fungal phyla as indicators of land use efficiency for soil organic carbon accrual with woody plantations. Ecol. Indic. 2024, 160, 111796. [Google Scholar] [CrossRef]
  65. Chouyia, F.; Ventorino, V.; Pepe, O. Diversity, mechanisms and beneficial features of phosphate-solubilizing Streptomyces in sustainable agriculture: A review. Front. Plant Sci. 2022, 13, 1035358. [Google Scholar] [CrossRef] [PubMed]
  66. Li, X.; Ren, X.; Ibrahim, E.; Kong, H.; Wang, M.; Xia, J.; Wang, H.; Shou, L.; Zhou, T.; Li, B.; et al. Response of Chinese cabbage (Brassica rapa subsp. pekinensis) to bacterial soft rot infection by change of soil microbial community in root zone. Front. Microbiol. 2024, 15, 1401896. [Google Scholar]
  67. Schmidt, R.; Wang, X.; Paolina, G.; Etienne, Y. The nitrification inhibitor nitrapyrin has non-target effects on the soil microbial community structure, composition, and functions. Appl. Soil Ecol. 2022, 71, 104350. [Google Scholar] [CrossRef]
  68. Ren, J.; Xu, C.; Li, C.; Deng, L.; Dong, L.; Wang, C.; Huhe, T.; Niu, D. Effects of Adding Thermally Treated Penicillin Mycelial Dreg on the Lignocellulose Degradation, Fungal Diversity, and Fertilizer Efficiency of Compost. Waste Biomass Valorization 2023, 14, 1879–1889. [Google Scholar] [CrossRef]
  69. Gómez, L.; Brewer, M. Detection of azole-resistant Aspergillus fumigatus in the environment from air, plant debris, compost, and soil. PLoS ONE 2023, 17, 1–16. [Google Scholar]
  70. Nikitin, D.; Sadykova, V.; Kuvarina, A.; Dakh, A.; Biryukov, M. Enzymatic and Antimicrobial Activities in Polar Strains of Microscopic Soil Fungi. Dokl. Biol. Sci. 2022, 507, 380–393. [Google Scholar] [CrossRef]
  71. Chen, E.; Yang, C.; Tao, W.; Li, S. Polysaccharides Produced by Plant Growth-Promoting Rhizobacteria Strain Burkholderia sp. BK01 Enhance Salt Stress Tolerance to Arabidopsis thaliana. Polymers 2024, 16, 145. [Google Scholar] [CrossRef]
Figure 1. Experimental flowchart of this study.
Microorganisms 13 01243 g001
Figure 2. The effects of (a) different pH and (b) NaCl concentrations on the growth status of free B. subtilis, as well as the electron microscopy characterization of (c) conventional biochar and (d) BSC. Element contents of (e) BC and (f) BSC.
Microorganisms 13 01243 g002
Figure 3. The effects of different treatments on organic carbon components during soil cultivation. (a) The content of soil SOC, (b) the content of soil DOC, (c) the content of soil POC, (d) the content of soil ROC, (e) the content of soil FA, and (f) the content of soil HA. Among them, T1 included the addition of 30 g of maize straw and 20 g of cow manure per kilogram of saline–alkali soil; T2 included the base of T1 and 6 earthworms per kilogram of soil; T3 included the base of T2 and 25 mL of BS per kilogram of soil; T4 included the base of T2 and 10 g of conventional biochar per kilogram of soil; and T5 included the base of T2 and 10 g of BSC per kilogram of soil. Multiple comparisons were performed using Tukey’s HSD test to determine significant differences among groups. Different lowercase letters (e.g., a, b, c, d) indicate statistically significant differences (p < 0.05).
Microorganisms 13 01243 g003
Figure 4. The effects of different treatments during soil cultivation on key soil enzymes and soil available nutrients after 60-day cultivation. (a) Soil β-glucosidase activity, (b) soil sucrase activity, (c) soil urease activity, (d) soil available phosphorus content, (e) soil available potassium, and (f) soil alkaline nitrogen content. Among them, T1 included the addition of 30 g of maize straw and 20 g of cow manure per kilogram of saline–alkali soil; T2 included the base of T1 and 6 earthworms per kilogram of soil; T3 included the base of T2 and 25 mL of BS per kilogram of soil; T4 included the base of T2 and 10 g of conventional biochar per kilogram of soil; and T5 included the base of T2 and 10 g of BSC per kilogram of soil. Multiple comparisons were performed using Tukey’s HSD test to determine significant differences among groups. Different lowercase letters (e.g., a, b, c, d) indicate statistically significant differences (p < 0.05).
Microorganisms 13 01243 g004
Figure 5. The effect of different treatments on the relative abundance of soil microbial communities during soil cultivation. (a) Soil bacterial phylum level, (b) soil fungal phylum level, (c) soil bacterial genus level, and (d) soil fungal genus level. Among them, T1 included the addition of 30 g of maize straw and 20 g of cow manure per kilogram of saline–alkali soil; T2 included the base of T1 and 6 earthworms per kilogram of soil; T3 included the base of T2 and 25 mL of BS per kilogram of soil; T4 included the base of T2 and 10 g of conventional biochar per kilogram of soil; and T5 included the base of T2 and 10 g of BSC per kilogram of soil. The after ‘-number’ represents the time of soil cultivation for that treatment. For example, T1-15 represents the relative abundance of microbial communities after 15-day cultivation in T1 treatment.
Microorganisms 13 01243 g005aMicroorganisms 13 01243 g005bMicroorganisms 13 01243 g005c
Figure 6. Analysis of soil microbial community differences after 60 days of incubation. (a) LefSe analysis of bacterial phylum to genus level differences (LDA > 3.5), (b) LefSe analysis of fungal phylum to genus level differences (LDA > 2.0), (c) one-way analysis of bacterial genus level differences, (d) Venn plot showing differences between bacterial OTUs, (e) one-way analysis of fungal genus level differences, (f) Venn plot showing differences between fungal OTUs. Among them, T1 included the addition of 30 g of maize straw and 20 g of cow manure per kilogram of saline–alkali soil; T2 included the base of T1 and 6 earthworms per kilogram of soil; T3 included the base of T2 and 25 mL of BS per kilogram of soil; T4 included the base of T2 and 10 g of conventional biochar per kilogram of soil; and T5 included the base of T2 and 10 g of BSC per kilogram of soil. The symbols *, ** and *** present differences at levels 0.05, 0.01 and 0.001, respectively.
Microorganisms 13 01243 g006aMicroorganisms 13 01243 g006b
Figure 7. Prediction and correlation of soil microbial function, (a) bacterial FAPROTAX prediction, (b) fungal FUNGuild prediction, and (c) correlation between soil nutrients and salinity indicators and microorganisms (taken from microbial samples on day 60). Among them, T1 included the addition of 30 g of maize straw and 20 g of cow manure per kilogram of saline–alkali soil; T2 included the base of T1 and 6 earthworms per kilogram of soil; T3 included the base of T2 and 25 mL of BS per kilogram of soil; T4 included the base of T2 and 10 g of conventional biochar per kilogram of soil; and T5 included the base of T2 and 10 g of BSC per kilogram of soil. The after ‘-number’ represents the time of soil cultivation for that treatment. For example, T1-15 represents the relative abundance of microbial communities after 15 days of cultivation in the T1 treatment.
Microorganisms 13 01243 g007aMicroorganisms 13 01243 g007b
Figure 8. The effects of different treatments on the physical and chemical indicators of alfalfa growth. (a) Alfalfa growth status, (b) alfalfa biomass, (c) alfalfa plant height and root length, (d) alfalfa Na content, (e) alfalfa above-ground POD activity, (f) alfalfa above-ground SOD activity, and (g) alfalfa above-ground CAT activity. Among them, T1 included the addition of 30 g of maize straw and 20 g of cow manure per kilogram of saline–alkali soil; T2 included the base of T1 and 6 earthworms per kilogram of soil; T3 included the base of T2 and 25 mL of BS per kilogram of soil; T4 included the base of T2 and 10 g of conventional biochar per kilogram of soil; and T5 included the base of T2 and 10 g of BSC per kilogram of soil. Multiple comparisons were performed using Tukey’s HSD test to determine significant differences among groups. Different lowercase letters (e.g., a, b, c, d) indicate statistically significant differences (p < 0.05) for the aboveground part of alfalfa, and capital letter (e.g., A, B, C) indicate statistically significant differences (p < 0.05) for the underground part of alfalfa.
Microorganisms 13 01243 g008
Figure 9. Correlation analysis between soil indexes. Note: The symbols * and ** present differences at levels 0.05 and 0.01, respectively. The data in the figure were obtained after 60 days of cultivation.
Microorganisms 13 01243 g009
Table 1. Elimination of salt alkali barriers by different treatments.
TreatmentspHEC
(μs cm−1)
( CO 3 2 + HCO 3 )
(mg kg−1)
ENa
(mmol kg−1)
CEC
(mmol kg−1)
ESP
(%)
T19.32 ± 0.04 a651 ± 12.1 b1088 ± 13.4 a2.43 ± 0.08 a18.7 ± 1.93 c13.1 ± 1.66 a
T29.27 ± 0.03 ab466 ± 22.0 d1042 ± 17.6 b2.18 ± 0.06 c19.2 ± 2.01 c11.6 ± 1.55 ab
T39.20 ± 0.03 bc424 ± 15.6 d1003 ± 17.0 bc2.20 ± 0.07 c20.6 ± 1.28 ab10.6 ± 0.43 ab
T49.17 ± 0.03 c824 ± 26.1 a980 ± 11.0 c2.30 ± 0.04 ab23.0 ± 1.39 ab10.0 ± 0.43 b
T59.08 ± 0.03 d539 ± 15.1 c968 ± 13.0 c2.32 ± 0.07 ab24.1 ± 2.15 a9.77 ± 0.88 b
Among them, T1 included the addition of 30 g of maize straw and 20 g of cow manure per kilogram of saline–alkali soil; T2 included the base of T1 and 6 earthworms per kilogram of soil; T3 included the base of T2 and 25 mL of BS per kilogram of soil; T4 included the base of T2 and 10 g of conventional biochar per kilogram of soil; and T5 included the base of T2 and 10 g of BSC per kilogram of soil. Multiple comparisons were performed using Tukey’s HSD test to determine significant differences among groups. Different lowercase letters (e.g., a, b, c, d) indicate statistically significant differences (p < 0.05).
Table 2. Microbial alpha diversity under different groups.
GroupsBacterialFungal
AceChao1ShannonAceChao1Shannon
T1-154783 ± 107 a4602 ± 111 a6.84 ± 0.08 a552 ± 54.8 a550 ± 42.5 a3.48 ± 0.46 a
T2-154819 ± 149 a4600 ± 160 a6.82 ± 0.05 a591 ± 39.0 a592 ± 33.3 a3.71 ± 0.14 a
T3-154413 ± 209 a4224 ± 186 ab6.47 ± 0.34 ab551 ± 28.3 a535 ± 25.3 a3.71 ± 0.11 a
T4-154818 ± 183 a4596 ± 197 a6.86 ± 0.03 a514 ± 17.3 a502 ± 20.3 a3.75 ± 0.10 a
T5-154071 ± 231 a3843 ± 224 b5.66 ± 0.22 b527 ± 8.38 a527 ± 10.3 a3.75 ± 0.31 a
T1-304584 ± 178 a4408 ± 229 a6.60 ± 0.09 b518 ± 64.2 a518 ± 68.3 a3.80 ± 0.16 a
T2-304762 ± 235 a4574 ± 193 a6.91 ± 0.10 a488 ± 41.1 a485 ± 38.3 a3.63 ± 0.39 a
T3-304614 ± 100 a4453 ± 73.0 a6.75 ± 0.07 ab480 ± 37.7 a480 ± 35.6 a3.38 ± 0.23 a
T4-305024 ± 264 a4835 ± 305 a6.90 ± 0.13 a537 ± 25.3 a545 ± 20.3 a3.72 ± 0.11 a
T5-304584 ± 64.5 a4403 ± 79.8 a6.78 ± 0.05 ab493 ± 19.4 a494 ± 21.0 a3.51 ± 0.40 a
T1-454743 ± 224 b4557 ± 172 b6.77 ± 0.09 b512 ± 56.6 a518 ± 60.8 a3.88 ± 0.15 a
T2-454891 ± 73.5 ab4707 ± 129 ab6.86 ± 0.05 ab487 ± 37.7 a497 ± 41.8 a3.70 ± 0.18 a
T3-454727 ± 75.3 b4549 ± 136 b6.81 ± 0.05 b464 ± 46.1 a461 ± 48.2 a3.52 ± 0.32 a
T4-455101 ± 266 a4899 ± 240 a6.94 ± 0.03 a509 ± 36.0 a512 ± 36.3 a3.83 ± 0.26 a
T5-454990 ± 106 ab4810 ± 119 ab6.86 ± 0.03 ab526 ± 47.8 a529 ± 46.7 a3.79 ± 0.21 a
T1-604969 ± 208 a4796 ± 185 a6.85 ± 0.04 abc454 ± 65.9 a449 ± 67.4 a3.58 ± 0.30 a
T2-605163 ± 81.3 a4986 ± 20.4 a6.96 ± 0.04 ab460 ± 59.1 a461 ± 49.9 a3.58 ± 0.40 a
T3-604803 ± 196 a4623 ± 185 a6.72 ± 0.16 c441 ± 13.0 a445 ± 18.8 a3.57 ± 0.23 a
T4-605224 ± 146 a5025 ± 181 a7.01 ± 0.04 a510 ± 33.0 a509 ± 35.8 a3.80 ± 0.15 a
T5-604828 ± 185 a4611 ± 139 a6.77 ± 0.08 bc518 ± 69.4 a516 ± 56.5 a3.54 ± 0.24 a
Among them, T1 included the addition of 30 g of maize straw and 20 g of cow manure per kilogram of saline–alkali soil; T2 included the base of T1 and 6 earthworms per kilogram of soil; T3 included the base of T2 and 25 mL of BS per kilogram of soil; T4 included the base of T2 and 10 g of conventional biochar per kilogram of soil; and T5 included the base of T2 and 10 g of BSC per kilogram of soil. Multiple comparisons were performed using Tukey’s HSD test to determine significant differences among groups. Different lowercase letters (e.g., a, b, c) indicate statistically significant differences (p < 0.05).
Disclaimer/Publisher’s Note: The statements, opinions and data contained in all publications are solely those of the individual author(s) and contributor(s) and not of MDPI and/or the editor(s). MDPI and/or the editor(s) disclaim responsibility for any injury to people or property resulting from any ideas, methods, instructions or products referred to in the content.

