Abstract
The denitrification process is the main process of the soil nitrogen (N) cycle in paddy fields, which leads to the production of large amounts of nitrous oxide (N2O) and increases N loss in paddy soil. Plant-derived bio denitrification inhibitor procyanidins are thought to inhibit soil denitrification, thereby reducing N2O emissions and soil N loss. However, the denitrification inhibition effect of procyanidins in paddy soils with high organic matter content remains unclear, and their high price is not conducive to practical application. Therefore, this study conducted a 21-day incubation experiment using low-cost proanthocyanidins (containing procyanidins) and paddy soil with high organic matter content in Northeast China to explore the effects of proanthocyanidins on N2O emissions and related microorganisms in paddy soil. The results of the incubation experiment showed that the application of proanthocyanidins in paddy soil in Northeast China could promote the production of N2O in the first three days but inhibited the production of N2O thereafter. Throughout the incubation period, proanthocyanidins inhibited the enzyme nitrate reductase (NaR) activity and the abundance of nirS and nirk denitrifying bacteria, with a significant dose-response relationship. Although the application of proanthocyanidins also reduced the soil nitrate nitrogen (NO3−-N) content, the soil NO3−-N content increased significantly with increasing incubation time. In addition, the application of proanthocyanidins increased soil microbial respiration, ammonia-oxidizing archaea (AOA) amoA gene abundance, and soil ammonium nitrogen (NH4+-N) content. Therefore, the application of proanthocyanidins to paddy soil in Northeast China can effectively regulate denitrification. However, in future studies, it is necessary to explore the impact of proanthocyanidins on the nitrification process and use them in combination with urease inhibitors and/or nitrification inhibitors to better regulate soil N transformation and reduce N2O emissions in paddy soil.
1. Introduction
Nitrous oxide (N2O) is the third largest greenhouse gas in the world after carbon dioxide (CO2) and methane (CH4) [1]; however, its warming potential is 298 times that of CO2, and it greatly exacerbates the depletion of stratospheric ozone [2]. N2O is mainly produced in agricultural soils, accounting for over 60% of total N2O emissions [3]. To ensure food production, the agricultural system uses a large amount of nitrogen (N) fertilizer every year, which further leads to more N2O emissions [4]. Agricultural soils mainly produce N2O through microbially mediated nitrification and denitrification processes [5], with denitrification typically occurring in anaerobic environments [6]. Due to long-term flooding in paddy soils, denitrification has become the main pathway for N2O production, reaching over 77% [7], and has become an important N loss pathway, which is not conducive to sustainable agricultural development. Therefore, reducing N2O emissions from paddy fields has become a focus of attention for researchers [8,9,10].
The use of fertilizers containing inhibitors is one of the commonly used fertilization measures in paddy fields, which is beneficial for reducing N2O emissions and improving the nitrogen fertilizer use efficiency of rice [11,12]. Currently, the most commonly used inhibitors are urease and nitrification inhibitors. Urease inhibitors can slow down the hydrolysis of urea into ammonium nitrogen (NH4+-N) by inhibiting urease activity, while nitrification inhibitors can inhibit the rate of NH4+-N conversion to nitrate nitrogen (NO3−-N) [8,11,13]. However, urease and nitrification inhibitors cannot directly regulate the denitrification process; therefore, they cannot effectively regulate the N2O produced by denitrification [7,14]. For a long time, research has focused on reducing agriculture-related pollution through the control of nitrification, while denitrification has received comparatively little attention [5,8,11]. In recent years, Bardon et al. [15,16] discovered B-type procyanidins, a biological denitrification inhibitor (BDI) found in the roots of the invasive species Fallopia spp., which have inhibitory effects on soil denitrification and can also limit the loss of gaseous N in soil by directly targeting N2O sources. This novel B-type procyanidin has the potential to regulate denitrification in paddy soils.
Soil denitrification is an important process in soil N cycling. The first step is the reduction of NO3−-N to nitrite nitrogen (NO2−-N) by the enzyme nitrate reductase (NaR) [17]. The nirS and nirK genes, which encode the nitrite reductase enzyme (NiR), are used to indicate denitrifying bacteria that convert NO2−-N to NO. Since NO2−-N reduction is the rate-limiting step of denitrification, the functional genes nirS and nirK are often used as biomarkers to explore denitrifying bacterial communities [18,19]. Procyanidins may mainly inhibit denitrification by affecting NaR activity and the abundance of denitrifying bacteria containing nirS and nirK [17,20,21]. Previous studies have shown that soils with high organic matter content may limit the denitrification inhibition effect of procyanidins, as procyanidins can be adsorbed by soil organic matter (SOM) [22]. However, soils with high moisture content and organic matter are often more conducive to denitrification [14]. Therefore, it is necessary to test the denitrification inhibition effect of procyanidins on paddy soils with high SOM content in Northeast China.
B-type procyanidins in proanthocyanidins are considered key substances for inhibiting denitrification [16]; however, their high cost limits their application [23]. The use of proanthocyanidins containing B-type procyanidins can reduce costs by more than 2000 times (Macklin, Shanghai, China). Moreover, B-type procyanidins may have synergistic effects with other proanthocyanidins, affecting denitrification inhibition [16]. In addition, the application of proanthocyanidins to soil can introduce a large amount of carbon. When a large amount of N fertilizer is applied to paddy soil, the addition of carbon sources may lead to increased microbial activity and may have an impact on the nitrification process (another important process of N2O production), which is mainly regulated by the ammonia-oxidizing archaea (AOA) amoA and ammonia-oxidizing bacteria (AOB) amoA genes [19]. Therefore, exploring the effects of proanthocyanidins in paddy soil is beneficial for developing N fertilizer management measures and formulating effective N2O emission reduction strategies.
The aim of this study is to investigate the denitrification inhibition effect of proanthocyanidins on paddy soil with high SOM content in Northeast China. The main objectives of this study are to (i) evaluate the effect of proanthocyanidins on N2O emissions from paddy soil, (ii) evaluate the effect of proanthocyanidins on NH4+-N and NO3−-N in paddy soil, and (iii) evaluate the inhibitory effect of proanthocyanidins on NaR, nirS, and nirK genes.
2. Materials and Methods
2.1. Soil Properties and Experimental Design
The soil used for the incubation experiment was obtained from the Shenyang Experimental Station of the Institute of Applied Ecology, Liaoning Province, China (41°32′ N, 123°23′ E). In October 2024, soil from the paddy field at a depth of 0–20 cm was collected, naturally air-dried, mixed, sieved through a 2 mm sieve, and stored in a refrigerator at 4 °C until the incubation experiment was carried out. The basic physicochemical properties of the soil are listed in Table 1.

Table 1.
Soil physicochemical properties (0–20 cm soil layer).
Before starting the incubation experiment, the soil sample was adjusted to 40% water holding capacity (WHC) and then pre-incubated for 7 days at 25 °C in an incubator to activate soil microbial activity. The pre-incubation soil was filled into 120 mL glass bottles (diameter: 4 cm, height: 9.5 cm), each containing 20 g of soil (dry soil). Four treatments were set up for the incubation experiment: no urea control check (CK), addition of urea (U), addition of urea and 1 mg of proanthocyanidins g−1 dry soil (U+P1), and addition of urea and 2 mg of proanthocyanidins g−1 dry soil (U+P2). Each treatment was repeated 3 times, totaling 84 bottles (divided into 7 destructive samples). The amount of urea added was 0.084 mg N g−1 dry soil. Proanthocyanins are commercial proanthocyanidins extracted from grape seeds (Macklin, Shanghai, China; proanthocyanidin content > 95%, C30H26O13, mainly containing gallic acid, procyanidin B1, catechin, procyanidin B2, epicatechin, epicatechin 3-O-gallate, and oligomeric proanthocyanins). After adding urea and proanthocyanidins, 27 mL of deionized water was added to form a water layer of about 5 mm in the bottle to simulate a flooded paddy field environment. All glass bottles were opened and incubated at 25 °C in an incubator until sampling, during which the evaporated water was replenished daily using the weighing method.
2.2. Gas and Soil Sample Collection and Determination
Gas and soil samples were collected on the 1st, 3rd, 5th, 7th, 10th, 14th, and 21st days after the start of the incubation experiment. At 8:00, 35 mL of gas was collected from the bottle using a 35 mL syringe, and the glass bottle was immediately sealed with a rubber stopper. At 10:00, another 35 mL of gas was collected from the bottle and analyzed (N2O and CO2) using a gas chromatograph (Agilent 7890B, Gas Chromatography, Wilmington, DE, USA). The N2O and CO2 emission rates were calculated based on the slope of the concentration changes of the two collected gases [12]. The cumulative emissions of N2O and CO2 were calculated using the interpolation method [24]. After each gas sample collection, the NH4+-N and NO3−-N contents and NaR activity in the soil were measured. Soil NH4+-N and NO3−-N were extracted using a 2 mol L−1 KCl solution (soil:solution = 1:5), filtered through filter paper, and analyzed using a continuous flow analyzer (AA3, Bran+Luebbe, Norderstedt, Germany) [24]. The activity of soil NaR was determined using α-naphthylamine-sulfanilic acid, and the specific method was described by Ye et al. [17].
Soil samples were collected on the 1st, 3rd, 5th, and 7th day after the start of the incubation experiment to determine N cycling functional genes. The abundance of AOA amoA, AOB amoA, nirS, and nirK was determined using real-time quantitative PCR (qPCR) on an ABI 7300 system (Applied Biosystems, Waltham, MA, USA). The primers and qPCR thermal profiles are shown in Table S1. The reaction mixture contained 10 µL 2×Taq Plus Master Mix, 0.8 µL primers, 1 µL DNA template, and 7.4 µL deionized water. All qPCR reactions were performed using melting point curve analysis to determine the amplified products. Three parallel qPCR replicates were performed.
2.3. Statistical Analyses
Data analysis was conducted using one-way ANOVA in SPSS Statistics 16.0 (SPSS Inc., Chicago, IL, USA) (p < 0.05). Origin 8.5 software (Origin Lab Corp., Northampton, MA, USA) was used to create the figures. Data are presented as mean ± standard error (SE).
3. Results
3.1. Effects of Proanthocyanidins on N2O Production and Microbial Respiration
During the incubation experiment, the N2O flux ranged from 0.28–47.25 µg kg−1 dry soil h−1 (Figure 1A). The N2O flux of CK was always at a low level, and the N2O flux of U reached a peak on the 5th day (2.80 µg kg−1 dry soil h−1) and then declined rapidly. The N2O fluxes of U+P1 and U+P2 peaked on the 1st day at 46.11 and 23.94 µg kg−1 dry soil h−1, respectively, and then declined rapidly thereafter. As shown in Figure 1A, N2O produced by U+P1 and U+P2 treatments mainly occurred in the first 3 days of the incubation experiment, while N2O produced by U treatment mainly occurred on the 5th day. The N2O accumulation was shown as U+P1 > U+P2 > U > CK, and the differences were significant (p < 0.05), being 2.29, 1.15, 0.36, and 0.23 mg kg−1 dry soil, respectively (Figure 2A). In the first 3 days of the incubation experiment, N2O accumulation was in the order U+P1 > U+P2 > U > CK, with values of 1.99, 0.94, 0.04, and 0.03 mg kg−1 dry soil, respectively (Figure 2B). Except for U and CK, there were significant differences among the other treatments (p < 0.05, Figure 2B). During the 5–21 days of the incubation experiment, the accumulation of N2O showed the following order: U > CK > U+P1 > U+P2, with concentrations of 0.27, 0.20, 0.19, and 0.18 mg kg−1 dry soil, respectively (Figure 2B). Among these, the U treatment was significantly higher than the other three treatments (p < 0.05, Figure 2B).

Figure 1.
Effect of proanthocyanidin application on N2O (A) and CO2 (B) fluxes in paddy soil. No urea control check (CK), addition of urea (U), addition of urea and 1 mg of proanthocyanidins g−1 dry soil (U+P1), and addition of urea and 2 mg of proanthocyanidins g−1 dry soil (U+P2). Bars represent the mean ± standard error (n = 3). Different lowercase letters within the treatments indicate significant differences (p < 0.05).

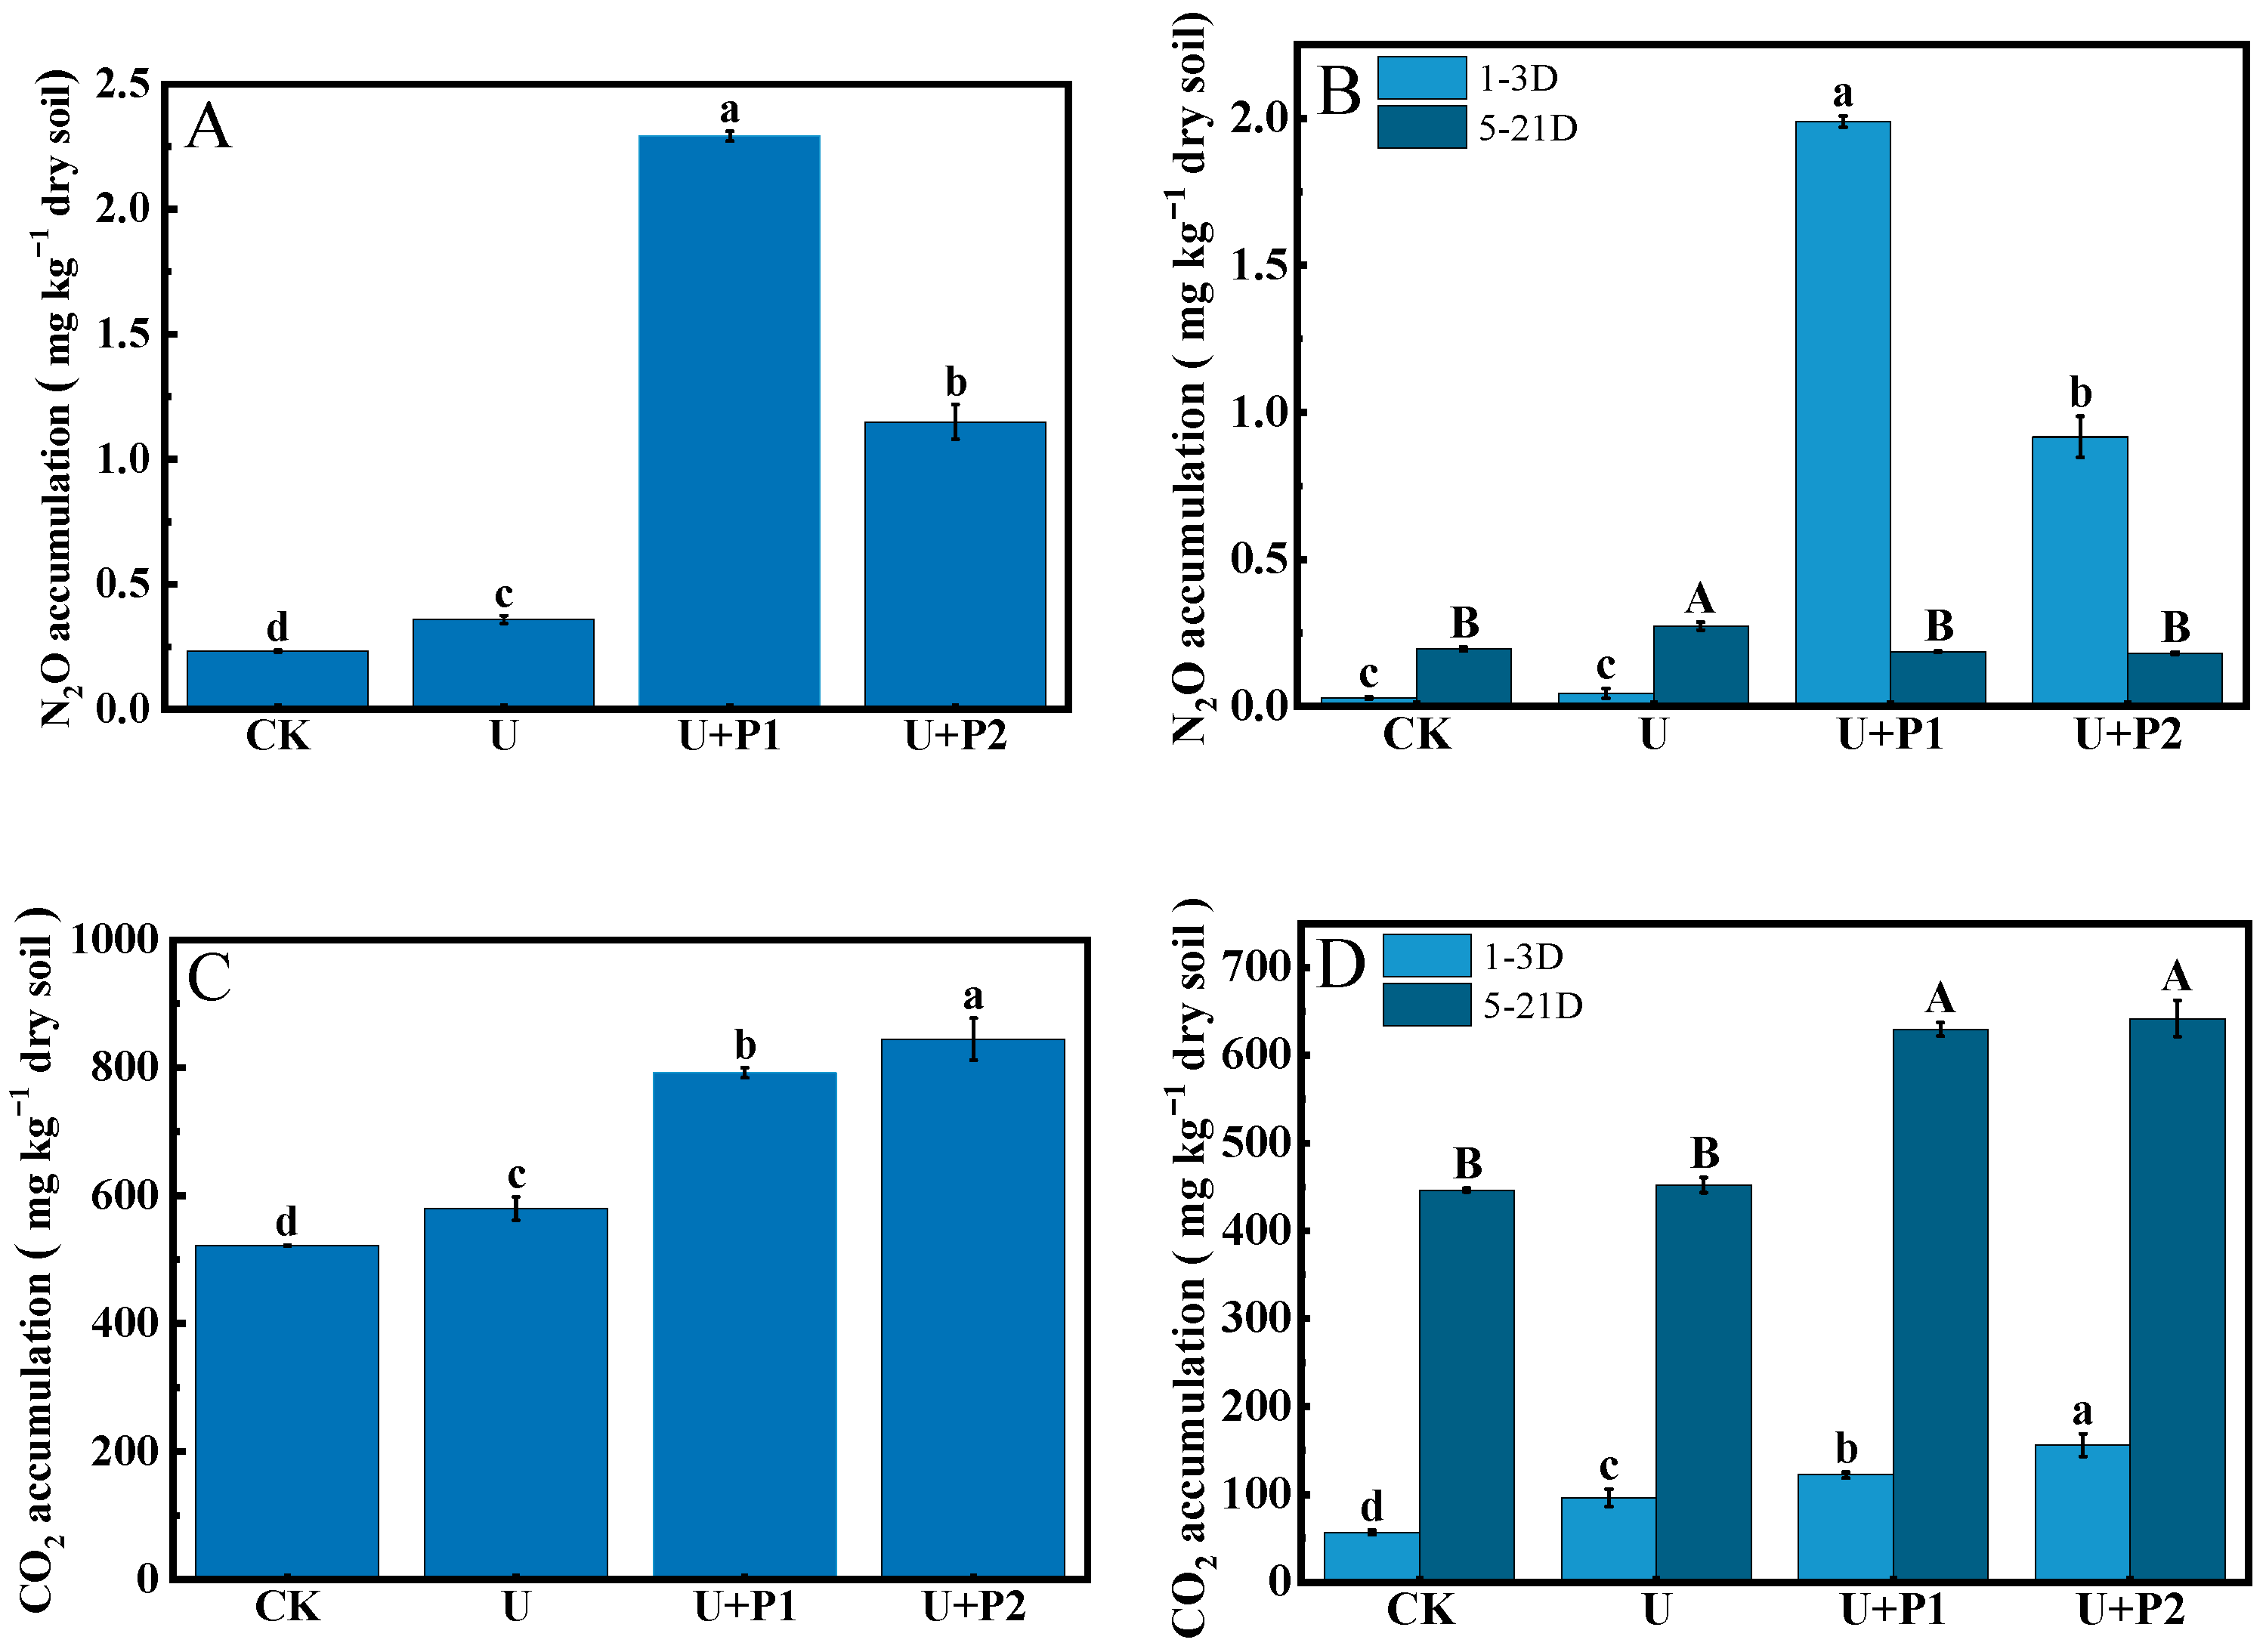
Figure 2.
Effect of proanthocyanidin application on N2O ((A): N2O accumulation during the entire incubation period; (B): N2O accumulation in 1–3 days and 5–21 days) and CO2 ((C): CO2 accumulation during the entire incubation period; (D): CO2 accumulation in 1–3 days and 5–21 days) accumulation in different treatments. No urea control check (CK), addition of urea (U), addition of urea and 1 mg of proanthocyanidins g−1 dry soil (U+P1), and addition of urea and 2 mg of proanthocyanidins g−1 dry soil (U+P2). Bars represent the mean ± standard error (n = 3). Different uppercase and lowercase letters within the treatments indicate significant differences (p < 0.05).
In this study, the CO2 flux ranged from 0.49 to 2.65 mg kg−1 dry soil h−1 (Figure 1B). The CO2 fluxes of all treatments showed a trend of first increasing and then decreasing (Figure 1B). The CO2 flux of U peaked on day 3 (1.73 mg kg−1 dry soil h−1), while the CO2 flux of CK, U+P1, and U+P2 peaked on day 7 (1.48, 2.15, and 2.20 mg kg−1 dry soil h−1, respectively) (Figure 1B). As shown in Figure 2C, CO2 accumulation showed the order of U+P2 > U+P1 > U > CK, with significant differences among different treatments (p < 0.05), which were 844.59, 791.98, 579.71, and 522.08 mg kg−1 dry soil, respectively. In the first 3 days of the incubation experiment, the CO2 accumulation was in the order U+P2 > U+P1 > U > CK, with values of 154.44, 122.18, 95.93, and 56.83 mg kg−1 dry soil, respectively, and the differences among all treatments were significant (p < 0.05, Figure 2D). During 5–21 days of incubation, the CO2 accumulation showed that U+P2 > U+P1 > U > CK, with concentrations of 641.79, 629.22, 451.89, and 446.35 mg kg−1 dry soil, respectively. Among them, the U+P1 and U+P2 treatments were significantly greater than the CK and U treatments (p < 0.05, Figure 2D).
3.2. Influence of Proanthocyanidins on NaR
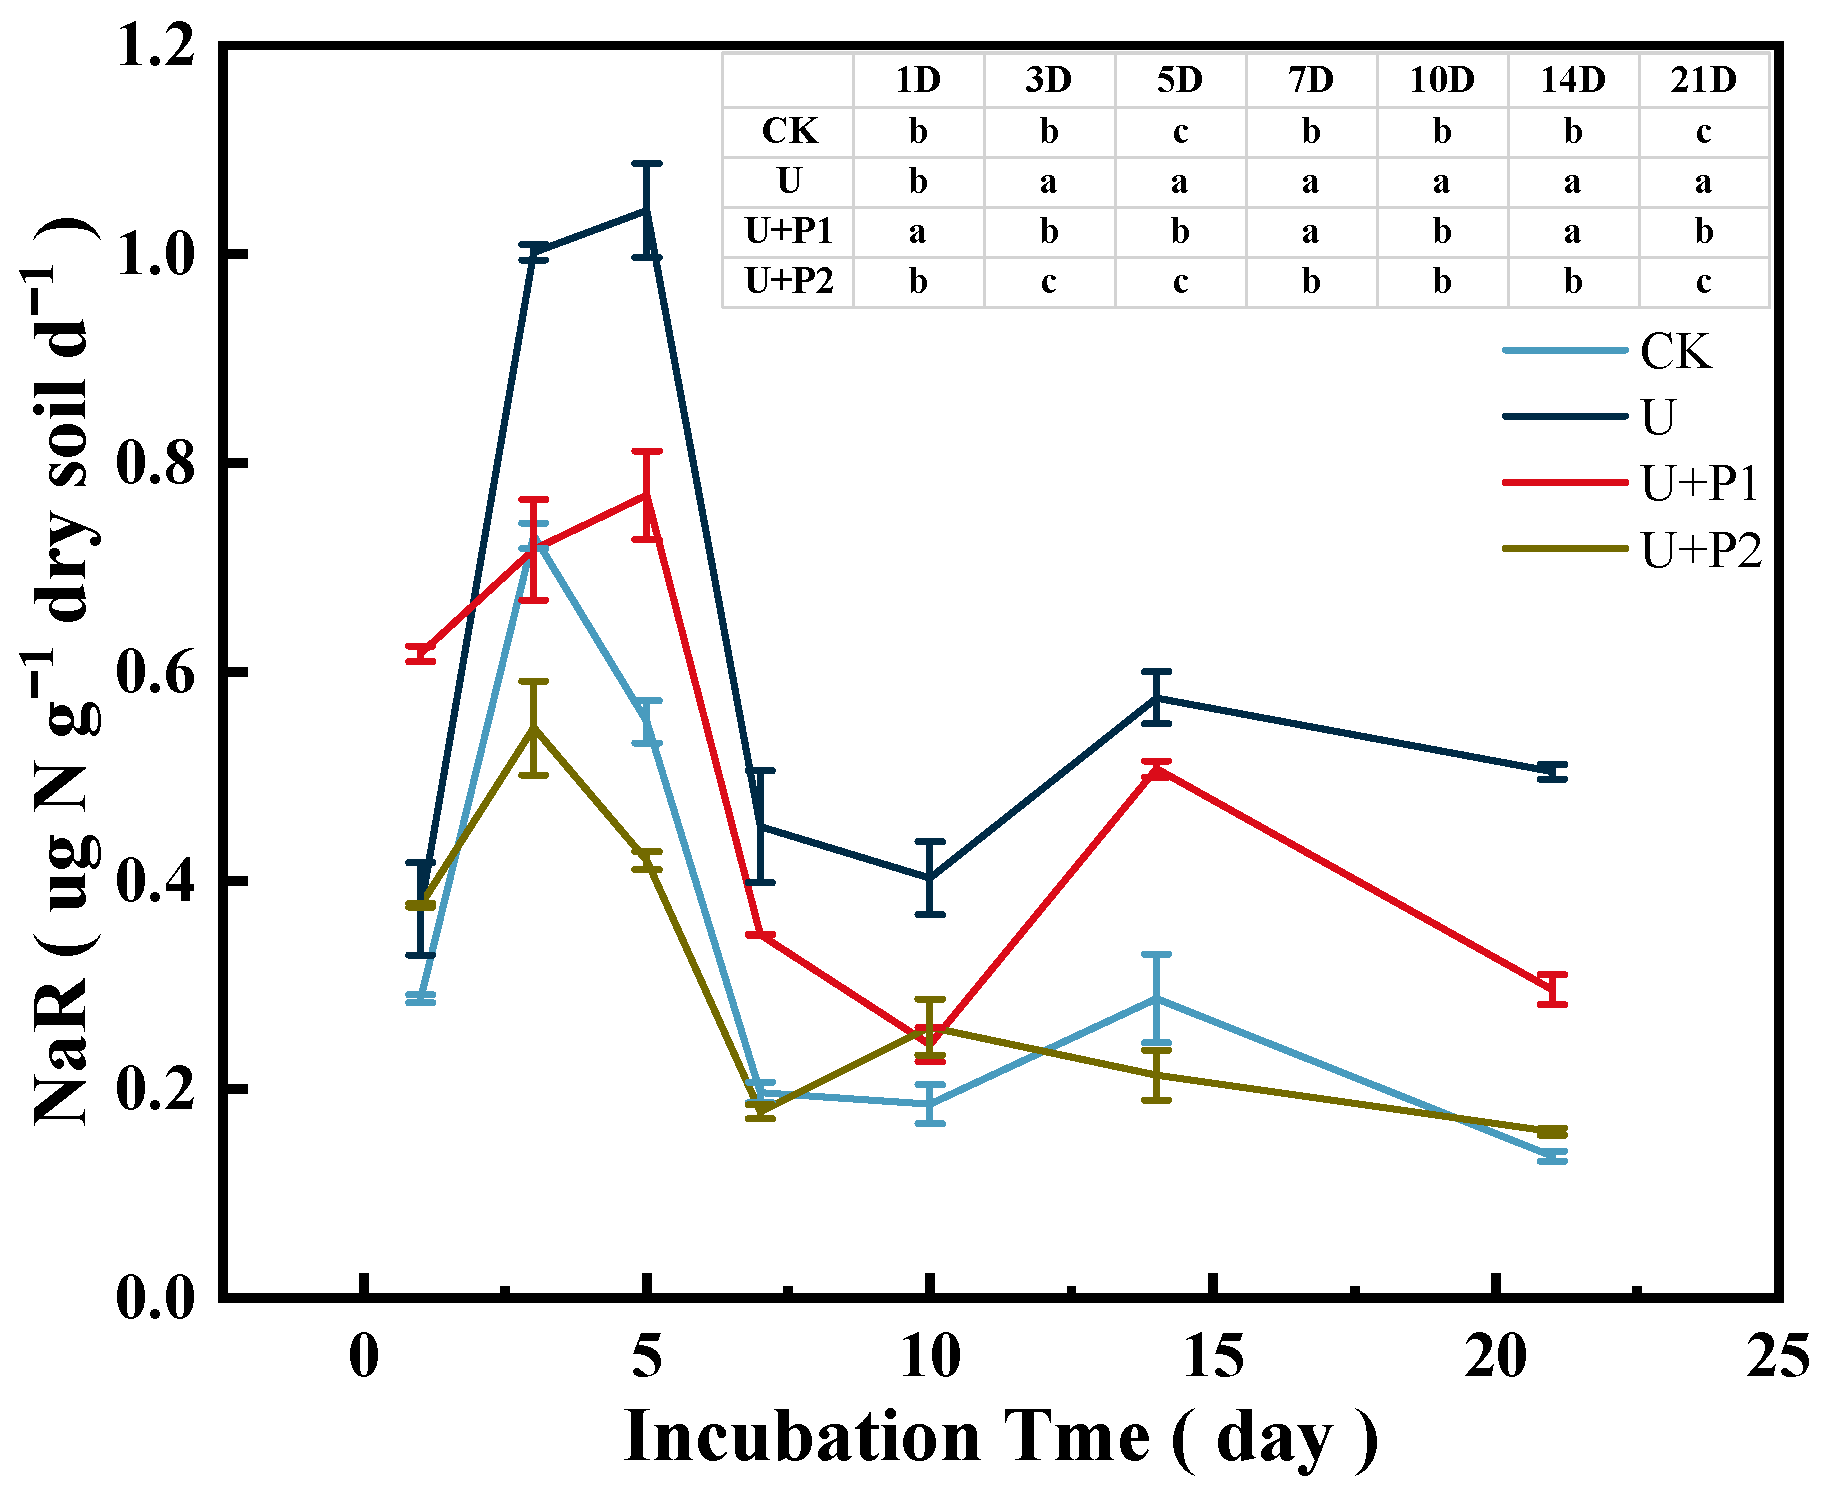
As shown in Figure 3, soil NaR activity during the incubation experiment ranged from 0.16–1.12 µg N g−1 dry soil d−1, showing a trend of first increasing and then decreasing. CK and U+P2 treatments peaked on day 3 at 0.73 and 0.55 µg N g−1 dry soil d−1, respectively. U and U+P1 treatments peaked on day 5 at 1.04 and 0.77 µg N g−1 dry soil d−1, respectively. Proanthocyanidins significantly inhibited soil NaR activity (p < 0.05), and the inhibitory effect was stronger with increasing proanthocyanidins dosage. When the application amount of proanthocyanidins was 2 mg g−1 dry soil, the soil NaR activity was consistent with that of the CK treatment.

Figure 3.
Effect of proanthocyanidin application on soil NaR activity. No urea control check (CK), addition of urea (U), addition of urea and 1 mg of proanthocyanidins g−1 dry soil (U+P1), and addition of urea and 2 mg of proanthocyanidins g−1 dry soil (U+P2). Bars represent the mean ± standard error (n = 3). Different lowercase letters in the table indicate significant differences (p < 0.05).
3.3. Effects of Procyanidins on NH4+-N and NO3−-N in Paddy Soil
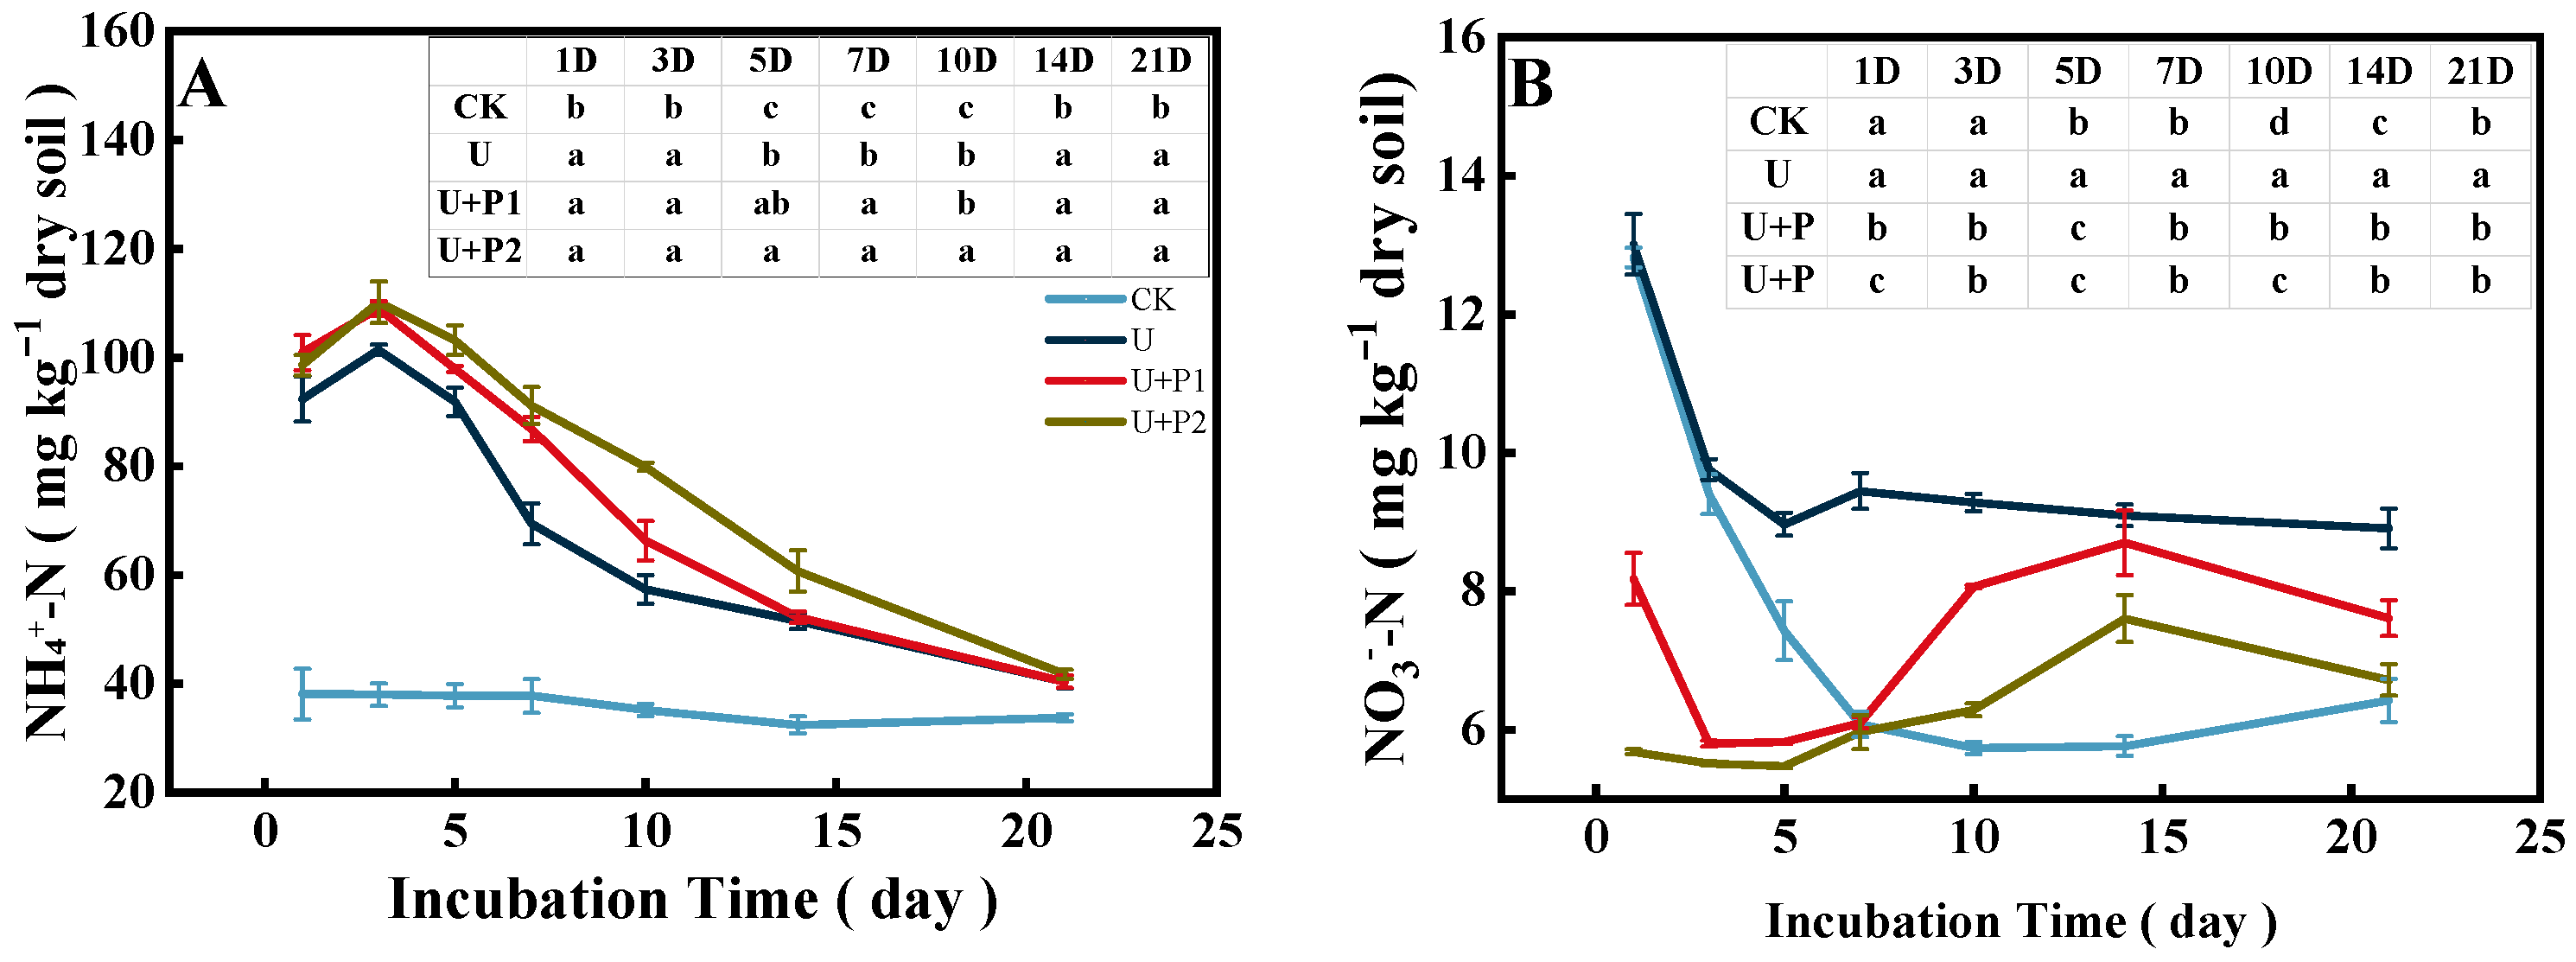
The soil NH4+-N content ranged from 30.17–117.57 mg kg−1 (Figure 4A). Except for the CK treatment, the soil NH4+-N content in the other three treatments reached a peak on the 3rd day and then decreased rapidly, and there was no significant difference in soil NH4+-N content on the 21st day. Compared with U, the soil NH4+-N content was higher after proanthocyanidins were added, and U+P2 promoted soil NH4+-N content more than U+P1 (p < 0.05).

Figure 4.
Effect of proanthocyanidin application on soil NH4+-N (A) and NO3−-N (B). No urea control check (CK), addition of urea (U), addition of urea and 1 mg of proanthocyanidins g−1 dry soil (U+P1), and addition of urea and 2 mg of proanthocyanidins g−1 dry soil (U+P2). Bars represent the mean ± standard error (n = 3). Different lowercase letters in the table indicate significant differences (p < 0.05).
The soil NO3−-N content in the paddy soil ranged from 5.43 to 13.62 mg kg−1 (Figure 4B). With an increase in incubation time, soil NO3−-N content decreased rapidly in CK and U and tended to be stable, while in U+P1 and U+P2, it first decreased, then increased, and then decreased. After the application of proanthocyanidins, soil NO3−-N content increased rapidly after the 5th day and reached its peak value on the 14th day, but the soil NO3−-N content was significantly lower than that of the U treatment (p < 0.05).
3.4. Abundance of N-Transforming Functional Genes
On the first day of the incubation experiment, the abundance of the AOA amoA gene in the U+P1 treatment was significantly higher than that in the other three treatments (p < 0.05, Figure 5A). On day 3, the abundance of the AOA amoA gene in the U treatment was the highest and significantly higher than that in the other three treatments (p < 0.05), while the abundance of the AOA amoA gene in the U+P1 treatment was the lowest and significantly lower than that in the other three treatments (p < 0.05). There was no significant difference in AOA amoA gene abundance between the treatments on days 5 and 7.

Figure 5.
Effect of proanthocyanidin application on the abundance of AOA amoA (A), AOB amoA (B), nirS (C), and nirK (D) genes in soil. No urea control check (CK), addition of urea (U), addition of urea and 1 mg of proanthocyanidins g−1 dry soil (U+P1), and addition of urea and 2 mg of proanthocyanidins g−1 dry soil (U+P2). Bars represent the mean ± standard error (n = 3). Different lowercase letters within the treatments indicate significant differences (p < 0.05).
On days 1 and 7 of the incubation experiment, there was no significant difference in AOB amoA gene abundance among the treatments (Figure 5B). On day 3, the abundance of the AOB amoA gene in the U and U+P2 treatments was significantly higher than that in the CK and U+P1 treatments (p < 0.05). On day 5, the abundance of the AOB amoA gene was the highest in the U treatment, followed by U+P1 and U+P2 treatments, and the lowest in the CK treatment (p < 0.05).
Urea application (U) significantly increased the abundance of nirS genes on days 3 and 5 of the incubation experiment (p < 0.05, Figure 5C). The addition of proanthocyanidins significantly inhibited the abundance of nirS genes, and there was a significant dose-response relationship; that is, the inhibitory effect was enhanced with an increase in dosage (p < 0.05, Figure 5C).
Similarly, urea application (U) significantly increased nirK gene abundance on days 3 and 5 of the incubation experiment but decreased nirK gene abundance on day 7 (p < 0.05, Figure 5D). The addition of proanthocyanidins significantly inhibited the abundance of the nirK gene and also had a significant dose-response relationship, especially on days 5 and 7 of the incubation experiment (Figure 5D).
3.5. Relationship of N2O Flux to Soil Properties and Microorganisms
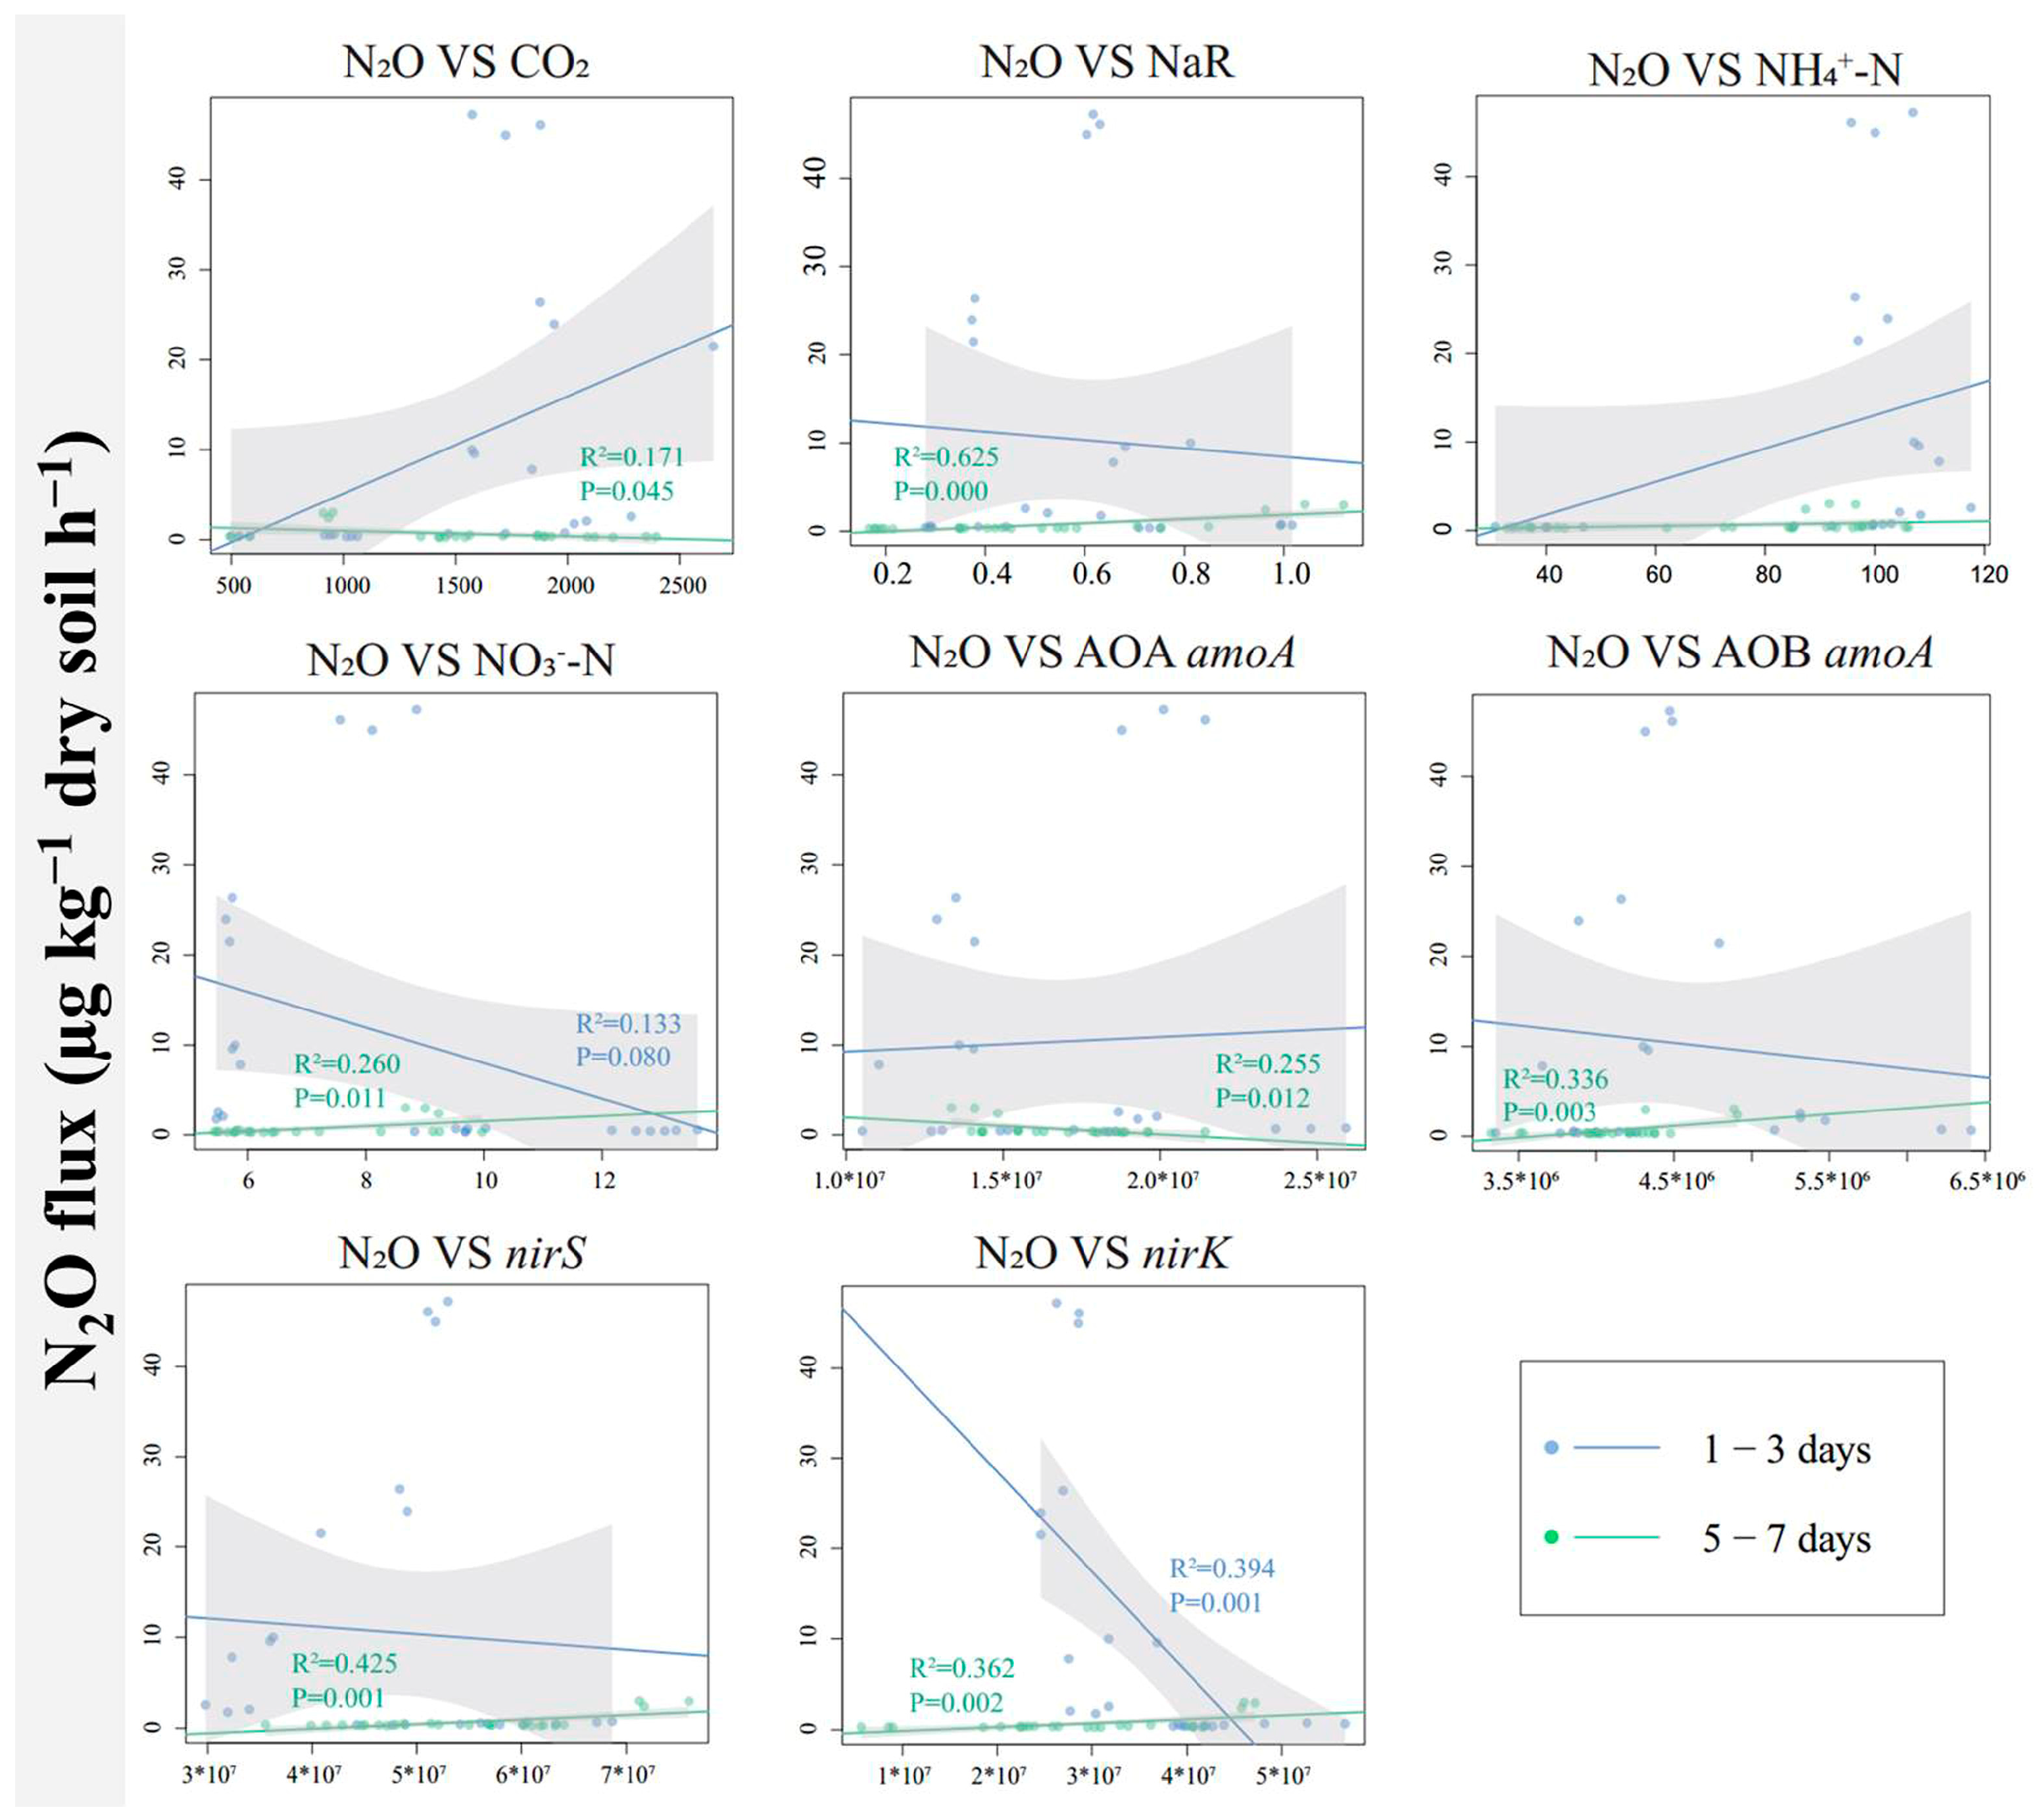
Linear regression was used to explore the potential relationships between N2O flux and soil properties, NaR activity, and the abundance of associated functional genes (Figure 6). There was a significant negative correlation between N2O flux and nirK gene abundance on days 1–3 of the incubation experiment. On days 5–7, N2O flux was negatively correlated with microbial respiration (CO2 flux) and AOA amoA gene abundance but positively correlated with soil NaR activity, soil NO3−-N content, AOB amoA gene abundance, nirS gene abundance, and nirK gene abundance.

Figure 6.
The linear regression relationship between N2O flux and microbial respiration, NaR activity, soil NH4+-N, soil NO3−-N, or between N2O flux and the abundance of functional genes related to N2O emissions. Only those with a correlation of p < 0.05 are listed. The shaded area represents a 95% confidence interval.
4. Discussion
In this study, the addition of urea significantly promoted N2O emissions, which is consistent with previous studies [3,6,10]. The addition of urea promoted soil microbial activity (Figure 1B, with a significant increase in CO2 emissions), NaR activity (Figure 3) and increased the abundance of ammonia-oxidizing and denitrifying bacterial communities, including ammonia-oxidizing archaea and ammonia-oxidizing bacteria containing amoA, as well as denitrifying bacteria containing nirS- and nirK- (Figure 5). AOA amoA, AOB amoA, and denitrifying bacteria containing nirS- and nirK- are closely related to soil N2O production [25,26].
Compared with urea application alone, the addition of proanthocyanidins in the first three days of the incubation experiment promoted the production of N2O in paddy soil, which was inconsistent with a previous study in which the addition of procyanidins inhibited the production of N2O in soil [14,27]. This may be due to several reasons.
(1) The paddy soil used in this study was in a flooded state, and proanthocyanidins have extremely strong water solubility [15], which may have weakened their denitrification inhibition ability. In our study, we also found that on the first day of the incubation experiment, the NaR activity of the U+P1 treatment was higher than that of the U treatment (Figure 3), and the soil NO3−-N content of U+P1 decreased rapidly from 1 to 3 days of the incubation experiment (Figure 4B), while the inhibitory effect of U+P2 on NaR activity was better than that of U+P1 (Figure 3). Therefore, the inhibitory effect of proanthocyanidins on soil denitrification shows a dose-response relationship; that is, the application of proanthocyanidins in paddy soil may require higher doses.
(2) Oxygen was still present in the soil pores during the early stage of the incubation experiment. Soil heterogeneity allows for the coexistence of aerobic and anaerobic regions [28], resulting in nitrification being an important process for the generation of N2O in addition to denitrification [7,29]. The addition of proanthocyanidins, due to the input of a large amount of activated carbon, stimulated the nitrification process to produce more N2O. In this study, the addition of proanthocyanidins promoted the abundance of AOA amoA, which supported this point. Starting from the 7th day of the incubation experiment, all treatments had extremely low and almost no difference in N2O emissions, which may be due to the decrease in NO3−-N content and O2 depletion, where N2O acts as an electron acceptor and is reduced to N2 [23,29]. Therefore, the application of proanthocyanidins in paddy fields may need to be performed at an appropriate time (for example, three days after flooding).
(3) The proanthocyanidins used in this study not only contain procyanidins but also easily decomposable carbon sources, such as gallic acid, catechins, and epicatechins. At low concentrations, these substances have almost no antibacterial activity [16] and may promote microbial growth (Figure 1B, with a significant increase in CO2 emissions). This intensified urea decomposition, providing more substrates for the nitrification process (Figure 4A, with a significant increase in soil NH4+-N content), thereby promoting the generation of N2O [30]. Therefore, considering the economic cost, more effective proanthocyanidins should be screened, and it is necessary to further explore the contributions of different pathways (four pathways: nitrifier nitrification (NN), nitrifier denitrification (ND), nitrification-coupled denitrification (NCD), and heterotrophic denitrification (HD)) to N2O production under the application of proanthocyanidins [29], which is conducive to formulating more reasonable application strategies for proanthocyanidins, such as combined application with urease inhibitors and/or nitration inhibitors.
Starting from the fifth day of the incubation experiment, the addition of proanthocyanidins significantly inhibited the N2O emissions. This might be due to oxygen depletion and denitrification in the paddy soil [29]. The addition of proanthocyanidins inhibited NaR activity (Figure 3) and the abundance of nirS and nirK genes (Figure 5). While NaR activity, the abundances of nirS and nirK genes were highly positively correlated with N2O production (Figure 6, [17]), thus reducing N2O production.
Throughout the entire incubation period, the addition of proanthocyanidins resulted in higher soil NH4+-N content and lower soil NO3−-N content than the application of urea alone. This might be because the application of proanthocyanidins inhibited denitrification, enhanced the immobilization of soil NO3−-N by microorganisms [31], and the process of dissimilatory NO3−-N reduction to NH4+-N (Figure 4A, [32]), and ultimately increased soil N [17]. After the 5th day of the incubation experiment, the soil NO3−-N content in the paddy soil with the addition of proanthocyanidins increased significantly. This might be due to the fact that the soil denitrification process dominated during this period [29], while proanthocyanidins inhibited soil denitrification, resulting in an increase in soil NO3−-N concentration [23,33].
5. Conclusions
Our study shows that the application of proanthocyanidins to paddy soils in Northeast China can inhibit soil denitrification, primarily by inhibiting NaR activity and the growth of nirS- and nirK-type denitrifying bacteria. The inhibitory effect of proanthocyanidins on soil denitrification was dose-dependent; that is, the inhibitory effect of soil denitrification was enhanced by an increase in the amount of proanthocyanidins. In addition, proanthocyanidins can increase the soil NH4+-N content and N2O production in the first three days of the culture test and promote the abundance of the AOA amoA gene, which may be related to the nitrification process of paddy soil. Therefore, in future field practices, proanthocyanidins should be applied in combination with urease and nitration inhibitors, and the application time of proanthocyanidins should be determined to achieve more effective field N management. This study is helpful for the application of proanthocyanidins in paddy fields.
Supplementary Materials
The following supporting information can be downloaded at: https://www.mdpi.com/article/10.3390/microorganisms13061232/s1, Table S1: Primer sequences of some key N cycling genes used for real time PCR [5,34,35].
Author Contributions
Conceptualization, L.W., K.W. and L.Z.; funding acquisition, L.Z.; methodology, L.W., F.X., P.G. and Z.W.; project administration, L.W. and K.W.; validation, Y.X., Y.S. and R.W.; writing—original draft, L.W. and K.W.; writing—review and editing, L.Z. All authors have read and agreed to the published version of the manuscript.
Funding
This work was funded by the National Key Research and Development Program of China (grant number 2023YFD1500500).
Institutional Review Board Statement
Not applicable.
Informed Consent Statement
Not applicable.
Data Availability Statement
All relevant data are included in this article.
Acknowledgments
The authors thank the editors and reviewers for their constructive feedback and suggestions.
Conflicts of Interest
The authors declare no conflicts of interest.
References
- Zhou, S.; Sun, H.; Bi, J.; Zhang, J.; Riya, S.; Hosomi, M. Effect of water-saving irrigation on the N2O dynamics and the contribution of exogenous and endogenous nitrogen to N2O production in paddy soil using 15N tracing. Soil Till. Res. 2020, 200, 104610. [Google Scholar] [CrossRef]
- Chang, N.; Zhai, Z.; Li, H.; Wang, L.; Deng, J. Impacts of nitrogen management and organic matter application on nitrous oxide emissions and soil organic carbon from spring maize fields in the North China Plain. Soil Till. Res. 2020, 196, 104441. [Google Scholar] [CrossRef]
- Bell, M.J.; Hinton, N.; Cloy, J.M.; Topp, C.F.E.; Rees, R.M.; Cardenas, L.; Scott, T.; Webster, C.; Ashton, R.W.; Whitmore, A.P.; et al. Nitrous oxide emissions from fertilised UK arable soils: Fluxes, emission factors and mitigation. Agric. Ecosyst. Environ. 2015, 212, 134–147. [Google Scholar] [CrossRef]
- Aliyu, G.; Luo, J.; Di, H.J.; Lindsey, S.; Liu, D.; Yuan, J.; Chen, Z.; Lin, Y.; He, T.; Zaman, M.; et al. Nitrous oxide emissions from China’s croplands based on regional and crop-specific emission factors deviate from IPCC 2006 estimates. Sci. Total Environ. 2019, 669, 547–558. [Google Scholar] [CrossRef]
- Wang, Q.; Hu, H.W.; Shen, J.P.; Du, S.; Zhang, L.M.; He, J.Z.; Han, L.L. Effects of the nitrification inhibitor dicyandiamide (DCD) on N2O emissions and the abundance of nitrifiers and denitrifiers in two contrasting agricultural soils. J. Soil. Sediment. 2017, 17, 1635–1643. [Google Scholar] [CrossRef]
- Gao, J.; Xie, Y.; Jin, H.; Liu, Y.; Bai, X.; Ma, D.; Zhu, Y.; Wang, C.; Guo, T. Nitrous Oxide Emission and Denitrifier Abundance in Two Agricultural Soils Amended with Crop Residues and Urea in the North China Plain. PLoS ONE 2016, 11, e0154773. [Google Scholar] [CrossRef] [PubMed]
- Wu, K.K.; Gong, P.; Bai, W.; Zhang, Z.; Wei, Z.B.; Yu, C.X.; Song, Y.C.; Xue, Y.; Zhang, L.L. Effect of mixed inhibitor application on N2O production pathways in paddy soil. J. Soil. Sediment. 2022, 22, 1913–1923. [Google Scholar] [CrossRef]
- Li, J.; Wang, S.; Luo, J.; Zhang, L.; Wu, Z.; Lindsey, S. Effects of biochar and 3,4-dimethylpyrazole phosphate (DMPP) on soil ammonia-oxidizing bacteria and nosZ-N2O reducers in the mitigation of N2O emissions from paddy soils. J. Soil. Sediment. 2020, 21, 1089–1098. [Google Scholar] [CrossRef]
- Liao, B.; Wu, X.; Yu, Y.; Luo, S.; Hu, R.; Lu, G. Effects of mild alternate wetting and drying irrigation and mid-season drainage on CH4 and N2O emissions in rice cultivation. Sci. Total Environ. 2020, 698, 134212. [Google Scholar] [CrossRef]
- Wei, H.; Li, Y.; Zhu, K.; Ju, X.; Wu, D. The divergent role of straw return in soil O2 dynamics elucidates its confounding effect on soil N2O emission. Soil Biol. Biochem. 2024, 199, 109620. [Google Scholar] [CrossRef]
- Wang, W.; Li, Y.; Wang, W.; Ding, K.; Zhang, K.; Zhang, Y.; Liu, K.; Li, J.; Li, D.; Lian, R.; et al. Global Meta-Analysis of Individual and Combined Nitrogen Inhibitors: Enhancing Plant Productivity and Reducing Environmental Losses. Global Change Biol. 2024, 30, e70007. [Google Scholar] [CrossRef] [PubMed]
- Wu, K.; Gong, P.; Zhang, L.; Wu, Z.; Xie, X.; Yang, H.; Li, W.; Song, Y.; Li, D. Yield-scaled N2O and CH4 emissions as affected by combined application of stabilized nitrogen fertilizer and pig manure in rice fields. Plant Soil Environ. 2019, 65, 497–502. [Google Scholar] [CrossRef]
- Wang, S.; Li, J.; Wang, W.; Zhang, L.; Wu, Z. Chamomile plant material effects on soil nitrogen dynamics and ammonia-oxidizers to mitigate greenhouse gas emissions from maize fields. Agric. Ecosyst. Environ. 2023, 341, 108206. [Google Scholar] [CrossRef]
- Ye, M.; Yin, C.; Fan, X.; Gao, Z.; Chen, H.; Tan, L.; Chang, S.X.; Zhao, Y.; Liang, Y. Procyanidin inhibited N2O emissions from paddy soils by affecting nitrate reductase activity and nirS- and nirK-denitrifier populations. Biol. Fert. Soils 2021, 57, 935–947. [Google Scholar] [CrossRef]
- Bardon, C.; Piola, F.; Bellvert, F.; Haichar, F.E.Z.; Comte, G.; Meiffren, G.; Pommier, T.; Puijalon, S.; Tsafack, N.; Poly, F. Evidence for biological denitrification inhibition (BDI) by plant secondary metabolites. New Phytol. 2014, 204, 620–630. [Google Scholar] [CrossRef]
- Bardon, C.; Piola, F.; Haichar Fel, Z.; Meiffren, G.; Comte, G.; Missery, B.; Balby, M.; Poly, F. Identification of B-type procyanidins in Fallopia spp. involved in biological denitrification inhibition. Environ. Microbiol. 2016, 18, 644–655. [Google Scholar] [CrossRef]
- Ye, M.; Zheng, W.; Yin, C.; Fan, X.; Chen, H.; Gao, Z.; Zhao, Y.; Liang, Y. The inhibitory efficacy of procyanidin on soil denitrification varies with N fertilizer type applied. Sci. Total Environ. 2022, 806, 150588. [Google Scholar] [CrossRef] [PubMed]
- Fan, X.; Yin, C.; Chen, H.; Ye, M.; Zhao, Y.; Li, T.; Wakelin, S.A.; Liang, Y. The efficacy of 3,4-dimethylpyrazole phosphate on N2O emissions is linked to niche differentiation of ammonia oxidizing archaea and bacteria across four arable soils. Soil Biol. Biochem. 2019, 130, 82–93. [Google Scholar] [CrossRef]
- You, L.; Ros, G.H.; Chen, Y.; Yang, X.; Cui, Z.; Liu, X.; Jiang, R.; Zhang, F.; de Vries, W. Global meta-analysis of terrestrial nitrous oxide emissions and associated functional genes under nitrogen addition. Soil Biol. Biochem. 2022, 165, 108523. [Google Scholar] [CrossRef]
- Bardon, C.; Poly, F.; Piola, F.; Pancton, M.; Comte, G.; Meiffren, G.; Haichar, F.E.Z. Mechanism of biological denitrification inhibition: Procyanidins induce an allosteric transition of the membrane-bound nitrate reductase through membrane alteration. FEMS Microbiol. Ecol. 2016, 92, fiw034. [Google Scholar] [CrossRef]
- Hsiao, C.J.; Frie, A.; Mitchell, S.; Venterea, R.; Griffis, T. Efficacy of grape seed procyanidins for inhibiting denitrification varies by source, soil texture, and cropping history. Appl. Soil Ecol. 2024, 195, 105254. [Google Scholar] [CrossRef]
- Galland, W.; Haichar, F.e.Z.; Czarnes, S.; Mathieu, C.; Demorge, J.L.; Simon, L.; Puijalon, S.; Piola, F. Biological inhibition of denitrification (BDI) in the field: Effect on plant growth in two different soils. Appl. Soil Ecol. 2021, 159, 103857. [Google Scholar] [CrossRef]
- Galland, W.; Piola, F.; Burlet, A.; Mathieu, C.; Nardy, M.; Poussineau, S.; Blazère, L.; Gervaix, J.; Puijalon, S.; Simon, L.; et al. Biological denitrification inhibition (BDI) in the field: A strategy to improve plant nutrition and growth. Soil Biol. Biochem. 2019, 136, 107513. [Google Scholar] [CrossRef]
- Wu, K.; Zhang, Z.; Feng, L.; Bai, W.; Feng, C.; Song, Y.; Gong, P.; Meng, Y.; Zhang, L. Effects of Corn Stalks and Urea on N2O Production from Corn Field Soil. Agronomy 2021, 11, 2009. [Google Scholar] [CrossRef]
- Fortuna, A.M.; Honeycutt, C.W.; Vandemark, G.; Griffin, T.S.; Larkin, R.P.; He, Z.; Wienhold, B.J.; Sistani, K.R.; Albrecht, S.L.; Woodbury, B.L.; et al. Links among nitrification, nitrifier communities, and edaphic properties in contrasting soils receiving dairy slurry. J. Environ. Qual. 2012, 41, 262–272. [Google Scholar] [CrossRef]
- Duan, Y.F.; Kong, X.W.; Schramm, A.; Labouriau, R.; Eriksen, J.; Petersen, S.O. Microbial N Transformations and N2O Emission after Simulated Grassland Cultivation: Effects of the Nitrification Inhibitor 3,4-Dimethylpyrazole Phosphate (DMPP). Appl. Environ. Microb. 2017, 83, e02019-16. [Google Scholar] [CrossRef]
- Bardon, C.; Poly, F.; Haichar, F.e.Z.; Le Roux, X.; Simon, L.; Meiffren, G.; Comte, G.; Rouifed, S.; Piola, F. Biological denitrification inhibition (BDI) with procyanidins induces modification of root traits, growth and N status in Fallopia x bohemica. Soil Biol. Biochem. 2017, 107, 41–49. [Google Scholar] [CrossRef]
- Mathieu, O.; Henault, C.; Leveque, J.; Baujard, E.; Milloux, M.J.; Andreux, F. Quantifying the contribution of nitrification and denitrification to the nitrous oxide flux using 15N tracers. Environ. Pollut. 2006, 144, 933–940. [Google Scholar] [CrossRef]
- Zhu, X.; Burger, M.; Doane, T.A.; Horwath, W.R. Ammonia oxidation pathways and nitrifier denitrification are significant sources of N2O and NO under low oxygen availability. Proc. Natl. Acad. Sci. USA 2013, 110, 6328–6333. [Google Scholar] [CrossRef]
- Di, H.J.; Cameron, K.C. Inhibition of ammonium oxidation by a liquid formulation of 3,4-Dimethylpyrazole phosphate (DMPP) compared with a dicyandiamide (DCD) solution in six new Zealand grazed grassland soils. J. Soil. Sediment. 2011, 11, 1032–1039. [Google Scholar] [CrossRef]
- Cheng, Y.; Wang, J.; Wang, J.; Chang, S.X.; Wang, S. The quality and quantity of exogenous organic carbon input control microbial NO3- immobilization: A meta-analysis. Soil Biol. Biochem. 2017, 115, 357–363. [Google Scholar] [CrossRef]
- Silver, W.L.; Herman, D.J.; Firestone, M.K. Dissimilatory nitrate reduction to ammonium in upland tropical forest soils. Ecology 2001, 82, 2410–2416. [Google Scholar] [CrossRef]
- Galland, W.; Piola, F.; Mathieu, C.; Bouladra, L.; Simon, L.; Haichar, F.e.Z. Does Biological Denitrification Inhibition (BDI) in the Field Induce an Increase in Plant Growth and Nutrition in Apium graveolens L. Grown for a Long Period? Microorganisms 2020, 8, 1204. [Google Scholar] [CrossRef]
- Shen, J.P.; Zhang, L.M.; Zhu, Y.G.; Zhang, J.B.; He, J.Z. Abundance and composition of ammonia-oxidizing bacteria and ammonia-oxidizing archaea communities of an alkaline sandy loam. Environ. Microbiol. 2008, 10, 1601–1611. [Google Scholar] [CrossRef] [PubMed]
- Di, H.J.; Cameron, K.C.; Podolyan, A.; Robinson, A. Effect of soil moisture status and a nitrification inhibitor, dicyandiamide, on ammonia oxidizer and denitrifier growth and nitrous oxide emissions in a grassland soil. Soil Biol. Biochem. 2014, 73, 59–68. [Google Scholar] [CrossRef]


Disclaimer/Publisher’s Note: The statements, opinions and data contained in all publications are solely those of the individual author(s) and contributor(s) and not of MDPI and/or the editor(s). MDPI and/or the editor(s) disclaim responsibility for any injury to people or property resulting from any ideas, methods, instructions or products referred to in the content. |
© 2025 by the authors. Licensee MDPI, Basel, Switzerland. This article is an open access article distributed under the terms and conditions of the Creative Commons Attribution (CC BY) license (https://creativecommons.org/licenses/by/4.0/).