
Age-Dependent Differences in Postprandial Bile-Acid Metabolism and the Role of the Gut Microbiome

 , , , , ,
Abstract
1. Introduction
2. Materials and Methods
2.1. Subjects
2.2. Mixed-Meal Test (MMT)
2.3. Laboratory Analysis
2.4. Statistical Analysis
3. Results
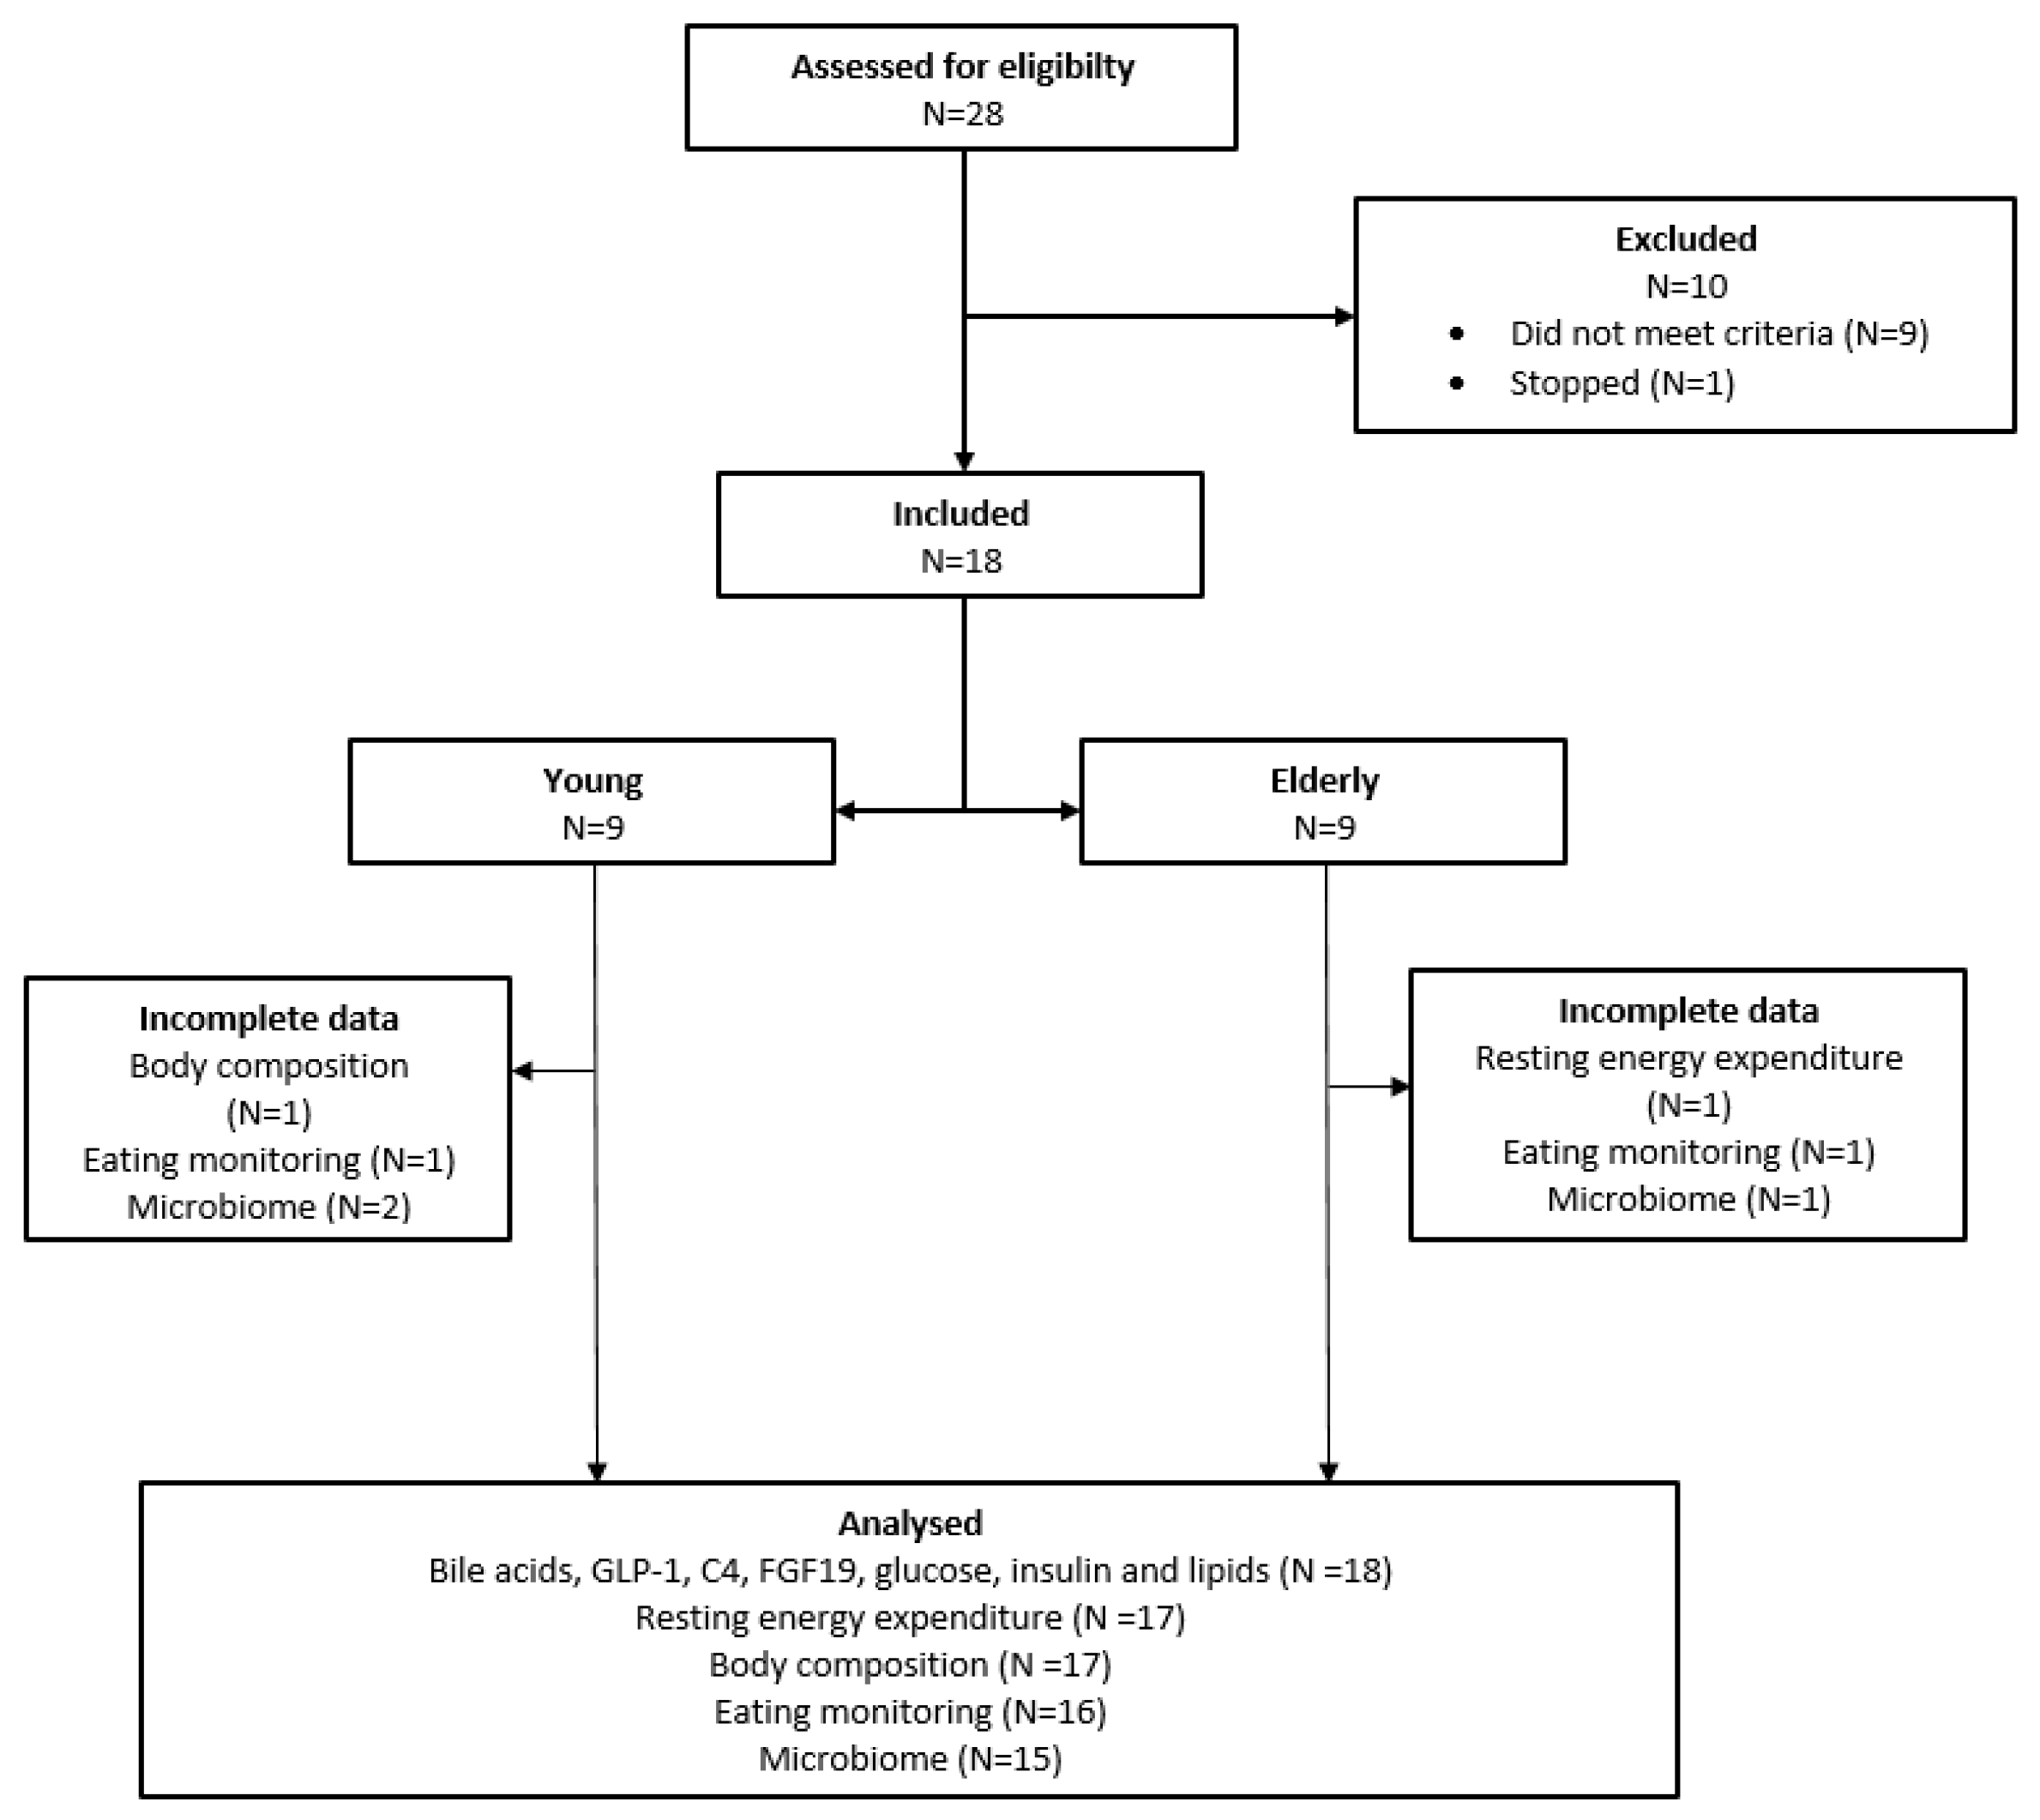
3.1. Study Population
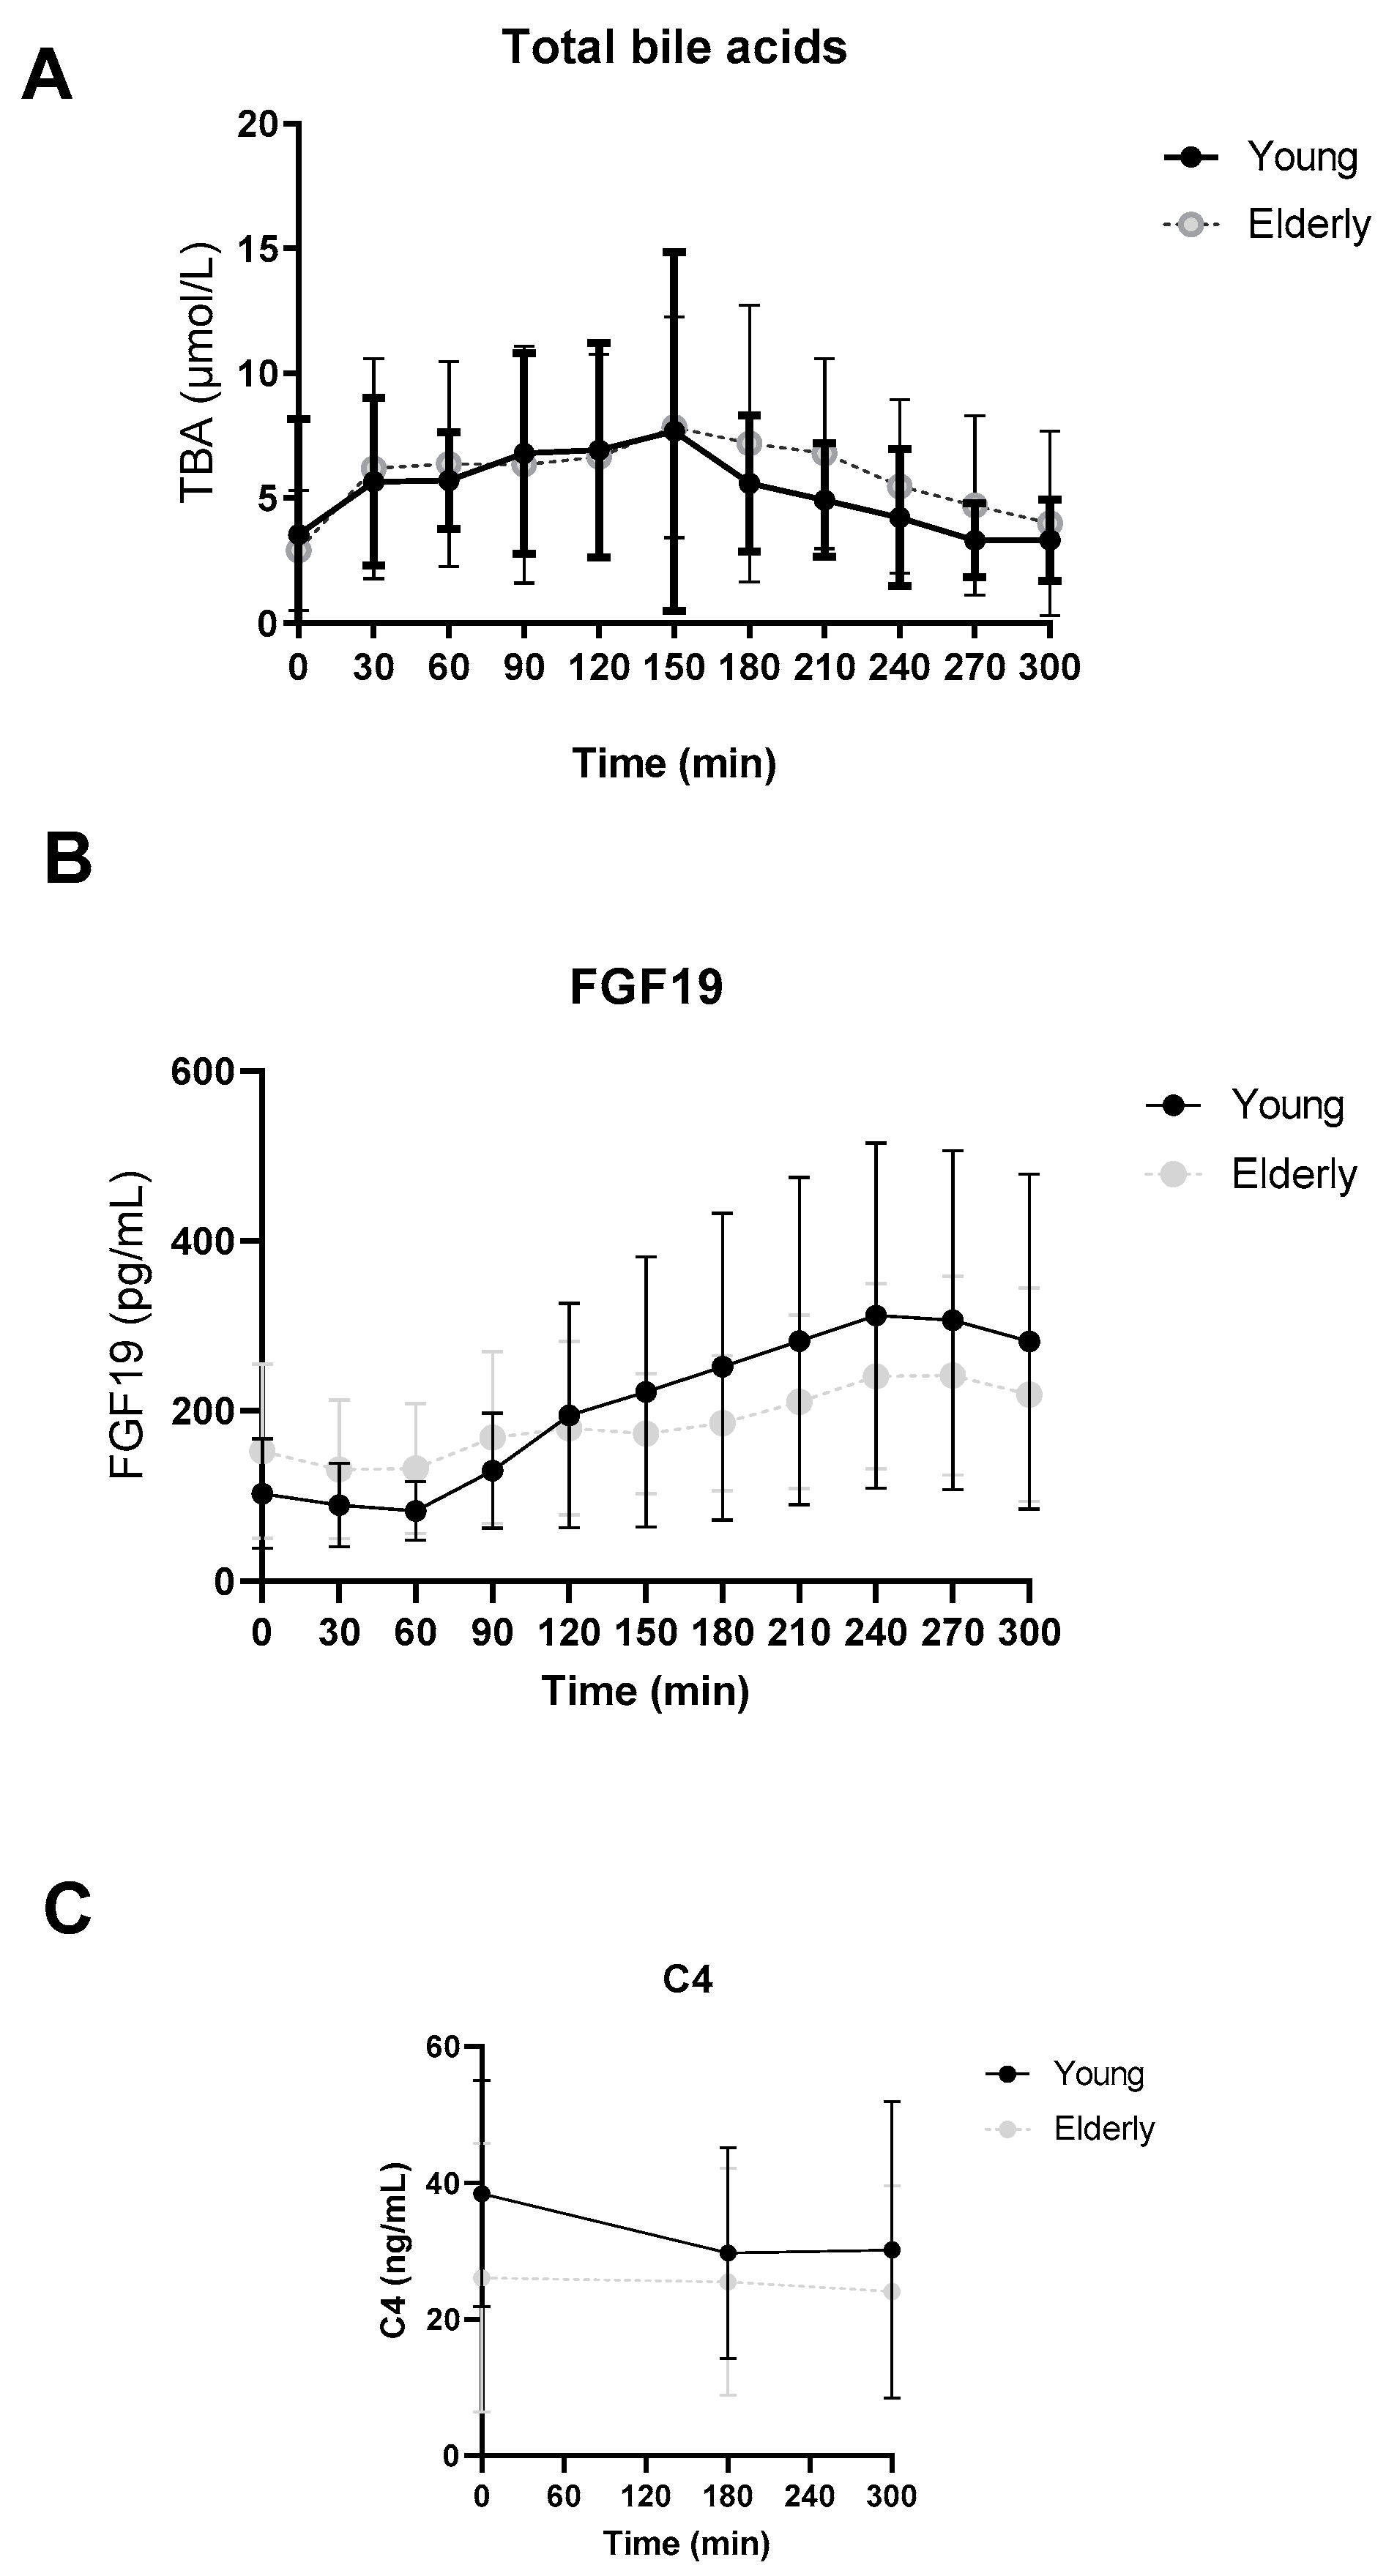
3.2. No Differences in Postprandial Total Bile Acid, FGF19 or C4 Levels between Young and Elderly
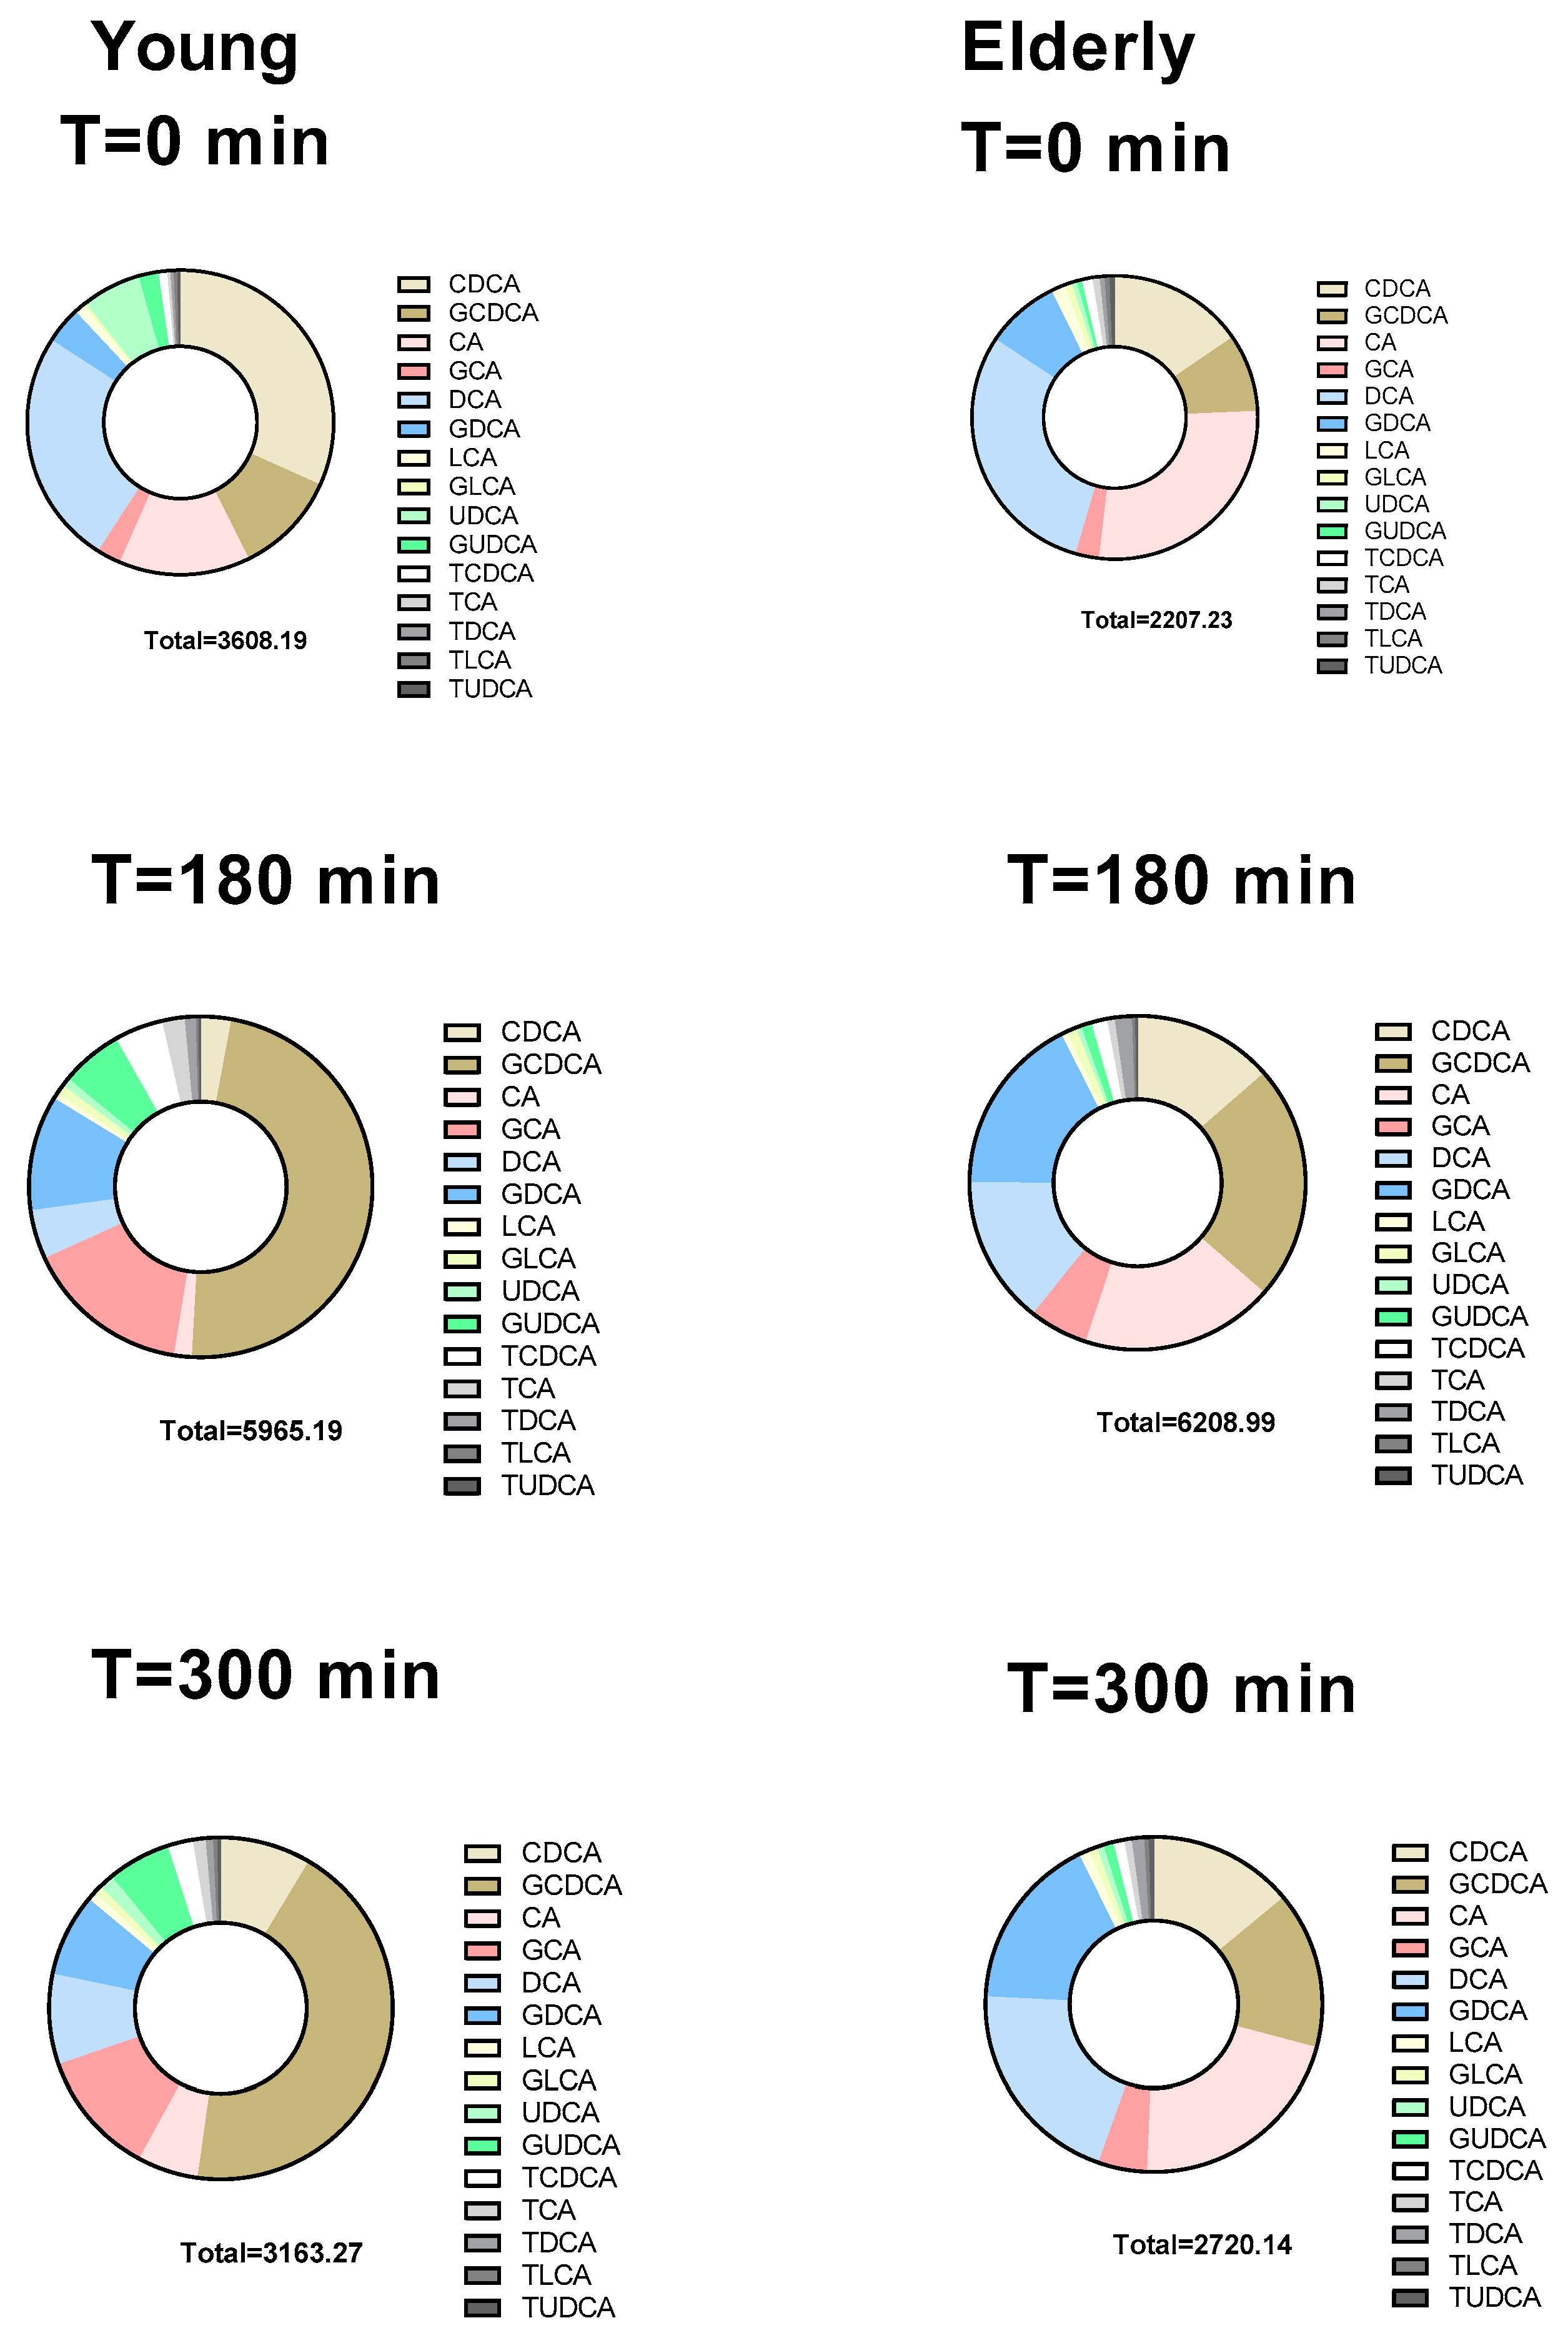
3.3. Individual BAs Levels Were Different between Young and Elderly
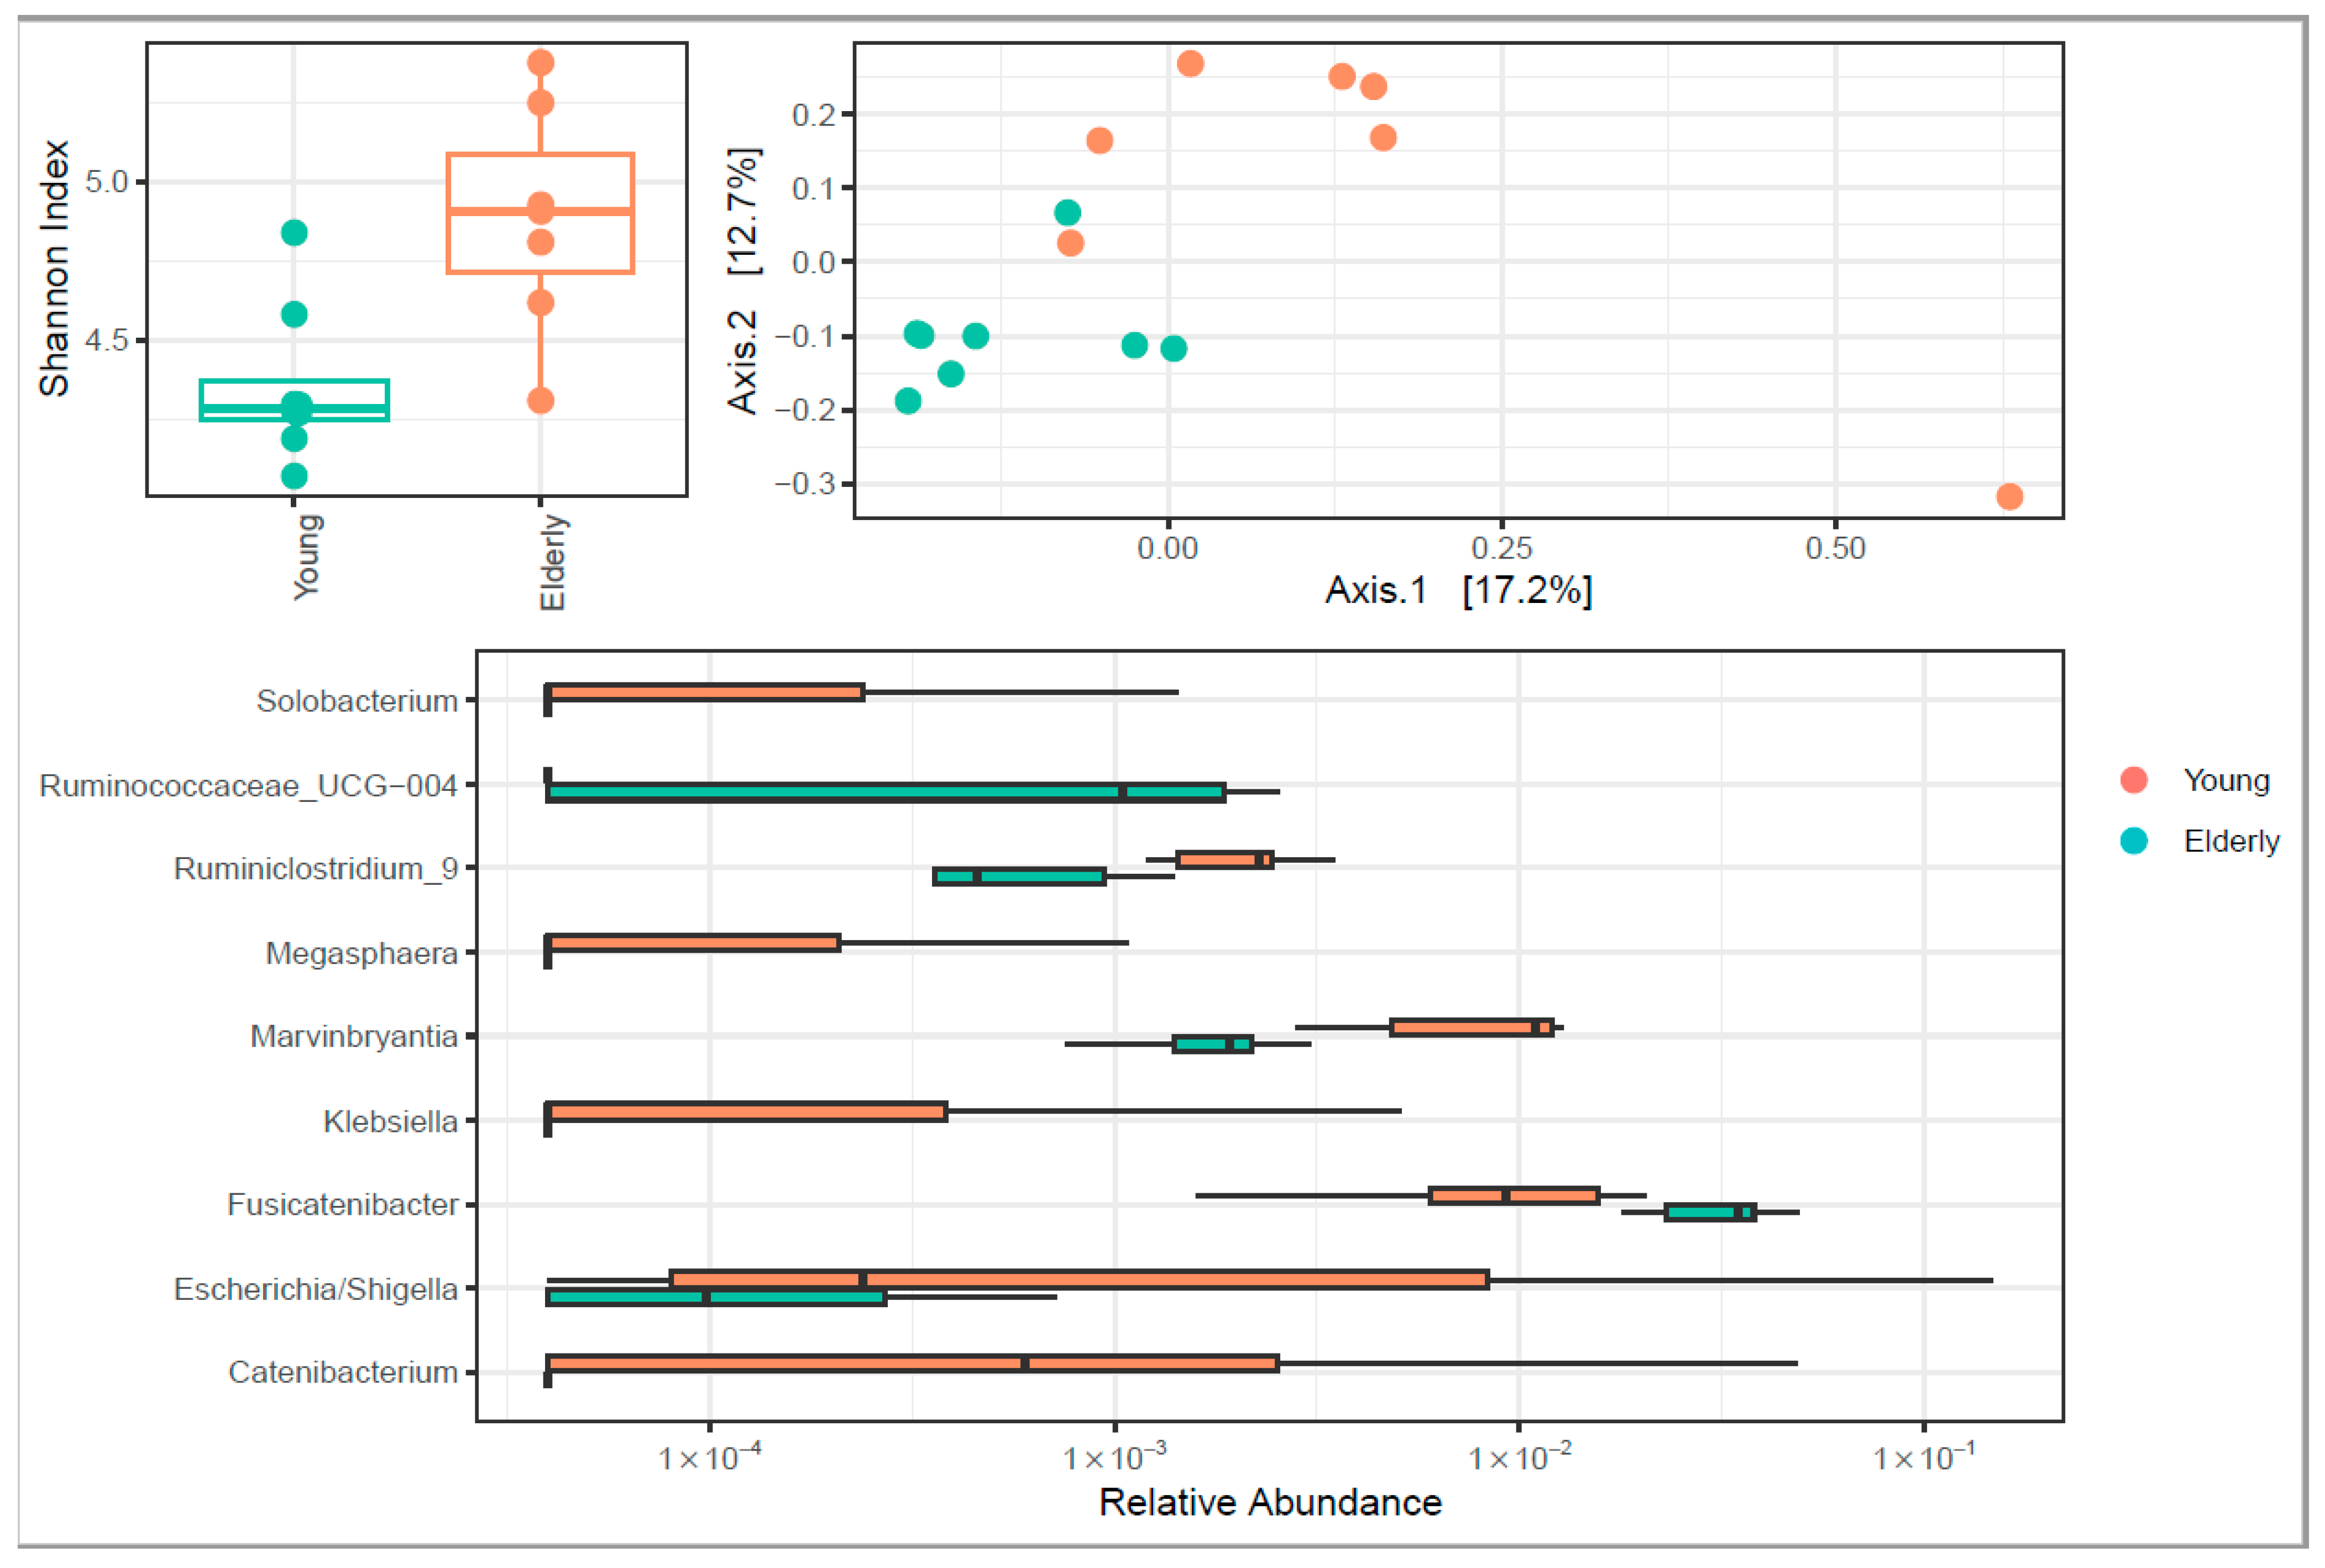
3.4. Microbiome Diversity Changed upon Ageing
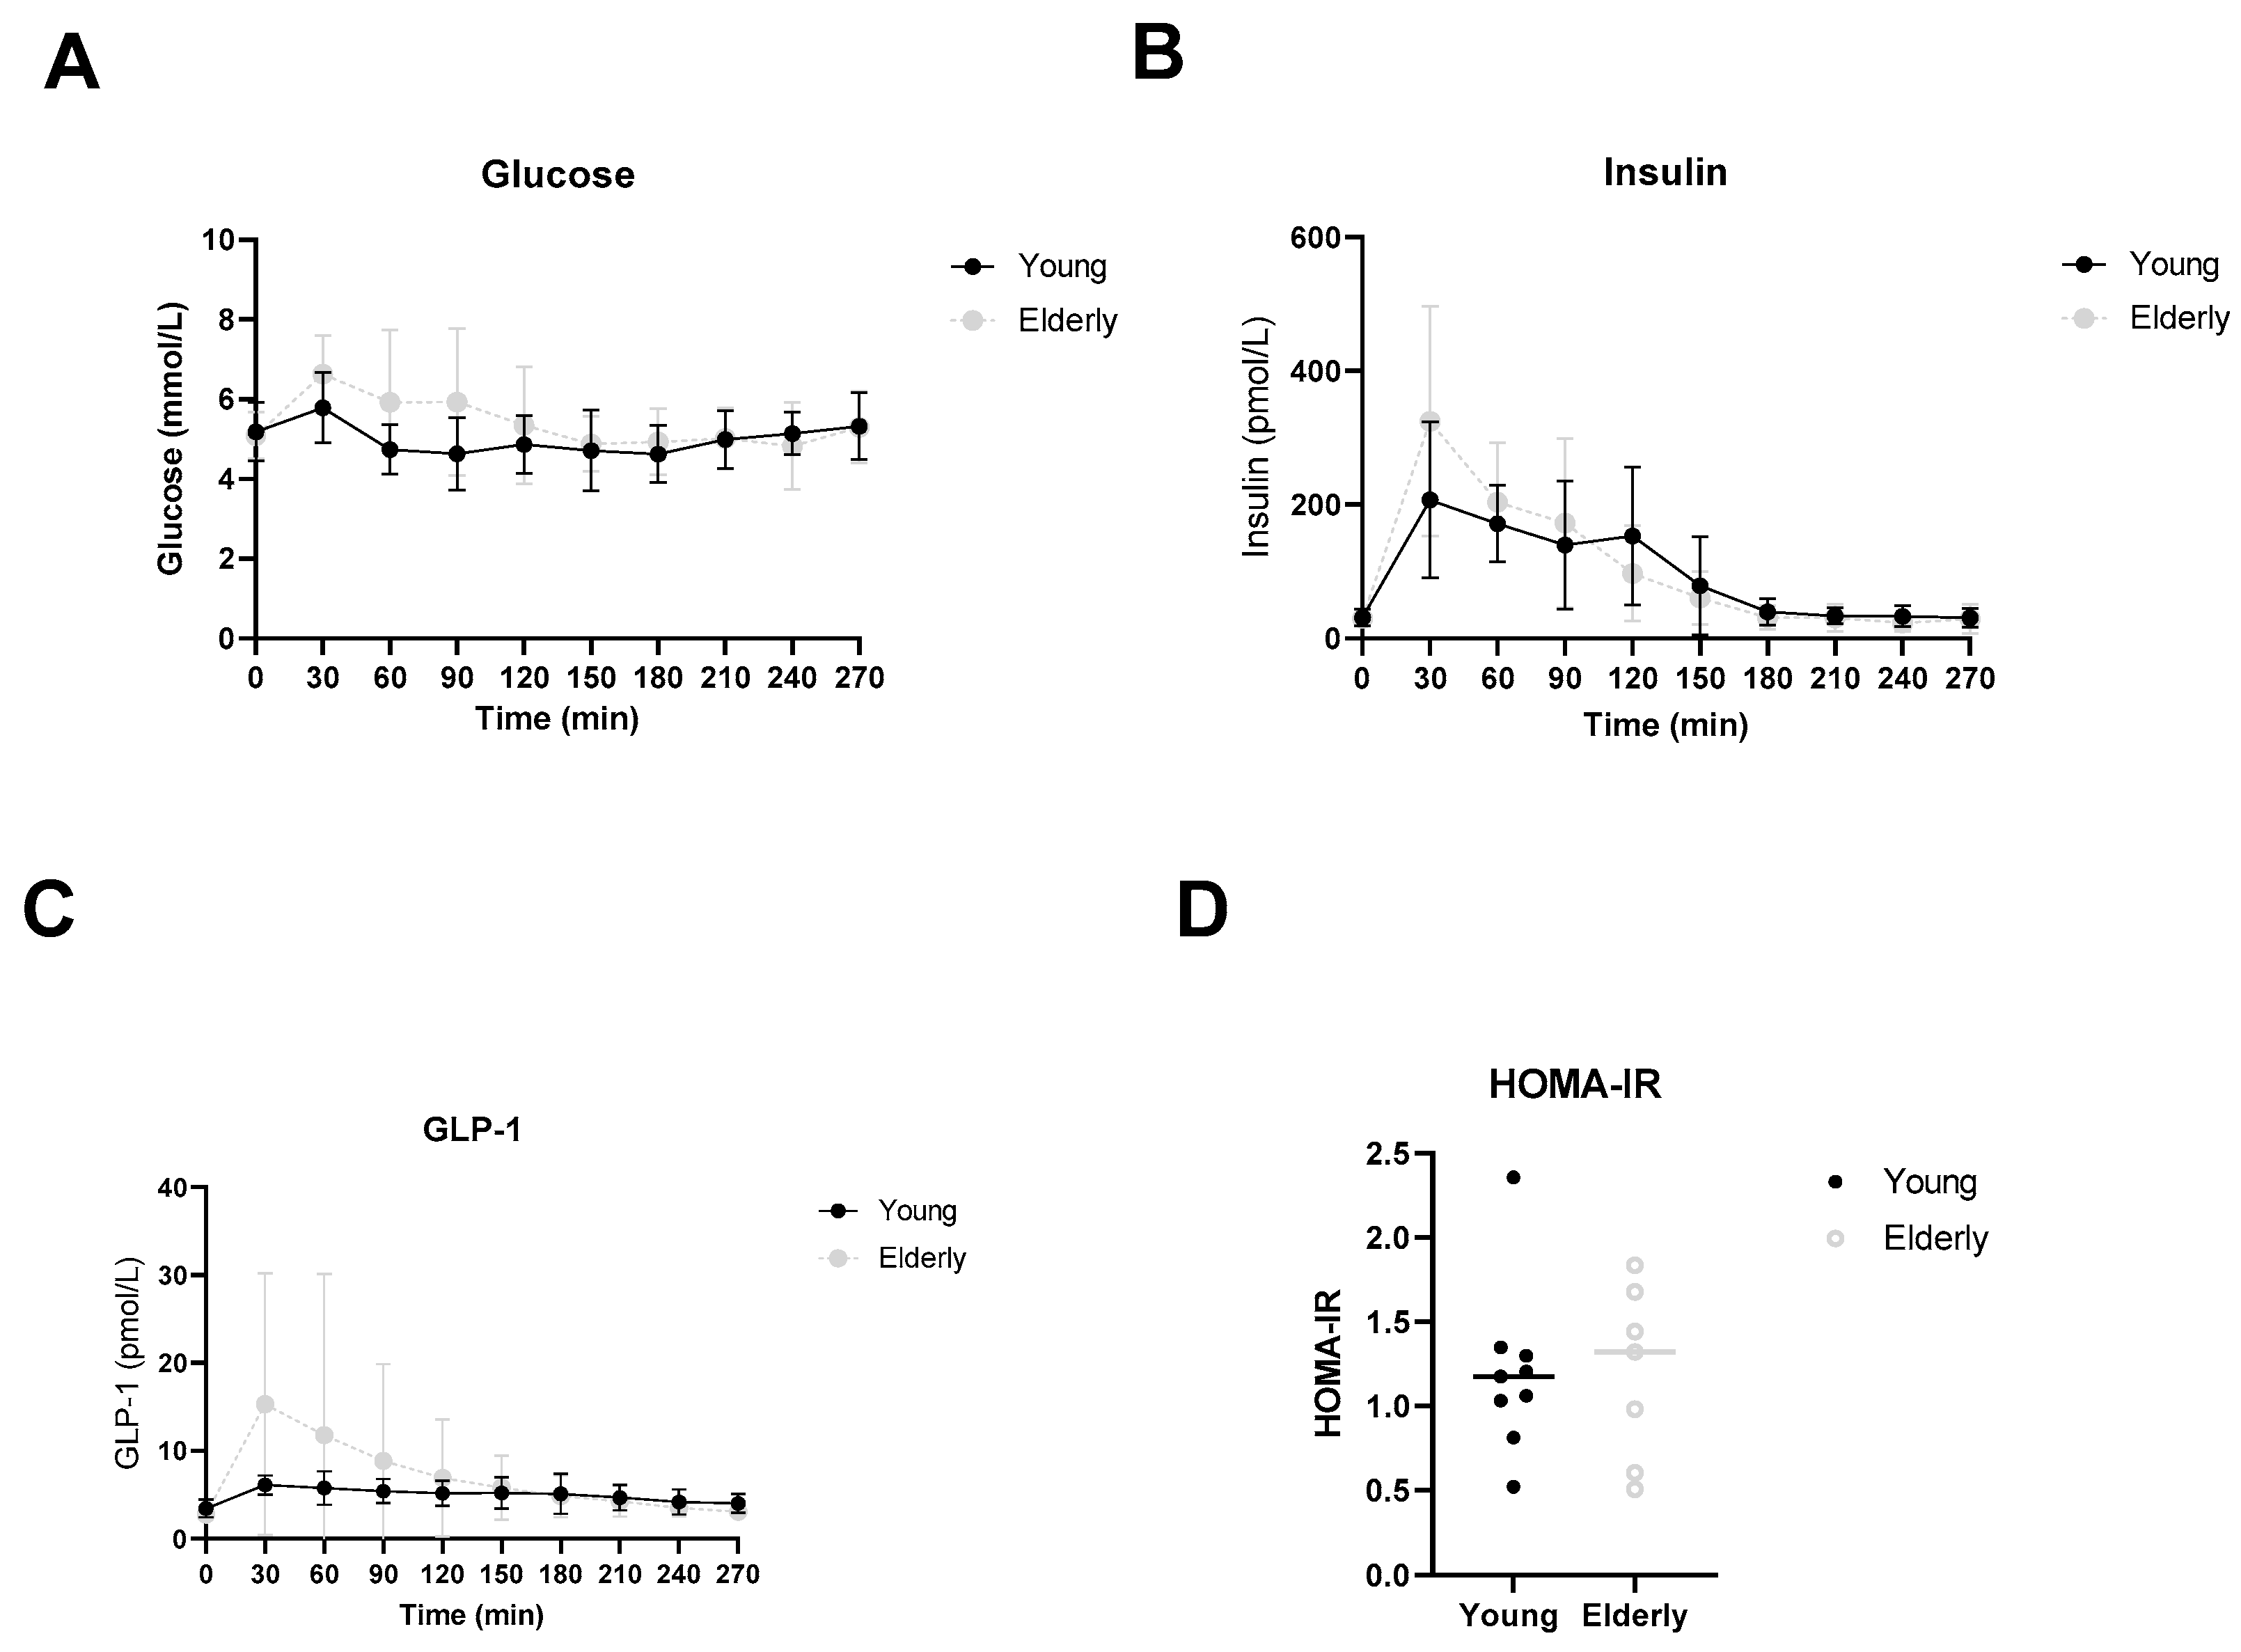
3.5. Healthy Ageing Did Not Affect Postprandial Glucose, Insulin or GLP-1 Levels
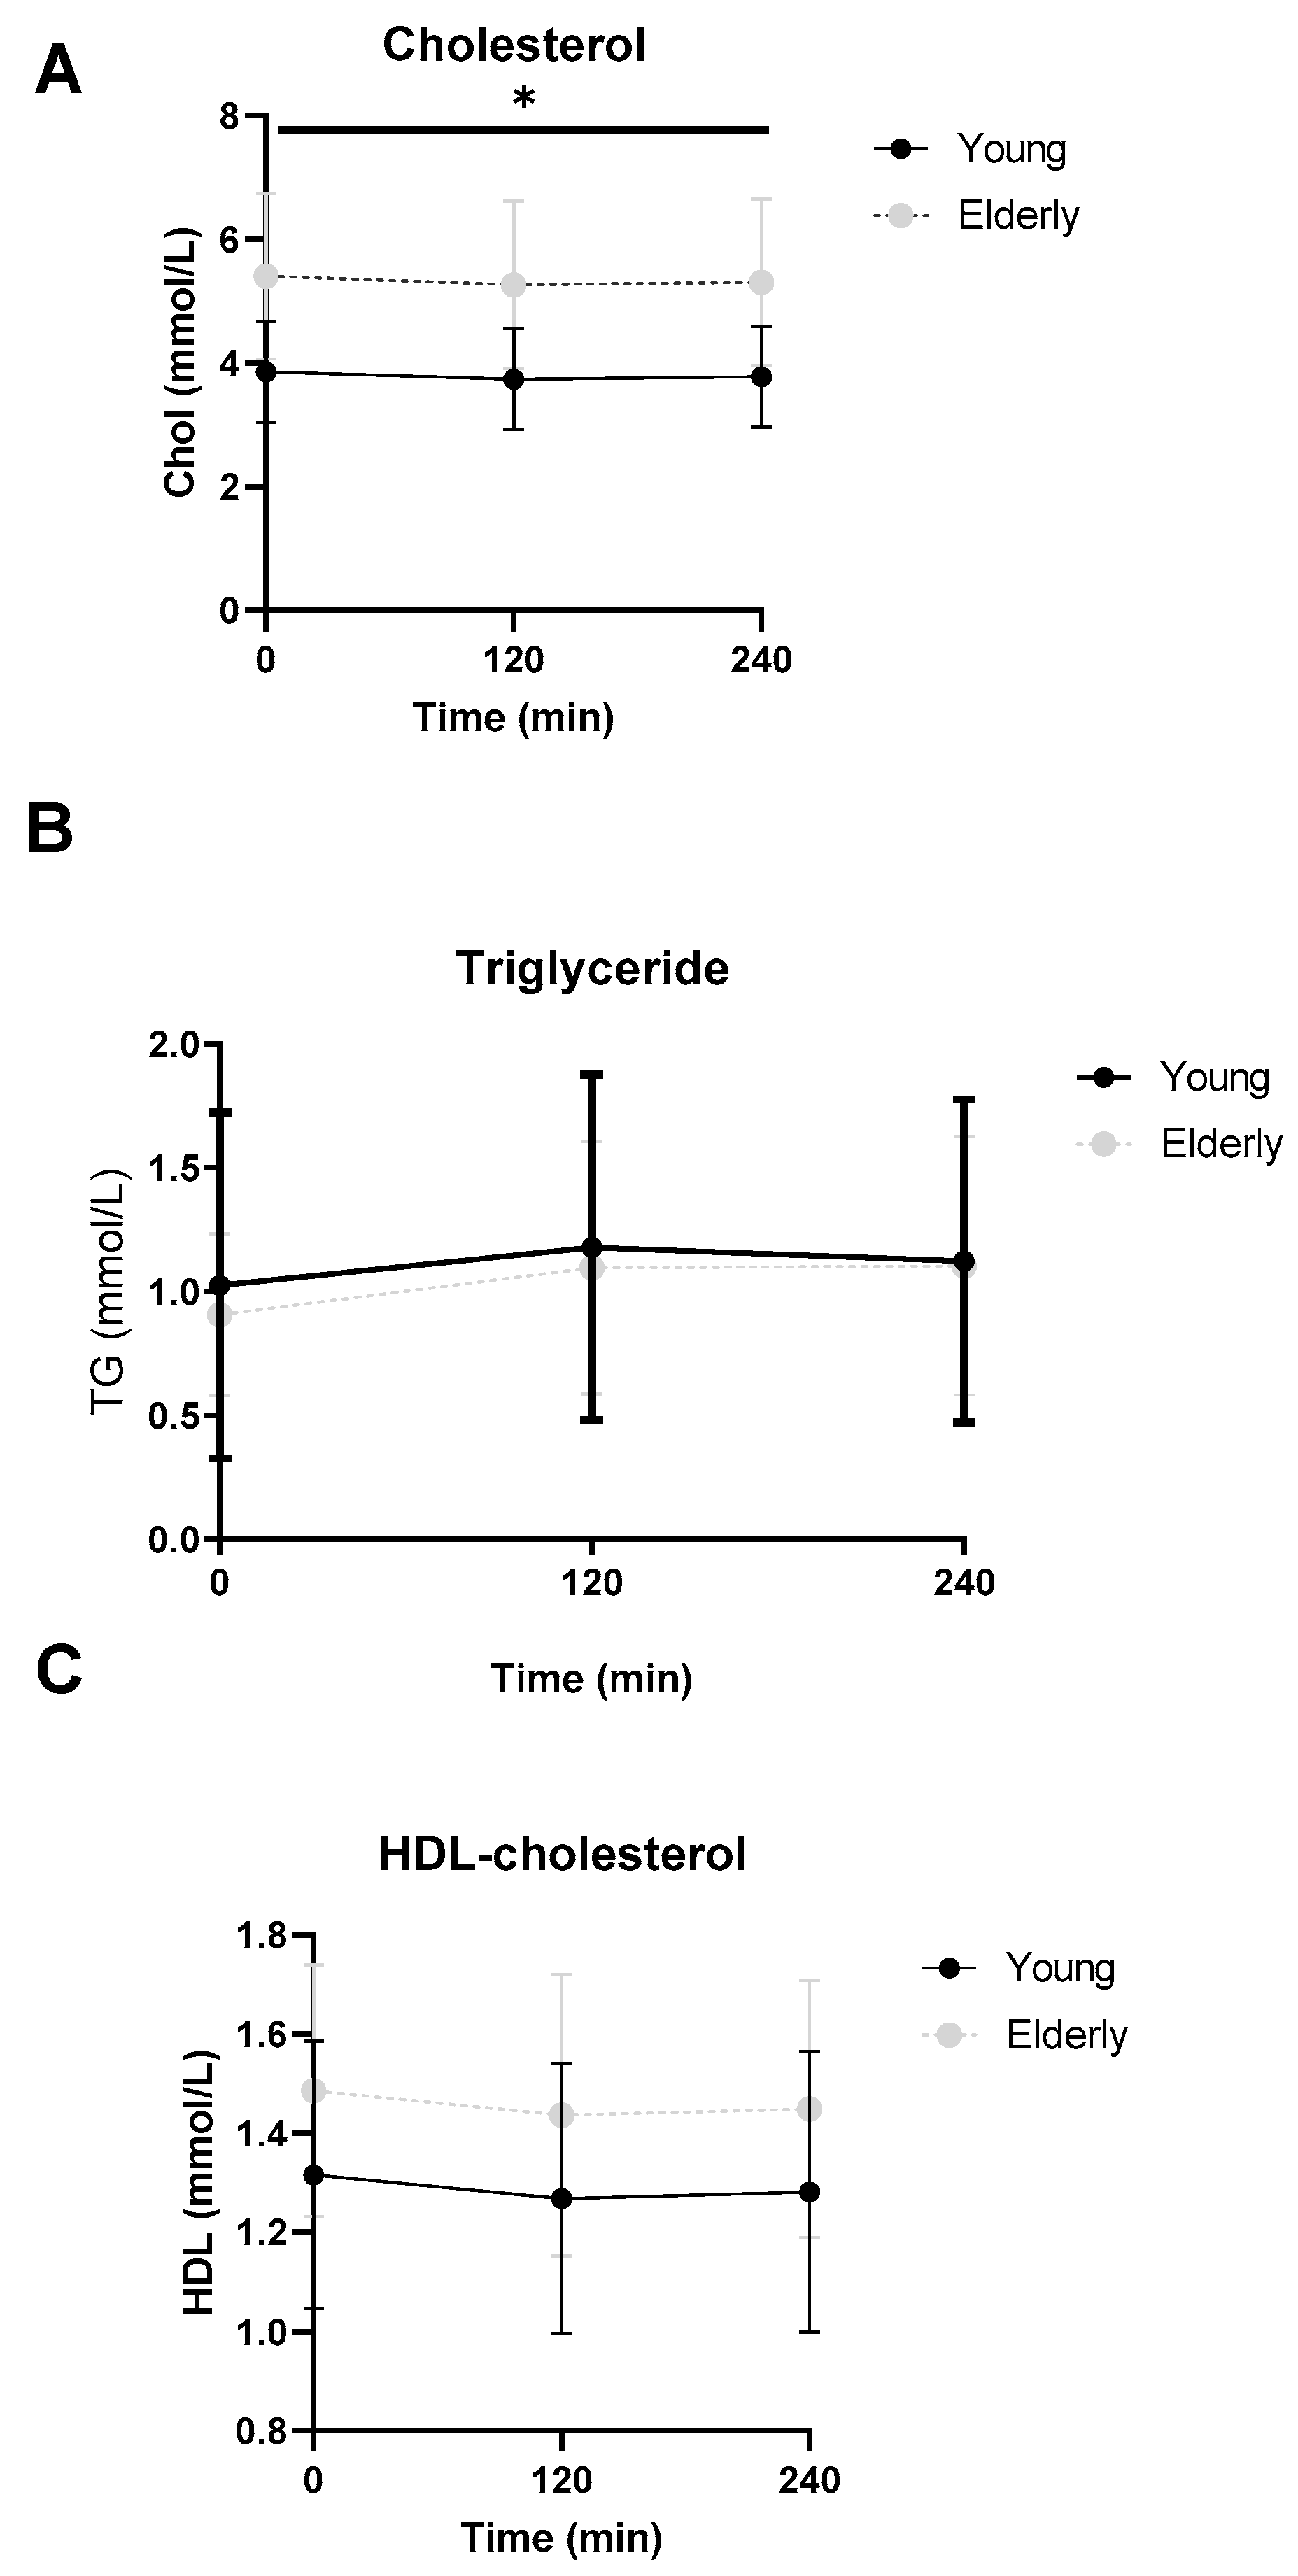
3.6. Lipid Profiles Were Not Significantly Different between the Two Groups
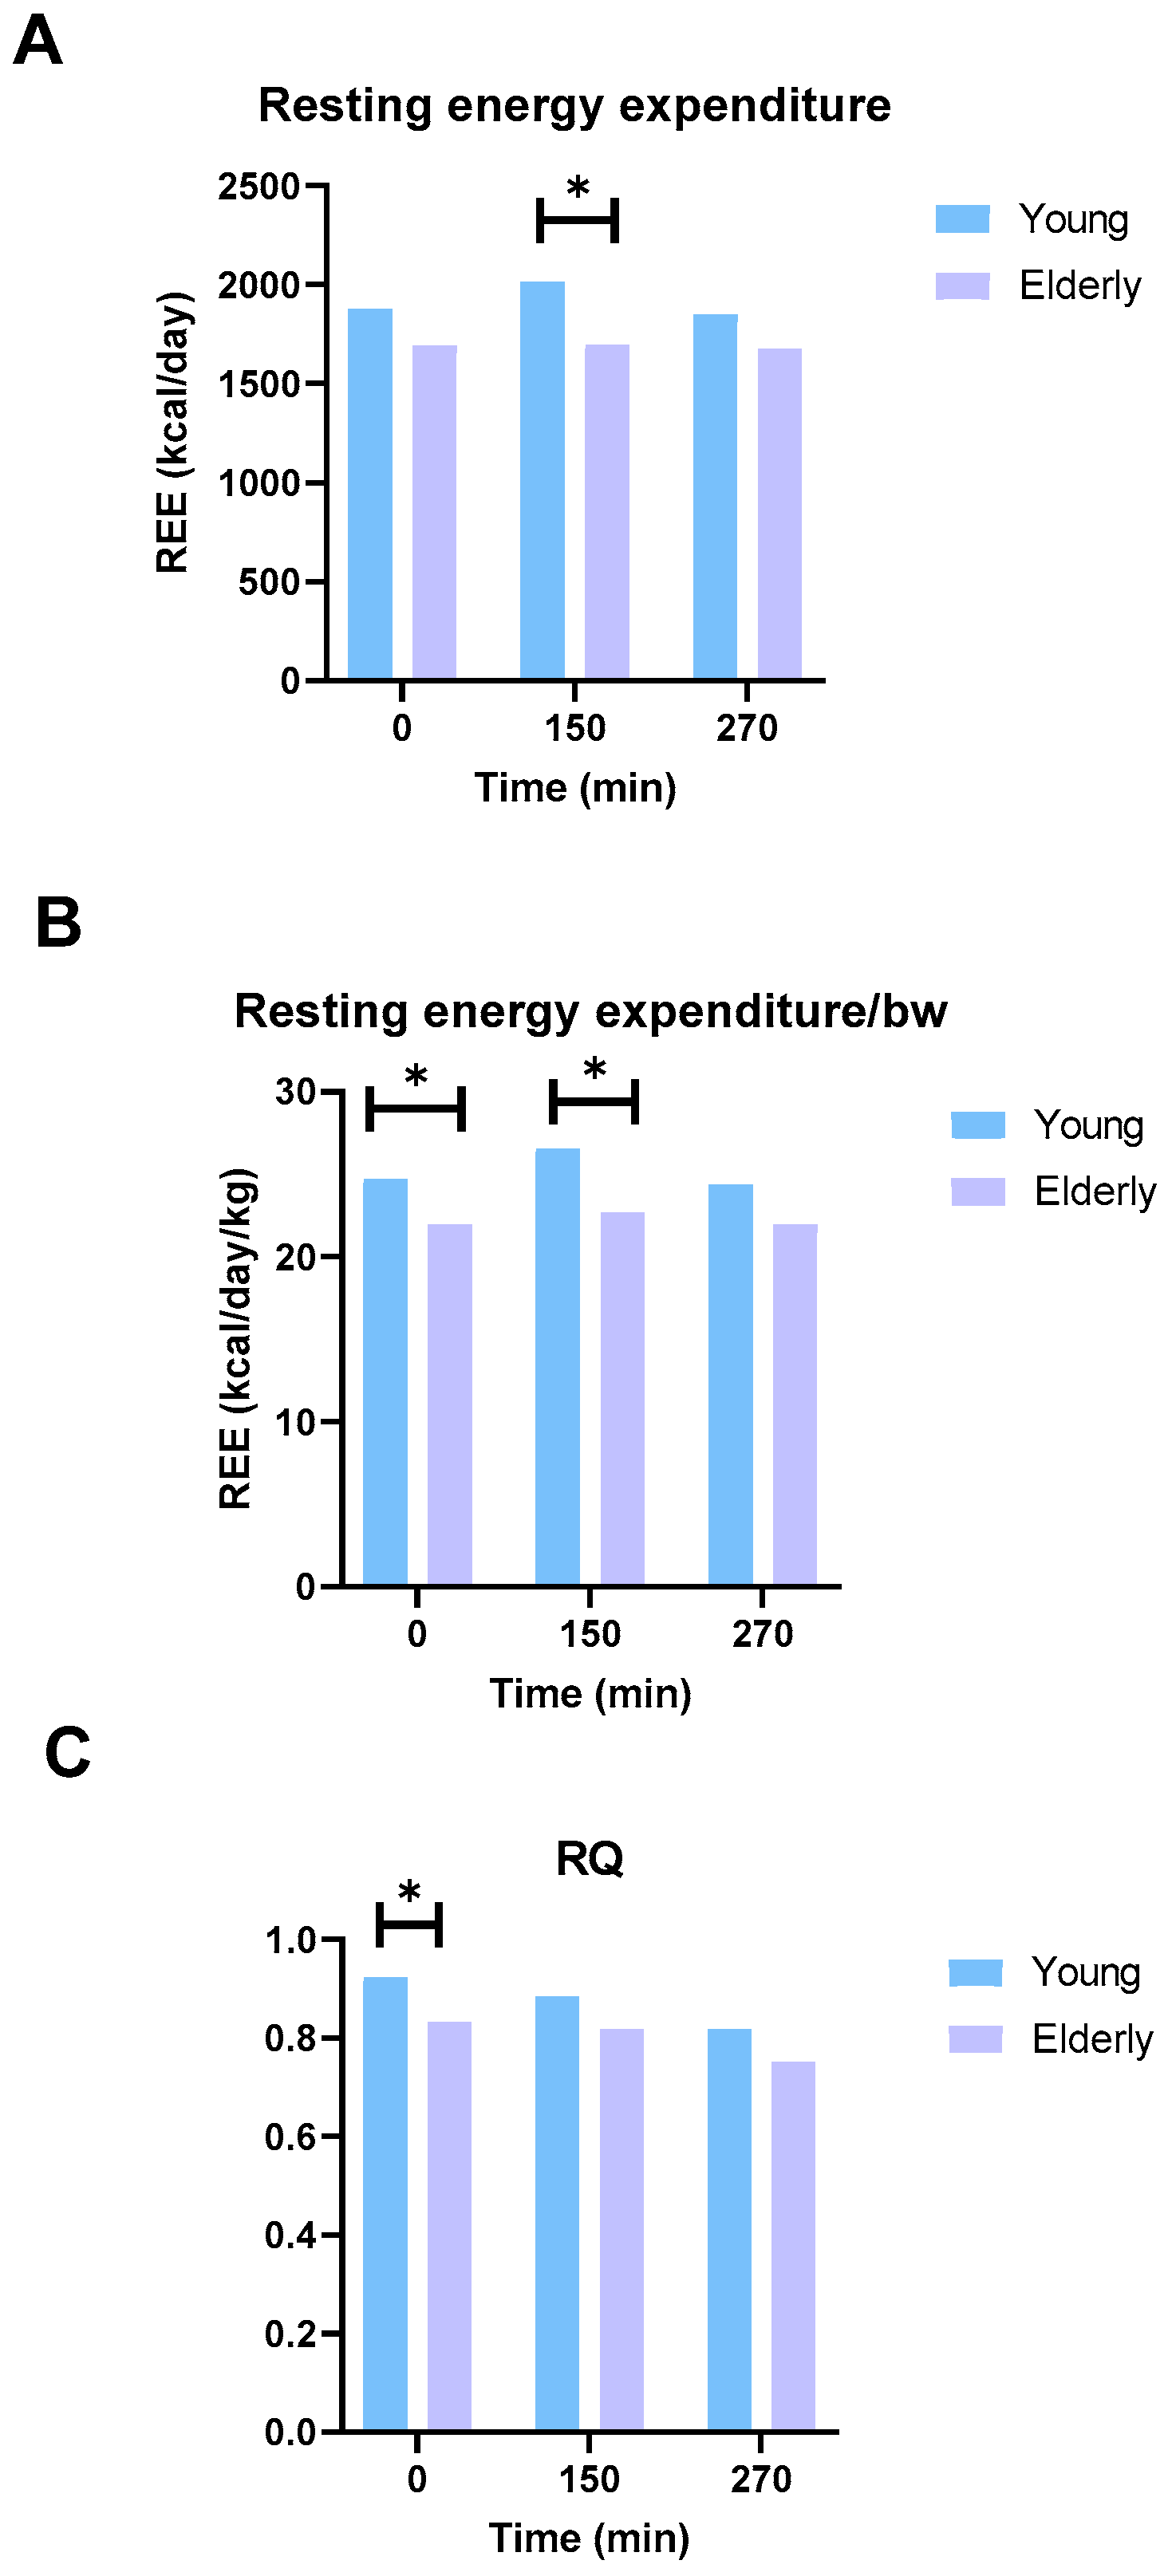
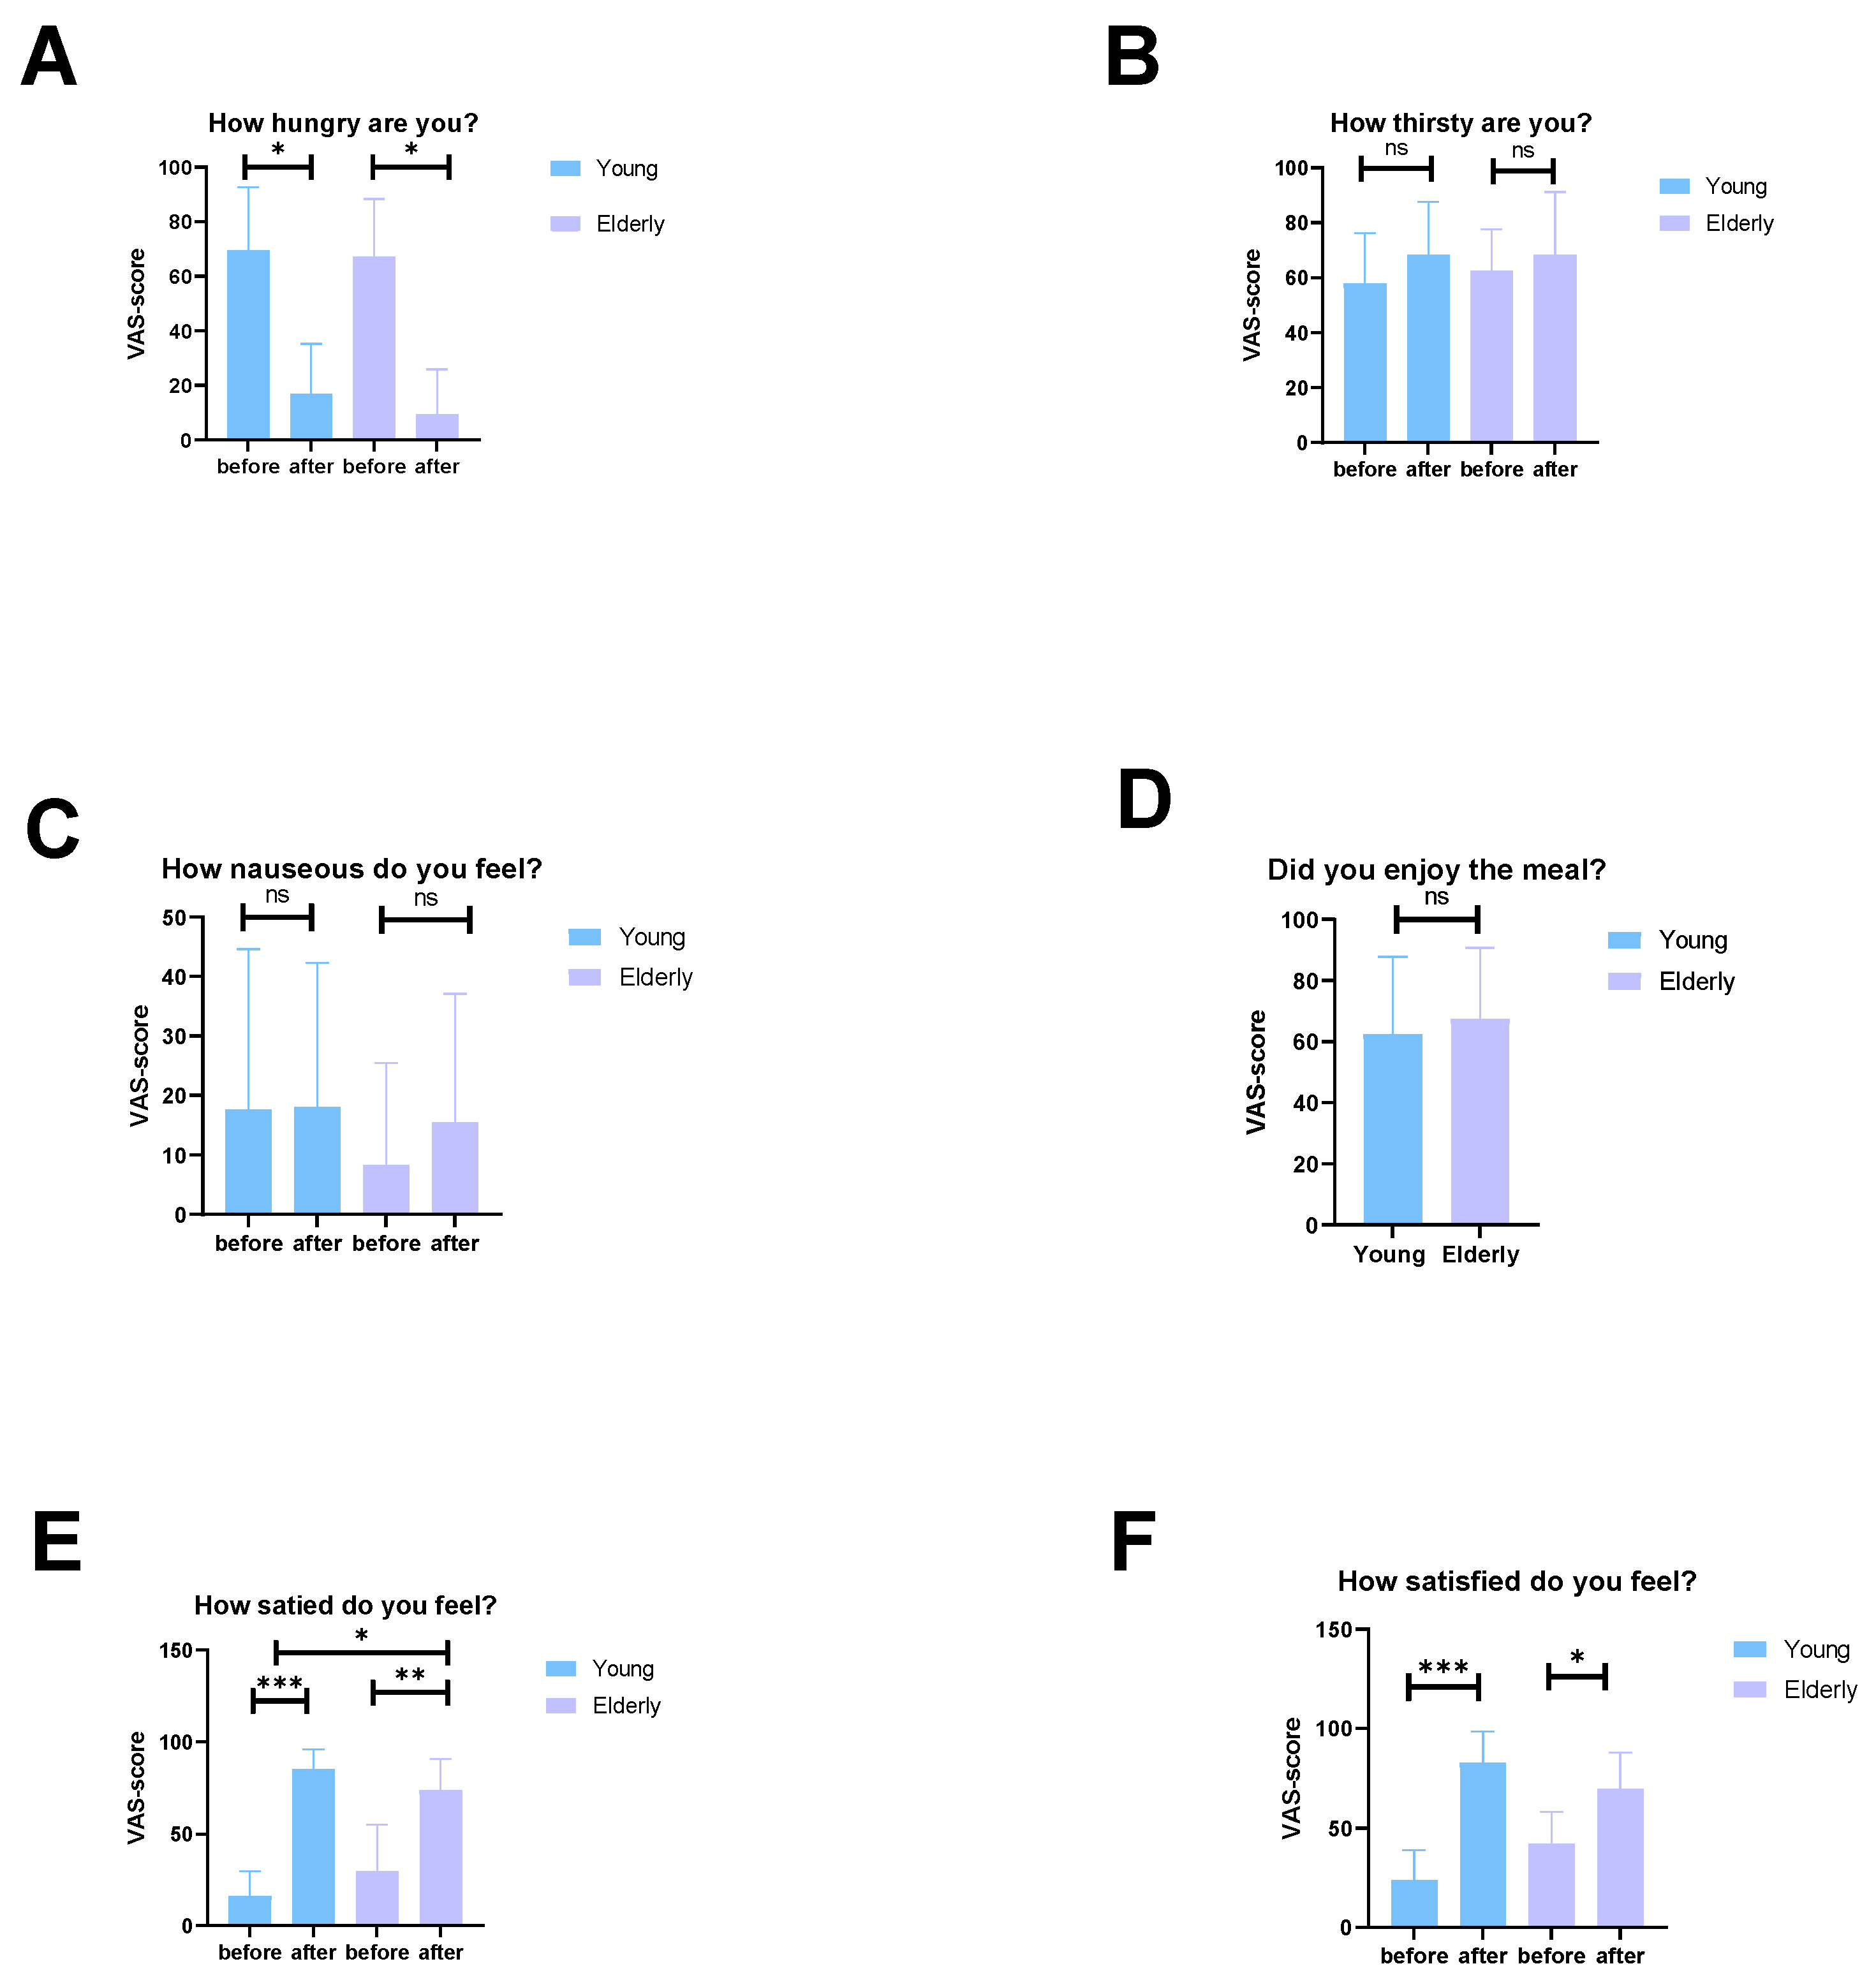
3.7. The Elderly Men Ate Less and Had Lower Energy Expenditure
3.8. Diet
4. Discussion
Author Contributions
Funding
Data Availability Statement
Acknowledgments
Conflicts of Interest
Appendix A

| Baseline | 3 h Postrprandial | 5 h Postprandial | ||||
|---|---|---|---|---|---|---|
| [BA] in nmol/L | Young | Elderly | Young | Elderly | Young | Elderly |
| TCDCA | 0.5 a [0.5 a, 0.5 a] | 0.5 a [0.5 a, 0.5 a] | 0.5 a [0.5 a, 395] | 0.5 a [0.5 a, 230] | 0.5 a [0.5 a, 160] | 0.5 a [0.5 a, 0.5 a] |
| TCA | 0.5 a [0.5 a, 0.5 a] | 0.5 a [0.5 a, 0.5 a] | 0.5 a [0.5 a, 86] | 0.5 a [0.5 a, 66] | 0.5 a [0.5 a, 27] | 0.5 a [0.5 a, 0.5 a] |
| TDCA | 0.5 a [0.5 a, 0.5 a] | 0.5 a [0.5 a, 0.5 a] | 0.5 a [0.5 a, 78] | 0.5 a [0.5 a, 176] | 0.5 a [0.5 a, 28] | 0.5 a [0.5 a, 38] |
| TLCA | 0.5 a [0.5 a, 0.5 a] | 0.5 a [0.5 a, 0.5 a] | 0.5 a [0.5 a, 17] | 17 [3.1, 22] | 0.5 a [0.5 a, 4] | 0.5 a [0.5 a, 3] |
| TUDCA | 0.5 a [0.5 a, 3.2] | 0.5 a [0.5 a, 0.5 a] | 0.5 a [0.5 a, 9] | 0.5 a [0.5 a, 0.5 a] | 0.5 a [0.5 a, 5] | 0.5 a [0.5 a, 0.5 a] |
| Primary bile acids | 837 [389, 2265] | 337 [4.5, 1540] | 3528 [1974, 7034] | 1838 [1307, 4486] | 1882 [1422, 3673] * | 436 [274, 2181] * |
| Secondary bile acids | 289 [42, 916] | 458 [127, 1405] | 975 [595, 1691] | 2067 [638, 3301] | 543 [231, 961] | 837 [182, 1005] |
| Conjugated bile acids | 409 [5, 1058] | 245 [5, 782] | 3597 [2096, 8241] | 2504 [1656, 3579] | 1776 [939, 3520] * | 602 [347, 933] * |
| Unconjugated bile acids | 466 [276, 1362] | 219 [126, 3203] | 417 [223, 773] | 794 [154, 1841] | 559 [292, 1094] | 479 [281, 1830] |
| CA:DCA | 0.5 [0.2, 243] | 0.3 [0.004, 1.0] | 0.68 [0.06, 127] | 0.05 [0.002, 19.7] | 0.38 [0.15, 71.6] | 0.23 [0.003, 3.3] |
| CDCA:LCA | 9.1 [1.1, 190.4] | 1.0 [0.02, 1.0] | 3.4 [2.7, 78.2] | 1.7 [0.4, 11.6] | 12.3 [3.7, 64.1] | 1.0 [ 0.42, 66.1] |
Appendix B

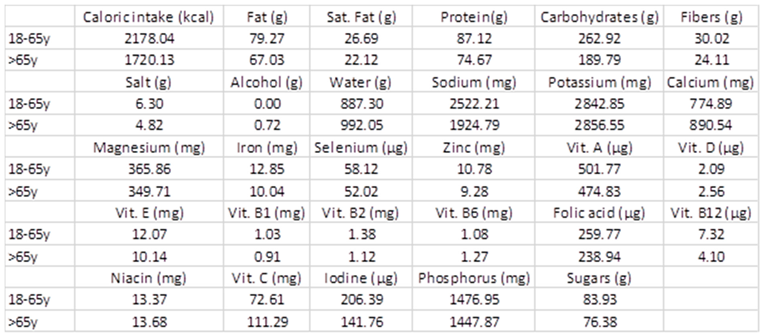
Appendix C. Dietary Macro- and Micronutrient Intake
References
- United Nations. World Population Ageing 2020 Highlights: Living Arrangements of Older Persons; United Nations Department of Economic and Social Affairs, Population: New York, NY, USA, 2020. [Google Scholar]
- Cox, N.J.; Ibrahim, K.; Sayer, A.A.; Robinson, S.M.; Roberts, H.C. Assessment and treatment of the anorexia of aging: A systematic review. Nutrients 2019, 11, 144. [Google Scholar] [CrossRef] [PubMed]
- Larsson, L.; Degens, H.; Li, M.; Salviati, L.; Lee, Y.I.; Thompson, W.; Kirkland, J.L.; Sandri, M. Sarcopenia: Aging-related loss of muscle mass and function. Physiol. Rev. 2019, 99, 427–511. [Google Scholar] [CrossRef] [PubMed]
- Sieber, C.C. Malnutrition and sarcopenia. Aging Clin. Exp. Res. 2019, 31, 793–798. [Google Scholar] [CrossRef] [PubMed]
- Serra-Prat, M.; Mans, E.; Palomera, E.; Clave, P. Gastrointestinal peptides, gastrointestinal motility, and anorexia of aging in frail elderly persons. Neurogastroenterol. Motil. 2013, 25, 291-e245. [Google Scholar] [CrossRef]
- Van Nierop, F.S.; Meessen, E.C.; Nelissen, K.G.; Achterbergh, R.; Lammers, L.A.; Vaz, F.M.; Mathôt, R.A.; Klümpen, H.-J.; Olde Damink, S.W.; Schaap, F.G. Differential effects of a 40-hour fast and bile acid supplementation on human GLP-1 and FGF19 responses. Am. J. Physiol.-Endocrinol. Metab. 2019, 317, E494–E502. [Google Scholar] [CrossRef] [PubMed]
- Morgan, A.; Mooney, K.M.; Wilkinson, S.J.; Pickles, N.; Mc Auley, M.T. Investigating cholesterol metabolism and ageing using a systems biology approach. Proc. Nutr. Soc. 2017, 76, 378–391. [Google Scholar] [CrossRef] [PubMed]
- Thomas, C.; Gioiello, A.; Noriega, L.; Strehle, A.; Oury, J.; Rizzo, G.; Macchiarulo, A.; Yamamoto, H.; Mataki, C.; Pellicciari, R.; et al. TGR5-mediated bile acid sensing controls glucose homeostasis. Cell Metab. 2009, 10, 167–177. [Google Scholar] [CrossRef] [PubMed]
- Pols, T.W.; Nomura, M.; Harach, T.; Sasso, G.L.; Oosterveer, M.H.; Thomas, C.; Rizzo, G.; Gioiello, A.; Adorini, L.; Pellicciari, R. TGR5 activation inhibits atherosclerosis by reducing macrophage inflammation and lipid loading. Cell Metab. 2011, 14, 747–757. [Google Scholar] [CrossRef]
- Watanabe, M.; Houten, S.M.; Mataki, C.; Christoffolete, M.A.; Kim, B.W.; Sato, H.; Messaddeq, N.; Harney, J.W.; Ezaki, O.; Kodama, T. Bile acids induce energy expenditure by promoting intracellular thyroid hormone activation. Nature 2006, 439, 484–489. [Google Scholar] [CrossRef]
- Schaap, F.G.; van der Gaag, N.A.; Gouma, D.J.; Jansen, P.L. High expression of the bile salt-homeostatic hormone fibroblast growth factor 19 in the liver of patients with extrahepatic cholestasis. Hepatology 2009, 49, 1228–1235. [Google Scholar] [CrossRef]
- Donini, L.M.; Savina, C.; Cannella, C. Eating habits and appetite control in the elderly: The anorexia of aging. Int. Psychogeriatr. 2003, 15, 73–87. [Google Scholar] [CrossRef] [PubMed]
- Shah, M.; Vella, A. Effects of GLP-1 on appetite and weight. Rev. Endocr. Metab. Disord. 2014, 15, 181–187. [Google Scholar] [CrossRef] [PubMed]
- Lefebvre, P.; Cariou, B.; Lien, F.; Kuipers, F.; Staels, B. Role of bile acids and bile acid receptors in metabolic regulation. Physiol Rev 2009, 89, 147–191. [Google Scholar] [CrossRef] [PubMed]
- Salemans, J.M.; Nagengast, F.M.; Tangerman, A.; SCHAIK, A.V.; Hopman, W.P.; HAAN, A.D.; Jansen, J.B. Effect of ageing on postprandial conjugated and unconjugated serum bile acid levels in healthy subjects. Eur. J. Clin. Investig. 1993, 23, 192–198. [Google Scholar] [CrossRef] [PubMed]
- Song, P.; Zhang, X.; Feng, W.; Xu, W.; Wu, C.; Xie, S.; Yu, S.; Fu, R. Biological synthesis of ursodeoxycholic acid. Front. Microbiol. 2023, 14, 1140662. [Google Scholar] [CrossRef]
- Salazar, N.; Valdés-Varela, L.; González, S.; Gueimonde, M.; De Los Reyes-Gavilán, C.G. Nutrition and the gut microbiome in the elderly. Gut Microbes 2017, 8, 82–97. [Google Scholar] [CrossRef] [PubMed]
- Thompson, R.S.; Gaffney, M.; Hopkins, S.; Kelley, T.; Gonzalez, A.; Bowers, S.J.; Vitaterna, M.H.; Turek, F.W.; Foxx, C.L.; Lowry, C.A. Ruminiclostridium 5, Parabacteroides distasonis, and bile acid profile are modulated by prebiotic diet and associate with facilitated sleep/clock realignment after chronic disruption of rhythms. Brain Behav. Immun. 2021, 97, 150–166. [Google Scholar] [CrossRef] [PubMed]
- Van der Werf, S.; van Berge Henegouwen, G.; Van den Broek, W. Estimation of bile acid pool sizes from their spillover into systemic blood. J. Lipid Res. 1985, 26, 168–174. [Google Scholar] [CrossRef]
- Hofmann, A.; Cravetto, C.; Molino, G.; Belforte, G.; Bona, B. Simulation of the metabolism and enterohepatic circulation of endogenous deoxycholic acid in humans using a physiologic pharmacokinetic model for bile acid metabolism. Gastroenterology 1987, 93, 693–709. [Google Scholar] [CrossRef]
- Marcus, S.; Heaton, K. Intestinal transit, deoxycholic acid and the cholesterol saturation of bile--three inter-related factors. Gut 1986, 27, 550–558. [Google Scholar] [CrossRef]
- Lin, H.-R.; Xu, F.; Chen, D.; Xie, K.; Yang, Y.; Hu, W.; Li, B.-Y.; Jiang, Z.; Liang, Y.; Tang, X.-Y. The gut microbiota-bile acid axis mediates the beneficial associations between plasma vitamin D and metabolic syndrome in Chinese adults: A prospective study. Clin. Nutr. 2023, 42, 887–898. [Google Scholar] [CrossRef] [PubMed]
- Ding, Q.-Y.; Tian, J.-X.; Li, M.; Lian, F.-M.; Zhao, L.-H.; Wei, X.-X.; Han, L.; Zheng, Y.-J.; Gao, Z.-Z.; Yang, H.-Y. Interactions between therapeutics for metabolic disease, cardiovascular risk factors, and gut microbiota. Front. Cell. Infect. Microbiol. 2020, 10, 530160. [Google Scholar] [CrossRef] [PubMed]
- Paik, D.; Yao, L.; Zhang, Y.; Bae, S.; D’Agostino, G.D.; Zhang, M.; Kim, E.; Franzosa, E.A.; Avila-Pacheco, J.; Bisanz, J.E. Human gut bacteria produce ΤH17-modulating bile acid metabolites. Nature 2022, 603, 907–912. [Google Scholar] [CrossRef] [PubMed]
- Eggink, H.M.; van Nierop, F.S.; Schooneman, M.G.; Boelen, A.; Kalsbeek, A.; Koehorst, M.; Ten Have, G.A.; de Brauw, L.M.; Groen, A.K.; Romijn, J.A. Transhepatic bile acid kinetics in pigs and humans. Clin. Nutr. 2018, 37, 1406–1414. [Google Scholar] [CrossRef] [PubMed]
- Reeskamp, L.F.; Meessen, E.C.; Groen, A.K. Transintestinal cholesterol excretion in humans. Curr. Opin. Lipidol. 2018, 29, 10–17. [Google Scholar] [CrossRef] [PubMed]
- van Nierop, F.S.; Scheltema, M.J.; Eggink, H.M.; Pols, T.W.; Sonne, D.P.; Knop, F.K.; Soeters, M.R. Clinical relevance of the bile acid receptor TGR5 in metabolism. Lancet Diabetes Endocrinol. 2017, 5, 224–233. [Google Scholar] [CrossRef] [PubMed]
- Sharp, G.; Girolamo, T.; Hay, P.; Mitchison, D.; Cooper, K.; Sumithran, P.; Jebeile, H. New anti-obesity medications: Considerations and future directions in people with concurrent eating disorders. Aust. J. Gen. Pract. 2023, 52, 651–653. [Google Scholar] [CrossRef] [PubMed]
- Broeders, E.P.; Nascimento, E.B.; Havekes, B.; Brans, B.; Roumans, K.H.; Tailleux, A.; Schaart, G.; Kouach, M.; Charton, J.; Deprez, B. The bile acid chenodeoxycholic acid increases human brown adipose tissue activity. Cell Metab. 2015, 22, 418–426. [Google Scholar] [CrossRef] [PubMed]
- Meessen, E.C.; Sips, F.L.; Eggink, H.M.; Koehorst, M.; Romijn, J.A.; Groen, A.K.; van Riel, N.A.; Soeters, M.R. Model-based data analysis of individual human postprandial plasma bile acid responses indicates a major role for the gallbladder and intestine. Physiol. Rep. 2020, 8, e14358. [Google Scholar] [CrossRef]
- Phelps, T.; Snyder, E.; Rodriguez, E.; Child, H.; Harvey, P. The influence of biological sex and sex hormones on bile acid synthesis and cholesterol homeostasis. Biol. Sex Differ. 2019, 10, 52. [Google Scholar] [CrossRef]


| Young | Elderly | p-Value 1 | |
|---|---|---|---|
| Age (years) | 24 [22, 26] *** | 69 [66, 72] *** | <0.001 |
| Weight (kg) | 76.1 ± 6.8 | 79.0 ± 10.7 | 0.50 |
| Height (m) | 1.85 ± 0.07 | 1.85 ± 0.08 | 0.88 |
| BMI (kg/m2) | 22.2 ± 1.3 | 23.1 ± 2.4 | 0.32 |
| Creatinine (µmol/L) | 76 [74, 90] | 81 [76, 88] | 0.6 |
| EGFR (mL/min/1.73 m²) 2 | 90 [90, 90] | 86 [82, 90] | 0.005 |
| AP (U/L) | 66 ± 15 | 72 ± 26 | 0.59 |
| GGT U/L) | 20 ± 10 | 28 ± 11 | 0.12 |
| ASAT (U/L) | 22 ± 4 * | 27 ± 6 * | 0.048 |
| ALAT (U/L) | 18 [17, 22] | 29 [18, 42] | 0.07 |
| Glucose (mmol/L) | 5.0 ± 0.2 | 5.2 ± 0.2 | 0.025 |
| Insulin (pmol/L) | 27.1 ± 10.5 | 26.6 ± 9.7 | 0.91 |
| HOMA-IR index | 0.94 [0.70, 1.4] | 0.98 [0.75, 1.4] | 0.79 |
| Total Cholesterol (mmol/L) | 3.77 ± 0.69 * | 5.60 ± 1.27 * | 0.002 |
| HDL (mmol/L) | 1.59 ± 0.41 | 1.55 ± 0.29 | 0.84 |
| LDL (mmol/L) | 1.79 ± 0.49 *** | 3.64 ± 1.13 *** | <0.001 |
| Triglyceride (mmol/L) | 0.82 [0.47, 0.94] | 0.80 [0.57, 1.3] | 0.69 |
| Baseline | 3 h Postprandial | 5 h Postprandial | ||||
|---|---|---|---|---|---|---|
| [BA] in nmol/L | Young | Elderly | Young | Elderly | Young | Elderly |
| CDCA | 101 [591, 377] | 0.5 a [0.5 a, 390] | 103 [84, 182] | 56 [0.5 a, 112] | 233 [49, 348] | 37 [0.5 a, 336] |
| CA | 105 [0.5 a, 531] | 0.5 a [0.5 a, 551] | 82 [23, 150] | 18 [0.5 a, 104] | 60 [36, 289] | 24 [0.5 a, 281] |
| DCA | 128 [0.5 a, 560] | 217 [68, 1024] | 206 [0.5 a, 489] | 773 [72, 1596] | 211 [0.5 a, 385] | 452 [46, 845] |
| LCA | 32 [0.5 a, 56] | 31 [0.5 a, 57] | 30 [10, 43] | 30 [0.5 a, 58] | 23 [0.5 a, 37] | 25 [0.5 a, 40] |
| UDCA | 0.5 a [0.5 a, 70] | 0.5 a [0.5 a, 0.5 a] | 0.5 a [0.5 a, 109] | 0.5 a[ 0.5 a, 0.5 a] | 0.5 a [0.5 a, 93] | 0.5 a [0.5 a, 0.5 a] |
| GCDCA | 309 [0.5 a, 604] | 0.5 a [0.5 a, 220] | 2177 [1161, 4074] * | 1066 [718, 2007] * | 891 [581, 2141] | 274 [77, 521] |
| GCA | 39 [0.5 a, 176] | 0.5 a [0.5 a, 88] | 381 [204, 1594] | 218 [121, 508] | 170 [60, 780] | 79 [39, 148] |
| GDCA | 0.5 a [0.5 a, 258] | 196 [0.5 a, 271] | 530 [352, 1052] | 720 [363, 1474] | 171 [41, 442] | 218 [45, 426] |
| GLCA | 0.5 a [0.5 a, 0.5 a] | 0.5 a [0.5 a, 15] | 68 ± 44 | 70 ± 35 | 0.5 a [0.5 a, 43] | 0.5 a [0.5 a, 0.5 a] |
| GUDCA | 0.5 a [0.5 a, 154] | 0.5 a [0.5 a, 0.5 a] | 368 [143, 579] * | 0.5 a [0.5 a, 127] * | 143 [69, 327] | 0.5 a [0.5 a, 43] |
| Young | Elderly | ||||||
|---|---|---|---|---|---|---|---|
| Parameter | Mean | ± | SD | Mean | ± | SD | p-Value |
| Fat mass (kg) | 7.32 | ± | 2.79 *** | 16.72 | ± | 4.79 *** | <0.001 |
| Fat-free mass (kg) | 68.47 | ± | 8.74 | 61.66 | ± | 9.05 | 0.136 |
| Fat percentage (%) | 10.23 | ± | 4.52 *** | 21.32 | ± | 5.03 *** | <0.001 |
| Fat-free percentage (%) | 90.14 | ± | 4.31 *** | 78.68 | ± | 5.03 *** | <0.001 |
| Body weight (kg) | 75.82 | ± | 7.21 | 78.38 | ± | 10.45 | 0.571 |
| Young | Elderly | ||||||
|---|---|---|---|---|---|---|---|
| Dietary Constituent | Mean | ± | SD | Mean | ± | SD | p-Value |
| Caloric intake (kcal/day) | 2178.0 | ± | 659.1 | 1720.1 | ± | 523.1 | 0.137 |
| Carbohydrates (g) | 262.9 | ± | 94.1 | 189.8 | ± | 58.7 | 0.078 |
| Fat (g) | 79.3 | ± | 24.6 | 67.0 | ± | 21.0 | 0.290 |
| Saturated fat (g) | 26.7 | ± | 9.0 | 22.1 | ± | 7.1 | 0.267 |
| Protein (g) | 87.1 | ± | 35.9 | 74.7 | ± | 32.3 | 0.466 |
| Dietary fibers (g) | 30.0 | ± | 12.8 | 24.1 | ± | 10.0 | 0.311 |
Disclaimer/Publisher’s Note: The statements, opinions and data contained in all publications are solely those of the individual author(s) and contributor(s) and not of MDPI and/or the editor(s). MDPI and/or the editor(s) disclaim responsibility for any injury to people or property resulting from any ideas, methods, instructions or products referred to in the content. |
© 2024 by the authors. Licensee MDPI, Basel, Switzerland. This article is an open access article distributed under the terms and conditions of the Creative Commons Attribution (CC BY) license (https://creativecommons.org/licenses/by/4.0/).
Share and Cite
Majait, S.; Meessen, E.C.E.; Davids, M.; Chahid, Y.; Olde Damink, S.W.; Schaap, F.G.; Kemper, E.M.; Nieuwdorp, M.; Soeters, M.R. Age-Dependent Differences in Postprandial Bile-Acid Metabolism and the Role of the Gut Microbiome. Microorganisms 2024, 12, 764. https://doi.org/10.3390/microorganisms12040764
Majait S, Meessen ECE, Davids M, Chahid Y, Olde Damink SW, Schaap FG, Kemper EM, Nieuwdorp M, Soeters MR. Age-Dependent Differences in Postprandial Bile-Acid Metabolism and the Role of the Gut Microbiome. Microorganisms. 2024; 12(4):764. https://doi.org/10.3390/microorganisms12040764
Chicago/Turabian StyleMajait, Soumia, Emma C. E. Meessen, Mark Davids, Youssef Chahid, Steven W. Olde Damink, Frank G. Schaap, Ellis Marleen Kemper, Max Nieuwdorp, and Maarten R. Soeters. 2024. "Age-Dependent Differences in Postprandial Bile-Acid Metabolism and the Role of the Gut Microbiome" Microorganisms 12, no. 4: 764. https://doi.org/10.3390/microorganisms12040764
APA StyleMajait, S., Meessen, E. C. E., Davids, M., Chahid, Y., Olde Damink, S. W., Schaap, F. G., Kemper, E. M., Nieuwdorp, M., & Soeters, M. R. (2024). Age-Dependent Differences in Postprandial Bile-Acid Metabolism and the Role of the Gut Microbiome. Microorganisms, 12(4), 764. https://doi.org/10.3390/microorganisms12040764