Article

The Post-Transcriptional Regulatory Protein CsrA Amplifies Its Targetome through Direct Interactions with Stress-Response Regulatory Hubs: The EvgA and AcnA Cases

by
Alejandra Matsuri Rojano-Nisimura
1,
Kobe B. Grismore
2,
Josie S. Ruzek
2,
Jacqueline L. Avila
2 and
Lydia M. Contreras
1,2,*
1
Department of Molecular Biosciences, The University of Texas at Austin, 100 East 24th St. Stop A5000, Austin, TX 78712, USA
2
McKetta Department of Chemical Engineering, The University of Texas at Austin, 200 E. Dean Keeton St. Stop C0400, Austin, TX 78712, USA
*
Author to whom correspondence should be addressed.
Microorganisms 2024, 12(4), 636; https://doi.org/10.3390/microorganisms12040636
Submission received: 27 January 2024 / Revised: 8 March 2024 / Accepted: 19 March 2024 / Published: 22 March 2024

Abstract

:
Global rewiring of bacterial gene expressions in response to environmental cues is mediated by regulatory proteins such as the CsrA global regulator from E. coli. Several direct mRNA and sRNA targets of this protein have been identified; however, high-throughput studies suggest an expanded RNA targetome for this protein. In this work, we demonstrate that CsrA can extend its network by directly binding and regulating the evgA and acnA transcripts, encoding for regulatory proteins. CsrA represses EvgA and AcnA expression and disrupting the CsrA binding sites of evgA and acnA, results in broader gene expression changes to stress response networks. Specifically, altering CsrA-evgA binding impacts the genes related to acidic stress adaptation, and disrupting the CsrA-acnA interaction affects the genes involved in metal-induced oxidative stress responses. We show that these interactions are biologically relevant, as evidenced by the improved tolerance of evgA and acnA genomic mutants depleted of CsrA binding sites when challenged with acid and metal ions, respectively. We conclude that EvgA and AcnA are intermediate regulatory hubs through which CsrA can expand its regulatory role. The indirect CsrA regulation of gene networks coordinated by EvgA and AcnA likely contributes to optimizing cellular resources to promote exponential growth in the absence of stress.

1. Introduction

Post-transcriptional regulatory networks allow bacteria to rapidly adapt and respond to changing environments. In Gammaproteobacteria, the carbon storage regulatory protein A (CsrA) acts as a pleiotropic regulator of gene expression, particularly impacting central carbon metabolism [1,2]. CsrA is an RNA-binding protein (RBP), part of the Csr network, that controls multiple cellular processes. Our current understanding of CsrA-mediated regulation supports the notion that CsrA represses stationary-phase processes (such as biofilm formation, iron storage, metabolism of alternative carbon sources, and stress responses) and activates pathways related to exponential growth (motility, glycolysis, and virulence) [3].
Mechanistically, CsrA post-transcriptionally regulates gene expression by directly binding to target RNAs, altering their translation and/or transcript stability. In the case of sRNAs, it can additionally impact their interactions with cognate RNAs [4]. Molecularly, CsrA-binding typically involves two hairpin-looped regions containing a high-affinity “GGA” triplet sequence (herein referred to as GGA motif) [5]. Notably, CsrA has also been observed to bind at non-consensus ANGGN-like sites which contribute (to a smaller extent) to target regulation [4,6]. To date, there are 29 confirmed direct CsrA RNA targets in E. coli [4,6,7,8,9,10,11,12,13,14,15,16,17,18,19,20,21]. In this paper, we define a confirmed direct target as an RNA for which a binding interface has been fully mapped (via in vitro footprinting and/or mutational analysis of CsrA binding sites) and/or a direct physical interaction has been experimentally confirmed (typically by in vitro binding assays). In addition, there are 92 functional targets for which CsrA-mediated regulation has been observed in reporter assays (Supplementary Table S1), albeit it is yet to be determined whether those regulatory effects occur through direct or indirect interactions [22,23]. Moreover, large-scale studies have identified over 500 other transcripts as potential CsrA targets by computational predictions, transcriptomics, and/or CLIP-based approaches, suggesting that this RNA-binding protein may exert broader regulatory effects than what has been characterized so far [2,11,22,24,25,26]. The true direct targetome and the mechanisms by which global regulatory proteins like CsrA influence their targets, however, continue to be debatable; a major challenge is that these are, potentially, highly dynamic regulatory interactions that can vary widely under different cellular and environmental conditions and, as such, are difficult to detect under one specific experimental condition. The extent of the CsrA regulatory network is of particular interest in the RNA field since studies of this major post-transcriptional network are instructive in our broad understanding of molecular interactions that underlie the versatility of RNA–protein regulation [23,27,28,29].
In this work, we characterize two mRNA targets that directly interact with the CsrA protein: evgA and acnA. EvgA is a transcriptional activator part of the EvgS/EvgA two-component system. EvgS is a sensor kinase that responds to changes in pH and the presence of monovalent cations (Na+, K+) [30], although the details regarding its sensing mechanism are still unknown. EvgA is activated by EvgS via phosphorelay, and it subsequently activates genes important for acid resistance, osmotic adaptation, and antibiotic resistance. Specifically, DNA microarrays identified genes of the acid resistance 2 (AR2) system, high osmolarity-induced genes, and genes encoding for multidrug efflux pumps as upregulated by the overproduction of EvgA [31]. Regarding AcnA, the apoform of this protein functions as an RBP that acts as a survival enzyme during nutritional and oxidative stress [32,33]. AcnA binds to the 3′ UTR of the acnA transcript preventing its degradation and increasing its translation, which provides a positive feedback mechanism to rapidly respond to stress [33]. Protein expression profiles using mutant strains revealed that AcnA enhances the production of additional anti-oxidative stress proteins such as SodA and TrxB, although sodA is the only transcript for which AcnA-mediated regulation has been characterized to date [34].
In this study, we characterize the interactions between CsrA and the mRNAs encoding for AcnA and EvgA using a mutational approach in combination with in vitro binding assays and in vivo reporter assays. Importantly, we show through RNA-seq and phenotypic assays that evgA and acnA represent intermediate regulatory hubs through which CsrA can expand its regulatory effects. We show that CsrA can influence acidic stress tolerance through its direct interaction with evgA and pathways related to metal ion-induced oxidative and osmotic stresses (DNA repair, amino acid biosynthesis, lipid biosynthesis, breakdown of oxygen radicals, and iron–sulfur cluster formation, among others) through its interaction with acnA.
Altogether, our results exemplify how the direct interaction between CsrA and mRNAs encoding for intermediate regulatory proteins, like EvgA and AcnA, allow CsrA to serve as a broad root node of regulation for bacterial gene expression and to have higher global reach in reshaping cellular behavior and controlling diverse physiological processes.

2. Materials and Methods

2.1. Plasmids and Strains

All E. coli strains used in this study are K-12 MG1655 derivatives and are listed in Supplementary Table S3. A detailed description of plasmids and the cloning strategy used to generate them can be found in Supplementary Table S4. Oligonucleotide primers and double-stranded DNA fragments used for cloning and as templates for in vitro transcription of RNA fragments were purchased from Integrated DNA Technologies (IDT; Coralville, IA, USA) and are included in Supplementary Table S5. Plasmid sequences were verified by long-read sequencing (Plasmidsaurus; Eugene, OR, USA). Genomic insertions were confirmed by PCR amplification followed by long-read amplicon sequencing (Plasmidsaurus; Eugene, OR, USA).
The original pUC19-T7link-sfGFP parent plasmid used in the cloning of the DNA template plasmids for in vitro transcription–translation assays was a generous gift from Dr. Svetlana Harbough and the AFRL team.
The evgA and acnA genomic mutants in which CsrA binding sites were mutated to eliminate CsrA-binding were generated as described in [4] using a CRISPR-cas9 genome modification protocol originally developed by Mehrer et al. (2015) [35]. Briefly, a two-plasmid system, generously provided by the lab of Dr. Brian Pfleger, was used to genomically insert a dsDNA sequence with the desired mutation in place of the genomic copy of evgA or acnA via cas9-mediated cleavage and λ-red recombination.

2.2. In Vitro Electrophoretic Mobility Shift Assays

RNA sequences for evgA, acnA, and their respective mutants were transcribed using the MEGA Script IVT Kit (Thermo Fisher Scientific; Waltham, MA, USA) following the manufacturer’s instructions. Double-stranded DNA templates were removed via DNase I digestion, and the quality of the transcripts was assessed on 8% urea gels stained with Sybr Green II (Thermo Fisher Scientific; Waltham, MA, USA). Afterward, 5′-end labeling was conducted using T4 Polynucleotide Kinase (NEB) and [gamma-32P] ATP (PerkinElmer; Waltham, MA, USA). RNAs were purified using DTR Gel Filtration Cartridges (EdgeBio; Gaithersburg, MD, USA), and their concentration was measured via fluorometric quantification using the Qubit RNA High Sensitivity Kit (Thermo Fisher Scientific; Waltham, MA, USA).
EMSAs were performed as described in [4]. The concentrations of CsrA were selected to mimic the protocol detailed in [36] with additional CsrA concentrations to expand the range in which a CsrA-RNA bound complex was initially observed to form. Radiolabeled RNAs were incubated with increasing concentrations of CsrA (0–300 nM) for 30 min prior to loading and running on a 10% non-denaturing polyacrylamide gel with 0.5× TBE running buffer (IBI Scientific; Dubuque, IA, USA; 10× composition: 89 mM Tris, 89 mM Boric Acid, 2 mM EDTA) at 170 V for 6–8 h at 4 °C. Gels were exposed overnight on phosphor-imaging cassettes (bioWORLD; Dublin, OH, USA) and imaged on a Typhoon FLA 700 (GE Health Life Science; Chicago, IL, USA) at 1000 V.

2.3. In Vivo Fluorescence Reporter Assays

Translational reporter assays were performed according to previously published methods using this system [22,37,38] with some modifications. Briefly, mRNA leader-gfp fusion plasmids were designed using pHL1756 as a parent plasmid (Addgene #53036). A detailed description of the cloning strategy is included in Supplementary Table S4. These plasmids were paired with a second plasmid, pHL600 (Addgene #37563), which contains csrA expression under the control of an IPTG-inducible promoter. The two-plasmid system was expressed in E. coli MG1655 K-12 ΔcsrABCD ΔpgaABCD ΔglgCAP (herein referred to as Csr system deletion strain). Single colonies were picked and grown overnight in 5 mL of LB media supplemented with 50 μg/mL kanamycin (Amresco; Solon, OH, USA) and 100 μg/mL carbenicillin (Grainger; Lake Forest, IL, USA). Afterward, the cells were seeded (1:100 dilution) in 30 mL of fresh media and grown at 37 °C and 120 rpm until they reached the target, OD600~0.4. At that point, the cultures were split in half and 1 mM IPTG was added to a 15 mL volume of culture to induce CsrA expressions. After two additional hours of growth, green fluorescence was measured with a BD LSRFortessa flow cytometer (~20,000 cells per sample). The final OD600 values were ~1.5–2.0. Fold changes in median green fluorescence between +CsrA and −CsrA conditions were determined for each biological replicate. To evaluate the statistical significance, the fluorescence values for each mRNA variant tested were contrasted to those of the negative controls by a heteroscedastic unpaired t-test (p-value ≤ 0.05).

2.4. In Vitro Coupled Transcription-Translation Assays

Coupled transcription–translation assays were conducted using the PURExpress kit (NEB; Ipswich, MA, USA) as described in [39] with a few modifications. Concretely, template DNA plasmids contained a T7 promoter driving the transcription of evgA-gfp, acnA-gfp, or their relevant mutants. Reaction mixtures containing 4.25 nM plasmid DNA template and various amounts of purified CsrA (0–2000 nM) were incubated for 4 h at 30 °C. GFP fluorescence was monitored every 15 min in a Cytation3 plate reader instrument. To evaluate the regulatory effects of CsrA, fluorescence values obtained for the reactions containing CsrA (125–2000 nM) were compared to those of the reactions without CsrA (0 nM) by a heteroscedastic unpaired t-test. Values with p-value ≤ 0.05 were considered statistically significant, indicating that CsrA addition was causing a regulatory effect in the translation of the fusion construct.

2.5. RNA Isolation and Transcriptomics Analysis

Total RNA was extracted from the cultures of biological triplicates grown in LB to the desired OD600 (0.8 for the Early Exponential condition, 1.5 for the Late Exponential condition, and 2.5 for Stationary; Supplementary Figure S5). Approximately 2 × 10⁹ cells per strain and condition were treated with 200 µL of lysozyme buffer (2 mg/mL, Thermo Fisher Scientific; Waltham, MA, USA) to allow for cell lysis. Afterward, the cells were spun down, and the supernatant was used for RNA clean-up and purification using the Quick DNA/RNA Miniprep Plus Kit (Zymo Research; Orage, CA, USA) and following the manufacturer’s instructions. RNA was treated with DNase I (NEB; Ipswich, MA, USA) and assessed for quality using a Bioanalyzer (Agilent; Santa Clara, CA, USA), with all samples having an RNA Integrity Number (RIN) of >9. RNA was submitted to the Center for Biomedical Research Support at the University of Texas at Austin for rRNA depletion, library preparation, and Illumina-based RNA sequencing (Illumina NovaSeq SP platform). All samples were depleted of rRNA before sequencing.
Raw RNA reads were processed using the resources of the Texas Advanced Computing Center (TACC) using previously described pipelines [22,40]. Following reads alignment, counting, and normalization, differential expression was determined using the DESeq2 package [41]. Contrasting each genomic mutant strain to the wild-type strain, the differential expression of a transcript was considered significant when, while using a Wald test, the Padj value was <0.05 and the log2 fold-change was ≥0.75.

2.6. Network Reconstruction and Analysis

Cluster networks were generated using the Cytoscape apps geneMANIA and clustermaker2 and visualized in Cytoscape version 3.10.1 [42]. Gene names and their respective log2 fold-change for Early Exponential, Late Exponential, and Stationary growth phases from the differential expression dataset were imported into geneMANIA to create associations between genes. Associations considered in geneMANIA include known co-expression, genetic interaction, physical interaction, and shared protein domains for each gene. The top-related genes were determined using automatic weighting. Clustermaker2 was used to cluster genes based on known functional relationships. The parameters used to create the cluster maps were a degree cutoff of 2, a “haircut” filter, a node cutoff score of 0.2, a k-core value of 2, a max depth of 100, and restoring inter-cluster edges after layout. Within each figure generated using geneMANIA and clustermaker2, each node on the cluster map represents a gene imported from the differential expression data or a gene inserted by Cytoscape during network reconstruction. The size of each node represents the number of growth conditions under which the gene of interest was found to be differentially expressed. Genes with similar functions were filled with the same color, while genes clustered together were outlined with the same color. Genes with an unknown function are filled in gray, while genes not in a cluster have a thin black outline.

3. Results

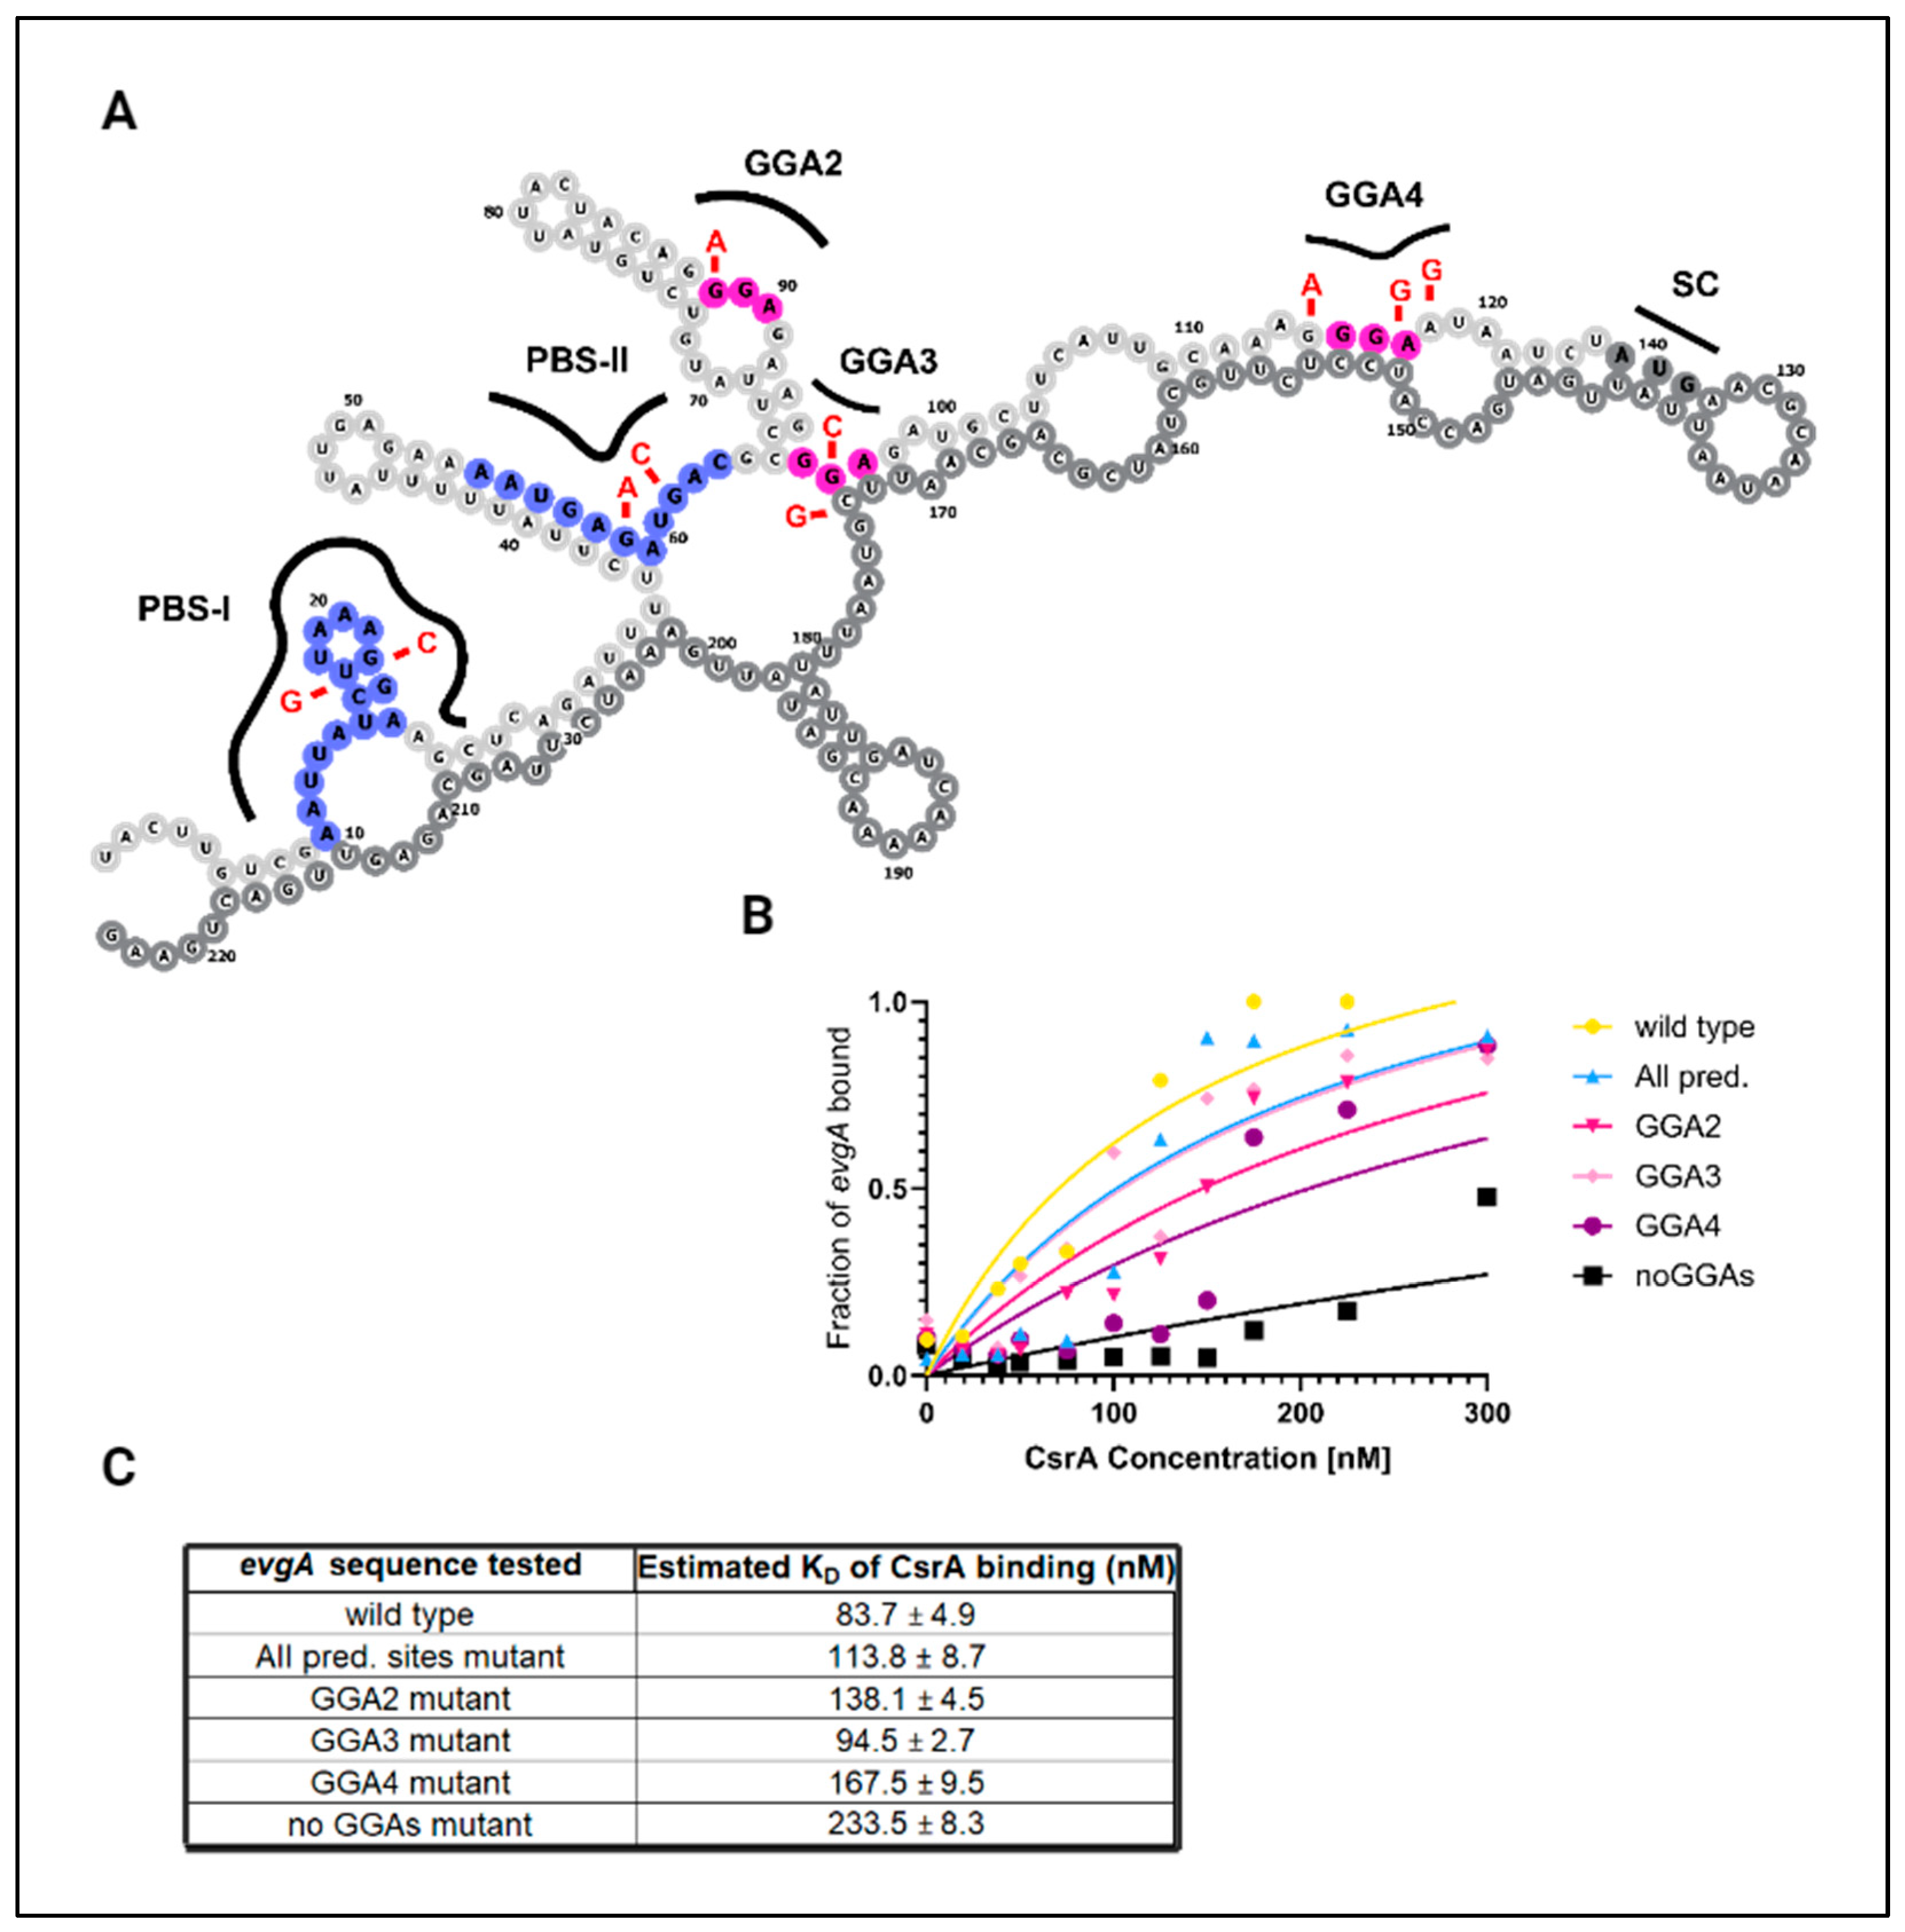
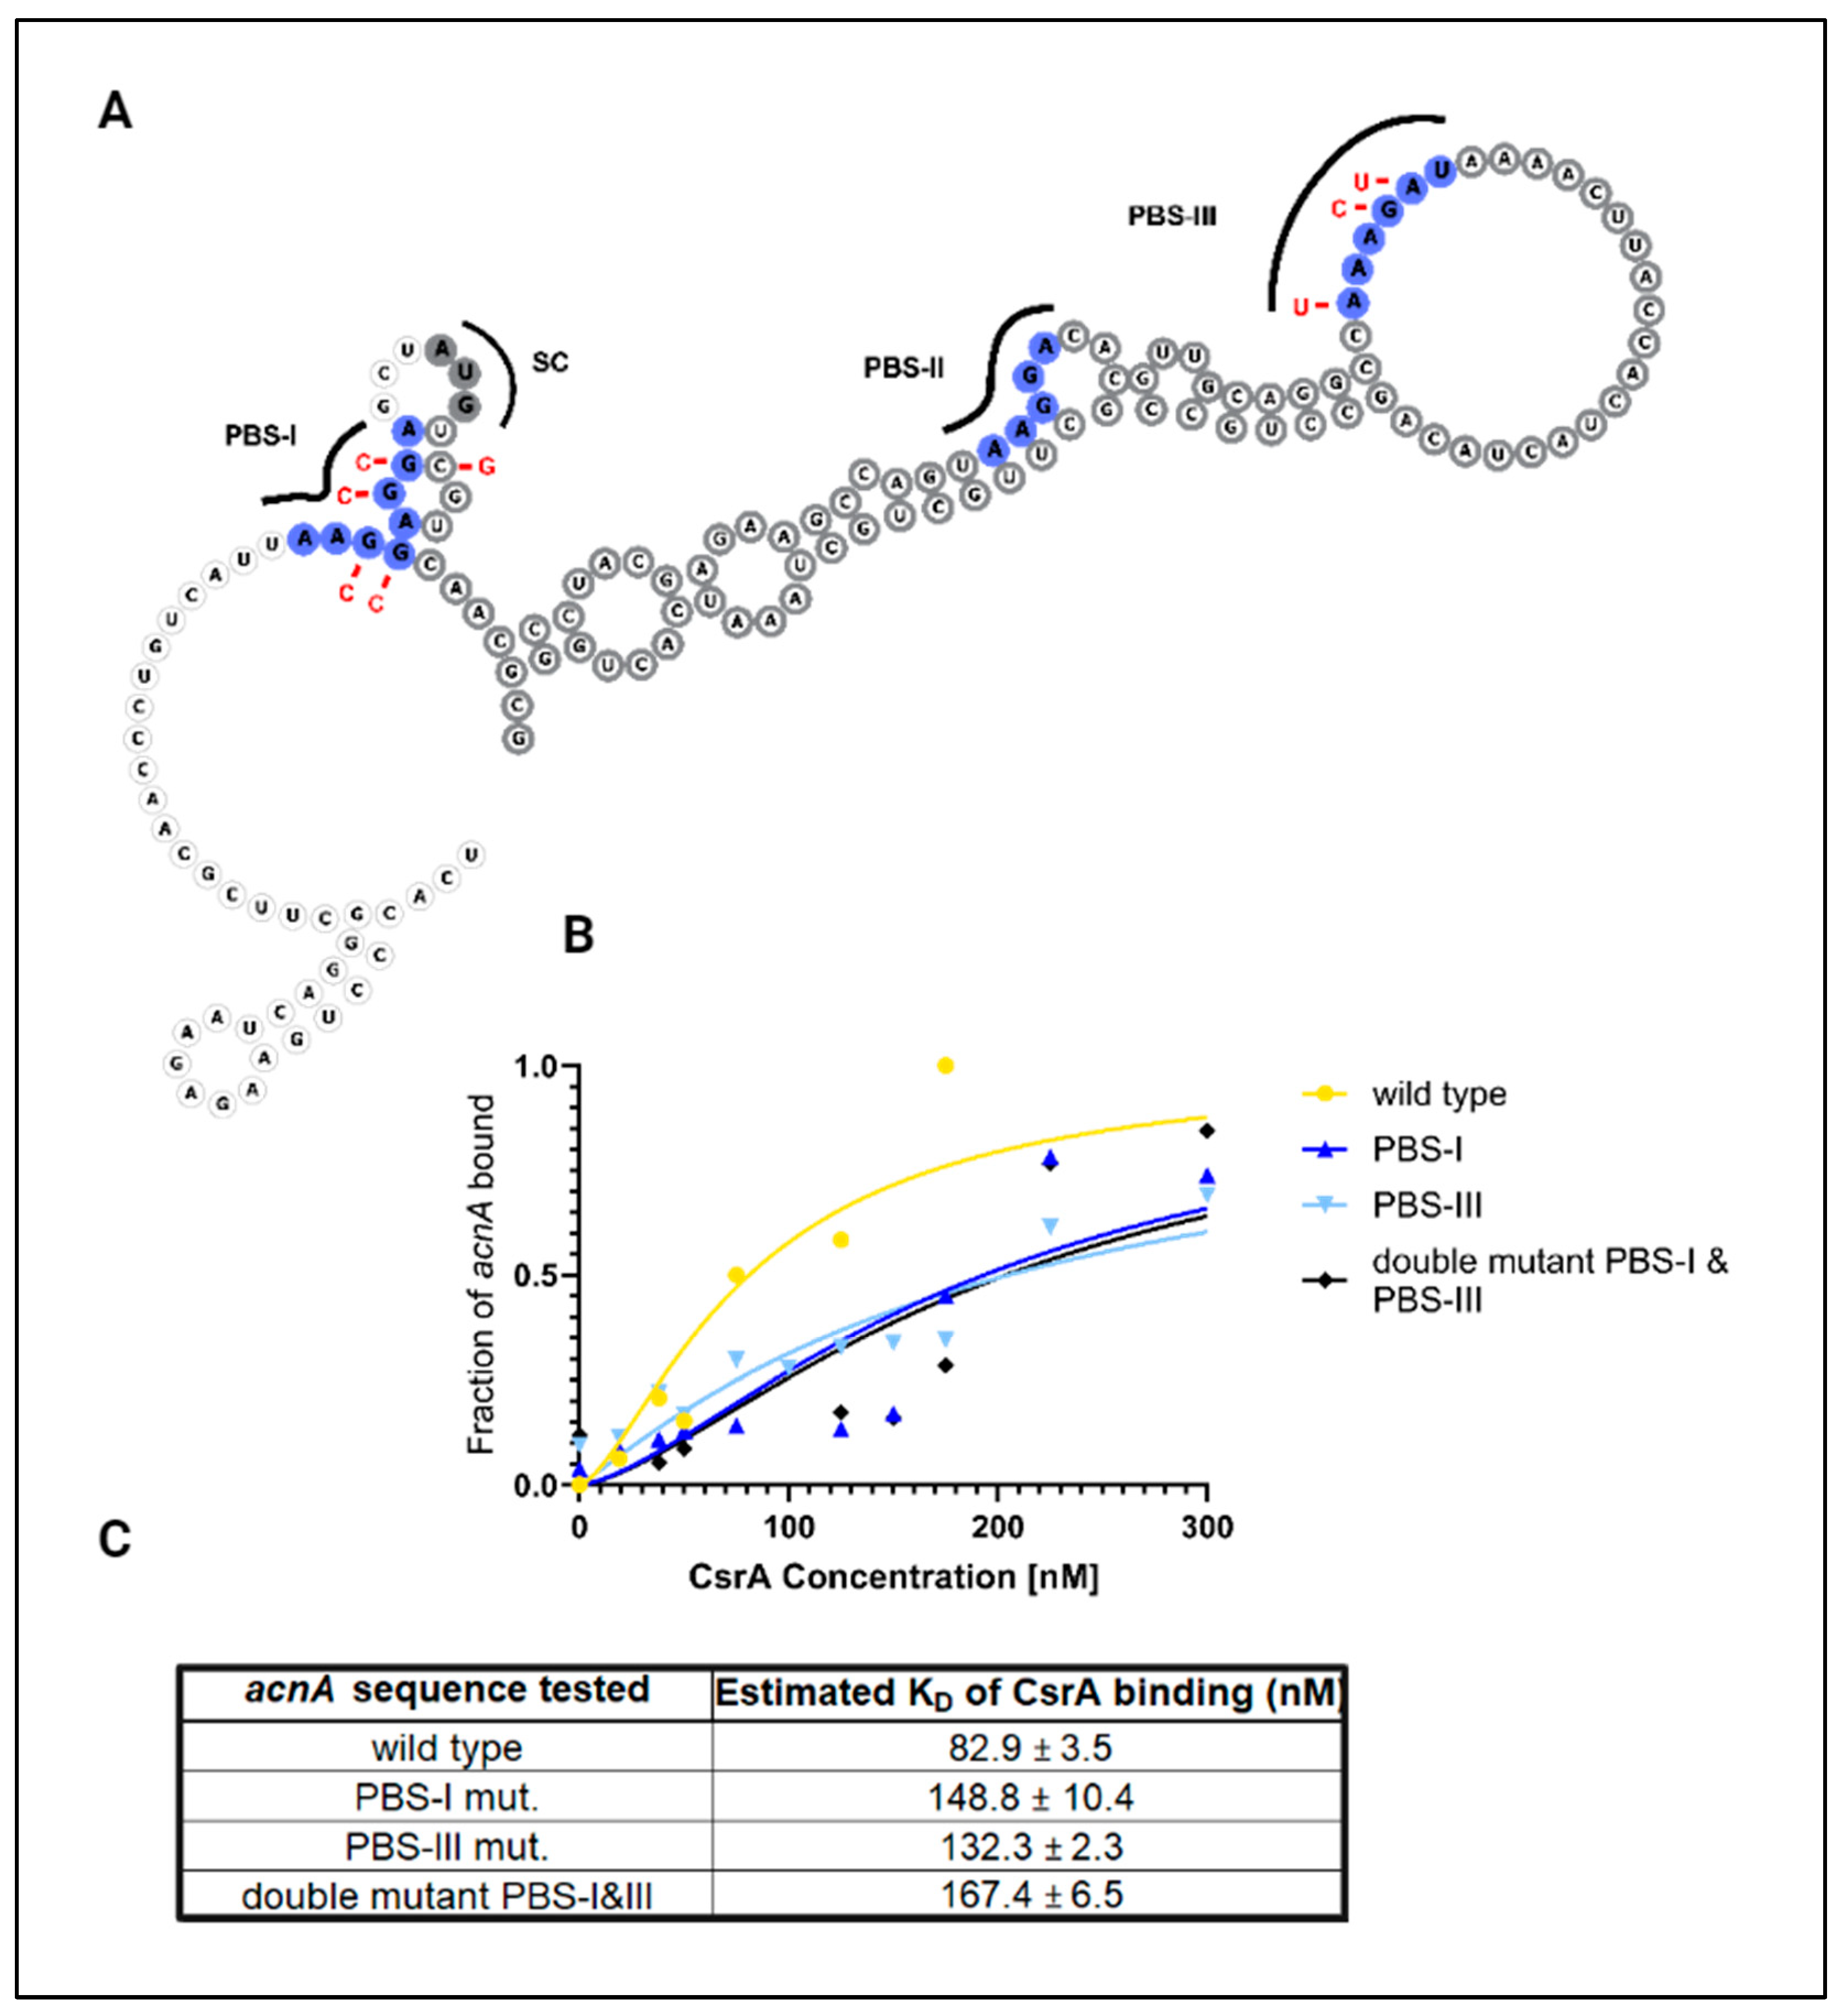
3.1. CsrA Binds Directly to the Leader Sequences of the evgA and acnA Transcripts Encoding Regulatory Proteins

The regulatory impact of CsrA on 92 functional RNA targets was demonstrated by Sowa et al. (2017) [22] and Leistra et al. (2018) [23] using in vivo translational reporter assays, although direct CsrA-binding was not evaluated in those works. Two interesting observations from these works are as follows: (i) approximately 20% of CsrA functional targets, identified via reporter assays, encode for regulatory proteins (i.e., transcription factors, RNA-binding proteins, post-translational-modification proteins, etc.) and (ii) for these regulatory proteins, several of their known targets were identified as genes that are functionally impacted by the cellular presence of CsrA, which could suggest complex regulatory networks involving both direct and indirect CsrA targets (Supplementary Table S1). Specifically, this interplay suggested to us that, for some of the 92 functional RNA targets, CsrA regulation could be potentially impacted indirectly by the direct binding of CsrA to mRNAs that encode for their known regulatory partners, which could be acting as “intermediate regulatory hubs”. Here, we define an intermediate regulatory hub as a central node that broadens the number of genes that CsrA can indirectly influence and allows for the fine-tuning of bacterial regulatory networks in response to external cues. In that sense, an intermediate regulatory hub, as it pertains to the CsrA regulon, is a regulatory protein with known downstream targets that have been identified as functionally affected by CsrA (presumably due to indirect effects), and eliminating CsrA regulation of these genes results in broad changes to the expression of downstream networks.
To evaluate the role of CsrA as a regulator of intermediate regulatory hubs, we selected two CsrA functional targets representative of two different types of regulatory proteins: evgA, which encodes for the transcriptional activator EvgA, and acnA, which encodes for a post-transcriptional regulator, AcnA. We chose these targets as examples of how CsrA could expand its influence on gene expression by controlling regulators that act at two different layers of regulation (transcriptional and post-transcriptional). Furthermore, these represented two convenient case studies due to their known regulated processes and distinct phenotypes. Concretely, EvgA is implicated in resistance to mildly acidic pH [43] and osmotic stress [31], as well as in multidrug resistance [44], and AcnA is associated with adaptation to nutritional and oxidative stress [32,33].
We first evaluated direct CsrA-binding to both the evgA and acnA mRNA transcripts using in vitro electrophoretic mobility shift assays (EMSAs). Specifically, 0.5 nM of P32- radiolabeled RNA was incubated with increasing concentrations of CsrA. Binding reactions were conducted as described by Yakhnin et al. (2012) [36] and others, and the formation of CsrA-RNA bound complexes was assessed using native polyacrylamide gel electrophoresis (PAGE). Similar to previous studies, the leader sequences (consisting of the annotated 5′ UTR and the first 100 nt of coding sequence) of acnA and evgA were used to evaluate binding, since CsrA is known to predominantly bind to the 5′ UTR and first nucleotides of coding sequence of its target RNAs; the exact sequences used for these experiments are listed in Supplementary Table S5 under “T7-acnA-WT” and “T7-evgA-WT”. From these assays, we determined CsrA to bind evgA with an apparent KD ~ 83.7 ± 4.9 nM (Figure 1A) and to acnA with an apparent KD ~90.9 ± 3.5 nM (Figure 1B). These values are on par with previously reported KD values of CsrA-binding in E. coli, which range from 4 to 95 nM depending on the target RNA [12,21]. Higher order species (marked with an *) were observed at 300 nM CsrA, suggesting that CsrA potentially can simultaneously bind to more than one mRNA copy (Figure 1). Importantly, CsrA-evgA and CsrA-acnA interactions were successfully recapitulated in vivo using a plasmid-based fluorescence complementation assay previously developed in our lab [45,46] and shown to capture true CsrA interactions [4,22]. For evgA, we detected a 60% increase in YFP fluorescence signal relative to the phoB negative control, indicating successful YFP complementation that generated a signal above the background. Similarly, a 30% increase in fluorescence signal was observed relative to the phoB negative control when evaluating the interaction between CsrA and acnA (Supplementary Figure S1).
To identify CsrA binding sites within evgA and acnA, we applied a mutational analysis approach combined with in vitro EMSAs (Supplementary Methods, Supplementary Table S5). Within the evgA sequence, thermodynamic modeling identified two binding pockets (defined as long stretches of overlapping ANGGN-like sites) within the 5′UTR of evgA as potential CsrA binding sites [23]. There are three additional GGA motifs in the 5′ UTR that were not predicted by the model but were selected for our mutational analysis since these are high-affinity motifs for CsrA-binding (Figure 2A). In the case of acnA, three GGA motifs (two located consecutively upstream of the start codon and one within the first 40 nucleotides of the coding sequence) were identified as potential CsrA binding sites from thermodynamic modeling by Leistra et al. (2018) [23]. An additional ANGGN-like sequence contained in a large, open loop in the coding sequence of acnA was identified as a potential CsrA binding site by the same model. In total, three potential binding sites in the acnA transcript were considered for mutational analysis: two corresponding to high-affinity GGA motifs and one corresponding to a non-consensus ANGGN-like sequence (Figure 3A).
In our mutational analysis, potential CsrA binding sites were mutated individually and collectively, and changes in the equilibrium binding constant (KD) were determined via EMSAs for the CsrA-evgA and CsrA-acnA interactions. When possible, GGA→GCA substitutions were made to each mRNA transcript since this mutation has been reported to be sufficient to eliminate CsrA-binding [5]. Complementary mutations were made to preserve the predicted secondary structure and base-pairing probability of the mRNA sequences. If a potential CsrA binding site was located at the coding region of the mRNA, synonymous mutations were made to preserve codon identity. Supplementary Figure S2 (for evgA) and Supplementary Figure S3 (for acnA) show detailed schematics of the mutations introduced in each tested mRNA variant and their resulting binding curves.
We first mutated the potential CsrA binding sites in the evgA leader predicted by Leistra et al. (2018) [23], which included one GGA motif in the first predicted binding site (PBS-I) and a non-consensus ANGGA-like site (PBS-II). The resulting mutant (labeled as “All pred. sites mutant”) had a modest ~1.2-fold increase in the apparent dissociation constant (KD) for its interaction with CsrA, suggesting that there are other sites within the evgA leader that CsrA can interact with. We next mutated the other three GGA motifs in evgA which represent potential sites for CsrA-binding (labeled as GGA2, GGA3, and GGA4). Using this approach, we identified “GGA2”, corresponding to the second GGA motif within the 5′ UTR of evgA, and “GGA4”, which overlaps the Shine–Dalgarno sequence, as the most likely CsrA binding sites (Figure 2C). Mutating “GGA2” (GGA→AGA) leads to a ~1.6-fold increase in the KD for the CsrA- evgA interaction, while mutating “GGA4” (AGGGAA→AAGGGG) increases the KD by ~2-fold. Importantly, while this work was in revision, Gorelik et al. (2024) also identified GGA4 as a CsrA-binding site within evgA [47]. Like other previously characterized direct CsrA targets, eliminating all the GGA motifs in the evgA sequence (no GGAs mutant) drastically reduces binding, as observed by the ~2.8-fold increase in KD and the reduced amplitude of the binding curve (Figure 2B,C).
For acnA, mutating the GGA motifs of a potential binding site (GGAGGA→CCACCA) located upstream of the start codon (herein referred to as PBS-I) results in a ~1.7-fold increase in KD. Similarly, mutating the non-consensus ANGGN-like sequence (AAAGAU→UAACUU) in the coding sequence (herein referred to as PBS-III) increases the KD by ~1.6-fold (Figure 3B,C). When both the upstream GGA motifs and the non-consensus ANGGN-like site (binding sites PBS-I and PBS-III) were mutated simultaneously (GGAGGA/AAAGAU→CCACCA/UAACUU), we observed a cumulative increase of ~2-fold in KD. From these results, we concluded that CsrA interacts predominantly with binding sites PBS-I and PBS-III of acnA. The contribution of both sites to CsrA-acnA binding was further supported by in vivo binding assays. In these assays, mutations at either PBS-I or PBS-III significantly impaired YFP complementation and led to a fluorescence signal that was indistinguishable from that of the phoB negative control (Supplementary Figure S4).

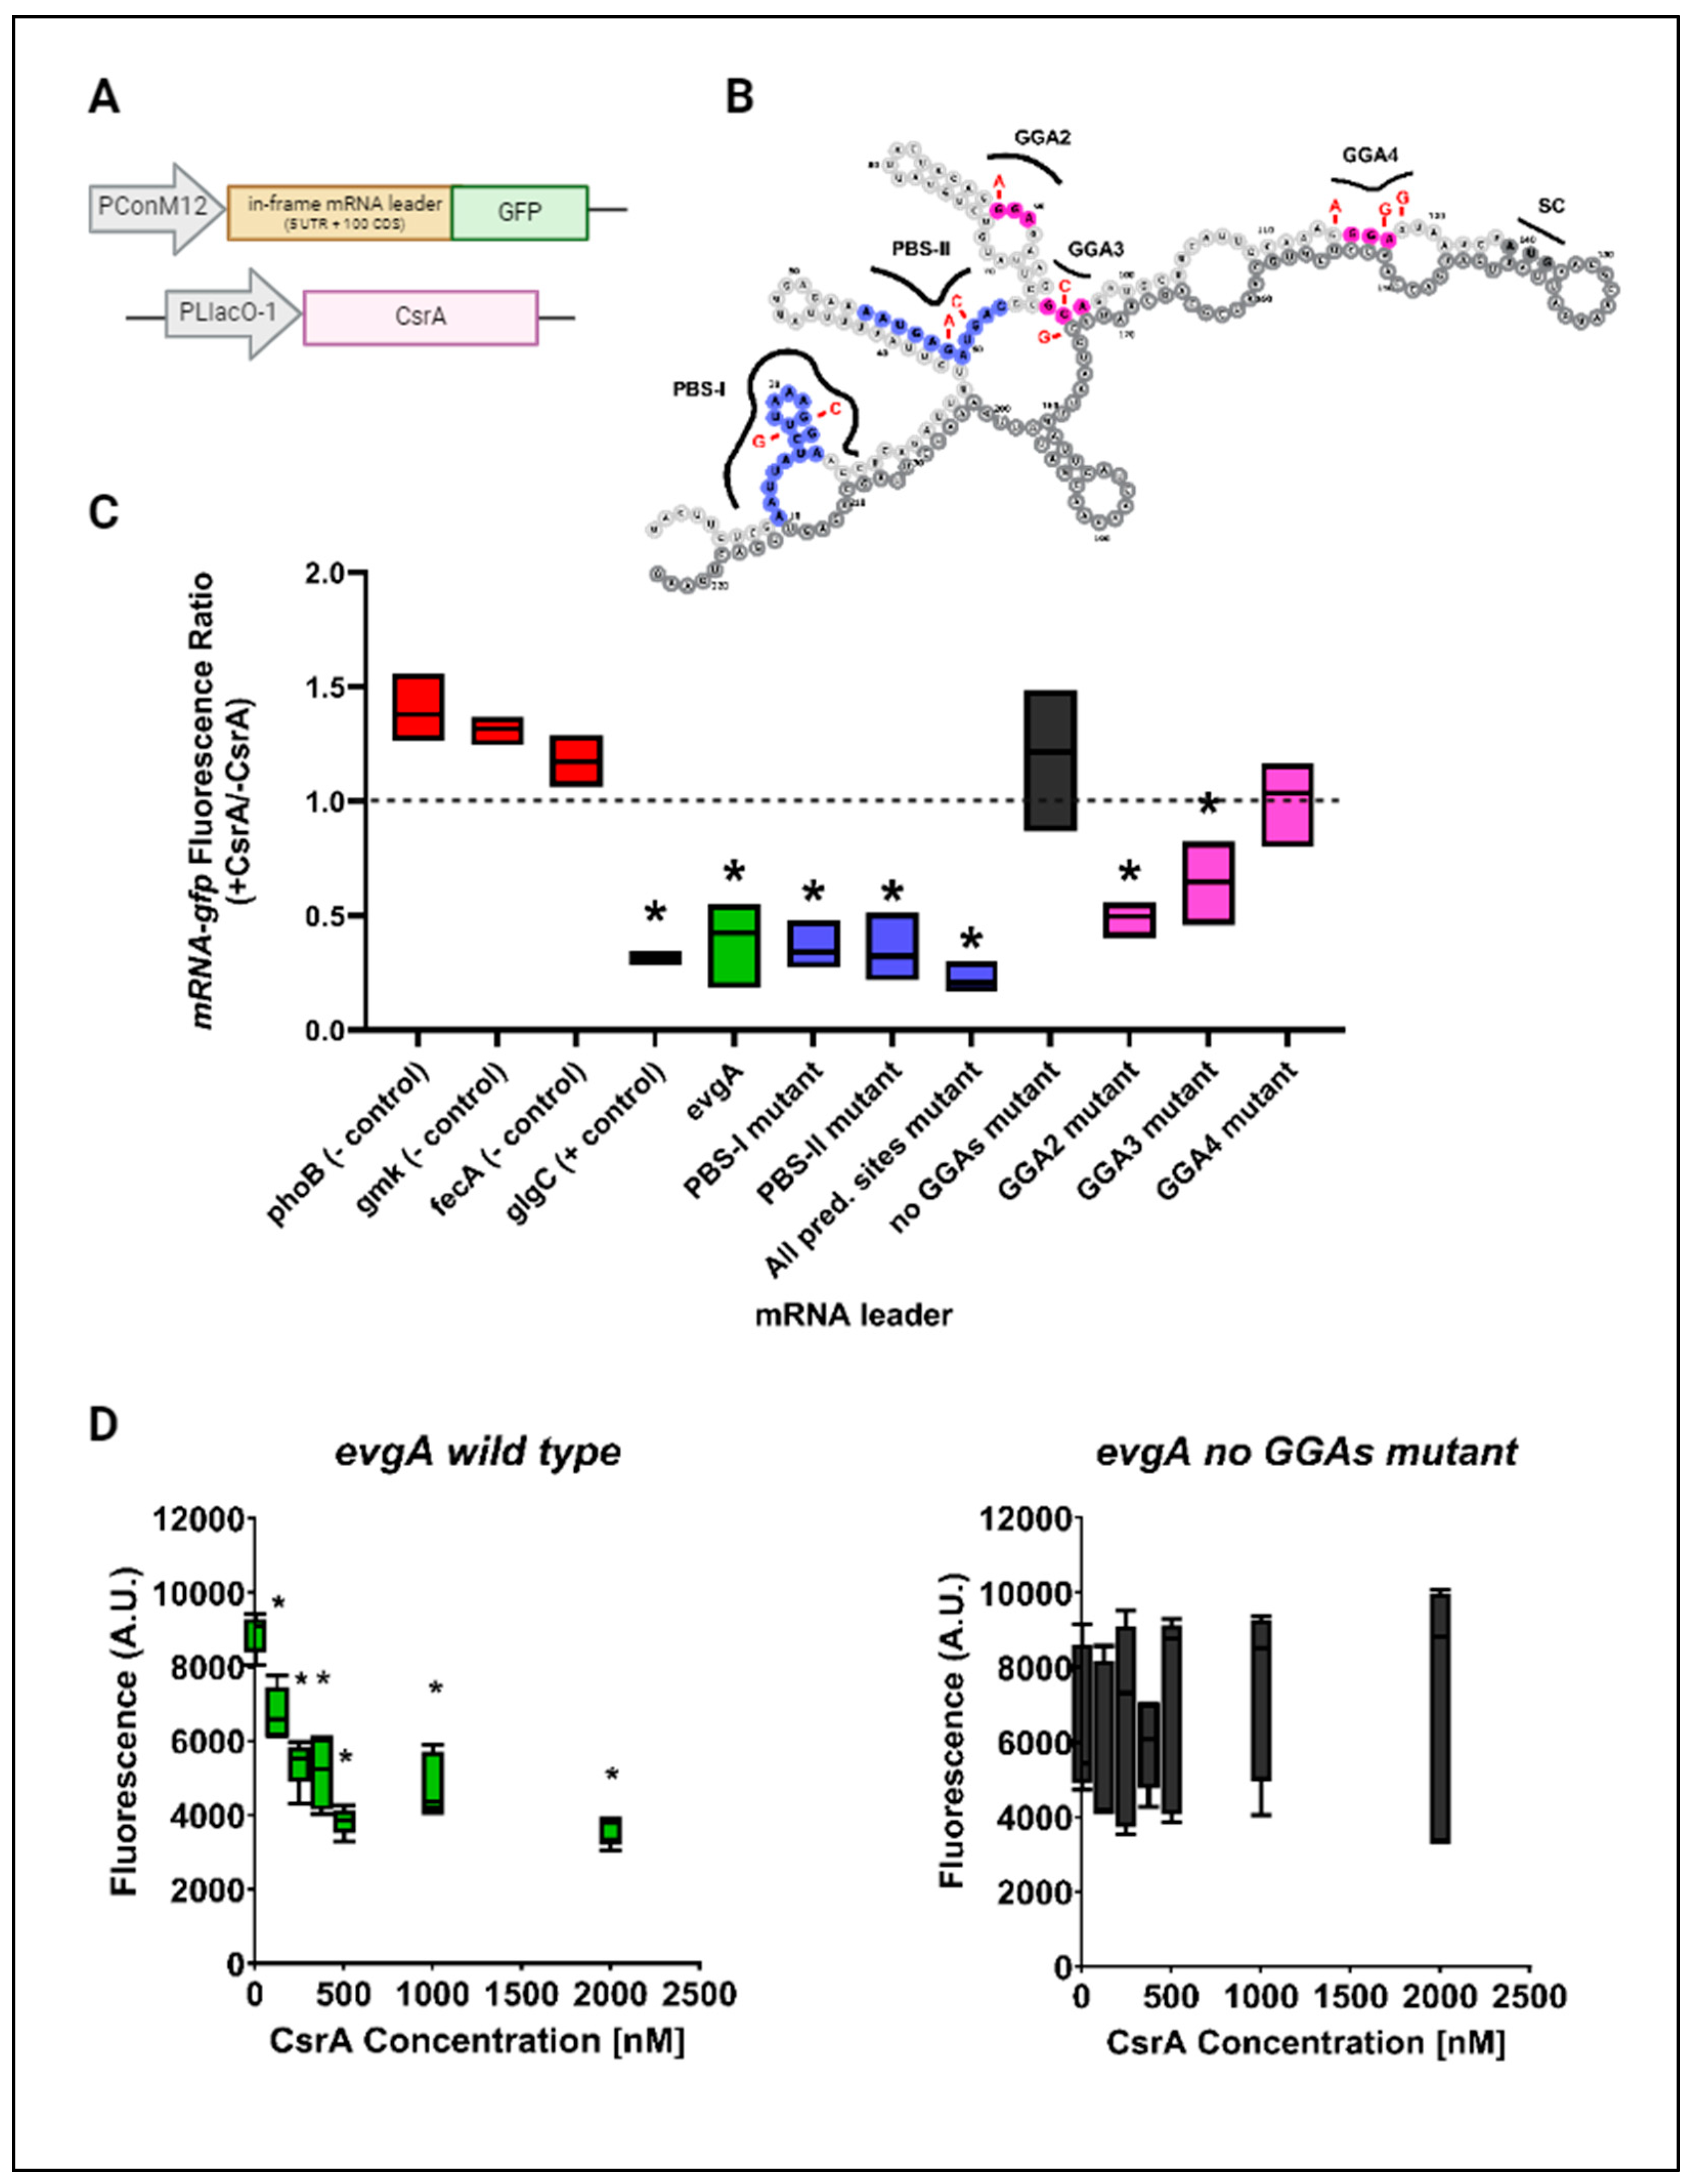
3.2. CsrA Represses Both evgA and acnA In Vivo and In Vitro

From our mutational analysis and binding assays, we identified regions of evgA and acnA that contribute to CsrA-binding. In both mRNA targets, one of the likely CsrA binding sites is located near the start codon (i.e., “GGA4” in evgA and “PBS-I” in acnA). Traditionally, CsrA-binding at the Shine–Dalgarno sequence, or near the start codon, impedes ribosome binding and results in translational repression [48]. To investigate how CsrA impacts the expression of evgA and acnA, we applied an in vivo translational expression assay, previously developed by Adamson et al. (2013) [37] and adapted by Sowa et al. (2017) [22], to characterize CsrA-target interactions in vivo. In our experiments, the leader sequences of evgA and acnA, plus respective binding site mutants, were fused in-frame to a GFP reporter (Supplementary Methods, Supplementary Table S4). The plasmid containing our translational fusions was transformed into E. coli MG1655 K-12 ΔcsrABCD ΔpgaABCD ΔglgCAP (herein referred to as Csr system deletion strain), together with a second plasmid containing CsrA under an IPTG-inducible promoter (Figure 4A), to enable controlling CsrA expressions. In the Csr system deletion strain, the glgCAP and pgaABCD operons are deleted to ensure cellular fitness upon the deletion of csrA [37]. Using this system, we compared the expression of our translational fusions in the presence and absence of CsrA. A previously developed glgC-gfp fusion reporter was used as a positive control [22]. Like previous observations using this reporter, the presence of CsrA (e.g., IPTG-induction of its expression) reduced the expression of the glgC-gfp fusion by ~2.5 fold, confirming its role as a repressor of glgC. Three negative control fusion reporters were also included in these experiments (phoB-gfp, gmk-gfp, and fecA-gfp). Minor changes in fluorescence upon CsrA induction were observed for all three reporters, confirming the lack of effect of CsrA presence in their expression. These changes were used to establish a baseline level and allowed us to differentiate between true activation and indirect effects upon induction with IPTG (Figure 4C).
In the case of evgA, CsrA induction reduced the expression of our translational reporter, indicating that CsrA-binding also represses evgA translation. This effect was alleviated only in the “GGA4” mutant and in the evgA mutant lacking GGA motifs, further indicating that “GGA4” is a preferred CsrA binding site and that CsrA binds evgA at high-affinity GGA motifs (likely “GGA2” and “GGA4”) (Figure 4C). To rule out indirect effects upon CsrA induction, we also assessed the regulatory effects of the CsrA-evgA interaction using an in vitro coupled transcription–translation PURExpress system (herein referred to as IVTT). In this system, the expression of an in-frame evgA-gfp fusion is driven by a T7 RNA polymerase promoter, and increasing concentrations of purified CsrA are added to the IVTT reactions. Consistent with our in vivo translational assays (Figure 4C), the expression of the evgA-gfp fusion was reduced upon the addition of CsrA, indicating that CsrA represses evgA translation (Figure 4D, left). Like the in vivo reporter, mutating all GGAs in the evgA leader sequence eliminated CsrA-dependent repression in vitro (Figure 4D, right).
We observed repression of the acnA-gfp fusion upon CsrA induction in vivo (Figure 5C) using the same reporter system described above (Figure 5A). This effect was alleviated by mutating either binding site PBS-I or binding site PBS-III, suggesting that both sites are critical for CsrA-binding. The in vivo repression of acnA (Figure 5C) was recapitulated in vitro using the PURExpress IVTT system. In these in vitro reactions, the addition of CsrA resulted in a reduction in acnA translation (Figure 5D, left), but had no significant effect on the expression of the acnA double mutant-gfp fusion (binding sites PBS-I and PBS-III mutated simultaneously), further demonstrating that these two sites mediate the CsrA-acnA interaction (Figure 5D, right). It is worth mentioning that the repressive effects of CsrA in vitro are smaller than those observed in vivo. It is possible that the binding of CsrA in vivo induces structural changes that prevent additional enhancer factors, not present in the in vitro reactions, from binding the acnA leader, further repressing acnA translation in a cellular context.
From these experiments, we concluded that CsrA binds evgA predominantly through the “GGA4” site and leads to translational repression, and that CsrA binds and represses acnA through the binding sites PBS-I and PBS-III. Notably, the binding site PBS-III of acnA is a non-consensus ANGGN-like site located at the coding sequence of the mRNA transcript. This finding expands the growing list of targets for which CsrA-binding occurs through a combination of a high-affinity GGA site and a degenerate, non-consensus ANGGN motif, as previously reported [4,9]. While the use of degenerate binding sites might be a more prevalent phenomenon among CsrA targets, only a few examples of these types of sites contributing to CsrA-binding have been characterized to date.

3.3. CsrA Influences Distinct Stress Phenotypic Clusters through Its Interactions with evgA and acnA

To investigate how CsrA-binding affects the respective gene target networks of EvgA and AcnA, we generated evgA and acnA genomic mutants in which CsrA binding sites were mutated to significantly reduce or eliminate the interactions between CsrA and these transcripts (Materials and Methods, Supplementary Table S2). We anticipated that this approach would allow us to capture the indirect targets of CsrA whose regulation is primarily mediated through evgA or acnA, since only the CsrA interaction with these central nodes would be impaired. To analyze transcriptional changes associated with strains with defective/abolished CsrA-evgA and CsrA-acnA interactions, we extracted RNA from genomic mutant strains and wild-type E. coli MG1655 K-12 at three growth phases (Early Exponential (OD600~0.8), Mid-Exponential (OD600~1.5), and Stationary phase (OD600~2.5)) (Supplementary Figure S5) to observe the effects of altering CsrA-binding over a broader window of time.
After conducting RNA-seq analysis to compare gene expressions in the evgA genomic mutant relative to the wild-type E. coli MG1655 K-12 (parent strain), we identified a total of 36 genes as differentially expressed (at least 0.75 log2 fold-change; Padj cutoff of <0.05) across the three growth conditions; 34 out of these 36 genes were differentially expressed during early exponential growth (Supplementary Table S6). Interestingly, while some of these genes (19/36) have been previously reported to be functionally altered by CsrA (i.e., CsrA affected their expression as determined via RNA-seq of a CsrA defective (csrA::kan) strain or using reporter assays), no evidence of direct binding has been reported in most cases (i.e., they have not been consistently detected in pull-down studies; only ydcT and cysI) (Figure 6A, Supplementary Tables S6 and S8). These observations indicated that CsrA regulation of these targets is primarily indirect and coordinated through the EvgA regulatory hub.
We next identified biologically relevant patterns and functional relationships between differentially expressed genes in the evgA genomic mutant strain via cluster analysis. Three clusters of functionally related genes were identified (Figure 6D), corresponding to acid resistance (outlined in red), formate oxidation (purple), and polyamine transport (green). EvgA-mediated acid resistance is relatively well understood. In response to changes in pH, EvgA transcriptionally activates the ydeP-safA-ydeO operon which activates the central regulator of the acid resistance 2 (AR2) system, GadE, through YdeO and a secondary activation route via the PhoP/Q two-component system (Figure 7) [43]. Our results suggest that ydeP-safA-ydeO, and gadE are functional targets of CsrA that are indirectly affected through its direct interaction with evgA. Formate oxidation is relevant to maintaining pH homeostasis and proton balance [49], and polyamines are stress molecules that promote the synthesis of proteins of the AR2 system [50,51], suggesting that the three clusters identified in this work together contribute to the cellular response to acid stress. While a direct link between EvgA and the genes in these last two clusters has not been established, they are likely part of the EvgA-coordinated response to acidic stress [52,53]. We further conducted enrichment analysis as a second approach to identify processes influenced by the CsrA-evgA interaction (Figure 6C). Using the enrichGO function of clusterProfiler [54,55] on our list of differentially expressed genes, we identified additional significantly enriched processes such as the metabolism of sialic acids (which is key for bacterial adaptation in the human gut, [56]), protein sulfydration (which plays an important role during cell signaling, [57]), organic phosphonate metabolism, and ribosomal assembly, which could all be involved in the mechanisms of EvgA-mediated multidrug resistance [58].
In parallel, upon disruption of the CsrA-acnA interaction, we observed that a total of 58 genes were differentially expressed by contrasting gene expression in the CsrA-acnA genomic mutant strain to that of wild-type E. coli. Similarly, to the evgA mutant, most genes (54/58) were previously observed to have a differential expression at early exponential growth (Supplementary Table S7). Over half of these genes have been functionally linked to CsrA (31/58) in the past, although evidence suggesting direct, physical CsrA-RNA interactions has only been reported for eight of them (rpoE, osmF, IdtE, dps, sdhD, yjbJ, treA, and cysI) (Figure 8A, Supplementary Tables S7 and S9). Our clustering analysis identified five unique clusters within differentially expressed genes (Figure 8D): one related to iron–sulfur cluster assembly during oxidative stress (outlined in red), one encompassing two homologs of a toxin–antitoxin system (fic-yhfG) (yellow), one including the poxB and tktB genes (which have been detected to be up-regulated at the protein level under aerobic, high-osmolarity conditions [59]) (purple), one corresponding to the ydcSTUV-patD operon (involved in putrescine transport, [60]) (blue), and a large cluster of genes involved in metal ion stress responses and DNA damage (green). Enrichment analysis by gene ontology further identified metal ion-related pathways as the most significantly enriched biological processes upon disruption of the CsrA-acnA interaction. (Figure 8C). This was particularly interesting, given that high concentrations of metal ions, and in particular heavy metals, are known to elicit both oxidative stress [61] and osmotic stress [62] responses in bacteria. The known role of AcnA as an RBP during oxidative stress [33], together with the differential expression of genes related to oxidative and osmotic stress adaptation, suggests a role for AcnA as a central regulator of metal ion responses and adaptation (Figure 9); in this proposed network, CsrA indirectly influences metal stress-related pathways through its regulation of acnA. Altogether, our findings illustrate a mechanism in which CsrA can achieve widespread control of stress responses through direct interactions with intermediate regulatory nodes (such as evgA and acnA).

3.4. The CsrA-evgA Interaction Is Important for Acidic Stress Tolerance in E. coli

To investigate whether disrupting the CsrA-evgA interaction would generate biologically relevant phenotypes, we compared the survivability of the evgA genomic mutant of CsrA binding sites (labeled as evgA no GGAs genomic mutant in Figure 10) to that of wild-type E. coli K-12 MG1655 after being challenged with acidic conditions (pH = 2–5). The acid challenge was performed based on previous work by Nishino et al. (2003) [31] since acid stress responses are coordinated by the EvgA/EvgS two-component system. In these previous experiments, they observed that cells that lack the acrAB operon (E. coli KAM3) showed increased resistance to extremely acidic conditions when overexpressing evgA (7.9% survival compared to 0.1% survival for E. coli KAM3 at pH = 2.0). In our experiments, the cells were additionally challenged to mild (pH = 5.0) and extreme (pH = 3.5) acidic conditions since native induction of EvgA-regulated genes occurs at pH values of 5.5–4.5 [63], thereby suggesting that protective effects could potentially be observed at less extreme conditions (i.e., higher pH). As shown in Figure 10A, the CsrA-evgA genomic disruption mutant showed increased tolerance to acid stress, even under mildly acidic conditions. At pH 5, wild-type E. coli survivability was lower compared to that of the evgA genomic mutant (~40% reduction, p-value = 0.005). The enhanced survivability of the evgA genomic mutant strain was also observed at pH 3.5 (p-value = 0.002). Similar trends were observed when cells were spot-plated after the acidic challenge (Figure 10B), thereby demonstrating that the CsrA-evgA interaction impacts acid stress adaptation.

3.5. CsrA Influences Metal Ion Tolerance in E. coli through Its Interaction with acnA

RNA-seq results contrasting the expression patterns of an acnA genomic mutant (for which CsrA binding sites were mutated to disrupt the CsrA-acnA interaction) to those of wild-type E. coli suggest a central role for AcnA in mediating tolerance to heavy metals by regulating metal-induced oxidative stress and osmotic stress response processes (Figure 9). Previous work has shown that AcnA, in its inactive form, is an RNA-binding protein that contributes to adaptation during stationary growth and oxidative stress [34]. To evaluate if disrupting the CsrA-acnA interaction would result in a change in bacterial tolerance to metal stress, we examined the growth of the acnA genomic mutant strain in the presence of increasing concentrations of CuSO4 or CuCl2 and compared it to the growth of wild-type E. coli when exposed to the same concentrations of these metals. Both mutant and wild-type E. coli showed normal, exponential growth under ≤5 mM CuSO4 and ≤1.5 mM CuCl2. The acnA genomic mutant, however, had slightly improved tolerance to both metals (~10% increase in growth, p-value < 0.05 for CuSO4 after challenged for 8 h; ~7% increase in growth, p-value < 0.05 for CuCl2 after challenged for 8 h). These differences are apparent after eight hours of metal stress challenge (Figure 11A, middle and right panels). To better capture these differences, the cells were spot-plated in serial dilutions eight hours post-stress. The acnA genomic mutant was unaffected by CuSO4, as indicated by the equal cell density in unstressed and stressed cells. Wild-type E. coli was slightly more affected than the mutant, particularly when challenged with 5 mM CuSO4 (Figure 11B). Differences in growth were more apparent when cells were challenged with CuCl2. Increased tolerance by the acnA genomic mutant was evident at both 3 mM and 5 mM CuCl2 (Figure 11C), indicating that the CsrA-acnA interaction negatively controls adaptation to heavy metal-induced stress and validating the role of AcnA as an intermediate regulator of metal ion response systems.
Cells were additionally challenged with increasing concentrations of Mg2+ since elevated concentrations of this ion can also be toxic to the cell and create ionic and osmotic stress [64,65]. While both strains grew similarly when supplemented with MgCl2 (Supplementary Figure S6A, middle), significant differences were observed with the addition of increasing concentrations of MgSO4. Concretely, at 0.5 and 1 M MgSO4, the acnA genomic mutant had a significantly increased tolerance to stress during exponential growth (Supplementary Figure S6A, right). Similar trends were observed when spot-platting the cells after being challenged with MgSO4 for 8 h (which is immediately before the timepoint at which we observed cells plateau and start declining in the 30 h growth curves) (Supplementary Figure S6B). However, at 0.5 M MgCl2, the wild-type strain showed increased tolerance compared to the acnA genomic mutant in these experiments. We attributed the enhanced tolerance to high MgSO4 concentrations to AcnA-mediated regulation of osmotic response systems. Likewise, the difference in tolerance when using the metal chloride or metal sulfate could be explained by differences in the intracellular uptake of these salts [66].

4. Discussion

CsrA is a global regulatory protein that influences numerous biological processes in E. coli. It has been proposed that CsrA may expand its regulatory influence over gene expression by directly binding and controlling other regulatory genes (such as those encoding for transcription factors or other regulatory proteins) which in turn control additional sub-specialized gene networks. However, confirmation of direct interactions between CsrA and these regulatory genes in vivo, as well as a mechanistic understanding of the regulatory outcome upon CsrA-binding, is yet to be elucidated in most cases.
In this work, we have validated direct interactions between CsrA and two mRNA targets, evgA and acnA (Figure 1), which are repressed upon CsrA-binding (Figure 4 and Figure 5). Importantly, these two genes encode for regulatory proteins (a transcriptional regulator and an RNA-binding protein, respectively), which influence the expression of additional gene networks. As such, we hypothesized that evgA and acnA represent intermediate regulatory hubs that allow CsrA to extend its control over global gene expression. Notably, after identifying the regions of evgA and acnA that mediate CsrA-binding (Figure 2 and Figure 3) and generating genomic mutants with disrupted CsrA-evgA and CsrA-acnA interactions, we observed differential expression of many genes that have been previously proposed to be functionally affected by CsrA (Figure 6 and Figure 8). These results support the role of evgA and acnA as intermediate regulatory hubs for CsrA regulation.
In the case of EvgA, we found that it allows CsrA to indirectly coordinate genes involved in acidic stress responses. This was further demonstrated by the enhanced tolerance of the evgA genomic mutant strain to this stress (Figure 10). Within the EvgA-mediated response to acid stress, RNA-seq results suggest that ydeP-safA-ydeO and gadE (which are functionally affected by CsrA) are indirect CsrA targets coordinated through the direct binding and regulation of the evgA transcript. The response to acidic stress is further facilitated via EvgA-mediated activation of the PhoP/Q two-component system which activates GadE through RpoS, another previously identified functional target of CsrA [67,68]. A schematic summarizing this regulatory circuitry is shown in Figure 7. Genes of the polyamine transport (ydcSTUV-patD) and formate oxidation (fdnGHI) clusters represent interesting candidates to further characterize the CsrA-evgA regulatory network and better understand the systems level response to acid stress in E. coli. While we did not investigate the impact of the CsrA-evgA interaction in multidrug tolerance, the identification of several enriched pathways related to antibiotic resistance suggests a potential regulatory role for CsrA indirectly affecting these processes through evgA.
For AcnA, disrupting the CsrA-acnA interaction resulted in differential expression of genes related to metal-induced oxidative and osmotic stress. This suggested a central role of AcnA in mediating the adaptation to high concentrations of metal ions, and of particularly heavy metals that create oxidative stress. This role and the influence of CsrA over these processes through its interaction with acnA was further validated by phenotypic assays showing increased survivability of the acnA genomic mutant when challenged with increasing concentrations of metal ions (Figure 9 and Figure 11). Importantly, genes participating in these processes that were found to be differentially expressed upon disruption of the CsrA-acnA interaction are potential direct targets of AcnA, and further evaluation of their interactions would significantly expand our understanding of AcnA-mediated regulation. A simplified depiction of this network based on our findings is shown in Figure 9.
While the use of acnA and evgA genomic mutants depleted of CsrA binding sites allowed us to capture genes that are predominantly indirect CsrA targets, it is plausible that some of these genes could also be direct CsrA targets (which would suggest regulation redundancy). For instance, rpoE is a characterized direct target of CsrA which was found to be differentially expressed upon disruption of the CsrA-acnA interaction. Future work evaluating the target overlaps of the CsrA, AcnA, and EvgA regulatory proteins and the hierarchy of interactions will bring novel insights into the regulatory circuitry between their regulatory networks. It is interesting to think about how the dynamic regulation of mRNA transcripts might be achieved by simultaneously exerting direct and indirect regulation (i.e., via intermediate regulatory hubs for efficient genome-wide phenotypic shifts under stress).
Overall, we identified the network of genes affected by CsrA through their interactions with acnA and evgA and characterized relevant phenotypes for each network. Importantly, these results exemplify how CsrA can globally control gene expression through a combination of direct and indirect effects; this can represent a mechanism by which global regulatory proteins can have a broader effect in efficient post-transcriptional cell rewiring under stress. Recently, the sra, bdm, and raiA were identified as indirect CsrA targets [21], suggesting that the regulation of intermediate regulators by CsrA plays a larger role in expanding the regulatory network of this protein and that additional cases exist beyond EvgA and AcnA. Potentially, CsrA regulation of these regulators can alter the active pool of regulatory proteins—like in the case of regulators with overlapping putative targets that can work in concert or antagonize each other—that interact with target genes under specific conditions. How global post-transcriptional regulatory proteins, like CsrA, orchestrate combinatorial effects of regulatory interactions is an outstanding question that could be addressed with the development of integrative approaches to simultaneously interrogate multiple regulatory networks.

Supplementary Materials

The following supporting information can be downloaded at: https://www.mdpi.com/article/10.3390/microorganisms12040636/s1, Supplementary Table S1.List of functional CsrA targets. Supplementary Table S2. evgA and acnA genomic mutants generated to hinder CsrA-mediated regulation. Supplementary Table S3. List of strains used in this study. Supplementary Table S4. List of plasmids and cloning techniques used in this study. Supplementary Table S5. List of oligos used in this study. Supplementary Table S6. DESeq2 analysis of transcriptomics experiment constrasting the evgA genomic mutant strain to the wild type strain. Supplementary Table S7. DESeq2 analysis of transcriptomics experiment constrasting the acnA genomic mutant strain to the wild type strain. Supplementary Table S8. Summary of differentially expressed genes in evgA genomic mutant. Supplementary Table S9. Summary of differentially expressed genes in acnA genomic mutant. Supplementary Information. Figure S1. CsrA binds to evgA and acnA in vivo. Direct protein-RNA binding was evaluated using a three-component fluorescence complementation assay. The leader sequence of the mRNA of interest is fused to the MS2 binding domain, the rrnB terminator, an MS2-linker-CYFP protein fusion, and a CsrA-linker-NYFP fusion. Direct CsrA-mRNA binding results in complementation of the YFP protein generates a fluorescence output. Fluorescence values are presented as the median of five independent biological replicates. Significantly higher fluorescence relative to the phoB-negative control indicates positive direct binding. Figure created with BioRender.com. Figure S2. Mutational analysis for the evgA leader sequence. The secondary structure of evgA was predicted using the Vienna RNA webserver. Mutations were designed to preserve the secondary structure and base-pairing probability of the overall structure. Binding sites considered for analysis (yellow) and the introduced mutations (red) are shown next to the structure. Figure S3. Mutational analysis for the acnA leader sequence. The secondary structure of acnA was predicted using the Vienna RNA webserver. Mutations were designed to preserve the secondary structure and base-pairing probability of the overall structure. Binding sites considered for analysis (yellow) and the introduced mutations (red) are shown next to the structure. For acnA wild type, lanes 5 and 6 were flipped with an image editor for consistency. Figure S4. In vivo binding assays support CsrA binding at PBS-I and PBS-III of acnA. Direct protein-RNA binding was evaluated using a three-component fluorescence complementation assay. (A) The leader sequence of acnA and different mutant versions were cloned into the pTriFC plasmid to test for in vivo CsrA-binding. (B) Direct CsrA-RNA binding results in complementation of the YFP protein, generating a fluorescence output. Fluorescence values are presented as the median of five independent biological replicates. Significantly higher fluorescence relative to the phoB-negative control indicates positive direct binding. Mutations to either PBS-I or PBS-III deterred YFP complementation, as evidenced by the reduction in YFP signal to background levels. Figure S5. Growth curves of E. coli MG1655 wild type, acnA and evgA genomic mutants. (A) Growth curves of E. coli K-12 MG1655 (parent strain, left), E. coli evgA no GGAs genomic mutant (middle), and E. coli acnA dm13 genomic mutant (right). The gray and black dots represent OD values measured by spectrophotometry for biological duplicates. The resulting fitted growth curves were used as input in a Baranyi bacterial growth model to obtain the growth parameters shown in (B). From the model result, samples representative of different growth phases were chosen for analysis. Specifically, the sample is at OD600~0.8 (Early Exponential), OD600~1.5 (Late Exponential), OD600~2.5 (Stationary). Superimposed growth curves are shown for reference: wild type (black), evgA genomic mutant (blue), and acnA genomic mutant (green). Figure S6. CsrA influences bacterial tolerance to metal stress through its interaction with acnA. (A) Growth curves of E. coli wild-type and acnA genomic mutant strains in LB media only (left) and LB media supplemented with increasing concentrations of MgCl2 (middle) and MgSO4 (right). Shading denotes the standard deviation between biological duplicates. (B) Cells were challenged with increasing concentrations of MgCl2 (top, middle, & right) and MgSO4 (bottom) for 8 h. Serial dilutions of the cultures post-stress were spot plated to observe differences in metal stress tolerance. References in the Supplementary Information Document are included in the list of References [69,70,71,72].

Author Contributions

Conceptualization, A.M.R.-N. and L.M.C.; methodology, A.M.R.-N., K.B.G. and L.M.C.; validation, A.M.R.-N. and K.B.G.; formal analysis, A.M.R.-N. and K.B.G.; investigation, A.M.R.-N., K.B.G., J.S.R. and J.L.A.; data curation, A.M.R.-N.; writing—original draft preparation, A.M.R.-N.; writing—review and editing, A.M.R.-N., K.B.G. and L.M.C.; visualization, A.M.R.-N. and K.B.G.; supervision, L.M.C.; project administration, A.M.R.-N. and L.M.C. All authors have read and agreed to the published version of the manuscript.

Funding

This research was funded by the Welch Foundation [F-1756]; the National Institutes of Health [grant number R01GM135495 to L.M.C.]; National Science Foundation [grant numbers MCB-1932780 to L.M.C.]; a Fulbright Garcia-Robles Fellowship [to A.M.R.-N.]; and a University of Texas at Austin Continuing Graduate Fellowship [to A.M.R.-N.].

Data Availability Statement

All RNA-seq data referenced in this text have been uploaded to the SRA database and can be publicly accessed via BioProject number PRJNA1069781.

Acknowledgments

We thank Tony Romeo, Han Lim, Brian Pfleger, and Svetlana Harbaugh for their gifts of several E. coli strains and plasmids used in this work. Acknowledgment is also given to Richard Salinas for flow cytometry training and assistance in setting acquisition gates at the University of Texas at Austin, Microscopy, and Imaging Facility. We additionally thank Faith Guice and Sung H. Jung for their assistance in preliminary in vivo reporter assays. We also thank Phillip Sweet for his advice regarding sample preparation and data analysis for RNA sequencing, and for his valuable feedback during the preparation of this manuscript. Finally, we thank Abigail Leistra and Mia Mihailovic for their guidance and advice during the experimental design phase of this work; we also thank other members of the Contreras group for helpful conversations and feedback.

Conflicts of Interest

The authors declare no conflicts of interest.

References

  1. Romeo, T.; Gong, M.; Liu, M.Y.; Brun-Zinkernagel, A.M. Identification and molecular characterization of csrA, a pleiotropic gene from Escherichia coli that affects glycogen biosynthesis, gluconeogenesis, cell size, and surface properties. J. Bacteriol. 1993, 175, 4744–4755. [Google Scholar] [CrossRef] [PubMed]
  2. Potts, A.H.; Vakulskas, C.A.; Pannuri, A.; Yakhnin, H.; Babitzke, P.; Romeo, T. Global role of the bacterial post-transcriptional regulator CsrA revealed by integrated transcriptomics. Nat. Commun. 2017, 8, 1596. [Google Scholar] [CrossRef] [PubMed]
  3. Pourciau, C.; Pannuri, A.; Potts, A.; Yakhnin, H.; Babitzke, P.; Romeo, T. Regulation of Iron Storage by CsrA Supports Exponential Growth of Escherichia coli. mBio 2019, 10, e01034-19. [Google Scholar] [CrossRef] [PubMed]
  4. Rojano-Nisimura, A.M.; Simmons, T.R.; Leistra, A.N.; Mihailovic, M.K.; Buchser, R.; Ekdahl, A.M.; Joseph, I.; Curtis, N.C.; Contreras, L.M. CsrA selectively modules sRNA-mRNA regulatory outcomes. Front. Mol. Biosci. 2023, 2023, 1249528. [Google Scholar] [CrossRef]
  5. Dubey, A.K.; Baker, C.S.; Romeo, T.; Babitzke, P. RNA sequence and secondary structure participate in high-affinity CsrA-RNA interaction. RNA 2005, 11, 1579–1587. [Google Scholar] [CrossRef]
  6. Baker, C.S.; Morozov, I.; Suzuki, K.; Romeo, T.; Babitzke, P. CsrA regulates glycogen biosynthesis by preventing translation of glgC in Escherichia coli. Mol. Microbiol. 2002, 44, 1599–1610. [Google Scholar] [CrossRef]
  7. Dubey, A.K.; Baker, C.S.; Suzuki, K.; Jones, A.D.; Pandit, P.; Romeo, T.; Babitzke, P. CsrA regulates translation of the Escherichia coli carbon starvation gene, cstA, by blocking ribosome access to the cstA transcript. J. Bacteriol. 2003, 185, 4450–4460. [Google Scholar] [CrossRef] [PubMed]
  8. Wang, X.; Dubey, A.K.; Suzuki, K.; Baker, C.S.; Babitzke, P.; Romeo, T. CsrA post-transcriptionally represses pgaABCD, responsible for synthesis of a biofilm polysaccharide adhesin of Escherichia coli. Mol. Microbiol. 2005, 56, 1648–1663. [Google Scholar] [CrossRef]
  9. Baker, C.S.; Eöry, L.A.; Yakhnin, H.; Mercante, J.; Romeo, T.; Babitzke, P. CsrA inhibits translation initiation of Escherichia coli hfq by binding to a single site overlapping the Shine-Dalgarno sequence. J. Bacteriol. 2007, 189, 5472–5481. [Google Scholar] [CrossRef]
  10. Jonas, K.; Edwards, A.N.; Simm, R.; Romeo, T.; Römling, U.; Melefors, O. The RNA binding protein CsrA controls cyclic di-GMP metabolism by directly regulating the expression of GGDEF proteins. Mol. Microbiol. 2008, 70, 236–257. [Google Scholar] [CrossRef]
  11. Edwards, A.N.; Patterson-Fortin, L.M.; Vakulskas, C.A.; Mercante, J.W.; Potrykus, K.; Vinella, D.; Camacho, M.I.; Fields, J.A.; Thompson, S.A.; Georgellis, D.; et al. Circuitry linking the Csr and stringent response global regulatory systems. Mol. Microbiol. 2011, 80, 1561–1580. [Google Scholar] [CrossRef]
  12. Yakhnin, H.; Baker, C.S.; Berezin, I.; Evangelista, M.A.; Rassin, A.; Romeo, T.; Babitzke, P. CsrA represses translation of sdiA, which encodes the N-acylhomoserine-L-lactone receptor of Escherichia coli, by binding exclusively within the coding region of sdiA mRNA. J. Bacteriol. 2011, 193, 6162–6170. [Google Scholar] [CrossRef]
  13. Yakhnin, H.; Yakhnin, A.V.; Baker, C.S.; Sineva, E.; Berezin, I.; Romeo, T.; Babitzke, P. Complex regulation of the global regulatory gene csrA: CsrA-mediated translational repression, transcription from five promoters by Eσ⁷⁰ and Eσ(S), and indirect transcriptional activation by CsrA. Mol. Microbiol. 2011, 81, 689–704. [Google Scholar] [CrossRef]
  14. Pannuri, A.; Yakhnin, H.; Vakulskas, C.A.; Edwards, A.N.; Babitzke, P.; Romeo, T. Translational repression of NhaR, a novel pathway for multi-tier regulation of biofilm circuitry by CsrA. J. Bacteriol. 2012, 194, 79–89. [Google Scholar] [CrossRef]
  15. Jørgensen, M.G.; Thomason, M.K.; Havelund, J.; Valentin-Hansen, P.; Storz, G. Dual function of the McaS small RNA in controlling biofilm formation. Genes Dev. 2013, 27, 1132–1145. [Google Scholar] [CrossRef] [PubMed]
  16. Yakhnin, A.V.; Baker, C.S.; Vakulskas, C.A.; Yakhnin, H.; Berezin, I.; Romeo, T.; Babitzke, P. CsrA activates flhDC expression by protecting flhDC mRNA from RNase E-mediated cleavage. Mol. Microbiol. 2013, 87, 851–866. [Google Scholar] [CrossRef]
  17. Park, H.; McGibbon, L.C.; Potts, A.H.; Yakhnin, H.; Romeo, T.; Babitzke, P. Translational Repression of the RpoS Antiadapter IraD by CsrA Is Mediated via Translational Coupling to a Short Upstream Open Reading Frame. mBio 2017, 8, e01355-17. [Google Scholar] [CrossRef] [PubMed]
  18. Yakhnin, H.; Aichele, R.; Ades, S.E.; Romeo, T.; Babitzke, P. Circuitry Linking the Global Csr- and σE-Dependent Cell Envelope Stress Response Systems. J. Bacteriol. 2017, 199, e00484-17. [Google Scholar] [CrossRef] [PubMed]
  19. Renda, A.; Poly, S.; Lai, Y.-J.; Pannuri, A.; Yakhnin, H.; Potts, A.H.; Bevilacqua, P.C.; Romeo, T.; Babitzke, P. CsrA-Mediated Translational Activation of ymdA Expression in Escherichia coli. mBio 2020, 11, e00849-20. [Google Scholar] [CrossRef] [PubMed]
  20. Lai, Y.J.; Yakhnin, H.; Pannuri, A.; Pourciau, C.; Babitzke, P.; Romeo, T. CsrA regulation via binding to the base-pairing small RNA Spot 42. Mol. Microbiol. 2022, 117, 32–53. [Google Scholar] [CrossRef] [PubMed]
  21. Pourciau, C.; Yakhnin, H.; Pannuri, A.; Gorelik, M.G.; Lai, Y.-J.; Romeo, T.; Babitzke, P. CsrA coordinates the expression of ribosome hibernation and anti-σ factor proteins. mBio 2023, 14, e0258523. [Google Scholar] [CrossRef] [PubMed]
  22. Sowa, S.W.; Gelderman, G.; Leistra, A.N.; Buvanendiran, A.; Lipp, S.; Pitaktong, A.; Vakulskas, C.A.; Romeo, T.; Baldea, M.; Contreras, L.M. Integrative FourD omics approach profiles the target network of the carbon storage regulatory system. Nucleic Acids Res. 2017, 45, 1673–1686. [Google Scholar] [CrossRef] [PubMed]
  23. Leistra, A.N.; Gelderman, G.; Sowa, S.W.; Moon-Walker, A.; Salis, H.M.; Contreras, L.M. A Canonical Biophysical Model of the CsrA Global Regulator Suggests Flexible Regulator-Target Interactions. Sci. Rep. 2018, 8, 9892. [Google Scholar] [CrossRef]
  24. McKee, A.E.; Rutherford, B.J.; Chivian, D.C.; Baidoo, E.K.; Juminaga, D.; Kuo, D.; Benke, P.I.; Dietrich, J.A.; Ma, S.M.; Arkin, A.P.; et al. Manipulation of the carbon storage regulator system for metabolite remodeling and biofuel production in Escherichia coli. Microb. Cell Fact. 2012, 11, 79. [Google Scholar] [CrossRef] [PubMed]
  25. Kulkarni, P.R.; Jia, T.; Kuehne, S.A.; Kerkering, T.M.; Morris, E.R.; Searle, M.S.; Heeb, S.; Rao, J.; Kulkarni, R.V. A sequence-based approach for prediction of CsrA/RsmA targets in bacteria with experimental validation in Pseudomonas aeruginosa. Nucleic Acids Res. 2014, 42, 6811–6825. [Google Scholar] [CrossRef]
  26. Esquerré, T.; Bouvier, M.; Turlan, C.; Carpousis, A.J.; Girbal, L.; Cocaign-Bousquet, M. The Csr system regulates genome-wide mRNA stability and transcription and thus gene expression in Escherichia coli. Sci. Rep. 2016, 6, 25057. [Google Scholar] [CrossRef]
  27. Romeo, T.; Babitzke, P. Global Regulation by CsrA and Its RNA Antagonists. Microbiol. Spectr. 2018, 6, 341–354. [Google Scholar] [CrossRef]
  28. Gerovac, M.; El Mouali, Y.; Kuper, J.; Kisker, C.; Barquist, L.; Vogel, J. Global discovery of bacterial RNA-binding proteins by RNase-sensitive gradient profiles reports a new FinO domain protein. RNA 2020, 26, 1448–1463. [Google Scholar] [CrossRef]
  29. Katsuya-Gaviria, K.; Paris, G.; Dendooven, T.; Bandyra, K.J. Bacterial RNA chaperones and chaperone-like riboregulators: Behind the scenes of RNA-mediated regulation of cellular metabolism. RNA Biol. 2022, 19, 419–436. [Google Scholar] [CrossRef]
  30. Eguchi, Y.; Utsumi, R. Alkali metals in addition to acidic pH activate the EvgS histidine kinase sensor in Escherichia coli. J. Bacteriol. 2014, 196, 3140–3149. [Google Scholar] [CrossRef]
  31. Nishino, K.; Inazumi, Y.; Yamaguchi, A. Global analysis of genes regulated by EvgA of the two-component regulatory system in Escherichia coli. J. Bacteriol. 2003, 185, 2667–2672. [Google Scholar] [CrossRef]
  32. Cunningham, L.; Gruer, M.J.; Guest, J.R. Transcriptional regulation of the aconitase genes (acnA and acnB) of Escherichia coli. Microbiology 1997, 143 Pt 12, 3795–3805. [Google Scholar] [CrossRef]
  33. Tang, Y.; Guest, J.R. Direct evidence for mRNA binding and post-transcriptional regulation by Escherichia coli aconitases. Microbiology 1999, 145 Pt 11, 3069–3079. [Google Scholar] [CrossRef]
  34. Tang, Y.; Quail, M.A.; Artymiuk, P.J.; Guest, J.R.; Green, J. Escherichia coli aconitases and oxidative stress: Post-transcriptional regulation of sodA expression. Microbiology 2002, 148 Pt 4, 1027–1037. [Google Scholar] [CrossRef]
  35. Mehrer, C.R.; Incha, M.R.; Politz, M.C.; Pfleger, B.F. Anaerobic production of medium-chain fatty alcohols via a β-reduction pathway. Metab. Eng. 2018, 48, 63–71. [Google Scholar] [CrossRef]
  36. Yakhnin, A.V.; Yakhnin, H.; Babitzke, P. Gel mobility shift assays to detect protein-RNA interactions. Methods Mol. Biol. 2012, 905, 201–211. [Google Scholar] [CrossRef] [PubMed]
  37. Adamson, D.N.; Lim, H.N. Rapid and robust signaling in the CsrA cascade via RNA-protein interactions and feedback regulation. Proc. Natl. Acad. Sci. USA 2013, 110, 13120–13125. [Google Scholar] [CrossRef] [PubMed]
  38. Leistra, A.N.; Amador, P.; Buvanendiran, A.; Moon-Walker, A.; Contreras, L.M. Rational Modular RNA Engineering Based on In Vivo Profiling of Structural Accessibility. ACS Synth. Biol. 2017, 6, 2228–2240. [Google Scholar] [CrossRef] [PubMed]
  39. Lukasiewicz, A.J.; Contreras, L.M. Antisense probing of dynamic RNA structures. Methods 2020, 183, 76–83. [Google Scholar] [CrossRef] [PubMed]
  40. Sweet, P.; Blacutt, J.; Gordon, V.; Contreras, L. Exposure of Shewanella oneidensis MR-1 to Sublethal Doses of Ionizing Radiation Triggers Short-Term SOS Activation and Longer-Term Prophage Activation. Appl. Environ. Microbiol. 2023, 89, e0171622. [Google Scholar] [CrossRef] [PubMed]
  41. Love, M.I.; Huber, W.; Anders, S. Moderated estimation of fold change and dispersion for RNA-seq data with DESeq2. Genome Biol. 2014, 15, 550. [Google Scholar] [CrossRef]
  42. Shannon, P.; Markiel, A.; Ozier, O.; Baliga, N.S.; Wang, J.T.; Ramage, D.; Amin, N.; Schwikowski, B.; Ideker, T. Cytoscape: A software environment for integrated models of biomolecular interaction networks. Genome Res. 2003, 13, 2498–2504. [Google Scholar] [CrossRef]
  43. De Biase, D.; Lund, P.A. The Escherichia coli Acid Stress Response and Its Significance for Pathogenesis. Adv. Appl. Microbiol. 2015, 92, 49–88. [Google Scholar] [CrossRef]
  44. Nishino, K.; Yamaguchi, A. EvgA of the two-component signal transduction system modulates production of the yhiUV multidrug transporter in Escherichia coli. J. Bacteriol. 2002, 184, 2319–2323. [Google Scholar] [CrossRef]
  45. Gelderman, G.; Sivakumar, A.; Lipp, S.; Contreras, L. Adaptation of Tri-molecular fluorescence complementation allows assaying of regulatory Csr RNA-protein interactions in bacteria. Biotechnol. Bioeng. 2015, 112, 365–375. [Google Scholar] [CrossRef]
  46. Leistra, A.N.; Mihailovic, M.K.; Contreras, L.M. Fluorescence-Based Methods for Characterizing RNA Interactions In Vivo. Methods Mol. Biol. 2018, 1737, 129–164. [Google Scholar] [CrossRef]
  47. Gorelik, M.G.; Yakhnin, H.; Pannuri, A.; Walker, A.C.; Pourciau, C.; Czyz, D.; Romeo, T.; Babitzke, P. Multitier regulation of the E. coli extreme acid stress response by CsrA. J. Bacteriol. 2024, e0035423. [Google Scholar] [CrossRef] [PubMed]
  48. Mercante, J.; Edwards, A.N.; Dubey, A.K.; Babitzke, P.; Romeo, T. Molecular geometry of CsrA (RsmA) binding to RNA and its implications for regulated expression. J. Mol. Biol. 2009, 392, 511–528. [Google Scholar] [CrossRef] [PubMed]
  49. Kammel, M.; Pinske, C.; Sawers, R.G. FocA and its central role in fine-tuning pH homeostasis of enterobacterial formate metabolism. Microbiology 2022, 168, 001253. [Google Scholar] [CrossRef] [PubMed]
  50. Rhee, H.J.; Kim, E.J.; Lee, J.K. Physiological polyamines: Simple primordial stress molecules. J. Cell. Mol. Med. 2007, 11, 685–703. [Google Scholar] [CrossRef] [PubMed]
  51. Chattopadhyay, M.K.; Tabor, H. Polyamines are critical for the induction of the glutamate decarboxylase-dependent acid resistance system in Escherichia coli. J. Biol. Chem. 2013, 288, 33559–33570. [Google Scholar] [CrossRef]
  52. Masuda, N.; Church, G.M. Regulatory network of acid resistance genes in Escherichia coli. Mol. Microbiol. 2003, 48, 699–712. [Google Scholar] [CrossRef]
  53. Gunasekera, T.S.; Csonka, L.N.; Paliy, O. Genome-wide transcriptional responses of Escherichia coli K-12 to continuous osmotic and heat stresses. J. Bacteriol. 2008, 190, 3712–3720. [Google Scholar] [CrossRef]
  54. Wu, T.; Hu, E.; Xu, S.; Chen, M.; Guo, P.; Dai, Z.; Feng, T.; Zhou, L.; Tang, W.; Zhan, L.; et al. clusterProfiler 4.0: A universal enrichment tool for interpreting omics data. Innovation 2021, 2, 100141. [Google Scholar] [CrossRef]
  55. Yu, G.; Wang, L.G.; Han, Y.; He, Q.Y. clusterProfiler: An R package for comparing biological themes among gene clusters. OMICS 2012, 16, 284–287. [Google Scholar] [CrossRef]
  56. Condemine, G.; Berrier, C.; Plumbridge, J.; Ghazi, A. Function and expression of an N-acetylneuraminic acid-inducible outer membrane channel in Escherichia coli. J. Bacteriol. 2005, 187, 1959–1965. [Google Scholar] [CrossRef]
  57. Li, K.; Xin, Y.; Xuan, G.; Zhao, R.; Liu, H.; Xia, Y.; Xun, L. Escherichia coli Uses Separate Enzymes to Produce H2S and Reactive Sulfane Sulfur From L-cysteine. Front. Microbiol. 2019, 10, 298. [Google Scholar] [CrossRef]
  58. D’Aquila, P.; De Rango, F.; Paparazzo, E.; Passarino, G.; Bellizzi, D. Epigenetic-Based Regulation of Transcriptome in Escherichia coli Adaptive Antibiotic Resistance. Microbiol. Spectr. 2023, 11, e0458322. [Google Scholar] [CrossRef]
  59. Weber, A.; Kögl, S.A.; Jung, K. Time-dependent proteome alterations under osmotic stress during aerobic and anaerobic growth in Escherichia coli. J. Bacteriol. 2006, 188, 7165–7175. [Google Scholar] [CrossRef]
  60. Schneider, B.L.; Hernandez, V.J.; Reitzer, L. Putrescine catabolism is a metabolic response to several stresses in Escherichia coli. Mol. Microbiol. 2013, 88, 537–550. [Google Scholar] [CrossRef]
  61. Adam, J.P.; Claudia, T.; James, C.P. Streptococcus pneumoniae uses glutathione to defend against oxidative stress and metal ion toxicity. J. Bacteriol. 2012, 194, 6248–6254. [Google Scholar] [CrossRef]
  62. Watling, H.R.; Collinson, D.M.; Corbett, M.K.; Shiers, D.W.; Kaksonen, A.H.; Watkin, E.L. Saline-water bioleaching of chalcopyrite with thermophilic, iron(II)- and sulfur-oxidizing microorganisms. Res. Microbiol. 2016, 167, 546–554. [Google Scholar] [CrossRef]
  63. Masuda, N.; Church, G.M. Escherichia coli gene expression responsive to levels of the response regulator EvgA. J. Bacteriol. 2002, 184, 6225–6234. [Google Scholar] [CrossRef]
  64. Nepal, S.; Kumar, P. Growth, Cell Division, and Gene Expression of Escherichia coli at Elevated Concentrations of Magnesium Sulfate: Implications for Habitability of Europa and Mars. Microorganisms 2020, 8, 637. [Google Scholar] [CrossRef]
  65. Hobman, J.L.; Yamamoto, K.; Oshima, T. Transcriptomic responses of bacterial cells to sublethal metal ion stress. In Molecular Microbiology of Heavy Metals; Nies, D.H., Silver, S., Eds.; Springer: Berlin/Heidelberg, Germany, 2007; pp. 73–115. [Google Scholar]
  66. Gelmi, M.; Apostoli, P.; Cabibbo, E.; Porru, S.; Alassio, L.; Turano, A. Resistance to cadmium salts and metal absorption by different microbial species. Curr. Microbiol. 1994, 29, 335–341. [Google Scholar] [CrossRef]
  67. Bouvier, J.; Gordia, S.; Kampmann, G.; Lange, R.; Hengge-Aronis, R.; Gutierrez, C. Interplay between global regulators of Escherichia coli: Effect of RpoS, Lrp and H-NS on transcription of the gene osmC. Mol. Microbiol. 1998, 28, 971–980. [Google Scholar] [CrossRef]
  68. Eguchi, Y.; Okada, T.; Minagawa, S.; Oshima, T.; Mori, H.; Yamamoto, K.; Ishihama, A.; Utsumi, R. Signal transduction cascade between EvgA/EvgS and PhoP/PhoQ two-component systems of Escherichia coli. J. Bacteriol. 2004, 186, 3006–3014. [Google Scholar] [CrossRef]
  69. Isarankura-Na-Ayudhya, P.; Isarankura-Na-Ayudhya, C.; Treeratanapaiboon, L.; Kasikun, K.; Thipkeaw, K.; Prachayasittikul, V. Proteomic profiling of Escherichia coli in response to heavy metals stress. Eur. J. Sci. Res. 2009, 25, 679–688. [Google Scholar]
  70. Berry, B.J.; Jenkins, D.G.; Schuerger, A.C. Effects of simulated Mars conditions on the survival and growth of Escherichia coli and Serratia liquefaciens. Appl. Environ. Microbiol. 2010, 76, 2377–2386. [Google Scholar] [CrossRef]
  71. Cabral, D.J.; Penumutchu, S.; Norris, C.; Morones-Ramirez, J.R.; Belenky, P. Microbial competition between Escherichia coli and Candida albicans reveals a soluble fungicidal factor. Microb. Cell 2018, 5, 249–255. [Google Scholar] [CrossRef]
  72. Moreira Martins, P.M.; Gong, T.; de Souza, A.A.; Wood, T.K. Copper Kills Escherichia coli Persister Cells. Antibiotics 2020, 9, 506. [Google Scholar] [CrossRef] [PubMed]
Figure 1. CsrA directly interacts with the evgA and acnA transcripts in vitro. 0.5 nM of P32-radiolabeled evgA and acnA were individually incubated with increasing concentrations of purified CsrA. All binding assays are performed in excess of yeast total RNA to inhibit the non-specific association of CsrA with labeled mRNA. (A) Electrophoretic mobility shift analysis (EMSA) of CsrA-binding to the evgA leader sequence. KD was estimated from the fitted binding curve shown right. The standard deviation and 95% confidence intervals were determined from the non-linear fit of the individual gel measurements for each CsrA concentration. (B) EMSA of CsrA-binding to acnA and its respective fitted binding curve. Lanes 5 and 6, corresponding to 88 and 75 nM CsrA, respectively, were loaded in reverse order of the concentration gradient. These lanes are denoted with a bracket “{” for clarity. Supershiftted complexes that form at higher CsrA concentrations are indicated with an (*).
Microorganisms 12 00636 g001
Figure 2. High-affinity GGA motifs mediate the CsrA-evgA interaction. (A) Secondary structure of the evgA leader sequence (5′ UTR + first 100 nt of coding sequence). The predicted binding sites from Leistra et al. (2018) [23] are shown in blue (PBS-I & PBS-II). PBS-I contains a high-affinity GGA motif. Additional GGA motifs that were considered for analysis are colored pink (GGA2, GGA3, and GGA4). The start codon (labeled “SC” in gray) and the coding sequence nucleotides are outlined in dark gray. Mutations introduced to test each individual binding site are shown in red. (B) Binding curves were generated via EMSAs for mutant versions of evgA to assess the contribution of each site to CsrA-binding, with (C) estimated KD values determined from the binding curves. In this figure, “All pred. sites mutant” refers to a mutant of both PBS-I and PBS-II) and “no GGAs mutant” refers to a mutant of all GGA motifs.
Microorganisms 12 00636 g002
Figure 3. One high-affinity GGA motif and a degenerate ANGGN site mediate the CsrA-acnA interaction. (A) Secondary structure of the acnA leader sequence (5′ UTR + first 100 nt of coding sequence). The predicted binding sites from Leistra et al. (2018) [23] are shown in blue (PBS-I, PBS-II, and PBS-III). PBS-I and PBS-II contain high-affinity GGA motifs. The start codon (labeled “SC” in gray) and the coding sequence nucleotides are outlined in dark gray. (B) Binding curves were generated via EMSAs for mutant versions of acnA to assess their contribution of CsrA-binding, with (C) estimated KD values determined from the binding curves.
Microorganisms 12 00636 g003
Figure 4. CsrA mediates evgA repression. (A) Diagram of the evgA-gfp in vivo reporter system. The first plasmid has CsrA expressed under the control of an IPTG-inducible promoter, while the second plasmid contains a constitutively expressed evgA leader sequence fused in-frame to gfp. (B) The secondary structure of the evgA leader with the predicted binding sites (blue) and additional putative GGA motifs (pink) is shown for reference. (C) Fluorescence ratios were calculated by dividing evgA-gfp fluorescence in the presence of CsrA by the fluorescence in the absence of CsrA. The results are representative of three independent biological replicates. Statistically significant values (p-value ≤ 0.05) are indicated by an asterisk (*) and were determined by comparing the negative control values to those of each mRNA variant tested using an unpaired t-test. (D) In vitro transcription–translation reactions were performed using the PURExpress kit with evgA wild-type and evgA no GGAs mutant translational fusions expressed from a T7 promoter. Increasing concentrations of purified CsrA were added prior to the start of each reaction. Values are shown for at least five replicates collected across three independent experiments. Statistically significant values are denoted with an asterisk (*) and indicate differences in fluorescence upon the addition of the respective CsrA concentration relative to the fluorescence when no CsrA was added to the reaction (0 nM). Figure created with BioRender.com.
Microorganisms 12 00636 g004
Figure 5. CsrA-mediated repression of acnA. (A) Diagram of the acnA-gfp in vivo reporter system. One plasmid contains CsrA expressed under the control of an IPTG-inducible promoter, while the second plasmid contains a constitutively expressed acnA leader sequence fused in-frame to gfp. (B) The secondary structure of the acnA leader with predicted binding sites (blue) considered for our mutational analysis is shown for reference. (C) Fluorescence ratios were calculated by dividing the acnA-gfp fluorescence in the presence of CsrA by the fluorescence in the absence of CsrA. The results are representative of three independent biological replicates. Statistically significant values (p-value ≤ 0.05) are indicated by an asterisk (*) and were determined by comparing the negative control values to those of each mRNA variant tested using an unpaired t-test. (D) In vitro transcription–translation reactions were performed using the PURExpress kit with acnA wild-type and acnA double mutant of PBS-I and PBS-III translational fusions expressed from a T7 promoter. Increasing concentrations of purified CsrA were added prior to the start of each reaction. Values are shown for at least five replicates collected across three independent experiments. Statistically significant values are denoted with an asterisk (*) and indicate differences in fluorescence upon the addition of the respective CsrA concentration relative to the fluorescence when no CsrA was added to the reaction (0 nM). Figure created with BioRender.com.
Microorganisms 12 00636 g005
Figure 6. The expression of specialized gene clusters is influenced by the CsrA-evgA interaction. (A) Number of differentially expressed genes previously associated with CsrA. (B) Volcano plot of the differentially expressed genes in the evgA no GGAs genomic mutant relative to wild-type E. coli. Genes have colored outlines based on their cluster association in the gene network shown below (green: polyamine transport, purple: formate oxidation, and red: acid resistance). (C) EnrichGO analysis results showing the top 5 most upregulated and downregulated genes in the evgA genomic mutant at Early Exponential. (D) Network representation of the differentially expressed genes upon disruption of the CsrA-evgA interaction. Node size represents the number of growth conditions in which a gene was differentially expressed. Outlined colors denote genes clustered together in our network analysis. Genes with similar functions based on their GO annotations are filled with the same color.
Microorganisms 12 00636 g006
Figure 7. CsrA indirectly coordinates acid stress responses through its interaction with evgA. Schematic of known EvgA-regulated acidic stress-related genes. Solid lines denote known interactions. Light gray dotted lines indicate genes regulated by EvgA for which direct interactions are not known. Purple dotted lines indicate genes that are known to be functionally regulated by CsrA. Created with BioRender.com.
Microorganisms 12 00636 g007
Figure 8. The CsrA-acnA interaction affects specialized gene clusters. (A) Number of differentially expressed genes previously associated with CsrA. (B) Volcano plot of the differentially expressed genes in the acnA genomic mutant (with mutated CsrA binding sites) relative to wild-type E. coli. Genes have colored outlines based on their cluster association in the gene network shown below (green: metal ion stress and DNA damage; blue: putrescine transport; purple: poxB and tktB cluster; red: iron–sulfur cluster; and yellow: toxin–antitoxin). (C) EnrichGO analysis results show the top 5 most upregulated and downregulated genes in the acnA genomic mutant at Early Exponential. (D) Network representation of the differentially expressed genes upon disruption of the CsrA-acnA interaction. Node size represents the number of growth conditions in which a gene was differentially expressed. Outlined colors denote genes clustered together in our network analysis. Genes with similar functions based on their GO annotations are filled with the same color.
Microorganisms 12 00636 g008
Figure 9. The CsrA-acnA interaction coordinates response systems for metal-induced oxidative stress. This simplified diagram illustrates the different pathways affected by CsrA through its interaction with acnA based on the observed differential expression of genes upon breaking the CsrA- acnA interaction. Solid lines denote known interactions. Light gray dotted lines indicate genes regulated by AcnA (inferred from RNA-seq) for which direct interactions are not known. Purple dotted lines indicate genes that are known to be functionally regulated by CsrA. Created with BioRender.com.
Microorganisms 12 00636 g009
Figure 10. The interaction between CsrA and evgA impacts tolerance to acidic stress in E. coli. (A) Percentage of cell survival after a 2 h challenge at different pH values. The percentage was calculated by dividing the number of CFU/mL that grew post-stress treatment by the number of CFU/mL in an unstressed control. Error bars indicate percentage variations between independent biological triplicates. Asterisks denote statistically significant (p-value ≤ 0.05) differences between the percent survival of the evgA mutant (referred to as evgA genomic no GGAs mutant in the table) and that of wild-type E. coli. Significance was determined by contrasting the percent survival of these strains using an unpaired t-test. (B) Serial dilutions of the cultures post-stress were spot-plated to observe differences in acid stress tolerance. Images were collected for independent biological duplicates for each strain. Here, evgA mutant refers to a genomic mutant of all GGA motifs present in the evgA leader.
Microorganisms 12 00636 g010
Figure 11. The CsrA-acnA interaction influences bacterial tolerance to heavy metal stress. (A) Growth curves of wild-type E. coli and acnA mutant (genomic mutant of CsrA binding sites in the acnA sequence) strains in LB media only (left) and LB media supplemented with increasing concentrations of CuSO4 (middle) and CuCl2 (right). Shading denotes the standard deviation between biological duplicates. Cells were challenged with increasing concentrations of (B) CuSO4 and (C) CuCl2 for 8 h. Serial dilutions of the cultures post-stress were spot-plated to observe differences in metal stress tolerance. Images represent the observed cell growth for independent biological duplicates of each strain.
Microorganisms 12 00636 g011
Disclaimer/Publisher’s Note: The statements, opinions and data contained in all publications are solely those of the individual author(s) and contributor(s) and not of MDPI and/or the editor(s). MDPI and/or the editor(s) disclaim responsibility for any injury to people or property resulting from any ideas, methods, instructions or products referred to in the content.

