
Intestinal Effects of Filtered Alkalinized Water in Lean and Obese Zucker Rats

 , , ,
, , , 
Abstract
1. Introduction
2. Materials and Methods
| Enterobacteriaceae | |
| Eco1457 Forward | 5′-CATTGACGTTACCCGCAGAAGAAGC-3′ |
| Eco1652 Reverse | 5′-CTCTACGAGACTCAAGCTTGC-3′ |
| Blautia coccoides-Eubacterium rectale Group | |
| gCcoc Forward | 5′-AAATGACGGTACCTGACTAA-3′ |
| gCcoc Reverse | 5′-CTTTGAGTTTCATTCTTGCGAA-3′ |
| Clostridium cluster IV | |
| sg-Clept Forward | 5′-GCACAAGCAGTGGAGT-3′ |
| sg-Clept Reverse | 5′-CTTCCTCCGTTTTGTCAA-3′ |
| Enterococcus spp. | |
| Enteroc Forward | 5′-CCCTTATTGTTAGTTGCCATCATT-3′ |
| Enteroc Reverse | 5′-ACTCGTTGTACTTCCCATTGT-3′ |
| Lactobacillus spp. | |
| Lacto Forward | 5′-CACCGCTACACATGGAG-3′ |
| Lacto Reverse | 5′-AGCAGTAGGGAATCTTCCA-3′ |
| Bifidobacterium spp. | |
| Bif Forward | 5′-TCGCGTC(C/T)GGTGTGAAAG-3′ |
| Bif Reverse | 5′-CCACATCCAGC(A/G)TCCAC-3′ |
| Bacteroides fragilis Group | |
| Bfra Forward | 5′-ATAGCCTTTCGAAAGRAAGAT-3′ |
| Bfra Reverse | 5′-CCAGTATCAACTGCAATTTTA-3′ |
| Faecalibacterium praustnizii | |
| Fprau223 Forward | 5′-GATGGCCTCGCGTCCGATTAG-3′ |
| Fprau420 Reverse | 5′-CCGAAGACCTTCTTCCTCC-3′ |
| Akkermansia muciniphila | |
| S-St-Muc-1437-a-A-20 Forward | 5′- CCTTGCGGTTGGCTTCAGAT-3′ |
| S-St-Muc-1129-a-a-20 Reverse | 5′-CAGCACGTGAAGGTGGGGAC-3′ |
| 36B4 Forward | 5′-GCGACCTGGAGTCCAACTA-3′ |
| 36B4 Reverse | 5′: ATCTGCTGCATCTGCTTGG-3′ |
| IL-1B Forward | 5′-GCCAACAAGTGGTATTCTCCATGAGC-3′ |
| IL-1B Reverse | 5′-TTGTCACCCCGGATGGAATG-3′ |
| IL-10 Reverse | 5′-TTGTCACCCCGGATGGAATG-3′ |
| IL-10 Forward | 5′-GCTCAGCACTGCTATGTTGC-3′ |
3. Results
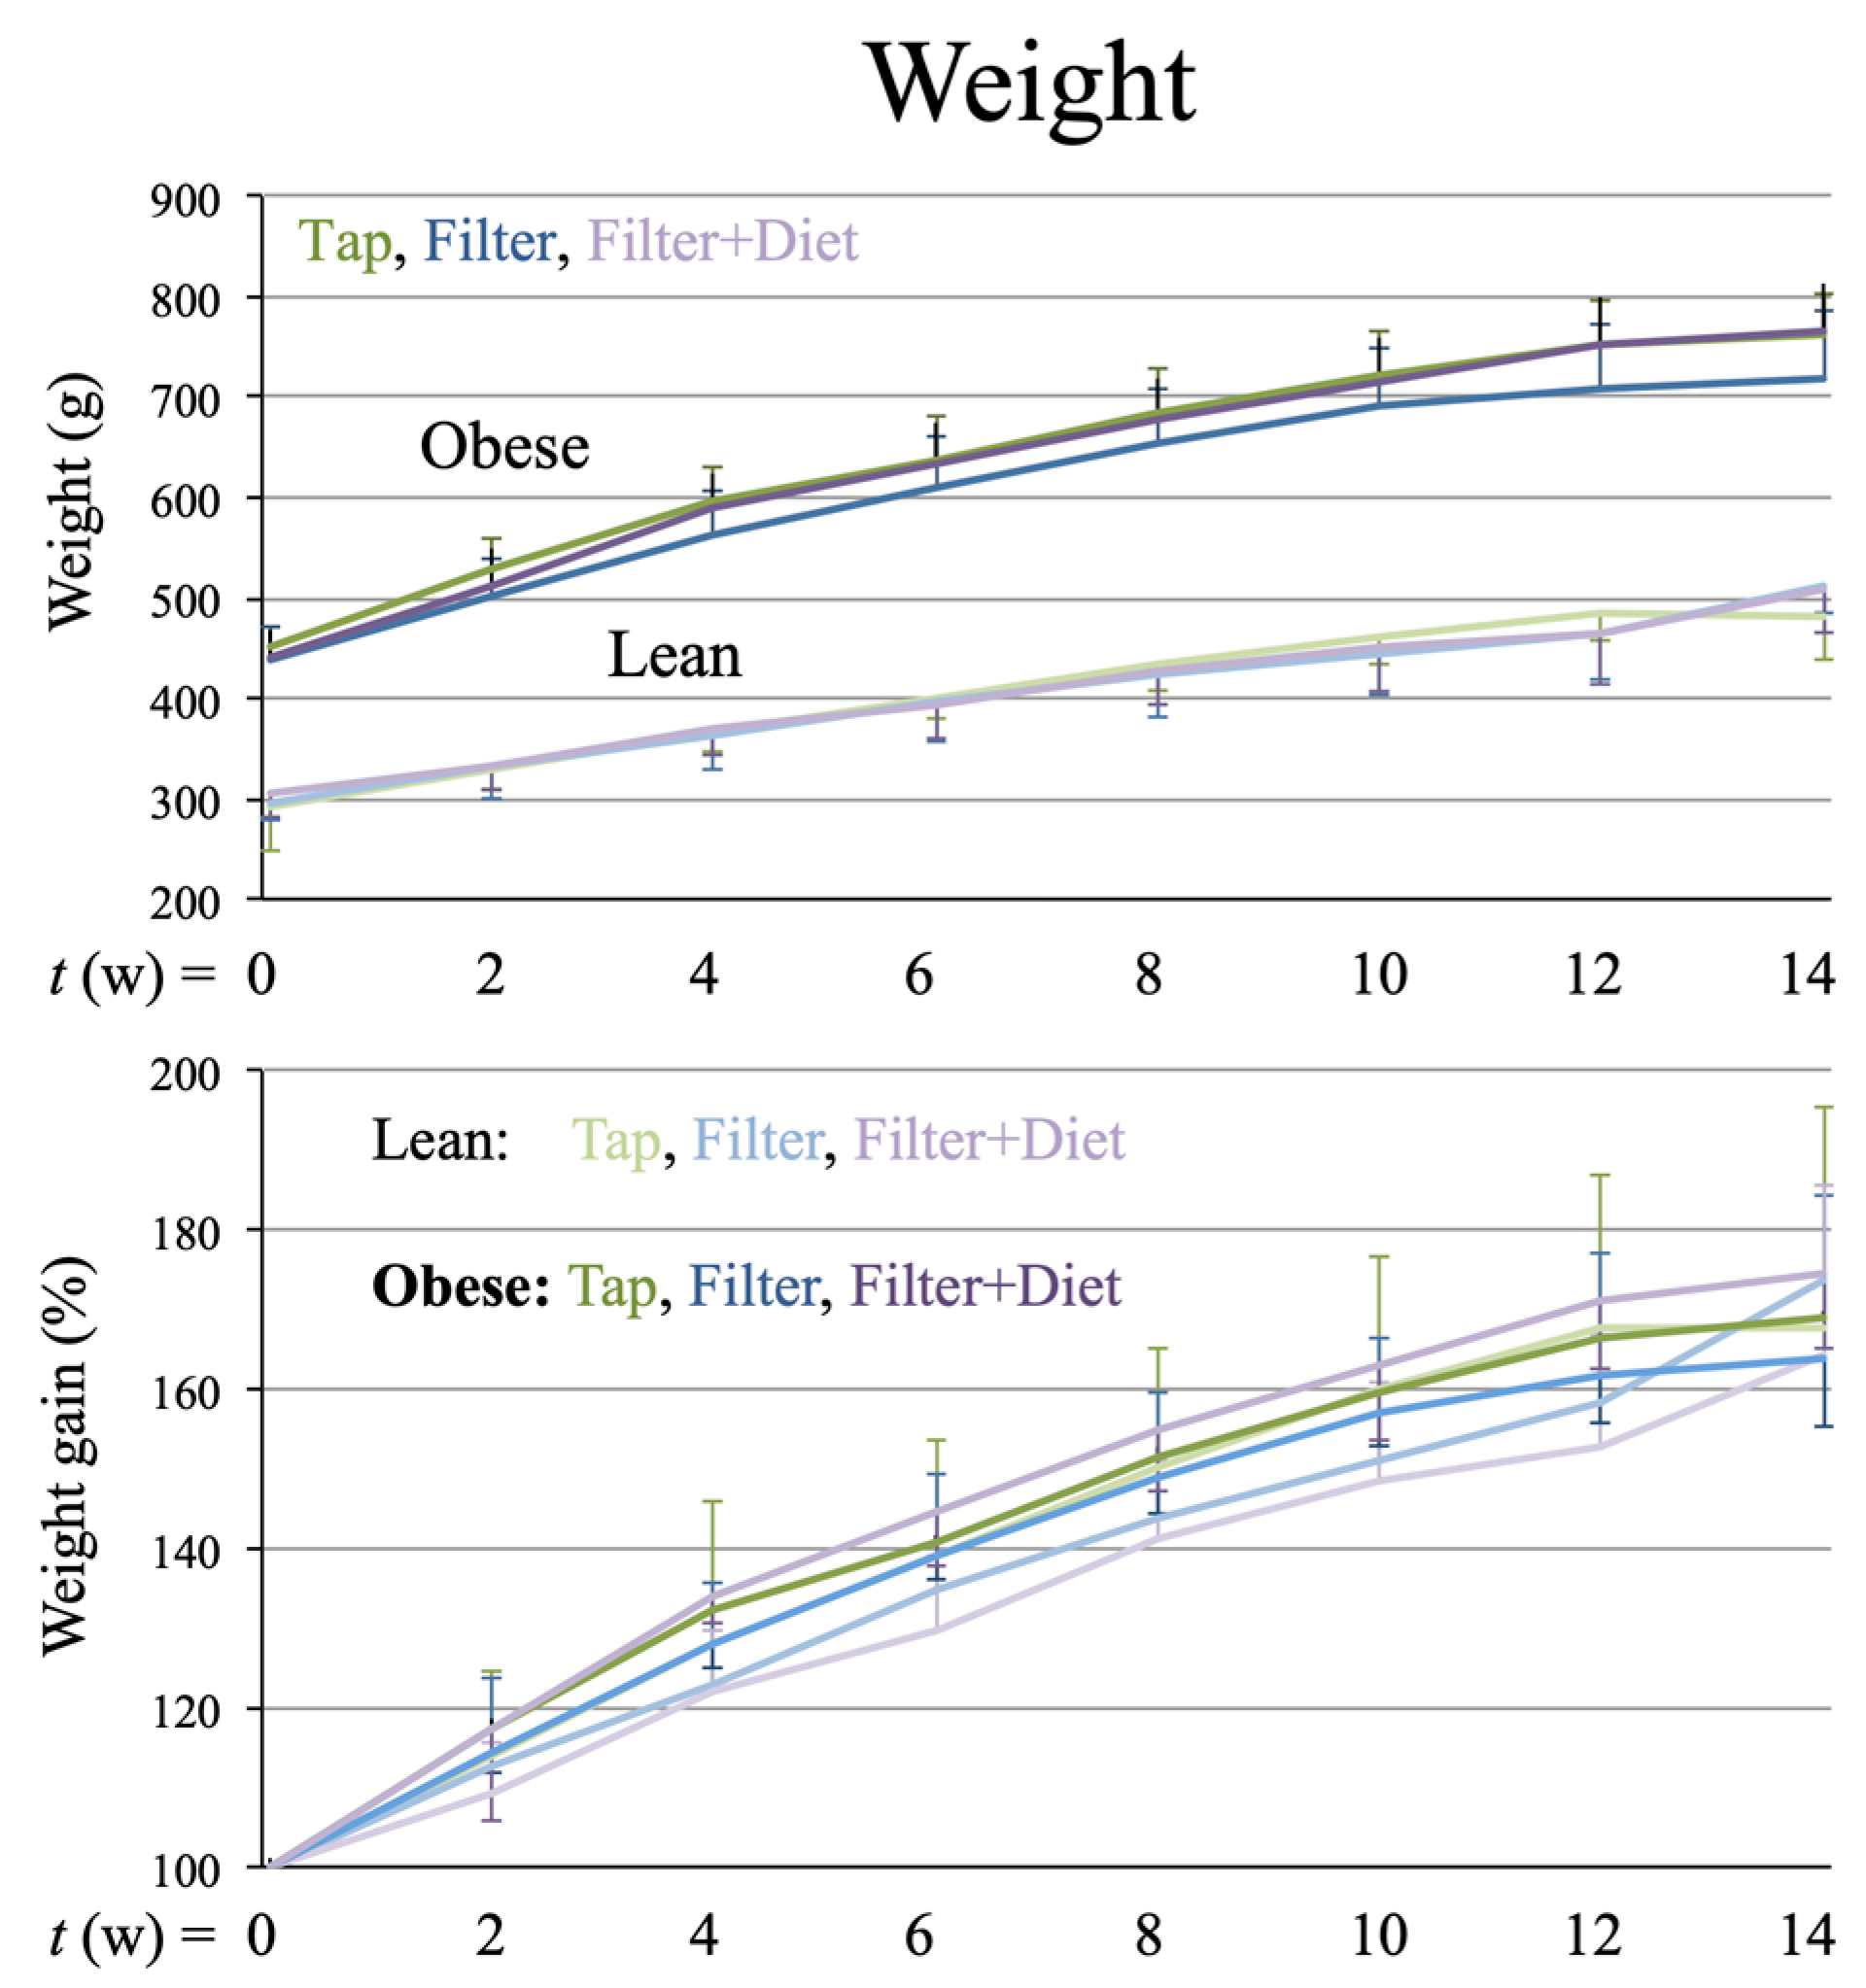
3.1. Weight Gain
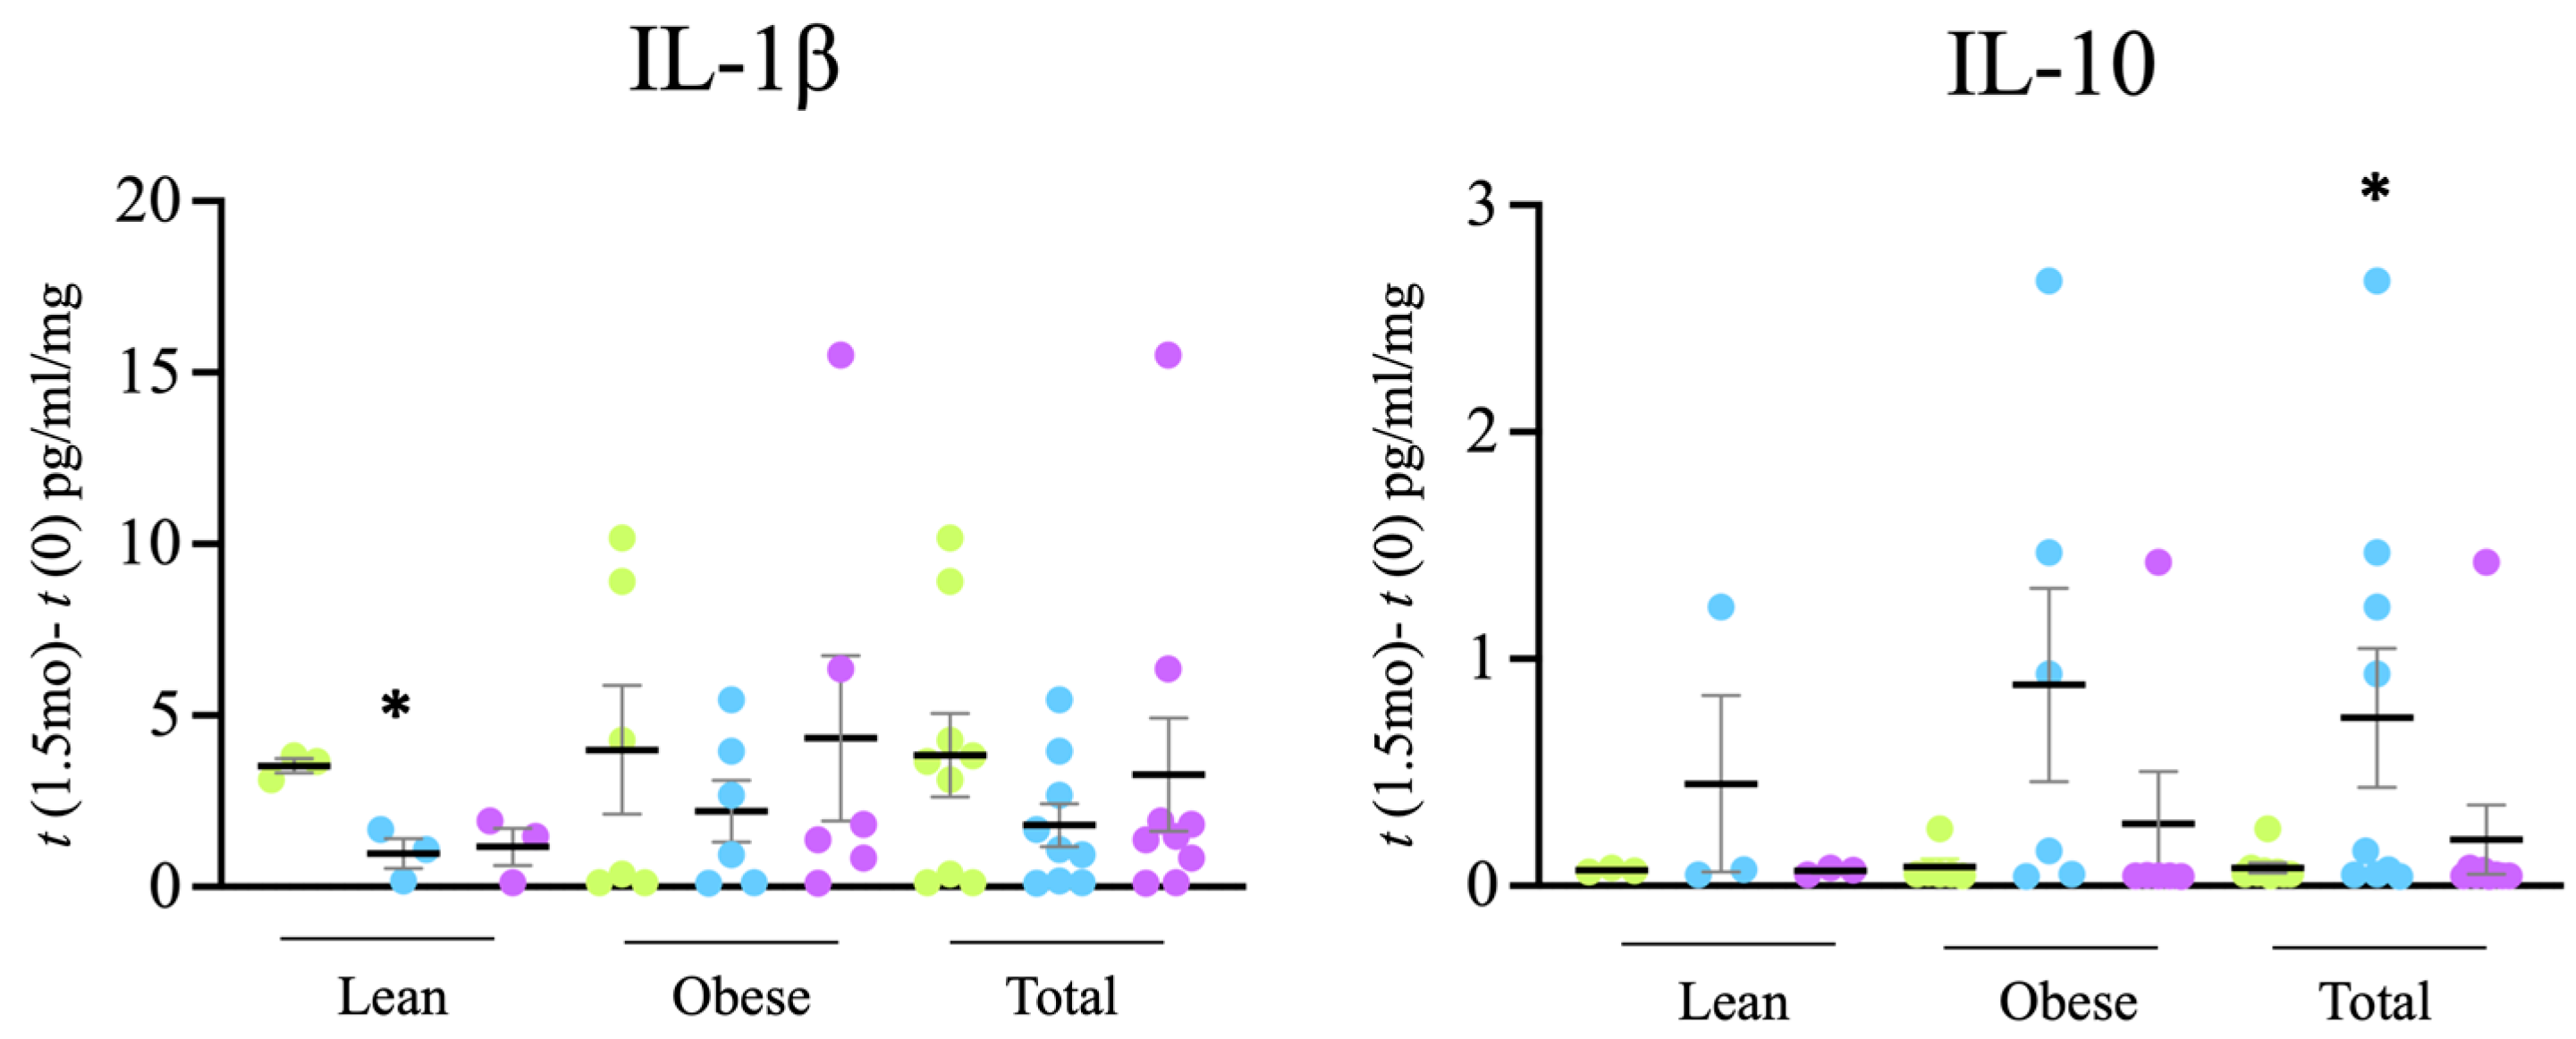
3.2. Circulating Cytokines
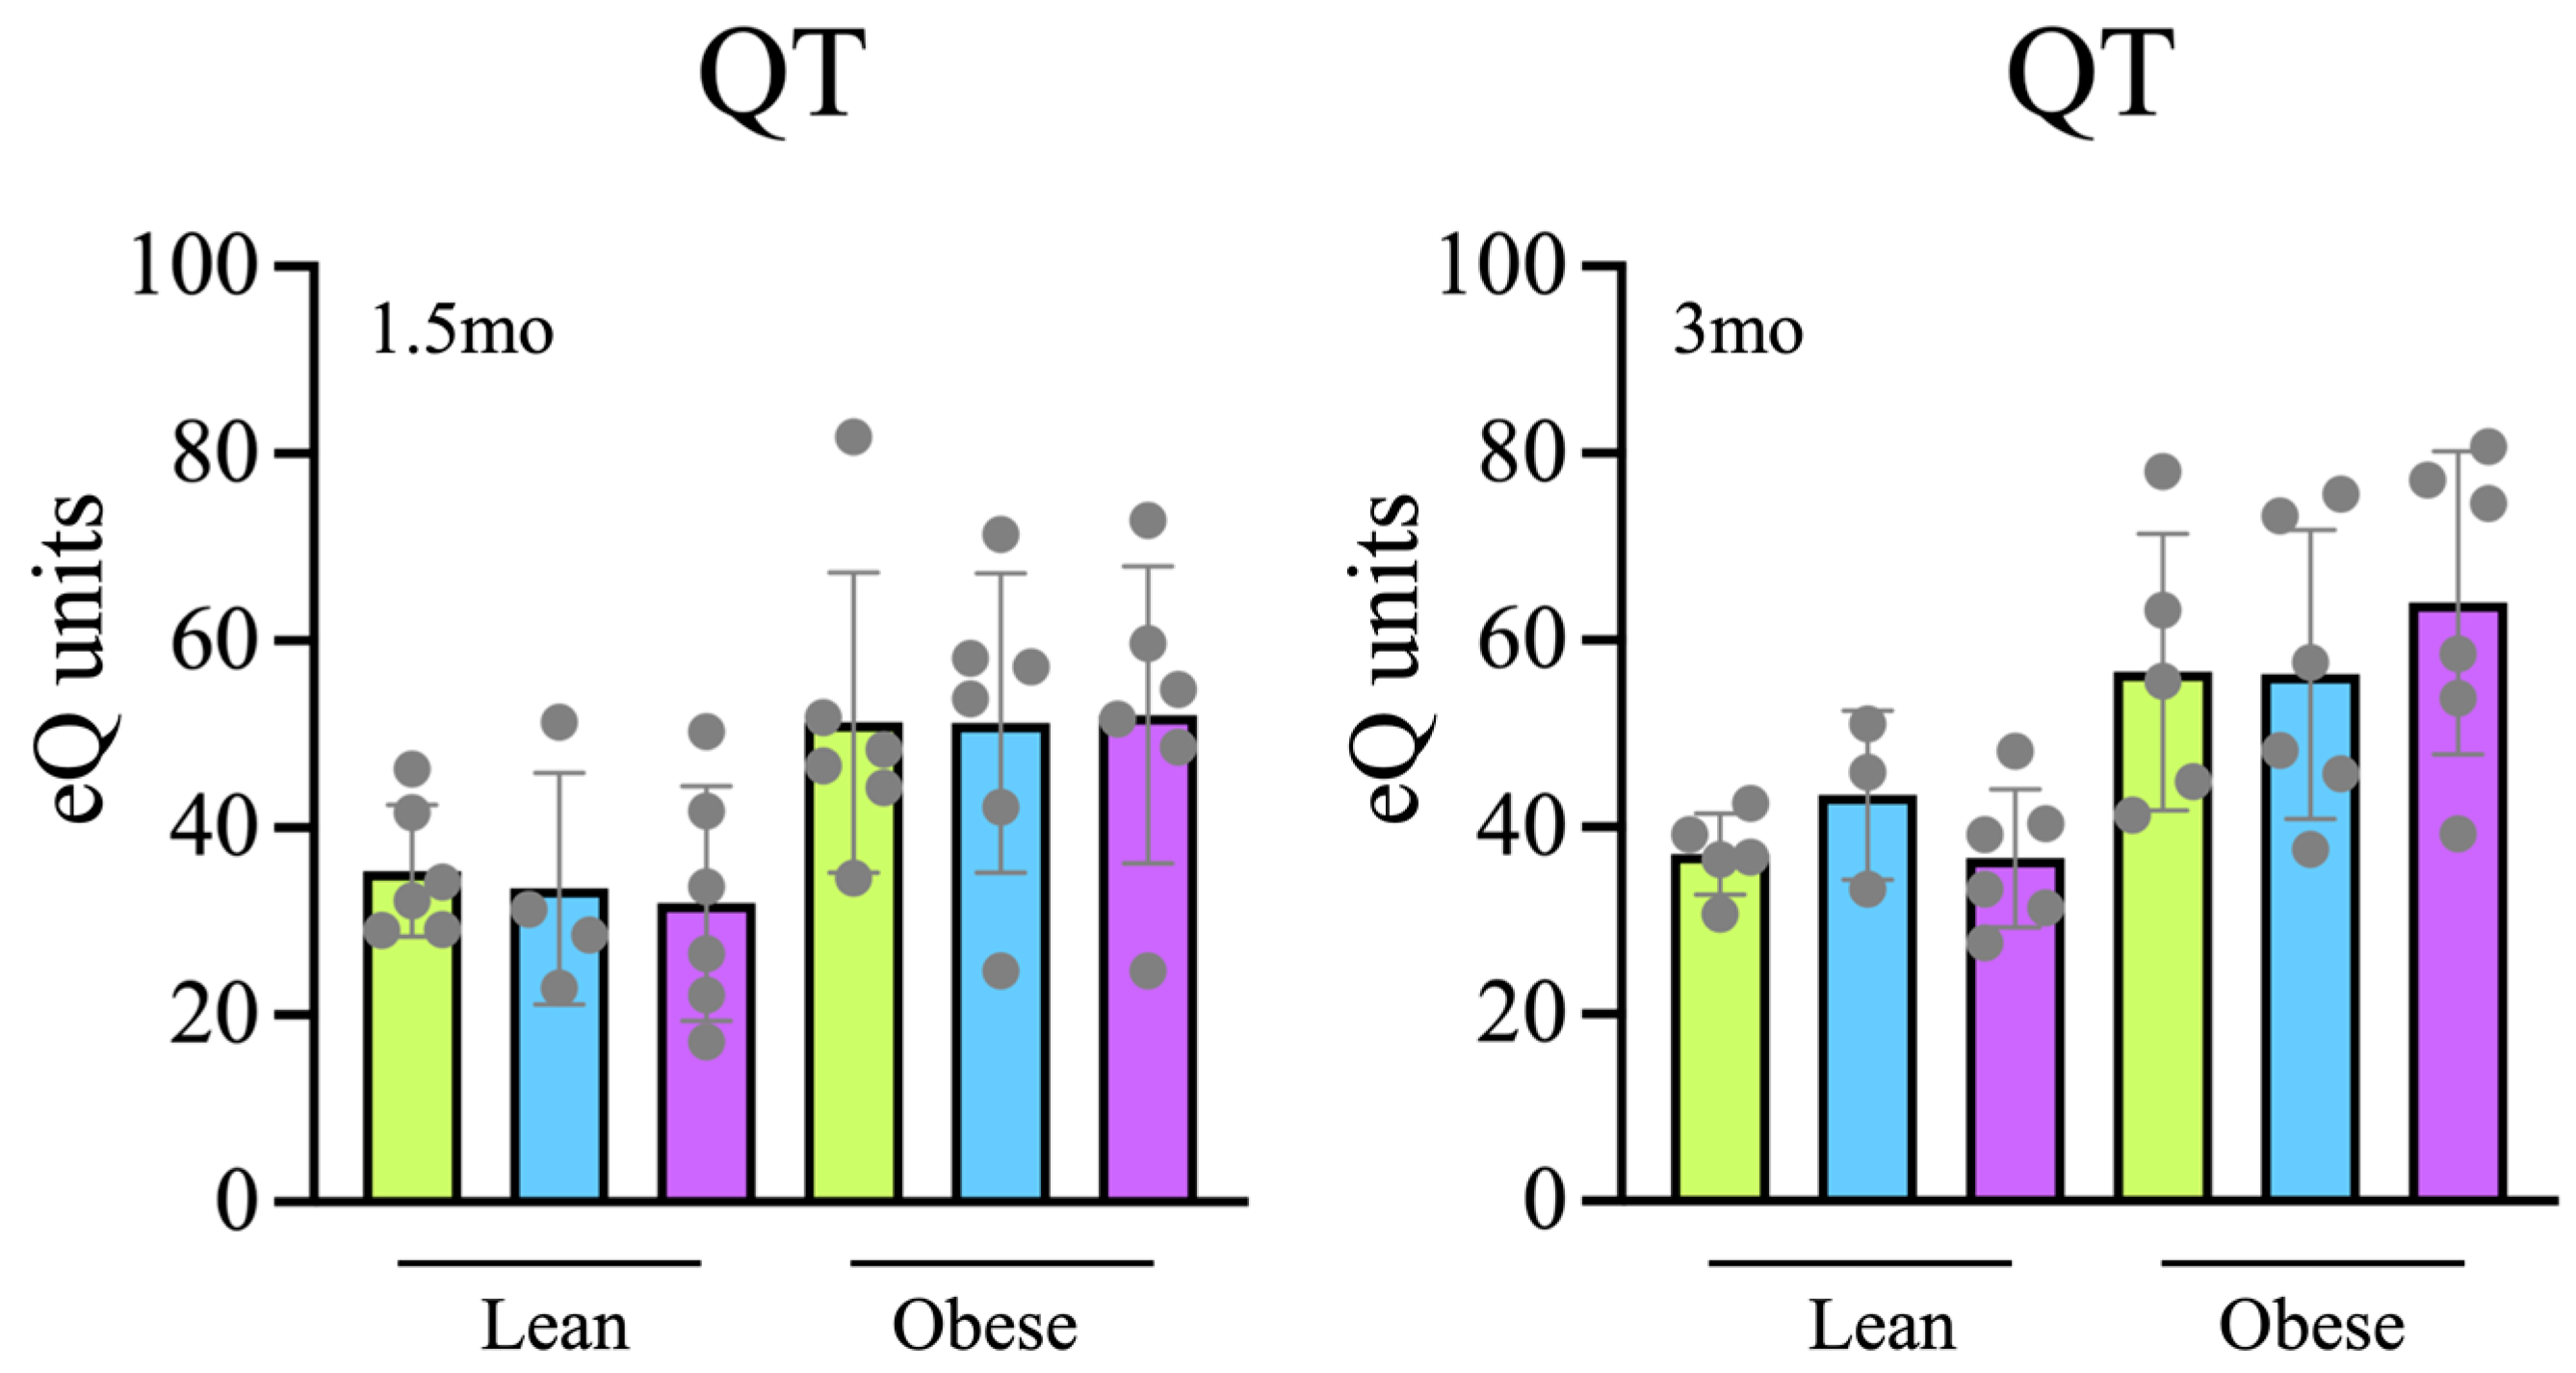
3.3. Antioxidant Capacity
3.4. Indirect Calorimetry
3.5. Intestinal Mucosa
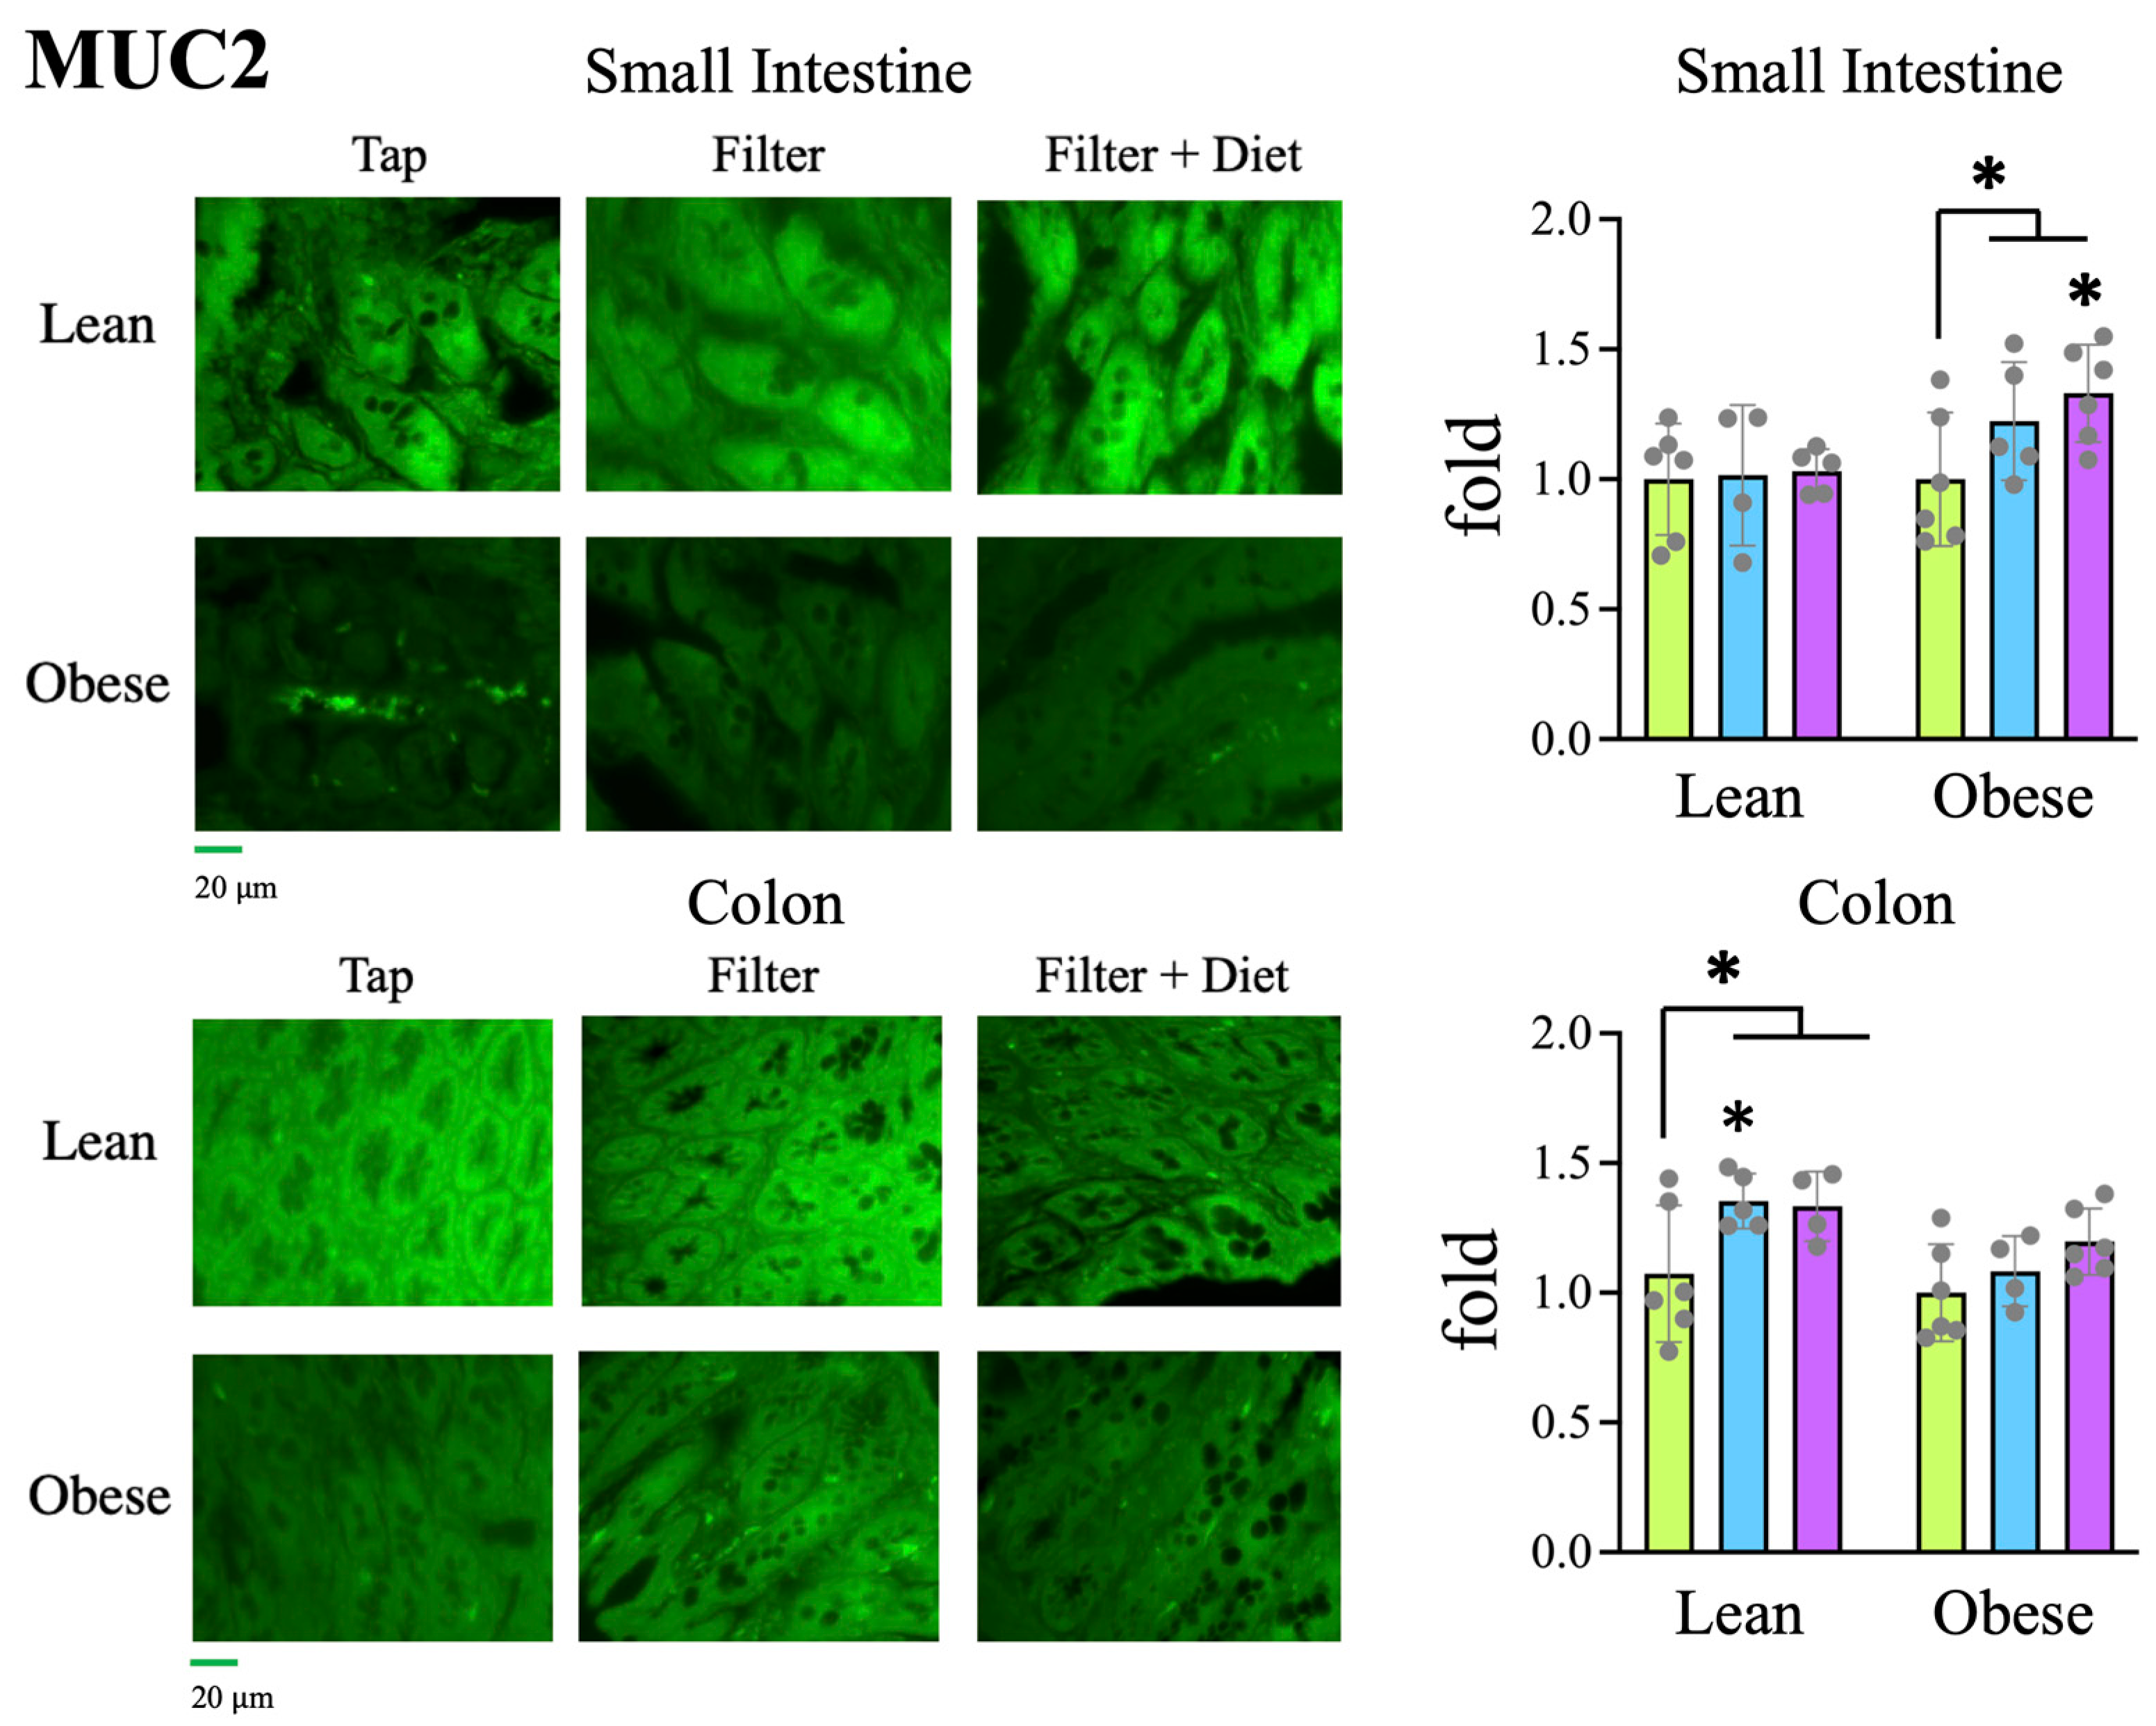
3.5.1. Mucin
3.5.2. Intestinal Inflammation
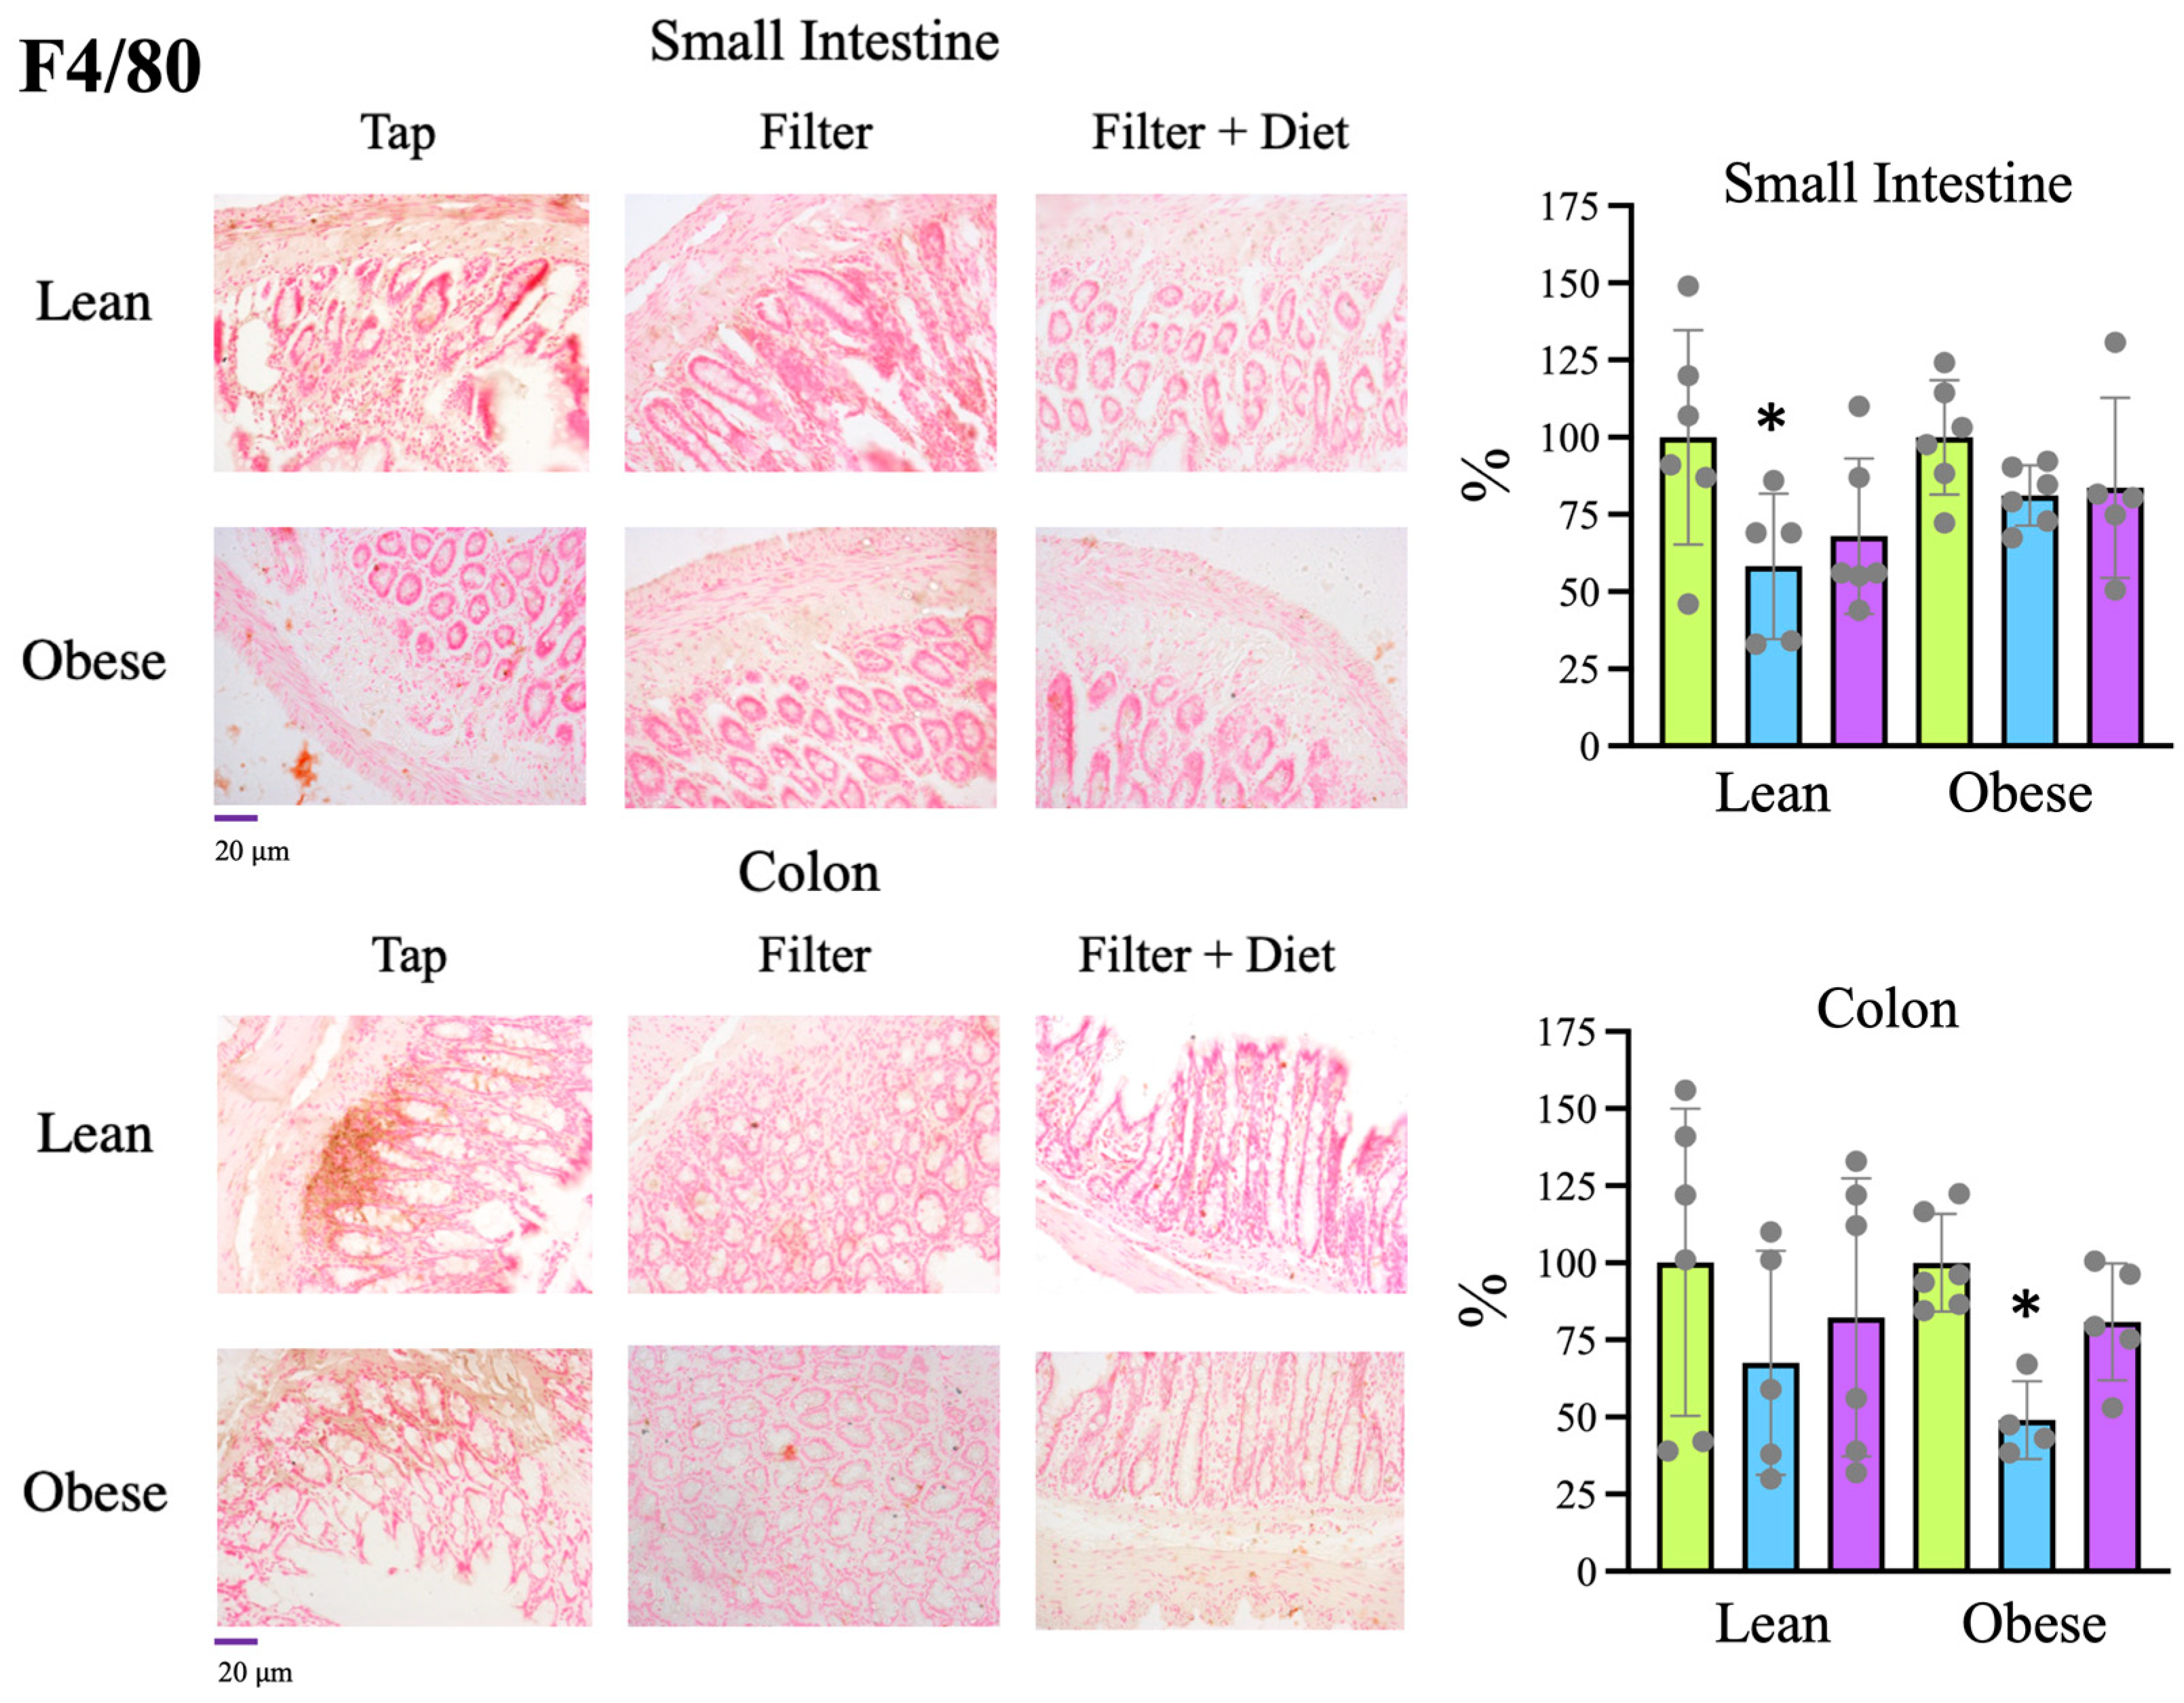
- F4/80
- Cytokine’s gene expression
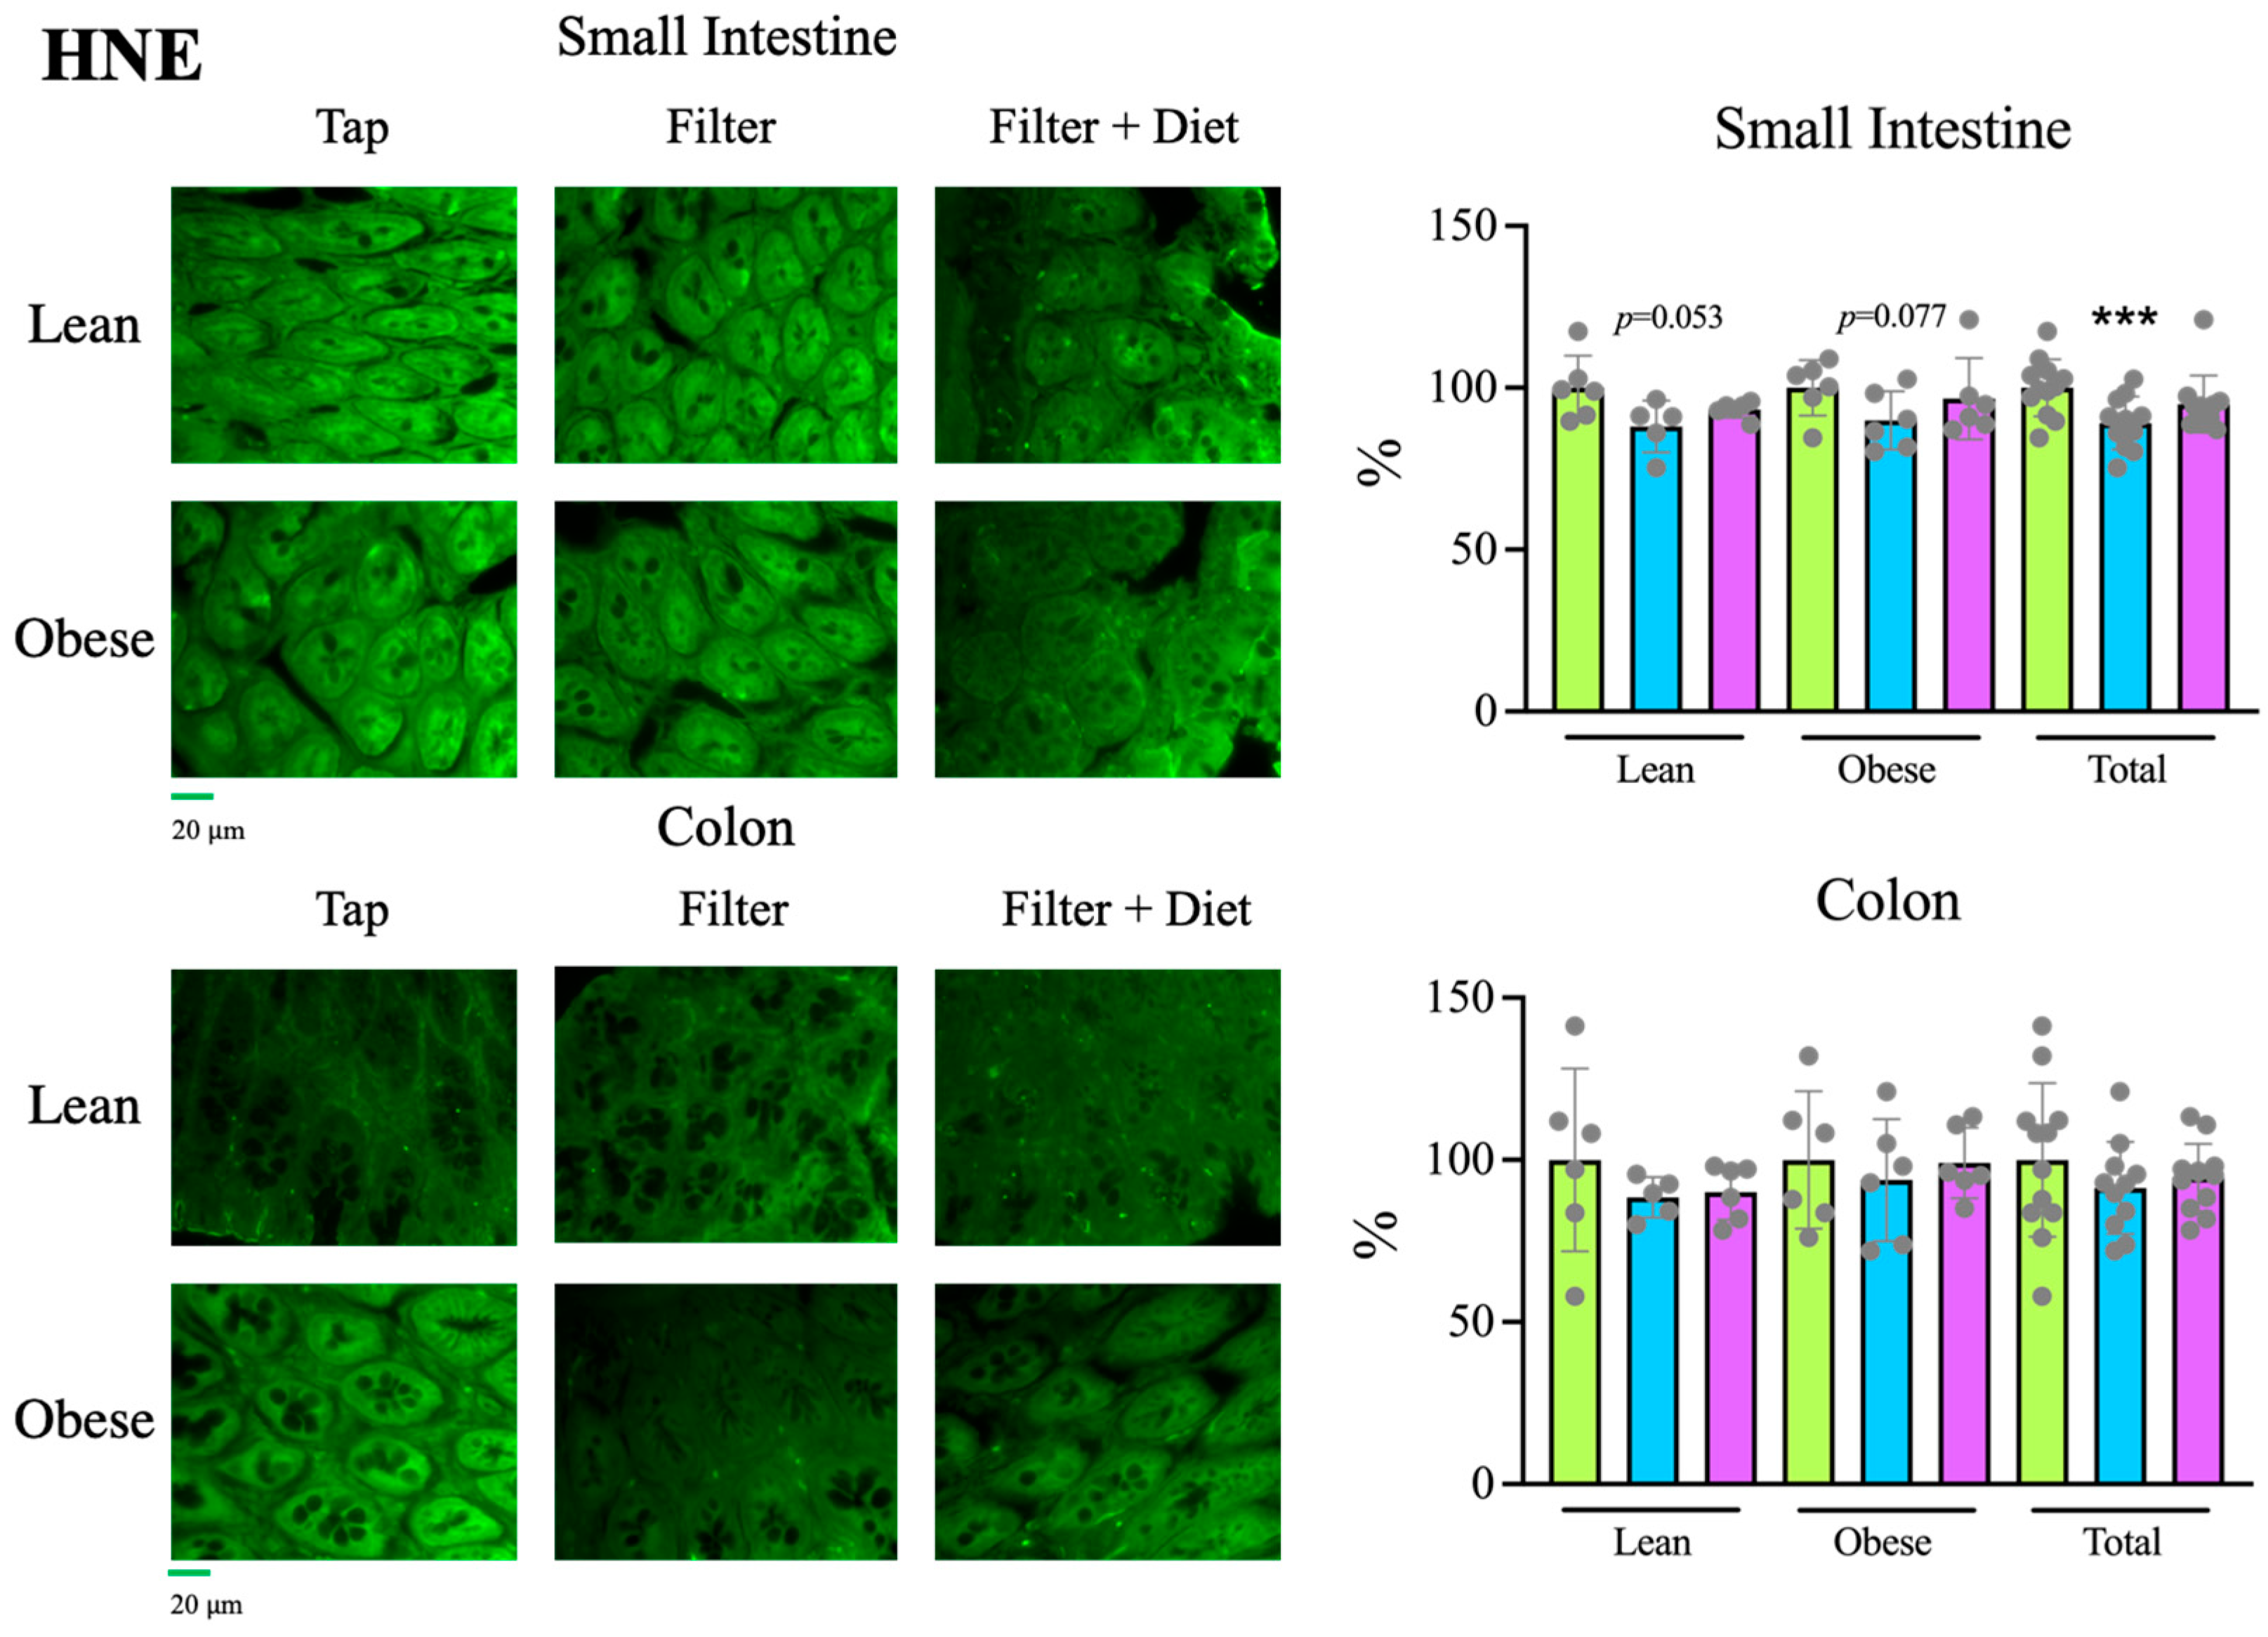
- Oxidative stress (OS)
3.6. Intestinal Microbiome
4. Discussion
Supplementary Materials
Author Contributions
Funding
Data Availability Statement
Acknowledgments
Conflicts of Interest
References
- Wang, R.; Li, Z.; Liu, S.; Zhang, D. Global, Regional, and National Burden of 10 Digestive Diseases in 204 Countries and Territories from 1990 to 2019. Front. Public Health 2023, 11, 1061453. [Google Scholar] [CrossRef]
- Aziz, I.; Palsson, O.S.; Törnblom, H.; Sperber, A.D.; Whitehead, W.E.; Simrén, M. Epidemiology, Clinical Characteristics, and Associations for Symptom-Based Rome IV Functional Dyspepsia in Adults in the USA, Canada, and the UK: A Cross-Sectional Population-Based Study. Lancet Gastroenterol. Hepatol. 2018, 3, 252–262. [Google Scholar] [CrossRef]
- Yamawaki, H.; Futagami, S.; Wakabayashi, M.; Sakasegawa, N.; Agawa, S.; Higuchi, K.; Kodaka, Y.; Iwakiri, K. Management of Functional Dyspepsia: State of the Art and Emerging Therapies. Ther. Adv. Chronic Dis. 2018, 9, 23–32. [Google Scholar] [CrossRef]
- Yibirin, M.; Oliveira, D.D.; Valera, R.; Plitt, A.E.; Lutgen, S.; Yibirin, M.; Oliveira, D.D.; Valera, R.; Plitt, A.E.; Lutgen, S. Adverse Effects Associated with Proton Pump Inhibitor Use. Cureus 2021, 13, e12759. [Google Scholar] [CrossRef]
- Bajgai, J.; Lee, M.; Jang, Y.-G.; Lee, K.; Sharma, S.; Jeong, Y.J.; Park, H.J.; Goh, S.H.; Kim, C.-S.; Kim, H.I.; et al. Effects of Drinking Electrolyzed Alkaline-Reduced Water on Functional Dyspepsia: A Randomized, Double-Blind, Controlled Prospective Trial. Processes 2023, 11, 968. [Google Scholar] [CrossRef]
- Delos Reyes, F.S.L.G.; Mamaril, A.C.C.; Matias, T.J.P.; Tronco, M.K.V.; Samson, G.R.; Javier, N.D.; Fadriquela, A.; Antonio, J.M.; Sajo, M.E.J.V. The Search for the Elixir of Life: On the Therapeutic Potential of Alkaline Reduced Water in Metabolic Syndromes. Processes 2021, 9, 1876. [Google Scholar] [CrossRef]
- Segata, N. Gut Microbiome: Westernization and the Disappearance of Intestinal Diversity. Curr. Biol. 2015, 25, R611–R613. [Google Scholar] [CrossRef] [PubMed]
- Magne, F.; Gotteland, M.; Gauthier, L.; Zazueta, A.; Pesoa, S.; Navarrete, P.; Balamurugan, R. The Firmicutes/Bacteroidetes Ratio: A Relevant Marker of Gut Dysbiosis in Obese Patients? Nutrients 2020, 12, 1474. [Google Scholar] [CrossRef]
- Liu, B.-N.; Liu, X.-T.; Liang, Z.-H.; Wang, J.-H. Gut Microbiota in Obesity. World J. Gastroenterol. 2021, 27, 3837–3850. [Google Scholar] [CrossRef] [PubMed]
- Martino, D. The Effects of Chlorinated Drinking Water on the Assembly of the Intestinal Microbiome. Challenges 2019, 10, 10. [Google Scholar] [CrossRef]
- Hansen, T.H.; Thomassen, M.T.; Madsen, M.L.; Kern, T.; Bak, E.G.; Kashani, A.; Allin, K.H.; Hansen, T.; Pedersen, O. The Effect of Drinking Water pH on the Human Gut Microbiota and Glucose Regulation: Results of a Randomized Controlled Cross-over Intervention. Sci. Rep. 2018, 8, 16626. [Google Scholar] [CrossRef]
- Higashimura, Y.; Baba, Y.; Inoue, R.; Takagi, T.; Uchiyama, K.; Mizushima, K.; Hirai, Y.; Ushiroda, C.; Tanaka, Y.; Naito, Y. Effects of Molecular Hydrogen-Dissolved Alkaline Electrolyzed Water on Intestinal Environment in Mice. Med. Gas Res. 2018, 8, 6–11. [Google Scholar] [CrossRef]
- García-Gómez, R.; Prieto, I.; Amor, S.; Patel, G.; Fuente, M.; Granado, M.; Monsalve, M. Evaluation of the Potential Benefits of Alkaline Drinking Water on Tumor Development Reveals Vascular Protective Effects. Arch. Med. Sci. Civiliz. Dis. 2021, 6, 84–102. [Google Scholar] [CrossRef]
- Melnyk, S.; Hakkak, R. Metabolic Status of Lean and Obese Zucker Rats Based on Untargeted and Targeted Metabolomics Analysis of Serum. Biomedicines 2022, 10, 153. [Google Scholar] [CrossRef] [PubMed]
- Technical Committee AEN/CTN 149 Water Engineering. Water conditioning equipment inside buildings. Validation of equipment used in the treatment of drinking water in the interior of buildings. AENOR 2015, UNE 149101:2015. Available online: https://tienda.aenor.com/norma-une-149101-2015-n0054317 (accessed on 22 December 2023).
- Certificados Alkanatur. Productos Avalados por Profesionales. Available online: https://alkanatur.com/es/certificados/ (accessed on 22 December 2023).
- FAQS—Megaflora 9 Evo. Available online: https://solchem.es/ingredientes/dp/DP-Megaflora9evo-FAQS.pdf (accessed on 22 December 2023).
- Breugelmans, T.; Oosterlinck, B.; Arras, W.; Ceuleers, H.; Man, J.D.; Hold, G.L.; Winter, B.Y.D.; Smet, A. The Role of Mucins in Gastrointestinal Barrier Function during Health and Disease. Lancet Gastroenterol. Hepatol. 2022, 7, 455–471. [Google Scholar] [CrossRef]
- Portincasa, P.; Khalil, M.; Graziani, A.; Frühbeck, G.; Baffy, G.; Garruti, G.; Di Ciaula, A.; Bonfrate, L. Gut Microbes in Metabolic Disturbances. Promising Role for Therapeutic Manipulations? Eur. J. Intern. Med. 2023, 119, 13–30. [Google Scholar] [CrossRef] [PubMed]
- Abenavoli, L.; Scarpellini, E.; Colica, C.; Boccuto, L.; Salehi, B.; Sharifi-Rad, J.; Aiello, V.; Romano, B.; De Lorenzo, A.; Izzo, A.A.; et al. Gut Microbiota and Obesity: A Role for Probiotics. Nutrients 2019, 11, 2690. [Google Scholar] [CrossRef] [PubMed]
- Allin, K.H.; Tremaroli, V.; Caesar, R.; Jensen, B.A.H.; Damgaard, M.T.F.; Bahl, M.I.; Licht, T.R.; Hansen, T.H.; Nielsen, T.; Dantoft, T.M.; et al. Aberrant Intestinal Microbiota in Individuals with Prediabetes. Diabetologia 2018, 61, 810–820. [Google Scholar] [CrossRef] [PubMed]
- Armet, A.M.; Deehan, E.C.; O’Sullivan, A.F.; Mota, J.F.; Field, C.J.; Prado, C.M.; Lucey, A.J.; Walter, J. Rethinking Healthy Eating in Light of the Gut Microbiome. Cell Host Microbe 2022, 30, 764–785. [Google Scholar] [CrossRef]
- Ríos-Covián, D.; Ruas-Madiedo, P.; Margolles, A.; Gueimonde, M.; de los Reyes-Gavilán, C.G.; Salazar, N. Intestinal Short Chain Fatty Acids and Their Link with Diet and Human Health. Front. Microbiol. 2016, 7, 185. [Google Scholar] [CrossRef] [PubMed]
- Zsálig, D.; Berta, A.; Tóth, V.; Szabó, Z.; Simon, K.; Figler, M.; Pusztafalvi, H.; Polyák, É. A Review of the Relationship between Gut Microbiome and Obesity. Appl. Sci. 2023, 13, 610. [Google Scholar] [CrossRef]
- Thingholm, L.B.; Rühlemann, M.C.; Koch, M.; Fuqua, B.; Laucke, G.; Boehm, R.; Bang, C.; Franzosa, E.A.; Hübenthal, M.; Rahnavard, A.; et al. Obese Individuals with and without Type 2 Diabetes Show Different Gut Microbial Functional Capacity and Composition. Cell Host Microbe 2019, 26, 252–264. [Google Scholar] [CrossRef] [PubMed]
- Trakman, G.L.; Fehily, S.; Basnayake, C.; Hamilton, A.L.; Russell, E.; Wilson-O’Brien, A.; Kamm, M.A. Diet and Gut Microbiome in Gastrointestinal Disease. J. Gastroenterol. Hepatol. 2022, 37, 237–245. [Google Scholar] [CrossRef] [PubMed]
- Gomes, A.C.; Hoffmann, C.; Mota, J.F. The Human Gut Microbiota: Metabolism and Perspective in Obesity. Gut Microbes 2018, 9, 308–325. [Google Scholar] [CrossRef] [PubMed]
- Islam, M.R.; Arthur, S.; Haynes, J.; Butts, M.R.; Nepal, N.; Sundaram, U. The Role of Gut Microbiota and Metabolites in Obesity-Associated Chronic Gastrointestinal Disorders. Nutrients 2022, 14, 624. [Google Scholar] [CrossRef]
- Laursen, M.F.; Larsson, M.W.; Lind, M.V.; Larnkjær, A.; Mølgaard, C.; Michaelsen, K.F.; Bahl, M.I.; Licht, T.R. Intestinal Enterococcus Abundance Correlates Inversely with Excessive Weight Gain and Increased Plasma Leptin in Breastfed Infants. FEMS Microbiol. Ecol. 2020, 96, fiaa066. [Google Scholar] [CrossRef]
- Jin, J.; Cheng, R.; Ren, Y.; Shen, X.; Wang, J.; Xue, Y.; Zhang, H.; Jia, X.; Li, T.; He, F.; et al. Distinctive Gut Microbiota in Patients with Overweight and Obesity with Dyslipidemia and Its Responses to Long-Term Orlistat and Ezetimibe Intervention: A Randomized Controlled Open-Label Trial. Front. Pharmacol. 2021, 12, 732541. [Google Scholar] [CrossRef]
- Ignacio, A.; Fernandes, M.R.; Rodrigues, V.A.A.; Groppo, F.C.; Cardoso, A.L.; Avila-Campos, M.J.; Nakano, V. Correlation between Body Mass Index and Faecal Microbiota from Children. Clin. Microbiol. Infect. 2016, 22, 258.e1–258.e8. [Google Scholar] [CrossRef]
- Xu, Z.; Jiang, W.; Huang, W.; Lin, Y.; Chan, F.K.L.; Ng, S.C. Gut Microbiota in Patients with Obesity and Metabolic Disorders—A Systematic Review. Genes Nutr. 2022, 17, 2. [Google Scholar] [CrossRef]
- Luo, Y.; Lan, C.; Li, H.; Ouyang, Q.; Kong, F.; Wu, A.; Ren, Z.; Tian, G.; Cai, J.; Yu, B.; et al. Rational Consideration of Akkermansia Muciniphila Targeting Intestinal Health: Advantages and Challenges. npj Biofilms Microbiomes 2022, 8, 81. [Google Scholar] [CrossRef] [PubMed]
- Guo, P.; Zhang, K.; Ma, X.; He, P. Clostridium Species as Probiotics: Potentials and Challenges. J. Anim. Sci. Biotechnol. 2020, 11, 24. [Google Scholar] [CrossRef] [PubMed]
- Baldelli, V.; Scaldaferri, F.; Putignani, L.; Del Chierico, F. The Role of Enterobacteriaceae in Gut Microbiota Dysbiosis in Inflammatory Bowel Diseases. Microorganisms 2021, 9, 697. [Google Scholar] [CrossRef] [PubMed]

 Tap,
Tap,  filter,
  filter + probiotic. The graph shows mean +/− SEM. * p < 0.05 (t test).
Tap, filter, filter + probiotic. The graph shows mean +/− SEM. * p < 0.05 (t test).
filter + probiotic. The graph shows mean +/− SEM. * p < 0.05 (t test).
Tap, filter, filter + probiotic. The graph shows mean +/− SEM. * p < 0.05 (t test). Tap, filter, filter + probiotic. The graph shows the electrochemical units provided by the e-BQC reader and includes mean values +/− SD.
Tap, filter, filter + probiotic. The graph shows the electrochemical units provided by the e-BQC reader and includes mean values +/− SD.
Tap, filter, filter + probiotic. The graph shows the electrochemical units provided by the e-BQC reader and includes mean values +/− SD. Tap, Filter, Filter + Probiotic. The values shown in the graphs are the difference of O2 volume (V) consumed (upper panel) or CO2 produced (lower panel) between the indicated time and t = 0 for each individual rat analyzed. Determinations were taken every hour for 72 h, the presented data corresponds to the mean of both 12 h day and 12 h night periods of the 2nd day, when collected values were more stable. The graph shows mean values +/− SD. * p < 0.05 (t test).
Tap, Filter, Filter + Probiotic. The values shown in the graphs are the difference of O2 volume (V) consumed (upper panel) or CO2 produced (lower panel) between the indicated time and t = 0 for each individual rat analyzed. Determinations were taken every hour for 72 h, the presented data corresponds to the mean of both 12 h day and 12 h night periods of the 2nd day, when collected values were more stable. The graph shows mean values +/− SD. * p < 0.05 (t test).
Tap, Filter, Filter + Probiotic. The values shown in the graphs are the difference of O2 volume (V) consumed (upper panel) or CO2 produced (lower panel) between the indicated time and t = 0 for each individual rat analyzed. Determinations were taken every hour for 72 h, the presented data corresponds to the mean of both 12 h day and 12 h night periods of the 2nd day, when collected values were more stable. The graph shows mean values +/− SD. * p < 0.05 (t test).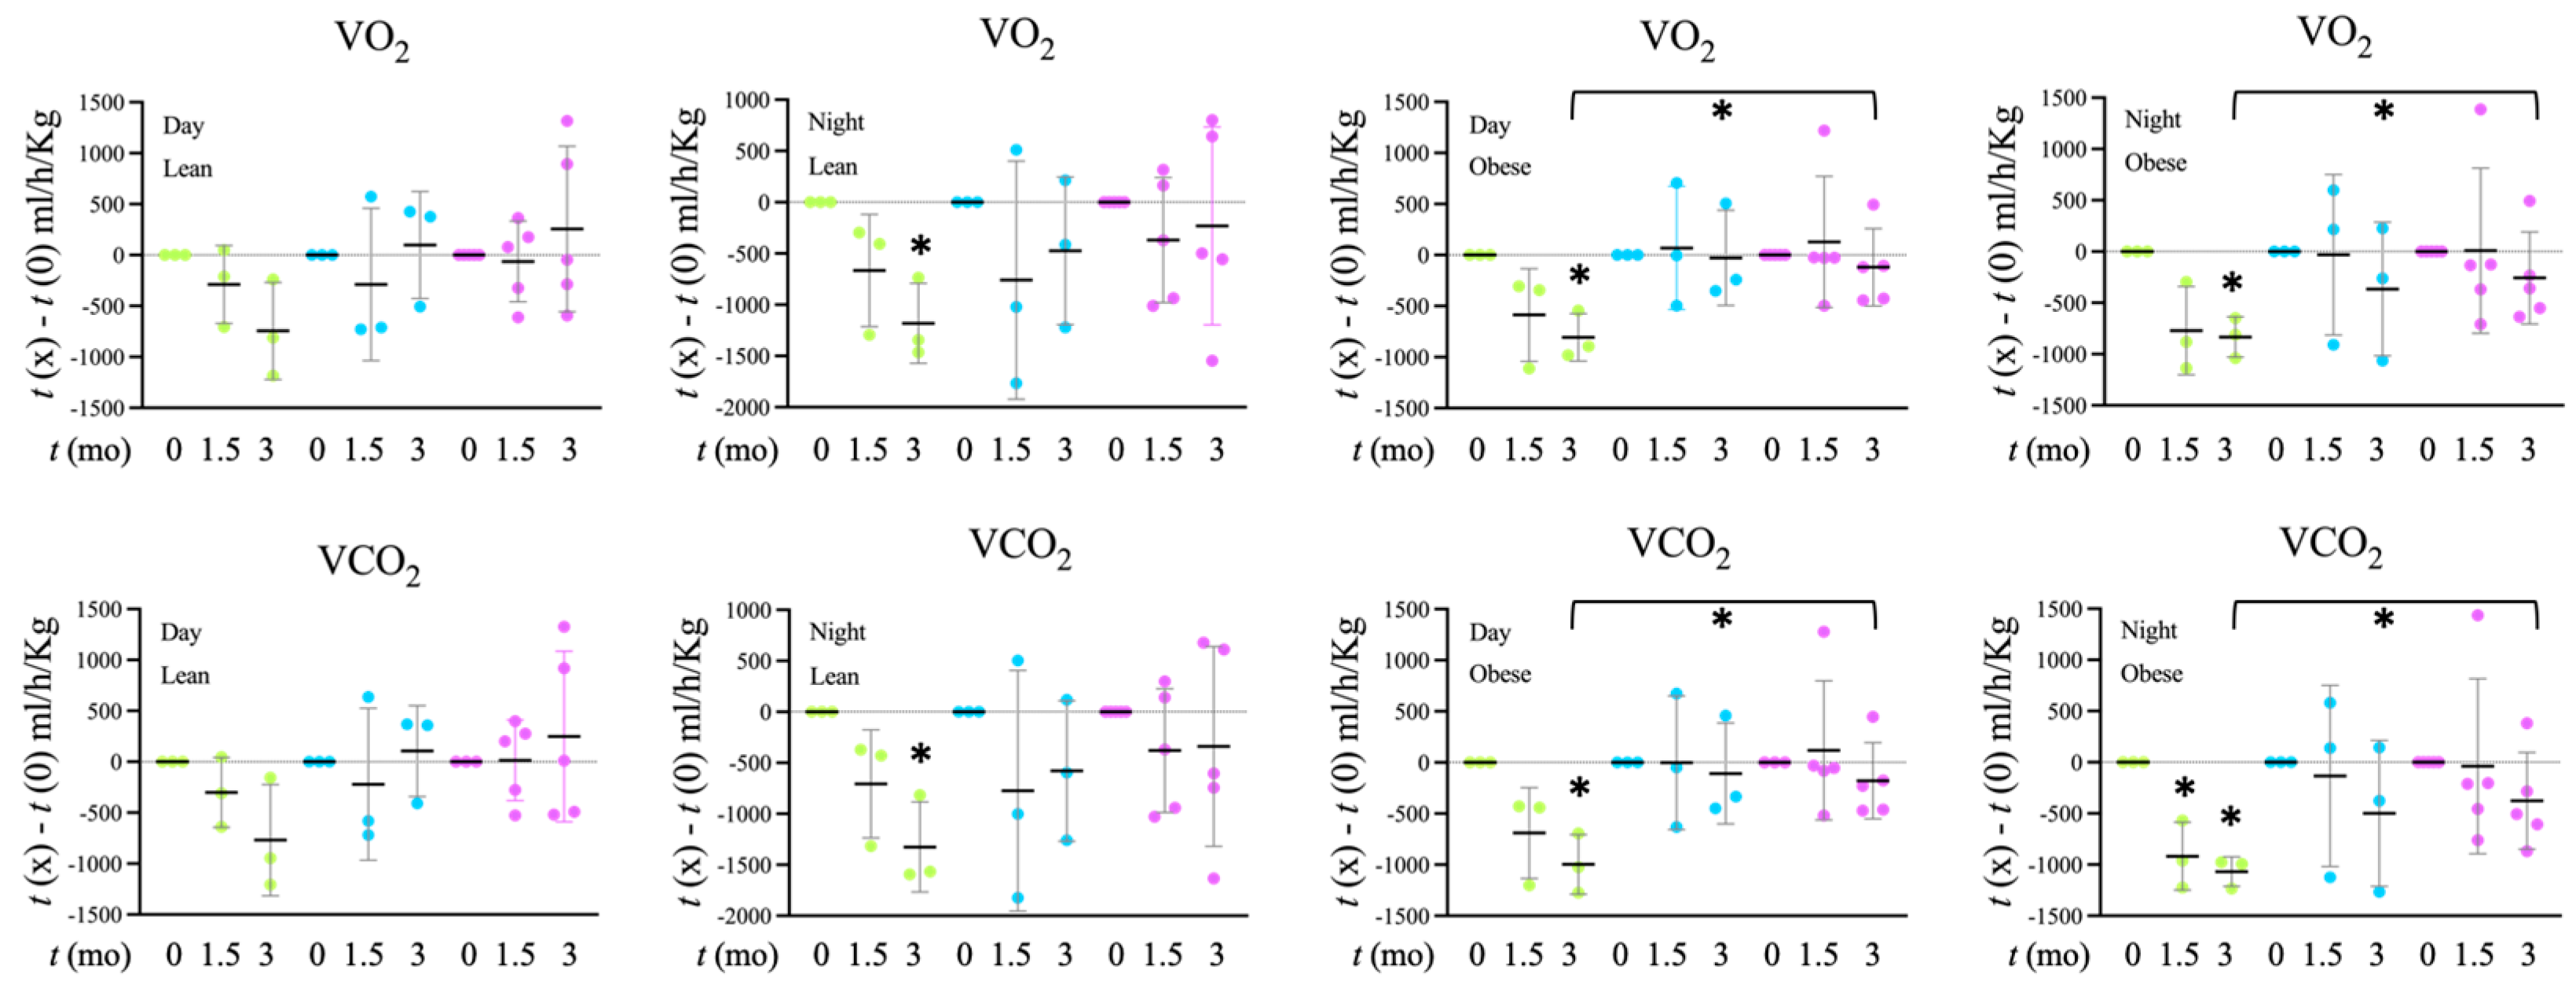 Tap, filter, filter + probiotic. Collected data correspond to the integrated fluorescence signal divided by the tissue area. The graphs show the x fold change relative to the mean of the lean or obese control group (tap), mean +/− SD. * p < 0.05 (t test). Each data point corresponds to the mean values per rat. Representative images of the groups taken with a 20× objective are included in the left panels.
Tap, filter, filter + probiotic. Collected data correspond to the integrated fluorescence signal divided by the tissue area. The graphs show the x fold change relative to the mean of the lean or obese control group (tap), mean +/− SD. * p < 0.05 (t test). Each data point corresponds to the mean values per rat. Representative images of the groups taken with a 20× objective are included in the left panels.
Tap, filter, filter + probiotic. Collected data correspond to the integrated fluorescence signal divided by the tissue area. The graphs show the x fold change relative to the mean of the lean or obese control group (tap), mean +/− SD. * p < 0.05 (t test). Each data point corresponds to the mean values per rat. Representative images of the groups taken with a 20× objective are included in the left panels. Tap, filter, filter + probiotic. Collected data correspond to the positive area divided by the tissue area. The graphs show the % relative to the mean of the control group (tap), mean +/− SD. * p < 0.05 (t-test). Each data point corresponds to the mean of the values obtained for each rat. Representative images of the groups taken with a 20× objective are included in the left panels.
Tap, filter, filter + probiotic. Collected data correspond to the positive area divided by the tissue area. The graphs show the % relative to the mean of the control group (tap), mean +/− SD. * p < 0.05 (t-test). Each data point corresponds to the mean of the values obtained for each rat. Representative images of the groups taken with a 20× objective are included in the left panels.
Tap, filter, filter + probiotic. Collected data correspond to the positive area divided by the tissue area. The graphs show the % relative to the mean of the control group (tap), mean +/− SD. * p < 0.05 (t-test). Each data point corresponds to the mean of the values obtained for each rat. Representative images of the groups taken with a 20× objective are included in the left panels. Tap, filter, filter + probiotic. The graphs show the differences in ΔΔCt of the individual values per rat and the mean value of the corresponding control group (tap), mean +/− SD. For clarity’s sake, −ΔΔCt values are presented, with higher values indicating higher mRNA expression. * p < 0.05 (t test).
Tap, filter, filter + probiotic. The graphs show the differences in ΔΔCt of the individual values per rat and the mean value of the corresponding control group (tap), mean +/− SD. For clarity’s sake, −ΔΔCt values are presented, with higher values indicating higher mRNA expression. * p < 0.05 (t test).
Tap, filter, filter + probiotic. The graphs show the differences in ΔΔCt of the individual values per rat and the mean value of the corresponding control group (tap), mean +/− SD. For clarity’s sake, −ΔΔCt values are presented, with higher values indicating higher mRNA expression. * p < 0.05 (t test).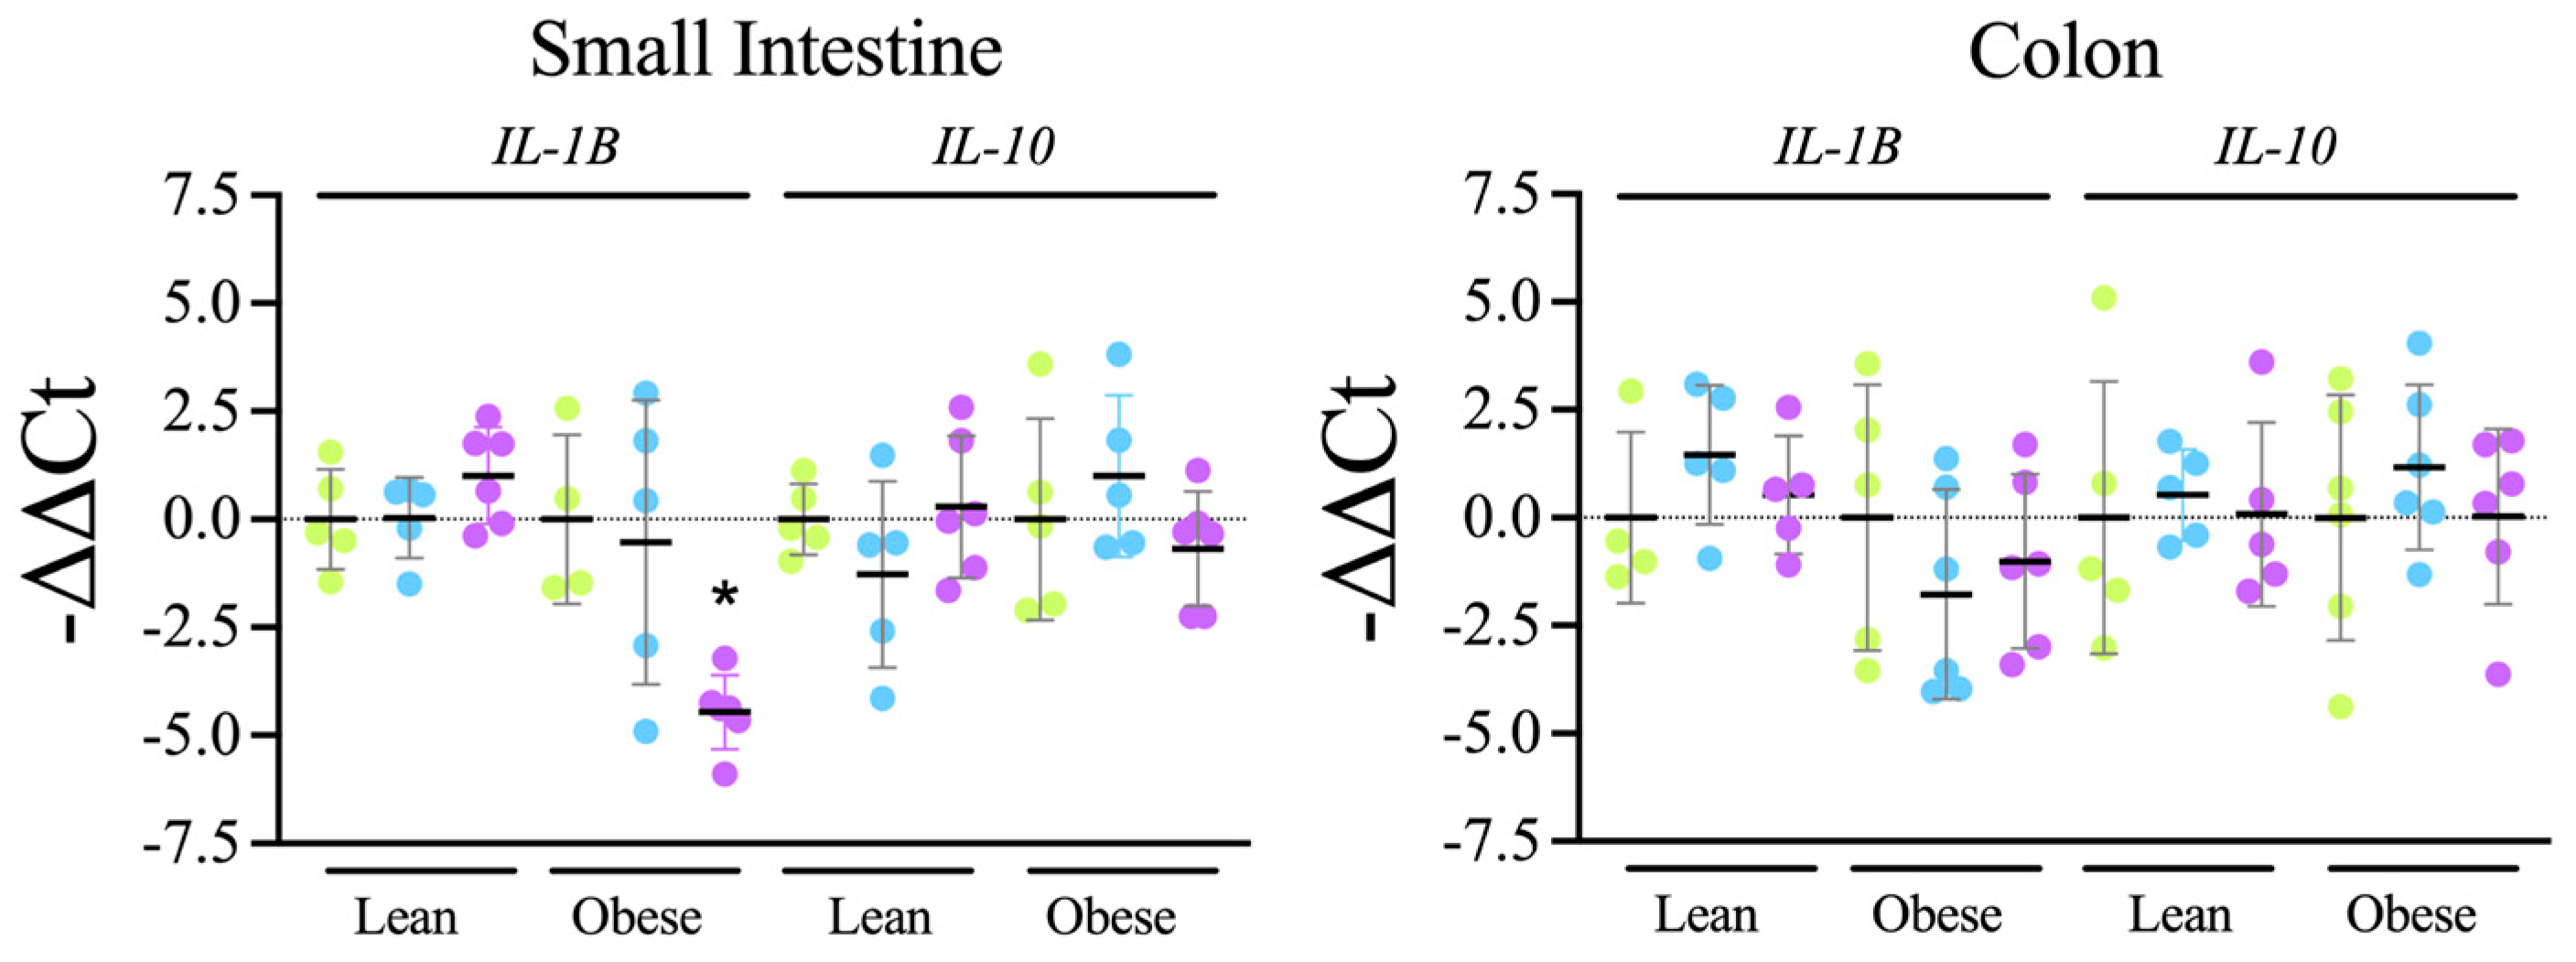 Tap, filter, filter + probiotic. Collected data correspond to the integrated fluorescence signal divided by the tissue area. The graphs show the % relative to the mean of the control group (tap), mean +/− SD. *** p < 0.001 (t test). Each data point corresponds to the mean of the values obtained for each rat. Representative images captured using a 20× objective are included in the left panels.
Tap, filter, filter + probiotic. Collected data correspond to the integrated fluorescence signal divided by the tissue area. The graphs show the % relative to the mean of the control group (tap), mean +/− SD. *** p < 0.001 (t test). Each data point corresponds to the mean of the values obtained for each rat. Representative images captured using a 20× objective are included in the left panels.
Tap, filter, filter + probiotic. Collected data correspond to the integrated fluorescence signal divided by the tissue area. The graphs show the % relative to the mean of the control group (tap), mean +/− SD. *** p < 0.001 (t test). Each data point corresponds to the mean of the values obtained for each rat. Representative images captured using a 20× objective are included in the left panels. Tap, filter, filter + probiotic. The represented values in the graphs are the differences in the number of bacteria between the values obtained at the indicated time and t = 0 for each individual rat analyzed, mean values +/− SD. Statistical comparison between groups was carried out using t test type 1 (variations over time) and type 2 (differences between groups). * p < 0.05, ** p < 0.01 for the comparison with t = 0, # p < 0.05, ## p < 0.01 for the comparison with the control group (tap), $ p < 0.05, $$$ p < 0.001 for the comparison of the filtered water group with the filter + probiotic group.
Tap, filter, filter + probiotic. The represented values in the graphs are the differences in the number of bacteria between the values obtained at the indicated time and t = 0 for each individual rat analyzed, mean values +/− SD. Statistical comparison between groups was carried out using t test type 1 (variations over time) and type 2 (differences between groups). * p < 0.05, ** p < 0.01 for the comparison with t = 0, # p < 0.05, ## p < 0.01 for the comparison with the control group (tap), $ p < 0.05, $$$ p < 0.001 for the comparison of the filtered water group with the filter + probiotic group.
Tap, filter, filter + probiotic. The represented values in the graphs are the differences in the number of bacteria between the values obtained at the indicated time and t = 0 for each individual rat analyzed, mean values +/− SD. Statistical comparison between groups was carried out using t test type 1 (variations over time) and type 2 (differences between groups). * p < 0.05, ** p < 0.01 for the comparison with t = 0, # p < 0.05, ## p < 0.01 for the comparison with the control group (tap), $ p < 0.05, $$$ p < 0.001 for the comparison of the filtered water group with the filter + probiotic group.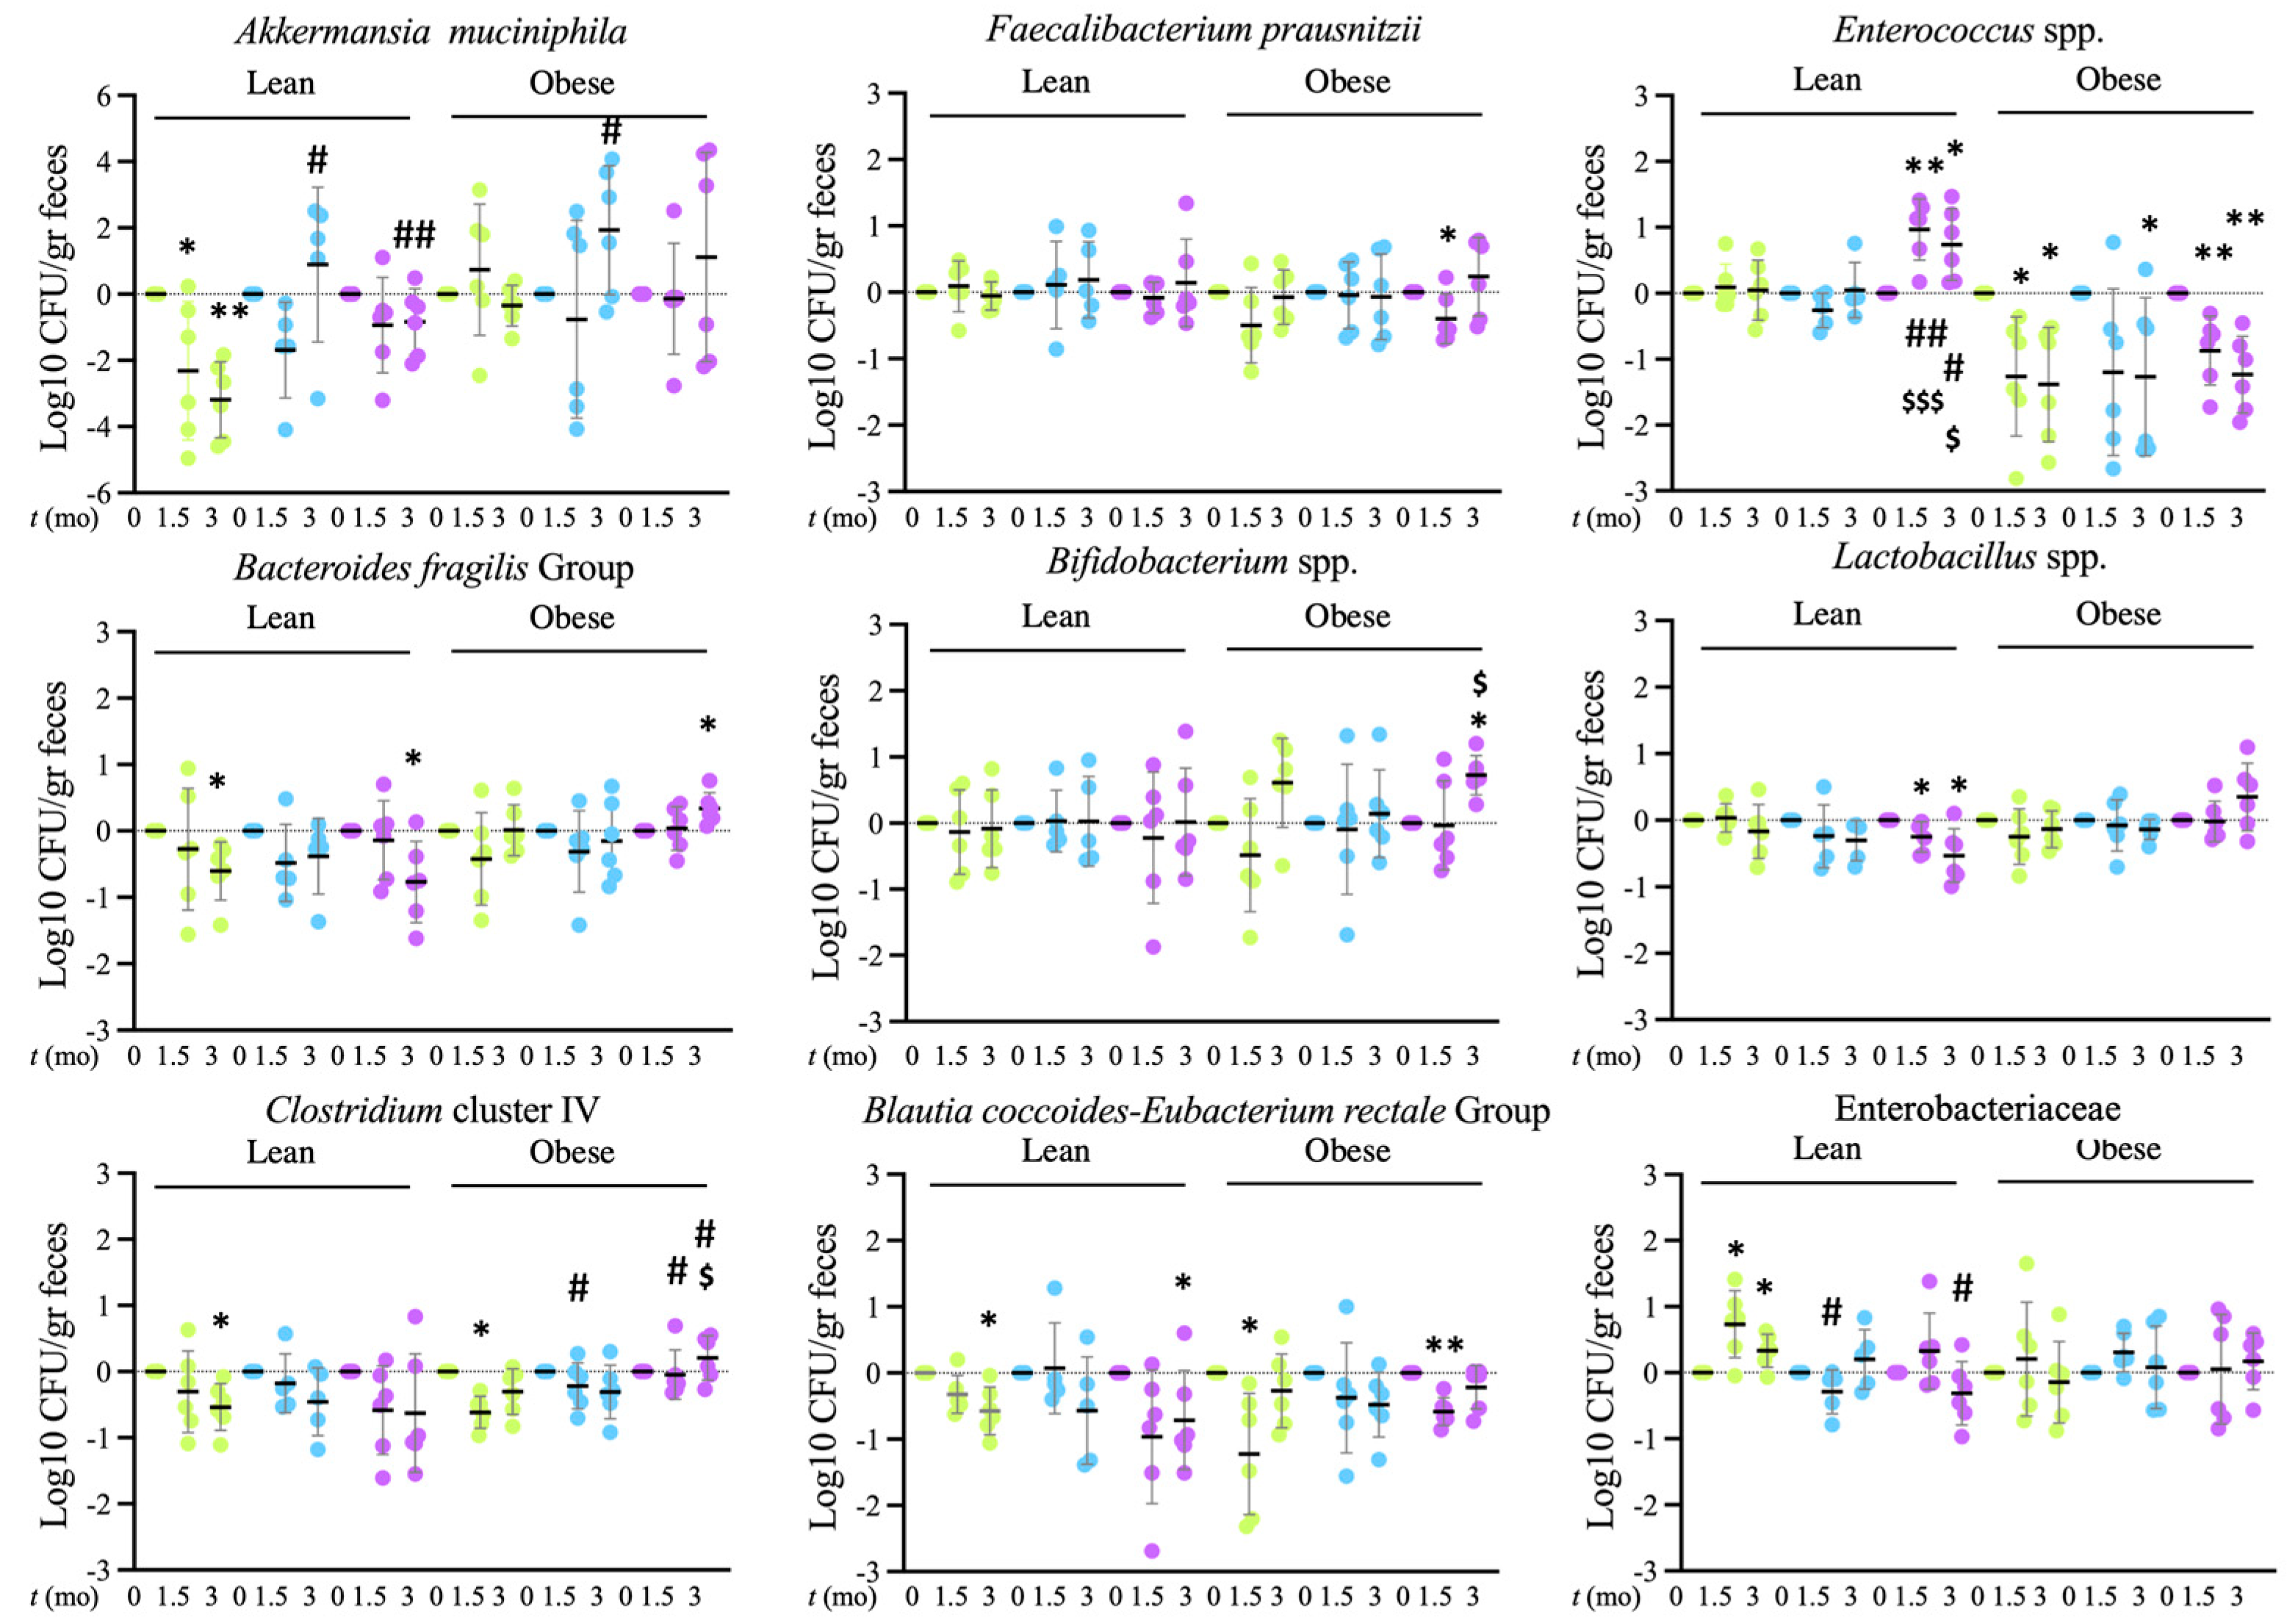
Disclaimer/Publisher’s Note: The statements, opinions and data contained in all publications are solely those of the individual author(s) and contributor(s) and not of MDPI and/or the editor(s). MDPI and/or the editor(s) disclaim responsibility for any injury to people or property resulting from any ideas, methods, instructions or products referred to in the content. |
© 2024 by the authors. Licensee MDPI, Basel, Switzerland. This article is an open access article distributed under the terms and conditions of the Creative Commons Attribution (CC BY) license (https://creativecommons.org/licenses/by/4.0/).
Share and Cite
Doblado, L.; Díaz, L.E.; Nova, E.; Marcos, A.; Monsalve, M. Intestinal Effects of Filtered Alkalinized Water in Lean and Obese Zucker Rats. Microorganisms 2024, 12, 316. https://doi.org/10.3390/microorganisms12020316
Doblado L, Díaz LE, Nova E, Marcos A, Monsalve M. Intestinal Effects of Filtered Alkalinized Water in Lean and Obese Zucker Rats. Microorganisms. 2024; 12(2):316. https://doi.org/10.3390/microorganisms12020316
Chicago/Turabian StyleDoblado, Laura, Ligia Esperanza Díaz, Esther Nova, Ascensión Marcos, and María Monsalve. 2024. "Intestinal Effects of Filtered Alkalinized Water in Lean and Obese Zucker Rats" Microorganisms 12, no. 2: 316. https://doi.org/10.3390/microorganisms12020316
APA StyleDoblado, L., Díaz, L. E., Nova, E., Marcos, A., & Monsalve, M. (2024). Intestinal Effects of Filtered Alkalinized Water in Lean and Obese Zucker Rats. Microorganisms, 12(2), 316. https://doi.org/10.3390/microorganisms12020316