

Time-Course Transcriptome Analysis of Bacillus subtilis DB104 during Growth

Abstract
1. Introduction
2. Materials and Methods
2.1. Bacterial Strain and Growth Conditions
2.2. RNA Isolation, Library Construction, and RNA-Sequencing
2.3. Analysis of DEGs
2.4. Functional Analysis of DEGs
2.5. Reverse Transcription-Quantitative Polymerase Chain Reaction (RT-qPCR) Confirmation
3. Results
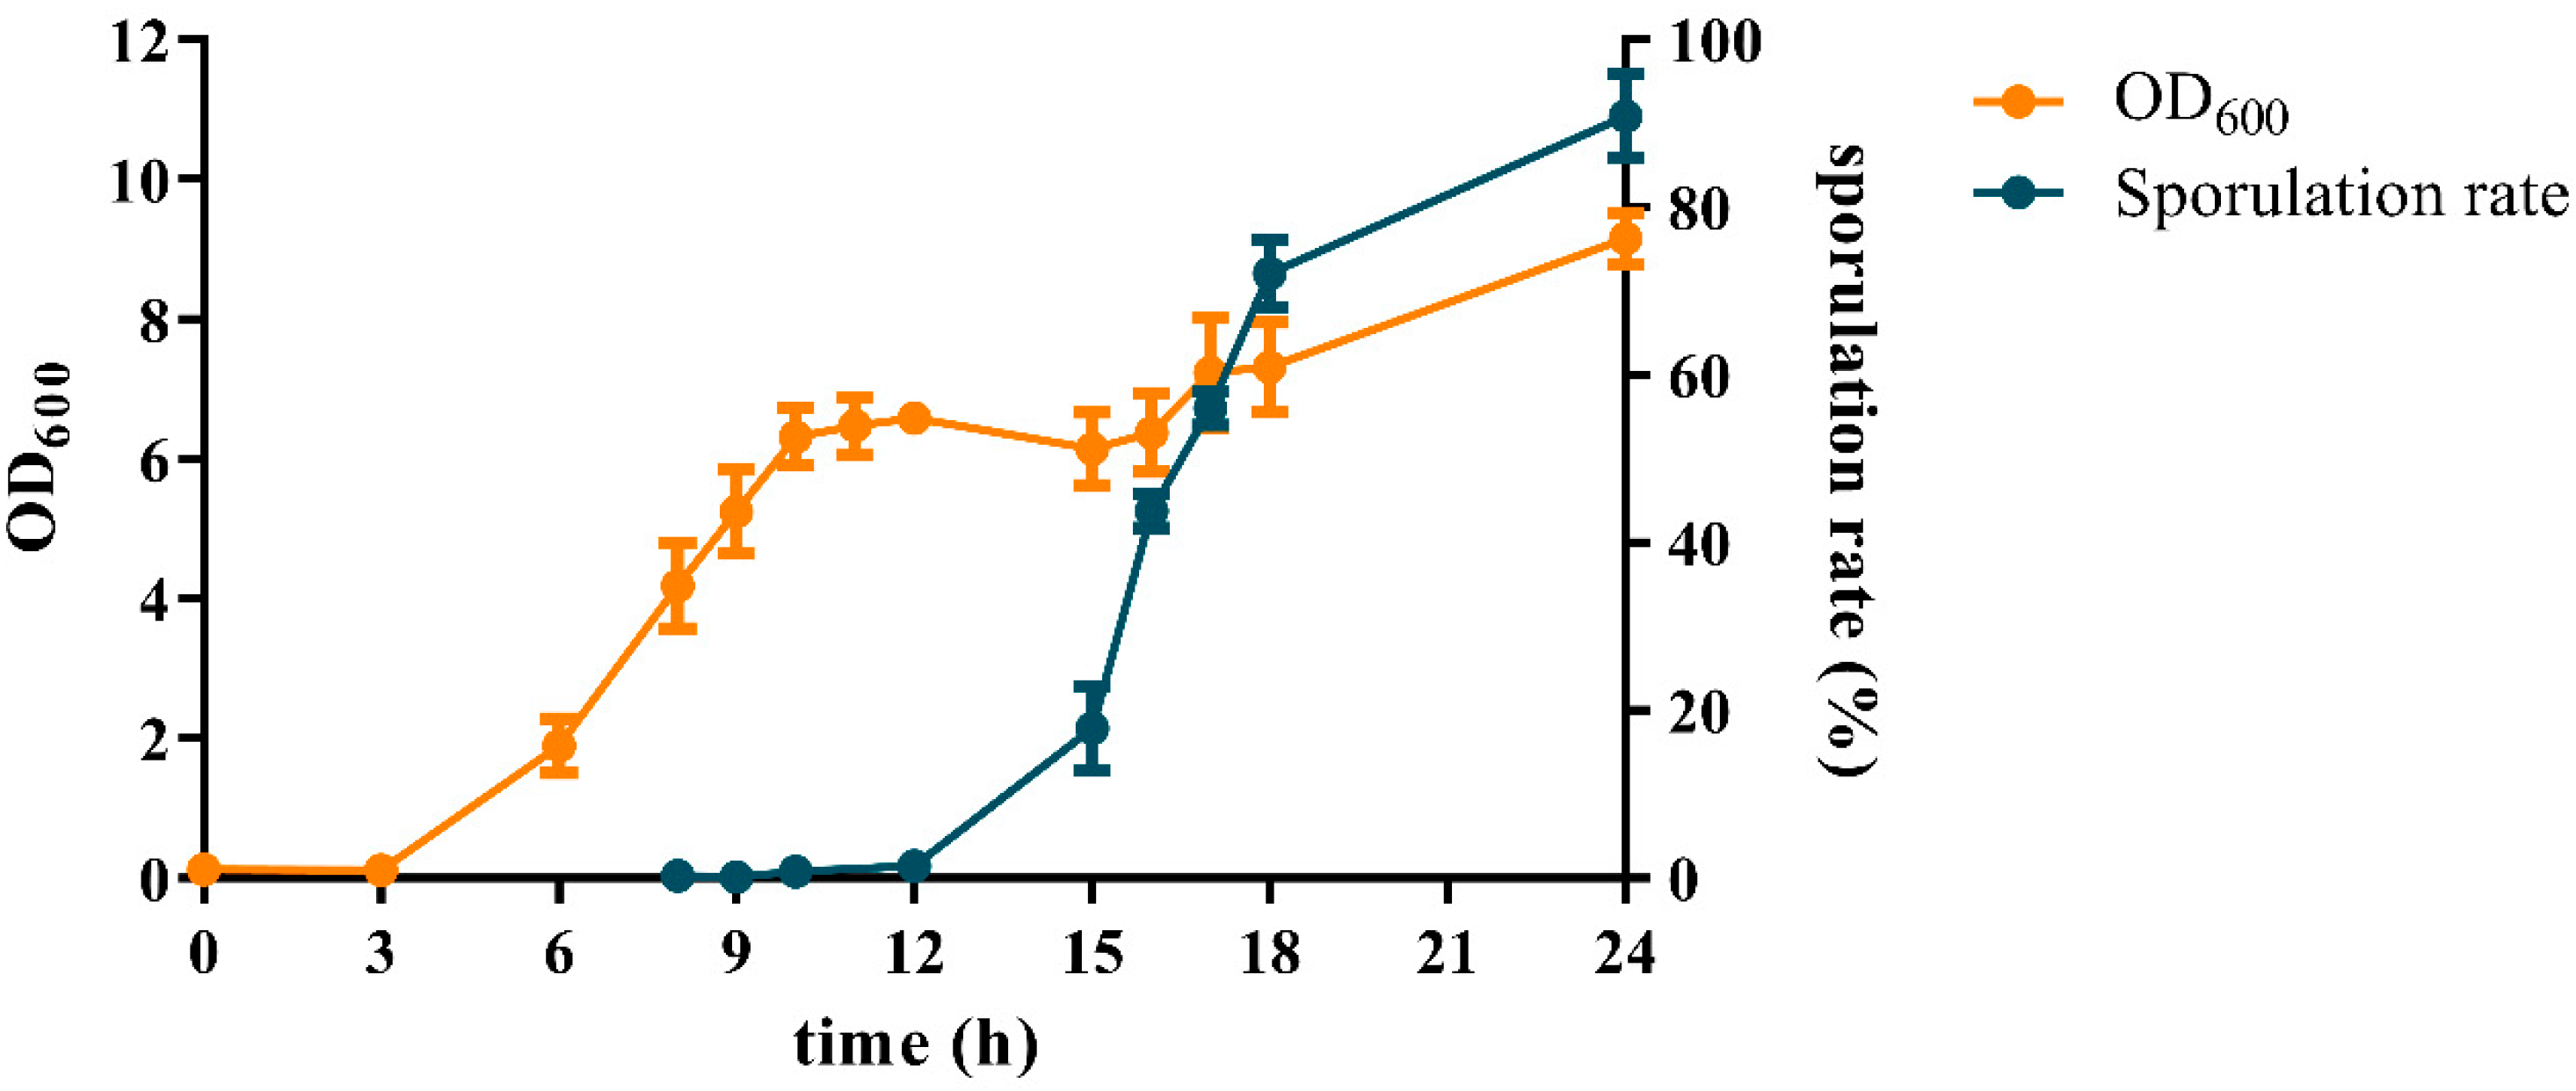
3.1. Cell Growth and Sporulation
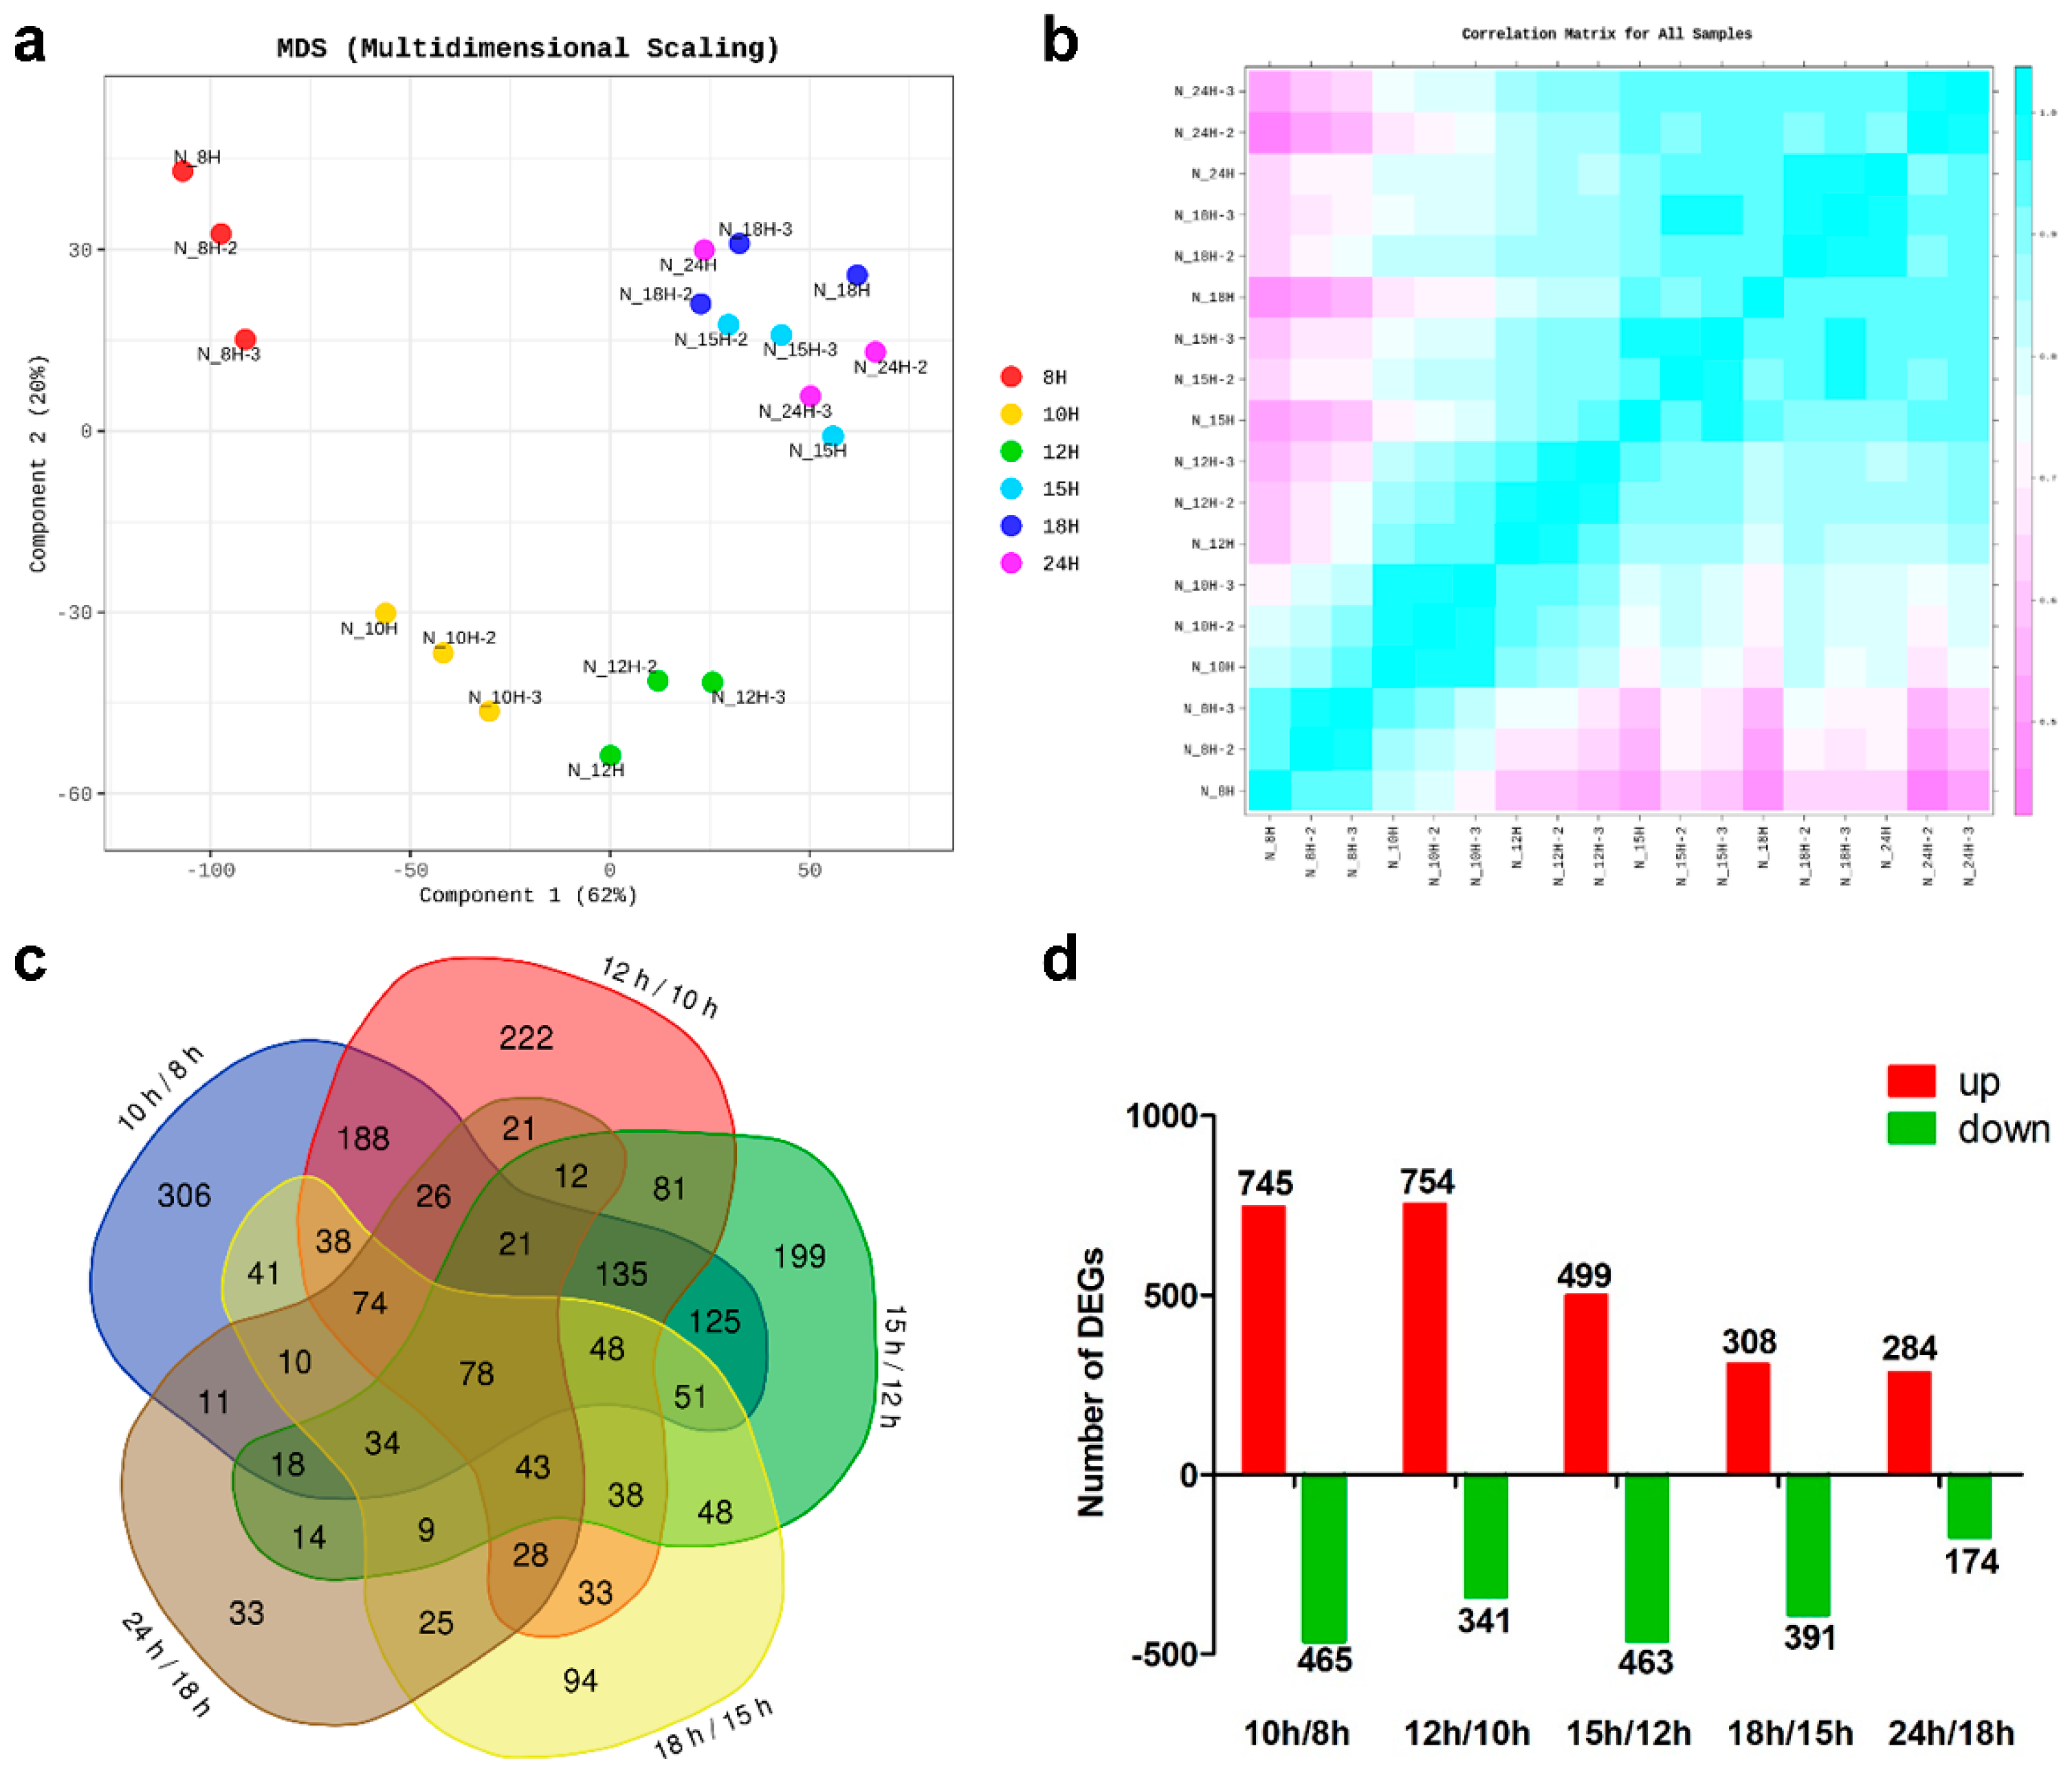
3.2. RNA Sequencing and Analysis of Differentially Expressed Genes (DEGs)
3.3. DEGs with the Highest Expression Levels and Fold Changes
3.4. KEGG Pathway Enrichment Analysis
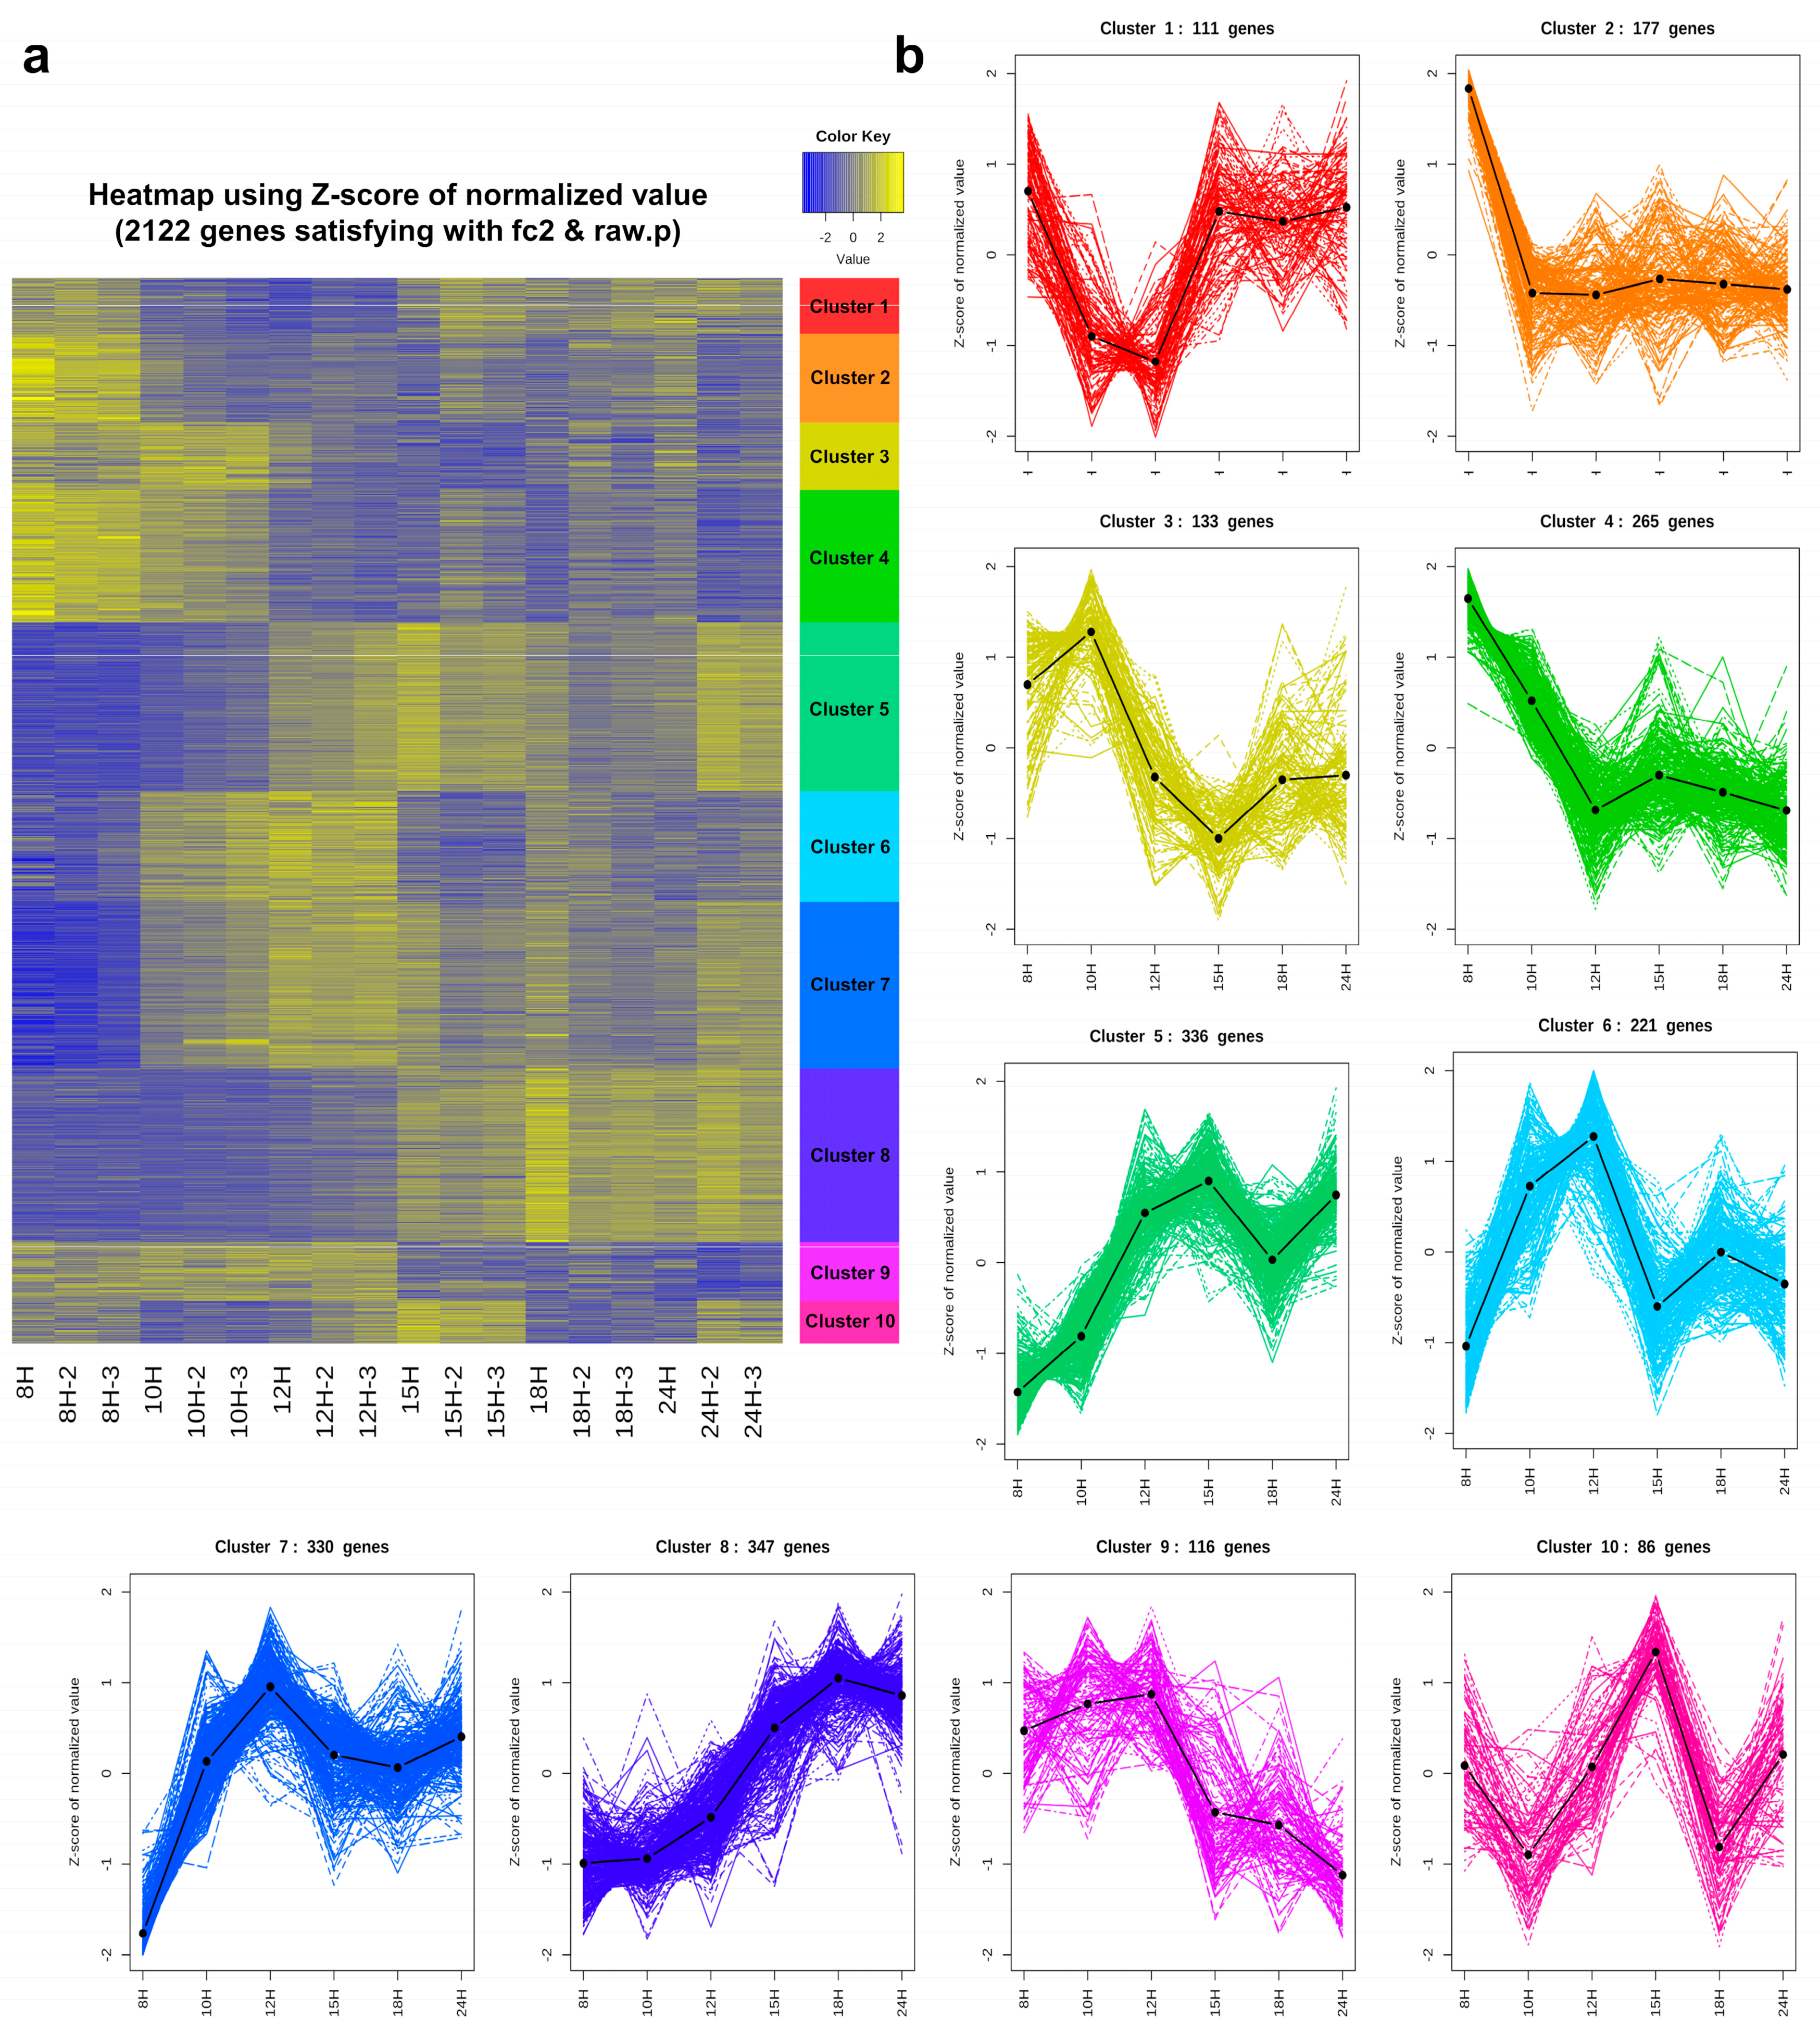
3.5. Cluster Analysis
3.6. Functional Enrichment Analysis of Each Cluster
3.6.1. Genes That Are Down-Regulated at the End of Exponential Growth: Cluster 2
3.6.2. Genes That Are Down-Regulated from the Beginning of Sporulation: Clusters 3 and 4
3.6.3. Genes That Are Turned on at the Beginning of Sporulation and then Turned off in the Middle: Clusters 5, 6, 7, and 9
3.6.4. Genes That Are Up-Regulated in the Middle of Sporulation: Clusters 1 and 8
3.6.5. Genes That Are Transiently Turned on at the Former Part of Sporulation: Cluster 10
3.7. Sigma Factors
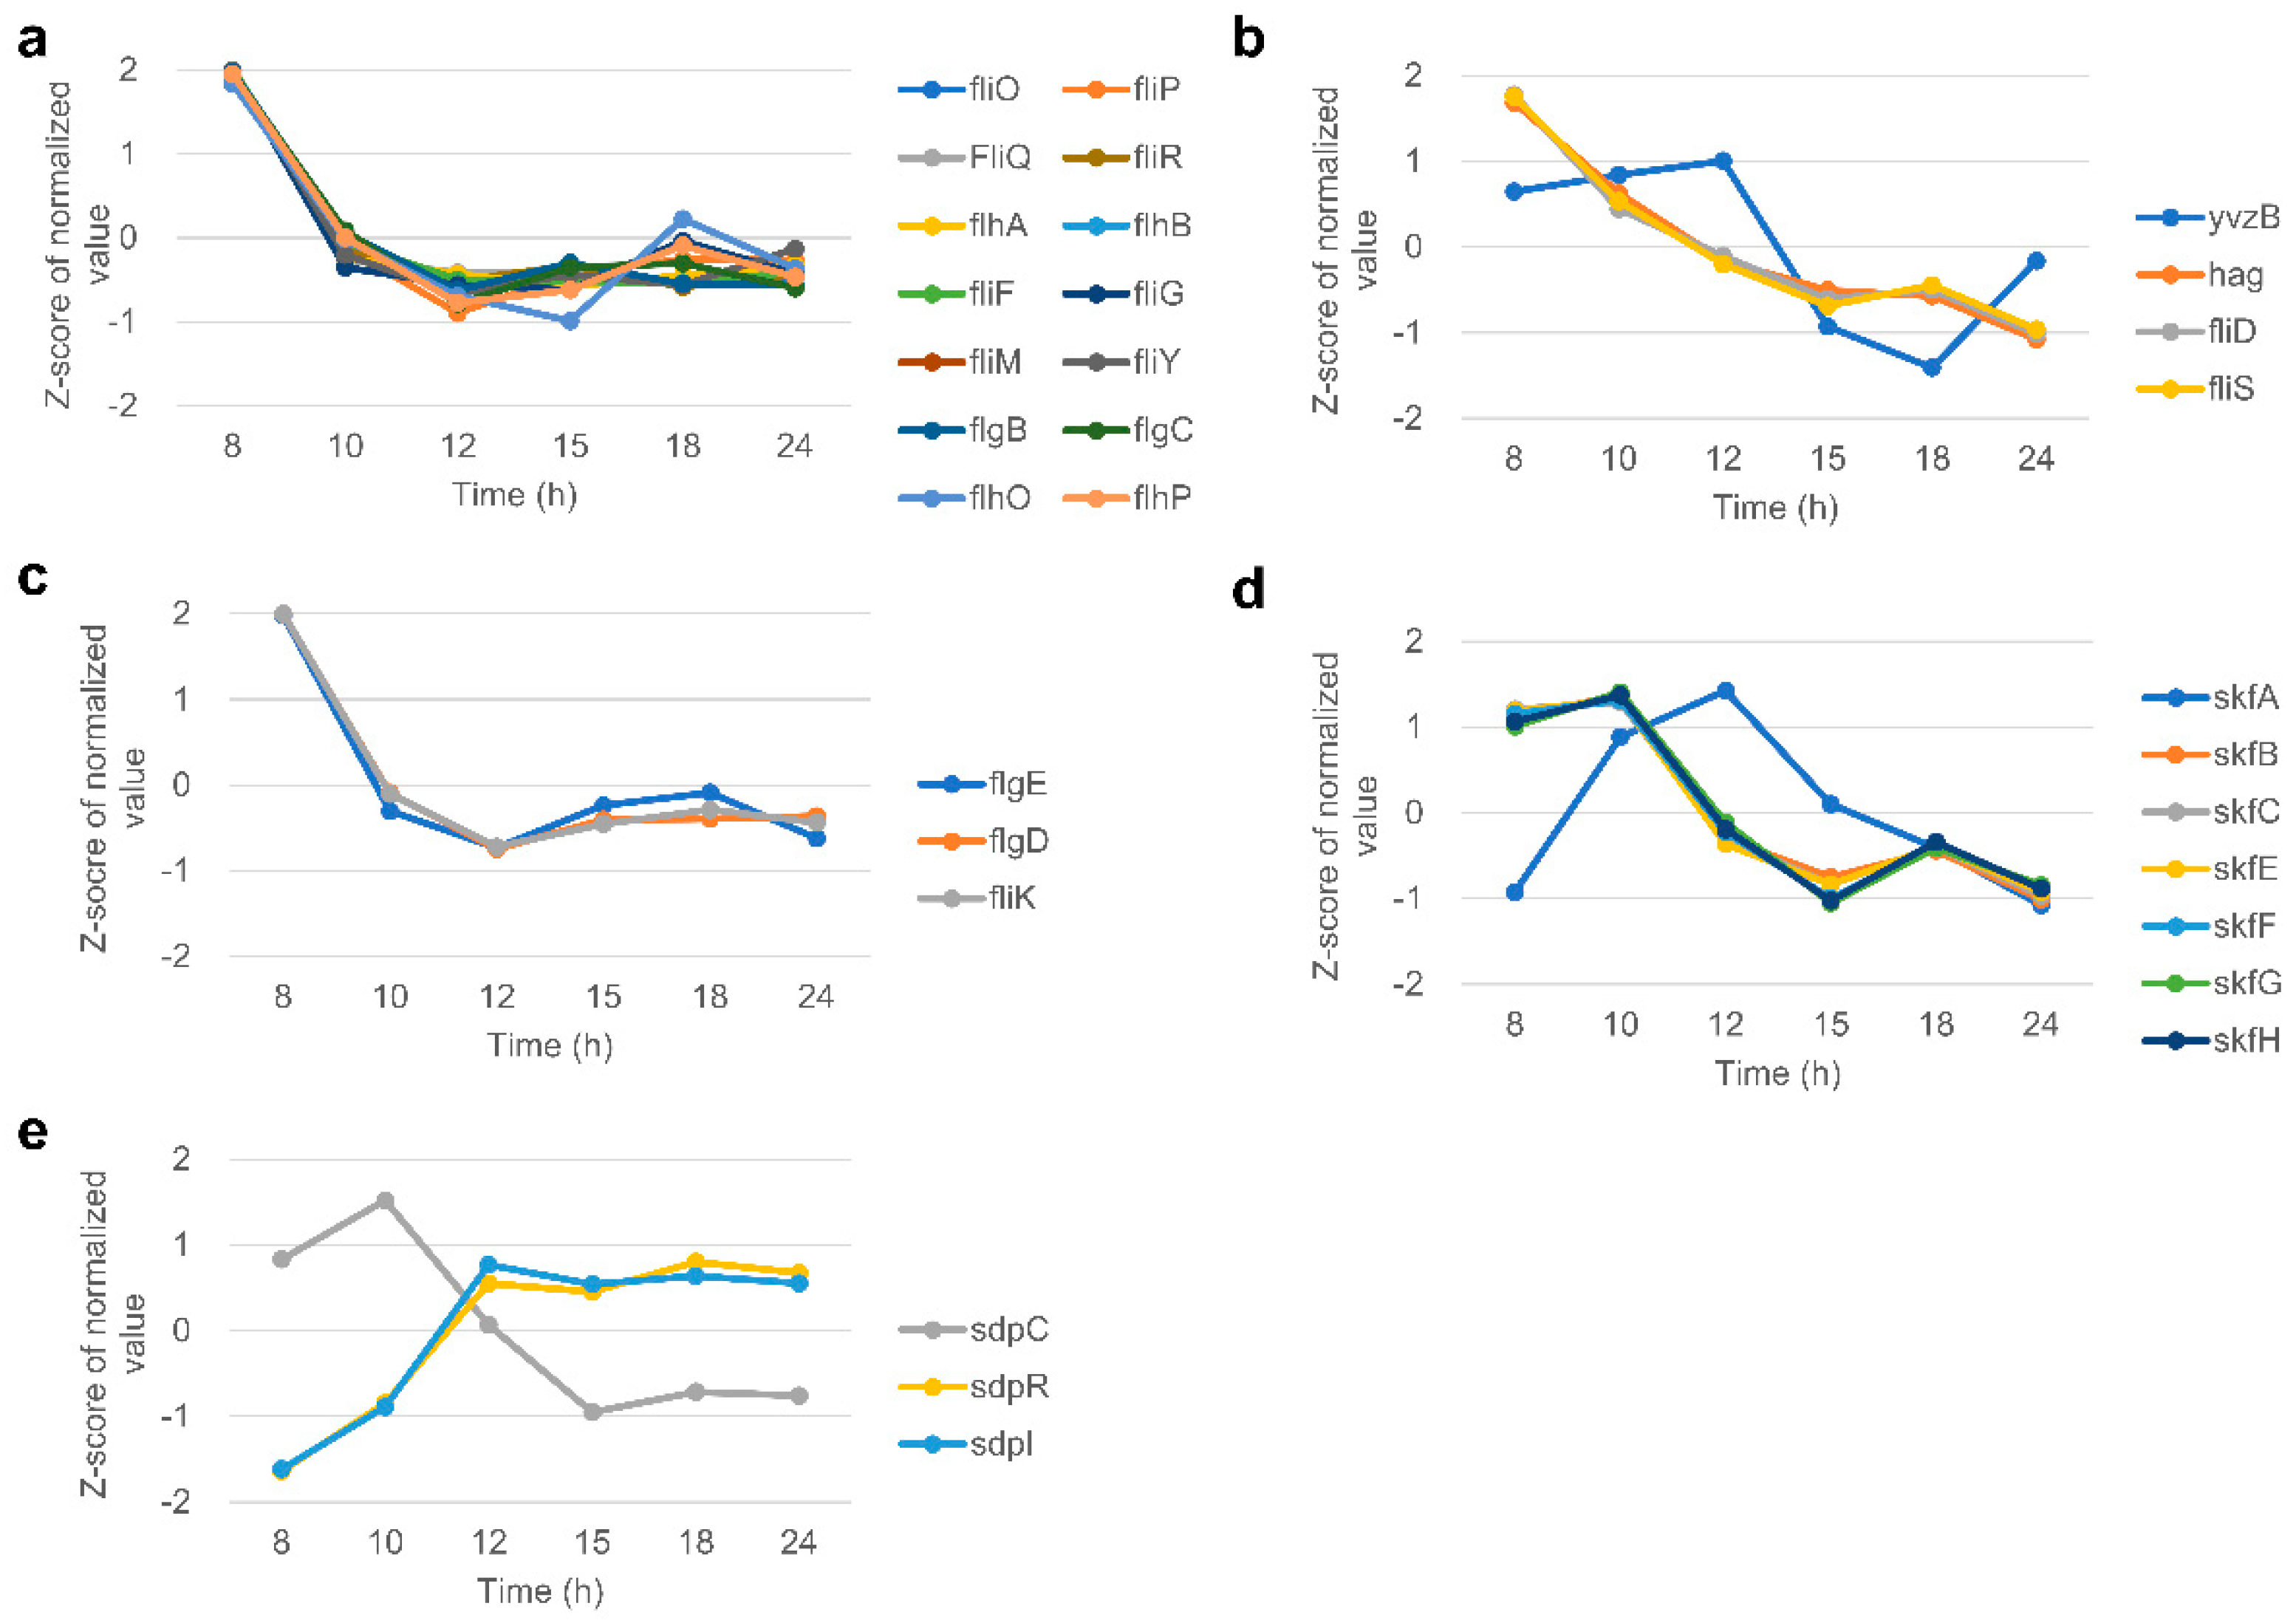
3.8. Flagella
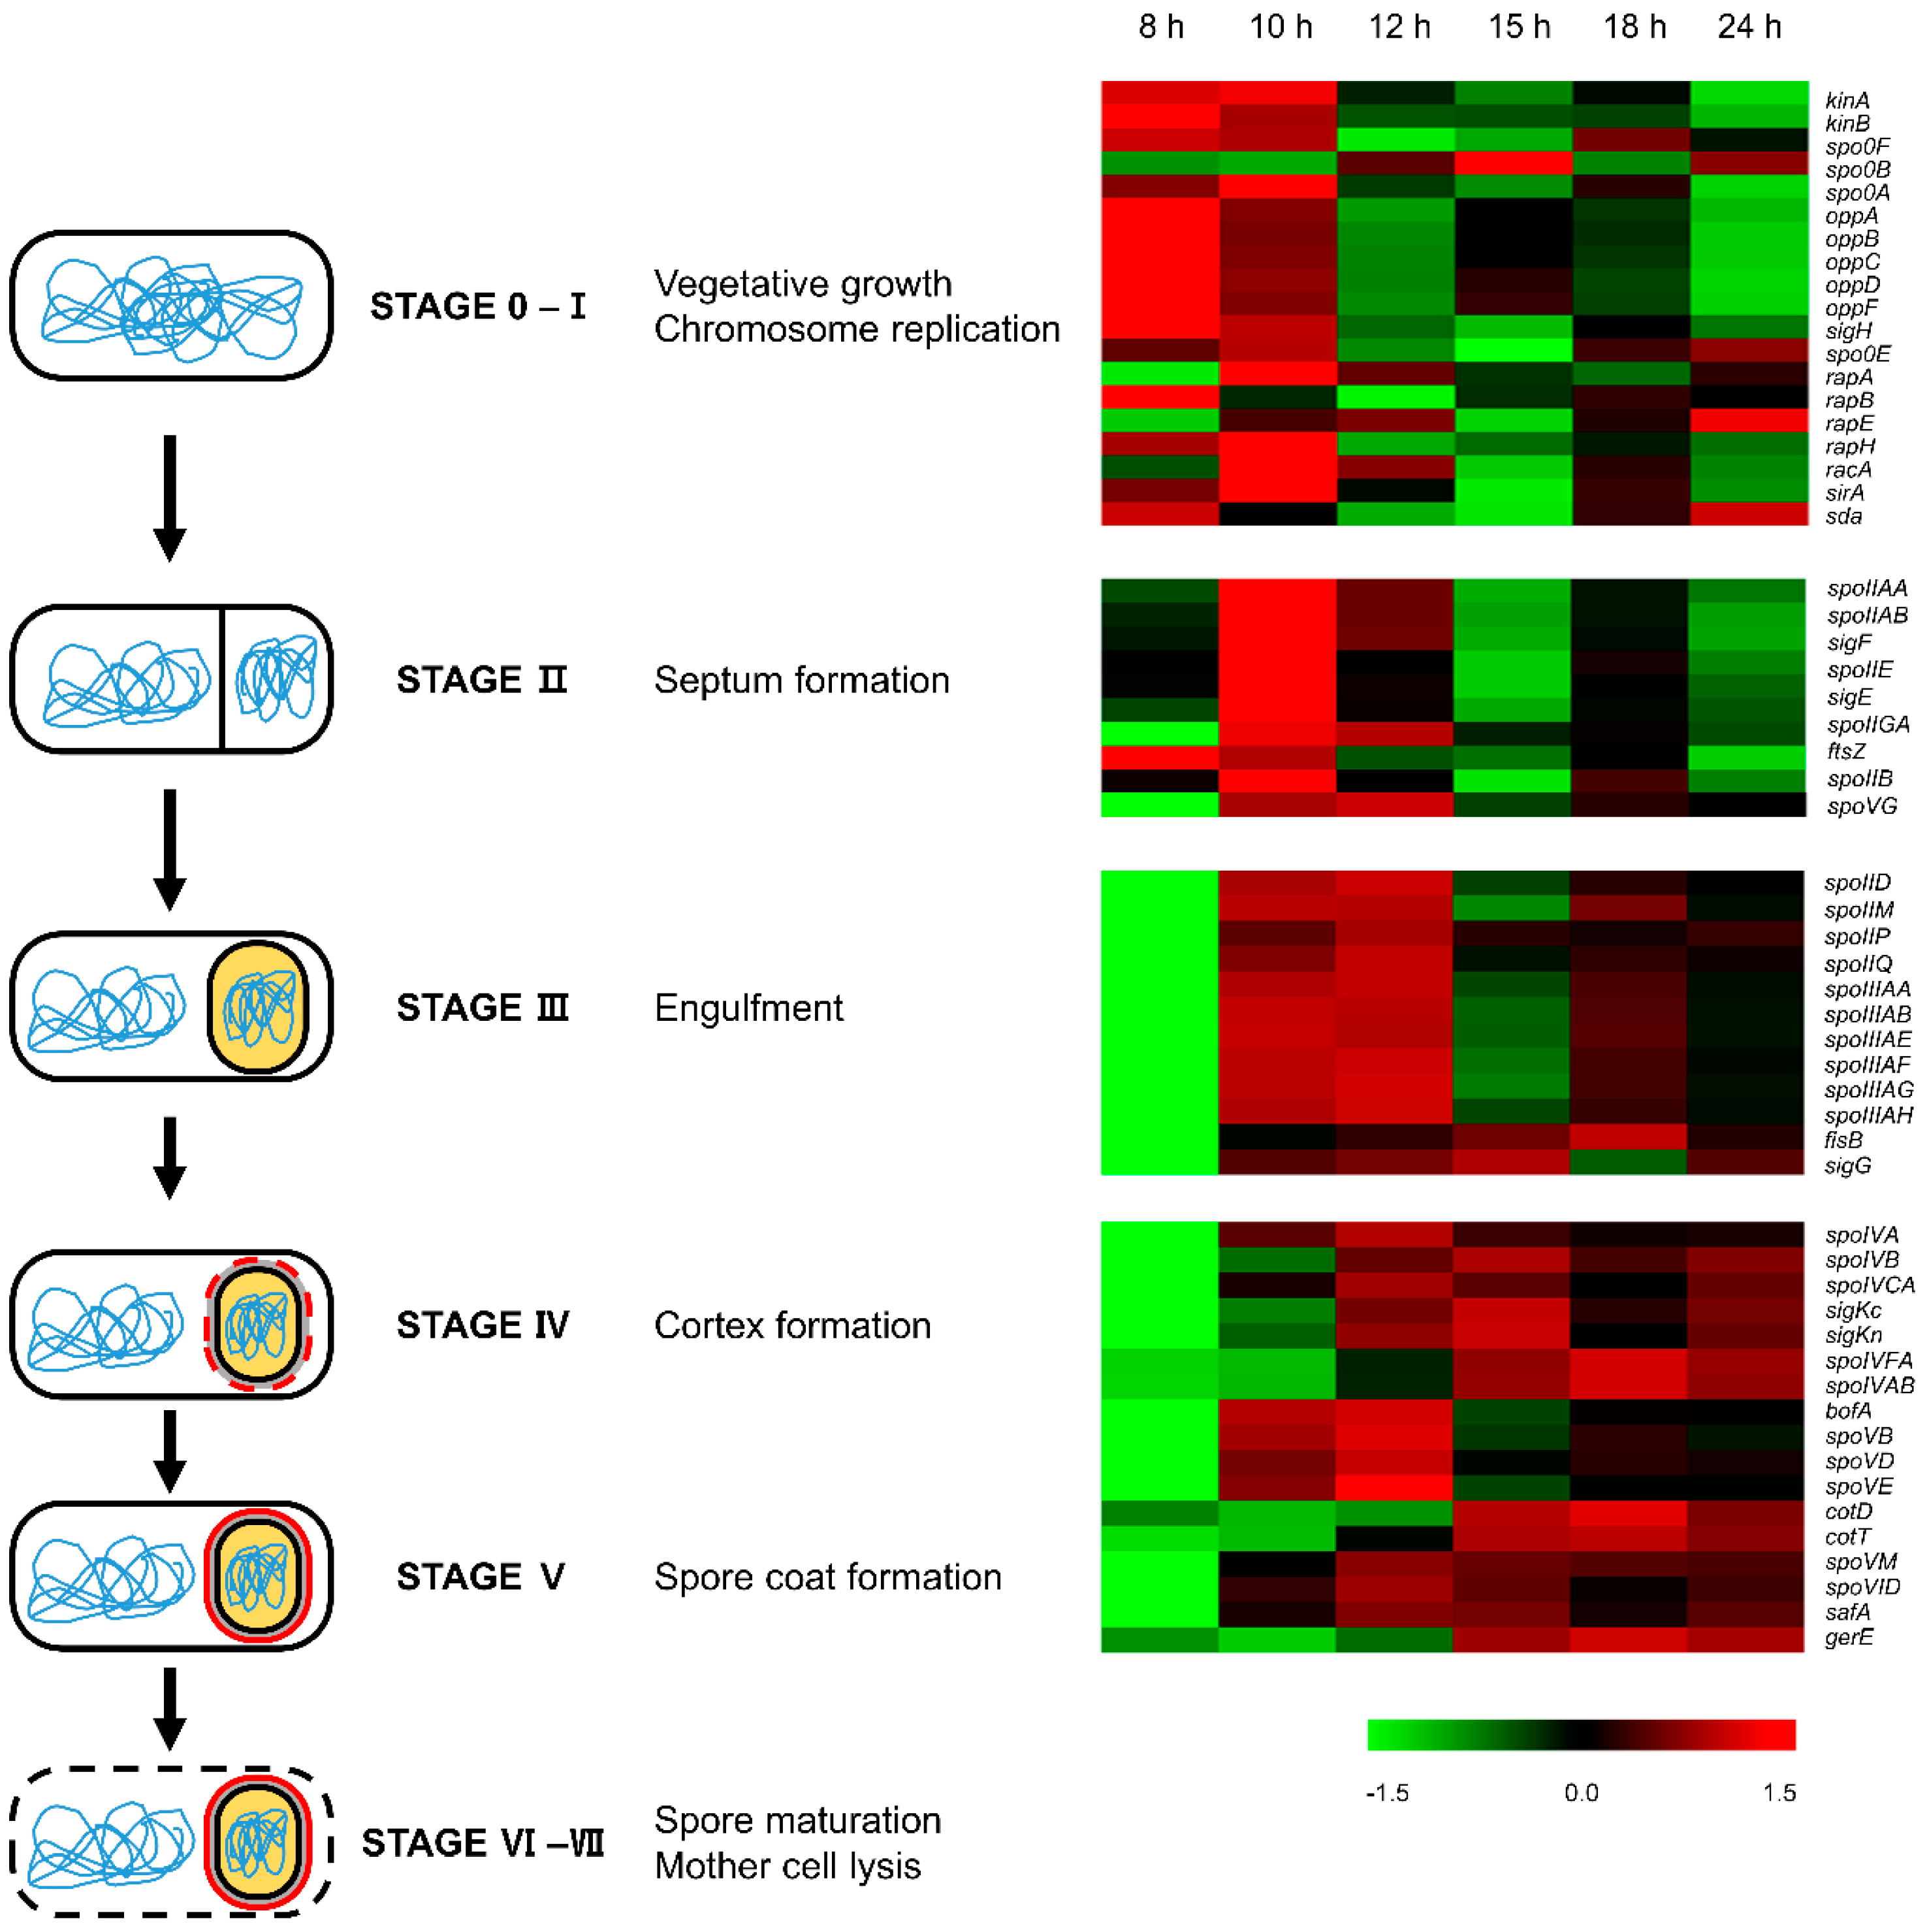
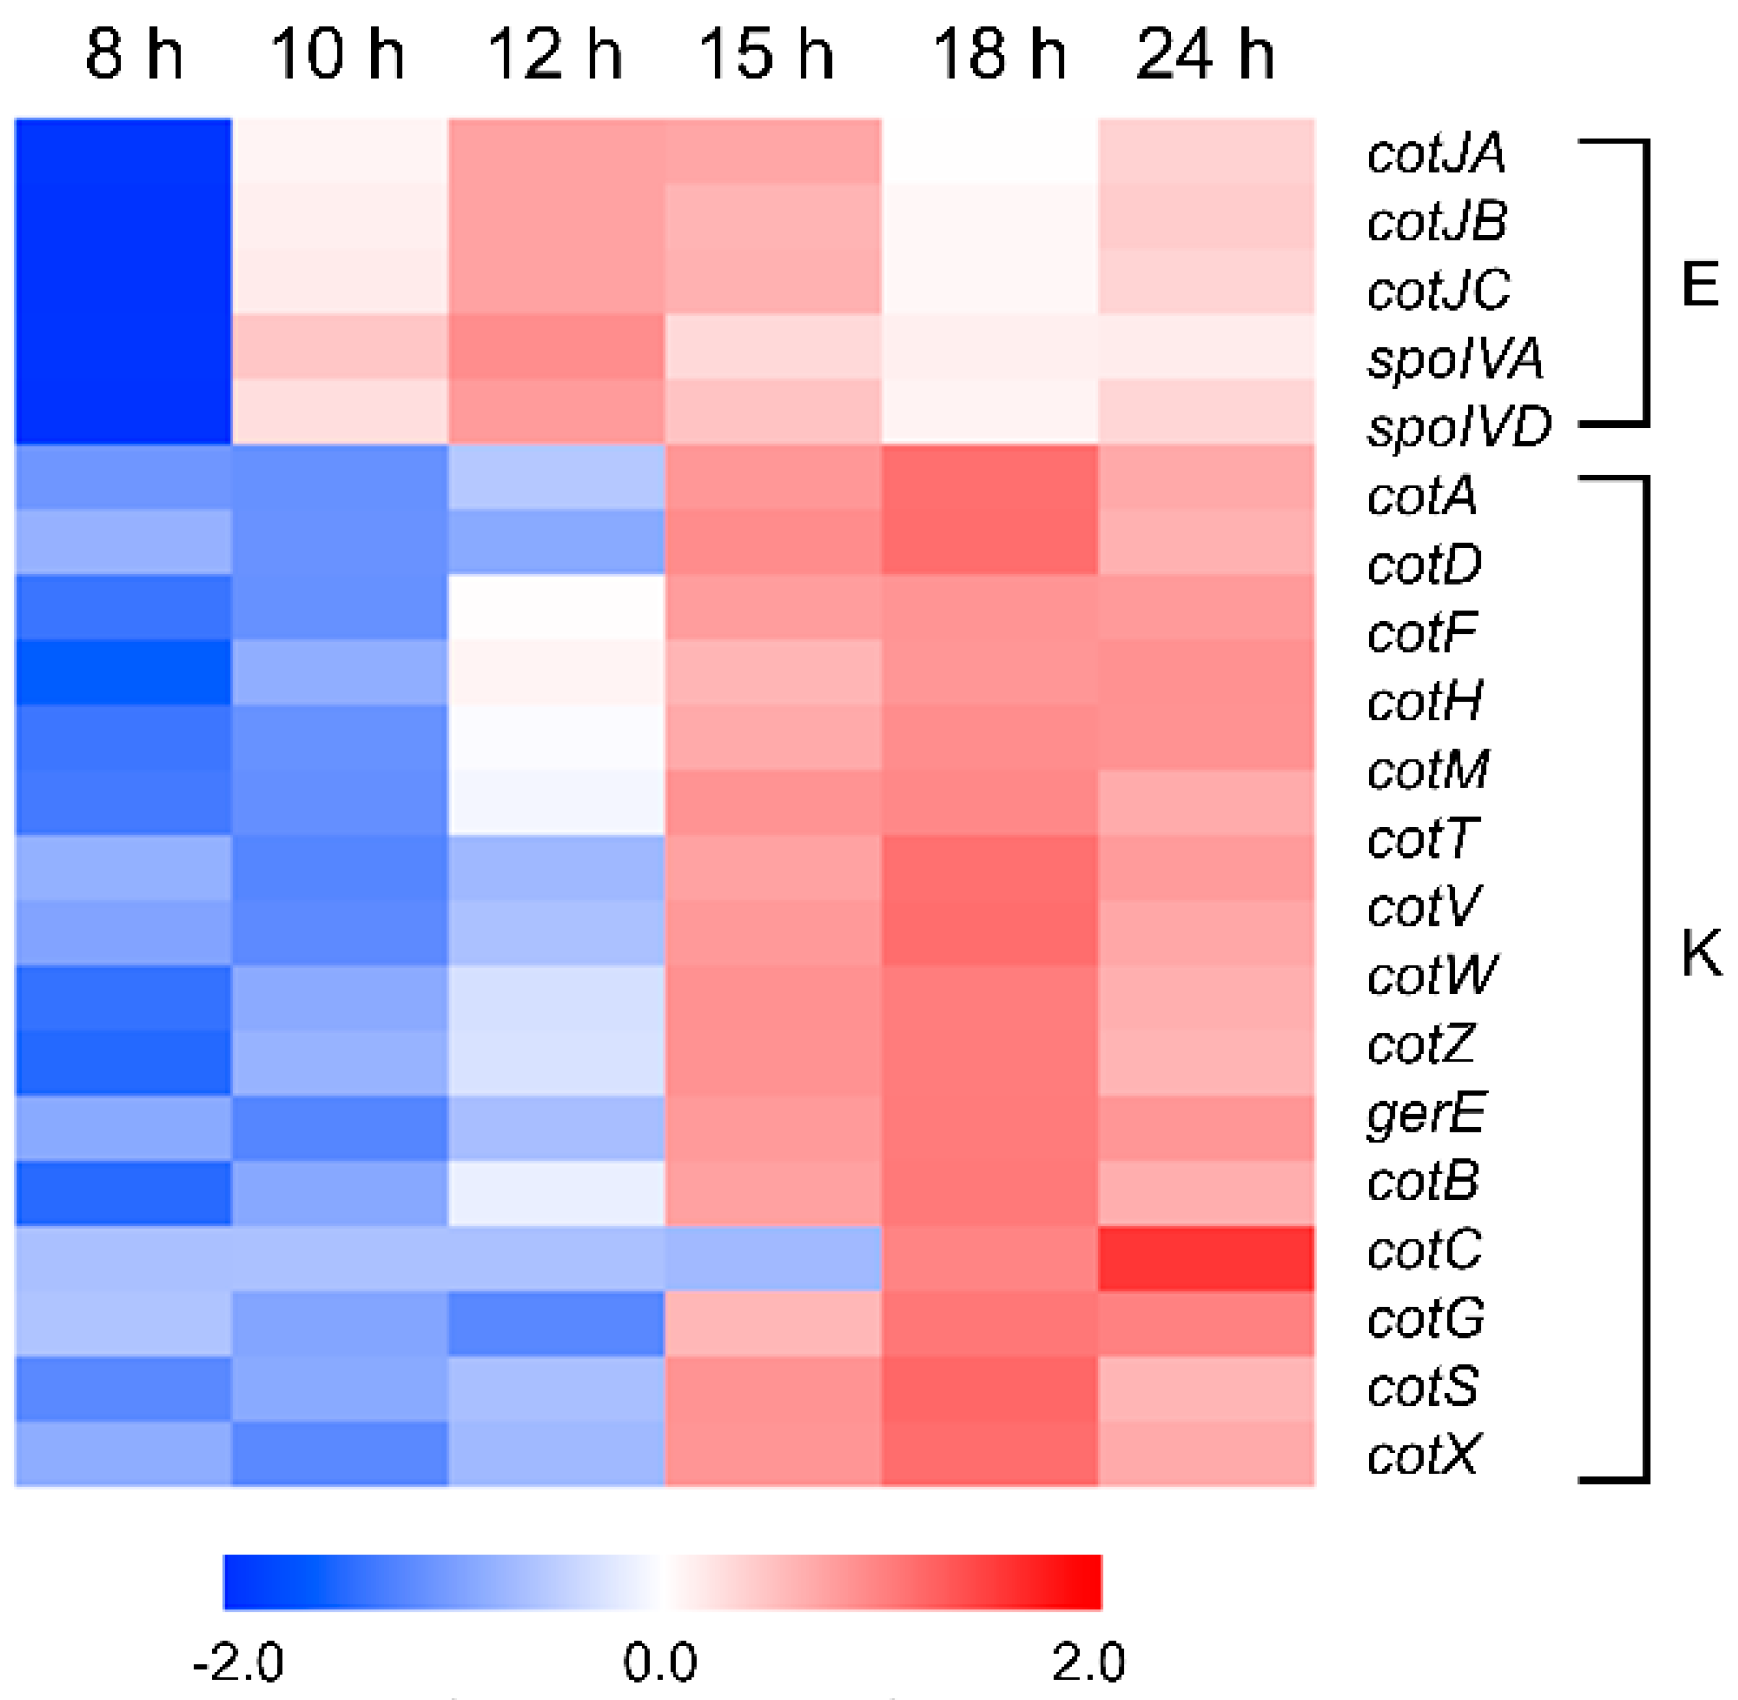
3.9. Sporulation and Spore Coat
3.10. Cannibalism
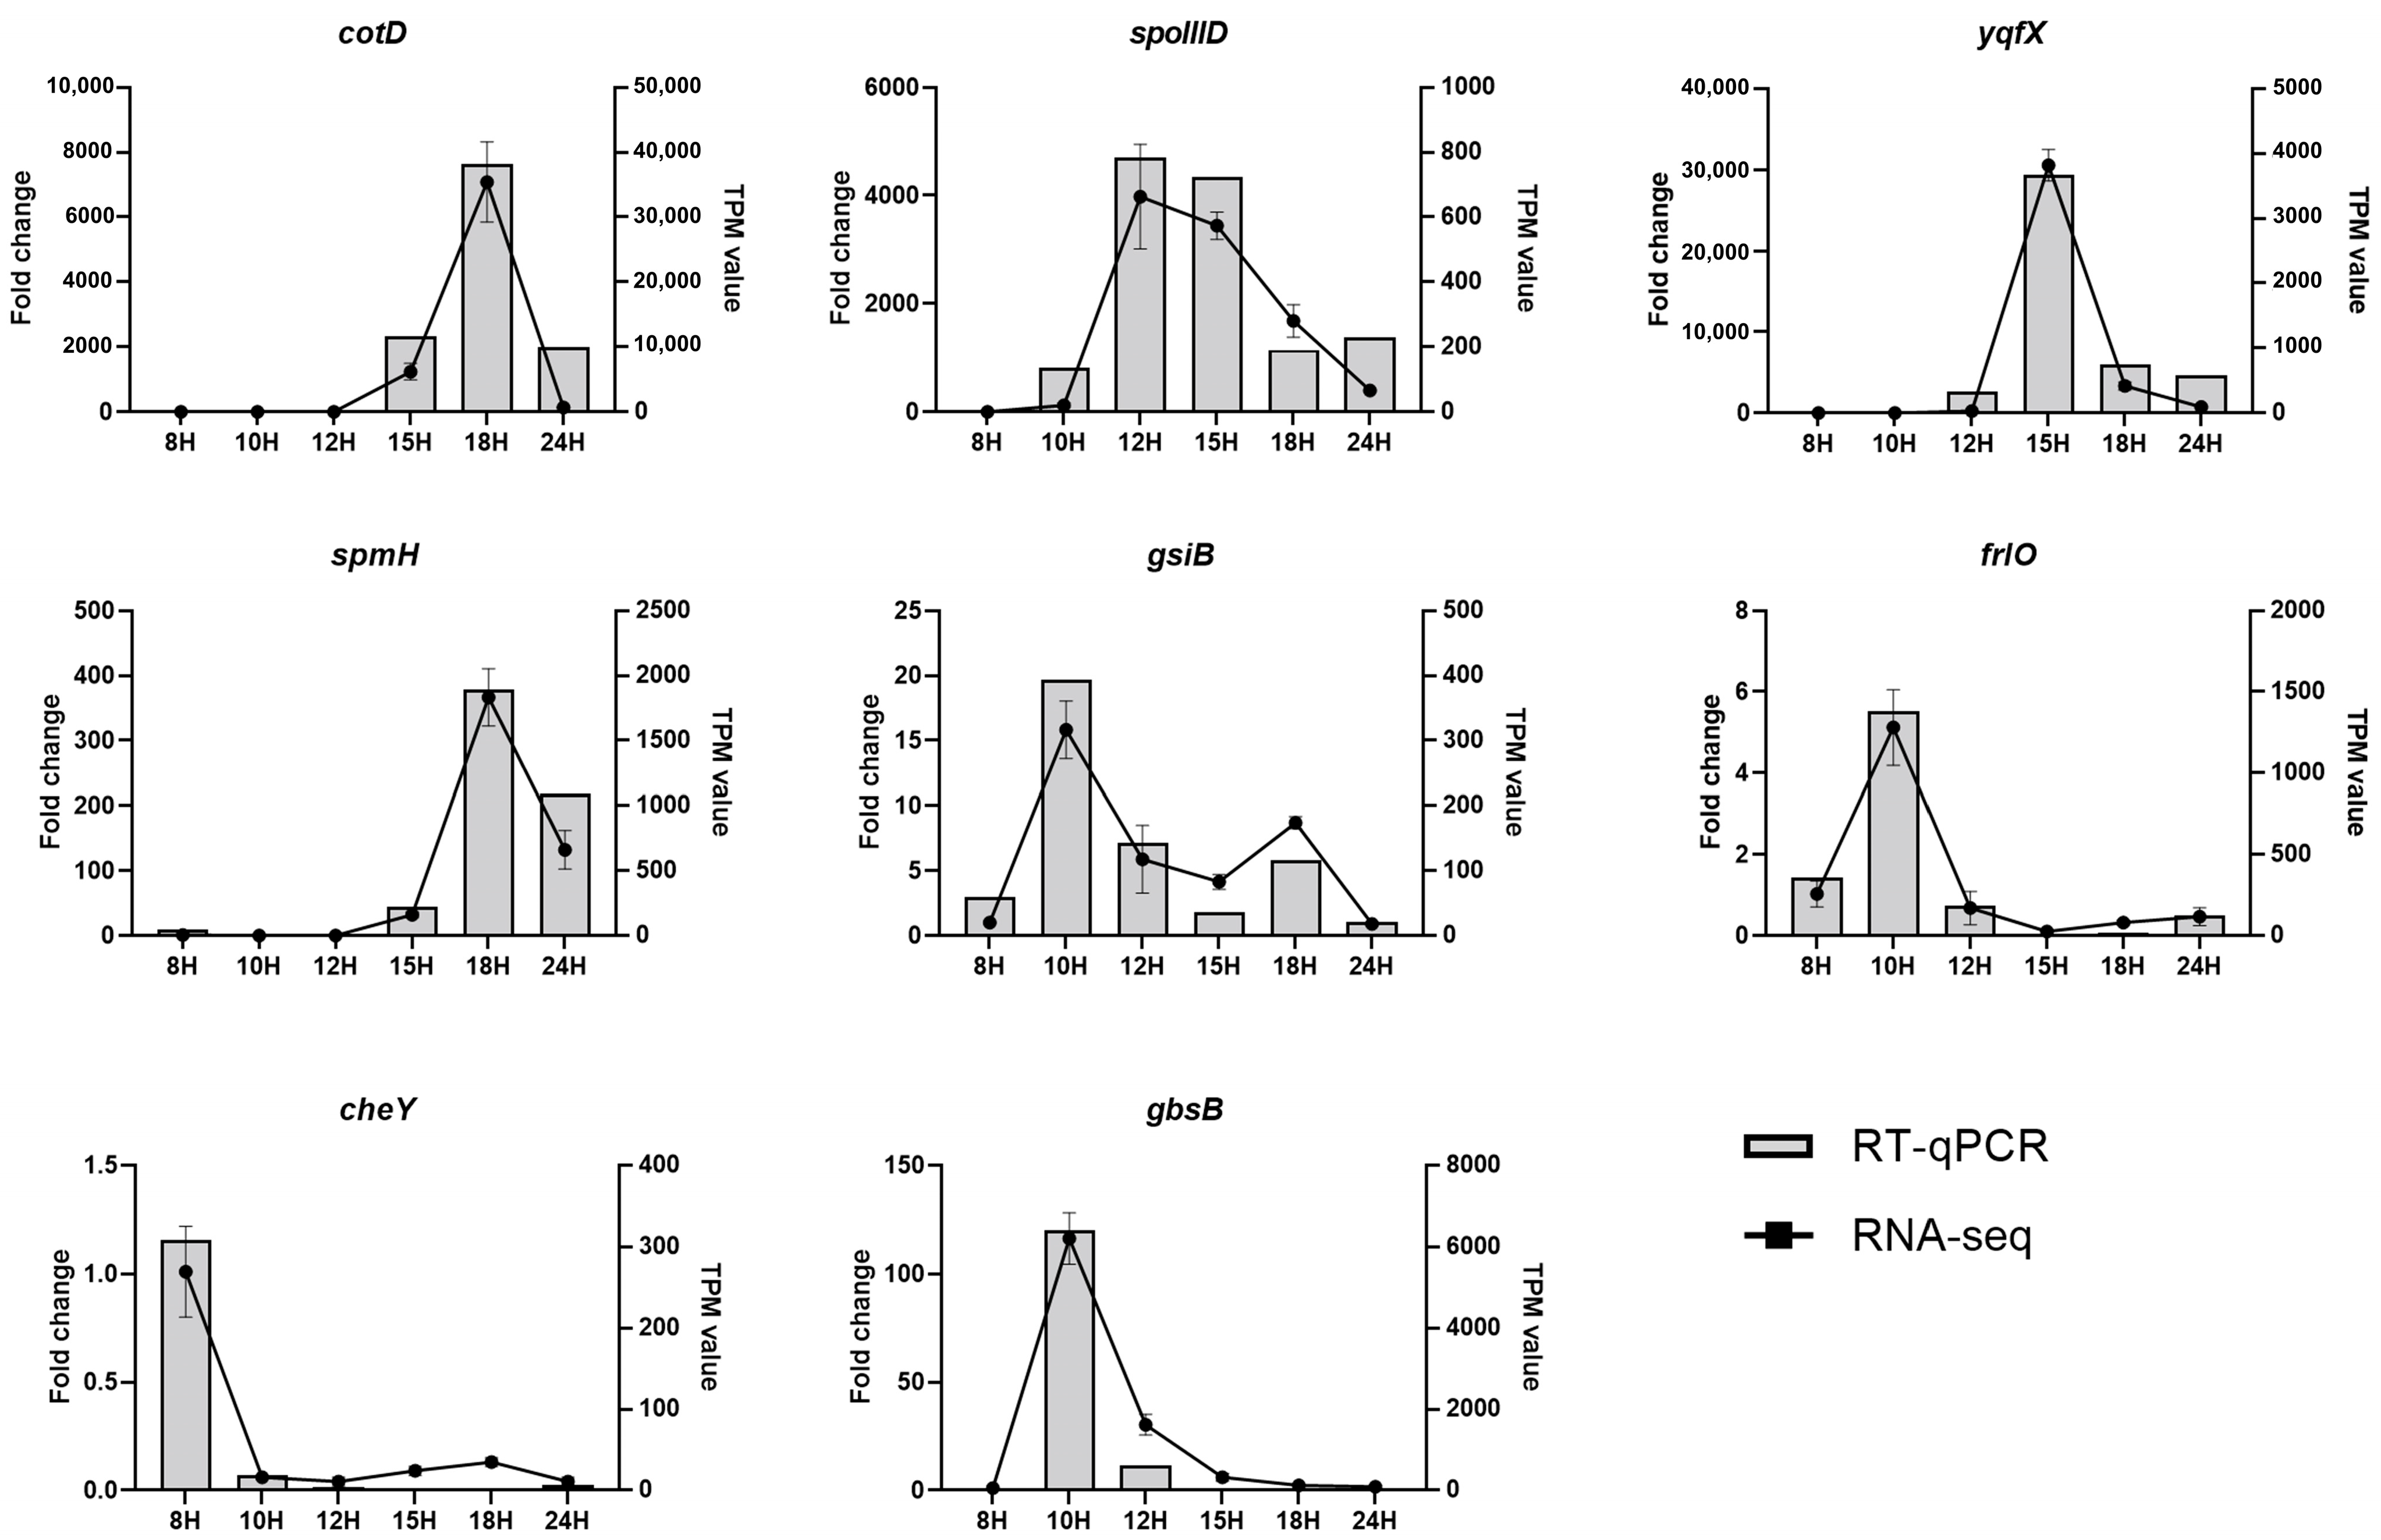
3.11. RNA-Seq Data Validation by RT-qPCR
4. Discussion
5. Conclusions
Supplementary Materials
Author Contributions
Funding
Data Availability Statement
Conflicts of Interest
References
- Terpe, K. Overview of bacterial expression systems for heterologous protein production: From molecular and biochemical fundamentals to commercial systems. Appl. Microbiol. Biotechnol. 2006, 72, 211–222. [Google Scholar] [CrossRef] [PubMed]
- EPA. Attachment I-Final Risk Assessment of Bacillus subtilis; United States Environmental Protection Agency: Washington, DC, USA, 1997. [Google Scholar]
- Kawamura, F.; Doi, R.H. Construction of a Bacillus subtilis double mutant deficient in extracellular alkaline and neutral proteases. J. Bacteriol. 1984, 160, 442–444. [Google Scholar] [CrossRef] [PubMed]
- Patten, C.; Kirchhof, M.; Schertzberg, M.; Morton, R.; Schellhorn, H. Microarray analysis of RpoS-mediated gene expression in Escherichia coli K-12. Mol. Genet. Genom. 2004, 272, 580–591. [Google Scholar] [CrossRef] [PubMed]
- Kitichalermkiat, A.; Katsuki, M.; Sato, J.; Sonoda, T.; Masuda, Y.; Honjoh, K.-I.; Miyamoto, T. Effect of epigallocatechin gallate on gene expression of Staphylococcus aureus. J. Glob. Antimicrob. Resist. 2020, 22, 854–859. [Google Scholar] [CrossRef] [PubMed]
- Yang, C.-K.; Tai, P.C.; Lu, C.-D. Time-related transcriptome analysis of B. subtilis 168 during growth with glucose. Curr. Microbiol. 2014, 68, 12–20. [Google Scholar] [CrossRef]
- Blom, E.-J.; Ridder, A.N.; Lulko, A.T.; Roerdink, J.B.; Kuipers, O.P. Time-resolved transcriptomics and bioinformatic analyses reveal intrinsic stress responses during batch culture of Bacillus subtilis. PLoS ONE 2011, 6, e27160. [Google Scholar] [CrossRef]
- Finotello, F.; Di Camillo, B. Measuring differential gene expression with RNA-seq: Challenges and strategies for data analysis. Brief. Funct. Genom. 2015, 14, 130–142. [Google Scholar] [CrossRef]
- Ozsolak, F.; Milos, P.M. RNA sequencing: Advances, challenges and opportunities. Nat. Rev. Genet. 2011, 12, 87–98. [Google Scholar] [CrossRef]
- Garalde, D.R.; Snell, E.A.; Jachimowicz, D.; Sipos, B.; Lloyd, J.H.; Bruce, M.; Pantic, N.; Admassu, T.; James, P.; Warland, A. Highly parallel direct RNA sequencing on an array of nanopores. Nat. Methods 2018, 15, 201–206. [Google Scholar] [CrossRef]
- Al Kadi, M.; Okuzaki, D. Unfolding the bacterial transcriptome landscape using oxford nanopore technology direct RNA sequencing. In Nanopore Sequencing: Methods and Protocols; Springer: New York, NY, USA, 2023; pp. 269–279. [Google Scholar]
- Fawcett, P.; Eichenberger, P.; Losick, R.; Youngman, P. The transcriptional profile of early to middle sporulation in Bacillus subtilis. Proc. Natl. Acad. Sci. USA 2000, 97, 8063–8068. [Google Scholar] [CrossRef]
- Swarge, B.; Abhyankar, W.; Jonker, M.; Hoefsloot, H.; Kramer, G.; Setlow, P.; Brul, S.; de Koning, L.J. Integrative analysis of proteome and transcriptome dynamics during Bacillus subtilis spore revival. mSphere 2020, 5, e00463-20. [Google Scholar] [CrossRef] [PubMed]
- Zhang, Q.; Cornilleau, C.; Muller, R.R.; Meier, D.; Flores, P.; Guerin, C.; Wolf, D.; Fromion, V.; Carballido-Lopez, R.; Mascher, T. Comprehensive and comparative transcriptional profiling of the cell wall stress response in Bacillus subtilis. bioRxiv 2023. [Google Scholar] [CrossRef]
- Nicolas, P.; Mäder, U.; Dervyn, E.; Rochat, T.; Leduc, A.; Pigeonneau, N.; Bidnenko, E.; Marchadier, E.; Hoebeke, M.; Aymerich, S. Condition-dependent transcriptome reveals high-level regulatory architecture in Bacillus subtilis. Science 2012, 335, 1103–1106. [Google Scholar] [CrossRef] [PubMed]
- Van Duy, N.; Mäder, U.; Tran, N.P.; Cavin, J.F.; Tam, L.T.; Albrecht, D.; Hecker, M.; Antelmann, H. The proteome and transcriptome analysis of Bacillus subtilis in response to salicylic acid. Proteomics 2007, 7, 698–710. [Google Scholar] [CrossRef] [PubMed]
- Hahne, H.; Mäder, U.; Otto, A.; Bonn, F.; Steil, L.; Bremer, E.; Hecker, M.; Becher, D. A comprehensive proteomics and transcriptomics analysis of Bacillus subtilis salt stress adaptation. J. Bacteriol. 2010, 192, 870–882. [Google Scholar] [CrossRef] [PubMed]
- Xu, S.; Cao, Q.; Liu, Z.; Chen, J.; Yan, P.; Li, B.; Xu, Y. Transcriptomic analysis reveals the role of tmRNA on biofilm formation in Bacillus subtilis. Microorganisms 2022, 10, 1338. [Google Scholar] [CrossRef] [PubMed]
- Sullivan, M.J.; Prince, D.; Goh, K.G.; Katupitiya, L.; Gosling, D.; Crowley, M.R.; Crossman, D.K.; Ulett, G.C. Dual RNA sequencing of group B Streptococcus-infected human monocytes reveals new insights into host–pathogen interactions and bacterial evasion of phagocytosis. Sci. Rep. 2023, 13, 2137. [Google Scholar] [CrossRef]
- Han, L.-L.; Shao, H.-H.; Liu, Y.-C.; Liu, G.; Xie, C.-Y.; Cheng, X.-J.; Wang, H.-Y.; Tan, X.-M.; Feng, H. Transcriptome profiling analysis reveals metabolic changes across various growth phases in Bacillus pumilus BA06. BMC Microbiol. 2017, 17, 156. [Google Scholar] [CrossRef]
- Villa-Rodríguez, E.; Ibarra-Gámez, C.; de Los Santos-Villalobos, S. Extraction of high-quality RNA from Bacillus subtilis with a lysozyme pre-treatment followed by the Trizol method. J. Microbiol. Methods 2018, 147, 14–16. [Google Scholar] [CrossRef]
- Verbeelen, T.; Van Houdt, R.; Leys, N.; Ganigué, R.; Mastroleo, F. Optimization of RNA extraction for bacterial whole transcriptome studies of low-biomass samples. iScience 2022, 25, 105311. [Google Scholar] [CrossRef]
- Livak, K.J.; Schmittgen, T.D. Analysis of relative gene expression data using real-time quantitative PCR and the 2−ΔΔCT method. Methods 2001, 25, 402–408. [Google Scholar] [CrossRef] [PubMed]
- Sierro, N.; Makita, Y.; de Hoon, M.; Nakai, K. DBTBS: A database of transcriptional regulation in Bacillus subtilis containing upstream intergenic conservation information. Nucleic Acids Res. 2008, 36, D93–D96. [Google Scholar] [CrossRef] [PubMed]
- Stragier, P.; Kunkel, B.; Kroos, L.; Losick, R. Chromosomal rearrangement generating a composite gene for a developmental transcription factor. Science 1989, 243, 507–512. [Google Scholar] [CrossRef]
- Strauch, M.A.; Hoch, J.A. Transition-state regulators: Sentinels of Bacillus subtilis post-exponential gene expression. Mol. Microbiol. 1993, 7, 337–342. [Google Scholar] [CrossRef] [PubMed]
- Funakoshi, H.; Yamada, A. Transition phenomena in bacterial growth between logarithmic and stationary phases. J. Math. Biol. 1980, 9, 369–387. [Google Scholar] [CrossRef]
- Chubukov, V.; Sauer, U. Environmental dependence of stationary-phase metabolism in Bacillus subtilis and Escherichia coli. Appl. Environ. Microbiol. 2014, 80, 2901–2909. [Google Scholar] [CrossRef]
- Strauch, M.A. Regulation of Bacillus subtilis gene expression during the transition from exponential growth to stationary phase. Prog. Nucleic Acid Res. Mol. Biol. 1993, 46, 121–153. [Google Scholar] [CrossRef]
- Garti-Levi, S.; Hazan, R.; Kain, J.; Fujita, M.; Ben-Yehuda, S. The FtsEX ABC transporter directs cellular differentiation in Bacillus subtilis. Mol. Microbiol. 2008, 69, 1018–1028. [Google Scholar] [CrossRef]
- Perego, M.; Higgins, C.; Pearce, S.; Gallagher, M.; Hoch, J. The oligopeptide transport system of Bacillus subtilis plays a role in the initiation of sporulation. Mol. Microbiol. 1991, 5, 173–185. [Google Scholar] [CrossRef]
- Koide, A.; Hoch, J.A. Identification of a second oligopeptide transport system in Bacillus subtilis and determination of its role in sporulation. Mol. Microbiol. 1994, 13, 417–426. [Google Scholar] [CrossRef]
- Kolter, R.; Siegele, D.A.; Tormo, A. The stationary phase of the bacterial life cycle. Annu. Rev. Microbiol. 1993, 47, 855–874. [Google Scholar] [CrossRef] [PubMed]
- Shorenstein, R.G.; Losick, R. Purification and properties of the sigma subunit of ribonucleic acid polymerase from vegetative Bacillus subtilis. J. Biol. Chem. 1973, 248, 6163–6169. [Google Scholar] [CrossRef] [PubMed]
- Gross, C.; Chan, C.; Dombroski, A.; Gruber, T.; Sharp, M.; Tupy, J.; Young, B. The functional and regulatory roles of sigma factors in transcription. Cold Spring Harb. Symp. Quant. Biol. 1998, 63, 141–156. [Google Scholar] [CrossRef] [PubMed]
- Kawamura, F.; Yamashita, S.; Kobayashi, Y.; Takahashi, H.; Saito, H.; Doi, R.H. Mapping of sporulation-deficient suppressor mutations for a catabolite-resistant sporulation (crsA) mutant of the major sigma-43 factor of Bacillus subtilis. J. Gen. Appl. Microbiol. 1989, 35, 43–51. [Google Scholar] [CrossRef]
- Price, C.W.; Doi, R.H. Genetic mapping of rpoD implicates the major sigma factor of Bacillus subtilis RNA polymerase in sporulation initiation. Mol. Gen. Genet. 1985, 201, 88–95. [Google Scholar] [CrossRef] [PubMed]
- Leelakriangsak, M.; Zuber, P. Transcription from the P3 promoter of the Bacillus subtilis spx gene is induced in response to disulfide stress. J. Bacteriol. 2007, 189, 1727–1735. [Google Scholar] [CrossRef]
- Gaballa, A.; Antelmann, H.; Hamilton, C.J.; Helmann, J.D. Regulation of Bacillus subtilis bacillithiol biosynthesis operons by Spx. Microbiology 2013, 159, 2025–2035. [Google Scholar] [CrossRef]
- Loewen, P.C.; Hengge-Aronis, R. The role of the sigma factor σS (KatF) in bacterial global regulation. Annu. Rev. Microbiol. 1994, 48, 53–80. [Google Scholar] [CrossRef]
- Paget, M.S.; Helmann, J.D. The σ70 family of sigma factors. Genome Biol. 2003, 4, 203. [Google Scholar] [CrossRef]
- Helmann, J.D.; Márquez, L.M.; Chamberlin, M.J. Cloning, sequencing, and disruption of the Bacillus subtilis σ28 gene. J. Bacteriol. 1988, 170, 1568–1574. [Google Scholar] [CrossRef]
- Blackman, S.A.; Smith, T.J.; Foster, S.J. The role of autolysins during vegetative growth of Bacillus subtilis 168. Microbiology 1998, 144, 73–82. [Google Scholar] [CrossRef] [PubMed]
- Fredrick, K.L.; Helmann, J.D. Dual chemotaxis signaling pathways in Bacillus subtilis: A σD-dependent gene encodes a novel protein with both CheW and CheY homologous domains. J. Bacteriol. 1994, 176, 2727–2735. [Google Scholar] [CrossRef] [PubMed][Green Version]
- Mukherjee, S.; Kearns, D.B. The structure and regulation of flagella in Bacillus subtilis. Annu. Rev. Genet. 2014, 48, 319–340. [Google Scholar] [CrossRef] [PubMed]
- Helmann, J.D. Deciphering a complex genetic regulatory network: The Bacillus subtilis σW protein and intrinsic resistance to antimicrobial compounds. Sci. Prog. 2006, 89, 243–266. [Google Scholar] [CrossRef] [PubMed]
- Kingston, A.W.; Subramanian, C.; Rock, C.O.; Helmann, J.D. A σW-dependent stress response in Bacillus subtilis that reduces membrane fluidity. Mol. Microbiol. 2011, 81, 69–79. [Google Scholar] [CrossRef] [PubMed]
- Rodríguez Ayala, F.; Bartolini, M.; Grau, R. The stress-responsive alternative sigma factor SigB of Bacillus subtilis and its relatives: An old friend with new functions. Front. Microbiol. 2020, 11, 1761. [Google Scholar] [CrossRef]
- Sung, H.-M.; Yasbin, R.E. Adaptive, or stationary-phase, mutagenesis, a component of bacterial differentiation in Bacillus subtilis. J. Bacteriol. 2002, 184, 5641–5653. [Google Scholar] [CrossRef]
- Roy, E.M.; Griffith, K.L. Characterization of a novel iron acquisition activity that coordinates the iron response with population density under iron-replete conditions in Bacillus subtilis. J. Bacteriol. 2017, 199, e00487-16. [Google Scholar] [CrossRef]
- Petersohn, A.; Brigulla, M.; Haas, S.; Hoheisel, J.D.; Völker, U.; Hecker, M. Global analysis of the general stress response of Bacillus subtilis. J. Bacteriol. 2001, 183, 5617–5631. [Google Scholar] [CrossRef]
- Popp, P.F.; Gumerov, V.M.; Andrianova, E.P.; Bewersdorf, L.; Mascher, T.; Zhulin, I.B.; Wolf, D. Phyletic distribution and diversification of the phage shock protein stress response system in bacteria and archaea. mSystems 2022, 7, e01348-21. [Google Scholar] [CrossRef]
- Sonenshein, A.L. Control of sporulation initiation in Bacillus subtilis. Curr. Opin. Microbiol. 2000, 3, 561–566. [Google Scholar] [CrossRef] [PubMed]
- Ryter, A.; Schaeffer, P.; Ionesco, H. Cytologic classification, by their blockage stage, of sporulation mutants of Bacillus subtilis Marburg. Ann. de L’institut Pasteur 1966, 110, 305–315. [Google Scholar]
- Piggot, P.; Coote, J. Genetic aspects of bacterial endospore formation. Bacteriol. Rev. 1976, 40, 908–962. [Google Scholar] [CrossRef] [PubMed]
- Diaz, A.R.; Core, L.J.; Jiang, M.; Morelli, M.; Chiang, C.H.; Szurmant, H.; Perego, M. Bacillus subtilis RapA phosphatase domain interaction with its substrate, phosphorylated Spo0F, and its inhibitor, the PhrA peptide. J. Bacteriol. 2012, 194, 1378–1388. [Google Scholar] [CrossRef] [PubMed]
- Ohlsen, K.L.; Grimsley, J.K.; Hoch, J.A. Deactivation of the sporulation transcription factor Spo0A by the Spo0E protein phosphatase. Proc. Natl. Acad. Sci. USA 1994, 91, 1756–1760. [Google Scholar] [CrossRef] [PubMed]
- Wu, L.J.; Errington, J. RacA and the Soj-Spo0J system combine to effect polar chromosome segregation in sporulating Bacillus subtilis. Mol. Microbiol. 2003, 49, 1463–1475. [Google Scholar] [CrossRef]
- Winterhalter, C.; Stevens, D.; Fenyk, S.; Pelliciari, S.; Marchand, E.; Soultanas, P.; Ilangovan, A.; Murray, H. SirA inhibits the essential DnaA: DnaD interaction to block helicase recruitment during Bacillus subtilis sporulation. Nucleic Acids Res. 2023, 51, 4302–4321. [Google Scholar] [CrossRef]
- Rowland, S.L.; Burkholder, W.F.; Cunningham, K.A.; Maciejewski, M.W.; Grossman, A.D.; King, G.F. Structure and mechanism of action of Sda, an inhibitor of the histidine kinases that regulate initiation of sporulation in Bacillus subtilis. Mol. Cell 2004, 13, 689–701. [Google Scholar] [CrossRef]
- Carniol, K.; Ben-Yehuda, S.; King, N.; Losick, R. Genetic dissection of the sporulation protein SpoIIE and its role in asymmetric division in Bacillus subtilis. J. Bacteriol. 2005, 187, 3511–3520. [Google Scholar] [CrossRef]
- Perez, A.R.; Abanes-De Mello, A.; Pogliano, K. SpoIIB localizes to active sites of septal biogenesis and spatially regulates septal thinning during engulfment in Bacillus subtilis. J. Bacteriol. 2000, 182, 1096–1108. [Google Scholar] [CrossRef]
- Peters, H., 3rd; Haldenwang, W.G. Synthesis and fractionation properties of SpoIIGA, a protein essential for pro-sigma E processing in Bacillus subtilis. J. Bacteriol. 1991, 173, 7821–7827. [Google Scholar] [CrossRef] [PubMed][Green Version]
- Gutierrez, J.; Smith, R.; Pogliano, K. SpoIID-mediated peptidoglycan degradation is required throughout engulfment during Bacillus subtilis sporulation. J. Bacteriol. 2010, 192, 3174–3186. [Google Scholar] [CrossRef] [PubMed][Green Version]
- Abanes-De Mello, A. The Roles of SpoIID, SpoIIM, and SpoIIP in Septal Thinning and Membrane Migration during Bacillus subtilis Engulfment; University of California: San Diego, CA, USA, 2003. [Google Scholar]
- Doan, T.; Morlot, C.; Meisner, J.; Serrano, M.; Henriques, A.O.; Moran, C.P., Jr.; Rudner, D.Z. Novel secretion apparatus maintains spore integrity and developmental gene expression in Bacillus subtilis. PLoS Genet. 2009, 5, e1000566. [Google Scholar] [CrossRef]
- McKenney, P.T.; Driks, A.; Eichenberger, P. The Bacillus subtilis endospore: Assembly and functions of the multilayered coat. Nat. Rev. Microbiol. 2013, 11, 33–44. [Google Scholar] [CrossRef] [PubMed]
- Debarbouille, M.; Martin-Verstraete, I.; Kunst, F.; Rapoport, G. The Bacillus subtilis sigL gene encodes an equivalent of sigma 54 from gram-negative bacteria. Proc. Natl. Acad. Sci. USA 1991, 88, 9092–9096. [Google Scholar] [CrossRef]
- Zhang, X.; Yang, T.-W.; Lin, Q.; Xu, M.-J.; Xia, H.-F.; Xu, Z.-H.; Li, H.-Z.; Rao, Z.-M. Isolation and identification of an acetoin high production bacterium that can reverse transform 2, 3-butanediol to acetoin at the decline phase of fermentation. World J. Microbiol. Biotechnol. 2011, 27, 2785–2790. [Google Scholar] [CrossRef]
- Wang, J.; Mei, H.; Zheng, C.; Qian, H.; Cui, C.; Fu, Y.; Su, J.; Liu, Z.; Yu, Z.; He, J. The metabolic regulation of sporulation and parasporal crystal formation in Bacillus thuringiensis revealed by transcriptomics and proteomics. Mol. Cell. Proteom. 2013, 12, 1363–1376. [Google Scholar] [CrossRef]
- Ould Ali, N.; Bignon, J.; Rapoport, G.; Debarbouille, M. Regulation of the acetoin catabolic pathway is controlled by sigma L in Bacillus subtilis. J. Bacteriol. 2001, 183, 2497–2504. [Google Scholar] [CrossRef]
- Engelberg-Kulka, H.; Amitai, S.; Kolodkin-Gal, I.; Hazan, R. Bacterial programmed cell death and multicellular behavior in bacteria. PLoS Genet. 2006, 2, e135. [Google Scholar] [CrossRef]
- González-Pastor, J.E.; Hobbs, E.C.; Losick, R. Cannibalism by sporulating bacteria. Science 2003, 301, 510–513. [Google Scholar] [CrossRef]
- Fujita, M.; González-Pastor, J.E.; Losick, R. High-and low-threshold genes in the Spo0A regulon of Bacillus subtilis. J. Bacteriol. 2005, 187, 1357–1368. [Google Scholar] [CrossRef] [PubMed]
- Hobbs, E.C. Control of Cannibalism in Bacillus subtilis; Harvard University: Cambridge, MA, USA, 2006. [Google Scholar]


| Gene | Description | 8 h | 10 h | 12 h | 15 h | 18 h | 24 h | Total |
|---|---|---|---|---|---|---|---|---|
| cotX | spore coat protein (insoluble fraction) | 290 | 62 | 72 | 21,516 | 75,558 | 18,170 | 115,668 |
| sspE | small acid-soluble spore protein (gamma-type SASP) | 140 | 382 | 17,439 | 68,242 | 10,155 | 17,838 | 114,196 |
| yczN | putative spore and germination protein | 590 | 673 | 851 | 685 | 11,545 | 97,628 | 111,972 |
| gerE | transcriptional regulator of late spore coat genes | 382 | 149 | 123 | 17,071 | 50,095 | 32,767 | 100,587 |
| cotY | outer spore coat protein (crust layer, insoluble fraction) | 8 | 78 | 236 | 21,147 | 65,667 | 10,293 | 97,429 |
| cotZ | spore coat protein (insoluble fraction, crust layer) | 9 | 135 | 364 | 19,373 | 55,345 | 8361 | 83,588 |
| sdpC | precursor of killing factor SdpC | 15,175 | 32,303 | 13,413 | 2336 | 980 | 6666 | 70,873 |
| skfA | sporulation killing factor A | 3653 | 16,990 | 37,157 | 6531 | 2708 | 3054 | 70,093 |
| cotV | spore coat protein (insoluble fraction) | 254 | 44 | 35 | 9404 | 38,992 | 17,226 | 65,956 |
| cgeB | maturation of the outermost layer of the spore | 349 | 122 | 78 | 4675 | 22,332 | 35,830 | 63,386 |
| cgeA | spore outermost layer component | 319 | 151 | 108 | 3299 | 17,995 | 41,382 | 63,254 |
| cotD | spore coat protein (inner) | 112 | 39 | 54 | 11,744 | 38,217 | 10,030 | 60,197 |
| yczM | putative type I toxin | 314 | 482 | 240 | 486 | 7142 | 49,157 | 57,820 |
| sspB | small acid-soluble spore protein (beta-type SASP) | 3 | 84 | 8082 | 35,591 | 2720 | 4286 | 50,766 |
| safA | morphogenetic protein associated with SpoVID | 6 | 5516 | 18,998 | 17,402 | 3633 | 4705 | 50,260 |
| Gene | Description | Pairwise Time | Fold Change | p-Value | Adj. p-Value a |
|---|---|---|---|---|---|
| cotD | spore coat protein (inner) | 15 h/12 h | 308.74 | 2.28 × 10−43 | 4.45 × 10−40 |
| spoIIID | transcriptional regulator (stage III sporulation) | 10 h/8 h | 257.78 | 2.07 × 10−38 | 8.08 × 10⁻³⁵ |
| yqfX | conserved protein of unknown function expressed in germinating spores | 12 h/10 h | 236.64 | 1.16 × 10⁻²⁵ | 1.13 × 10⁻²² |
| spmH | glucose-1-phosphate cytidylyltransferase (sporulation) | 15 h/12 h | 223.84 | 1.08 × 10⁻³² | 3.84 × 10⁻³⁰ |
| yhdB | conserved hypothetical protein | 12 h/10 h | 217.38 | 1.10 × 10⁻¹⁸ | 3.92 × 10⁻¹⁶ |
| ypzD | putative germination protein | 15 h/12 h | 210.05 | 1.35 × 10⁻³¹ | 4.41 × 10⁻²⁹ |
| cotNE | inner spore coat protein | 12 h/10 h | 203.64 | 4.51 × 10⁻¹¹ | 2.75 × 10⁻⁹ |
| yurS | conserved protein of unknown function | 15 h/12 h | 175.04 | 2.15 × 10⁻²⁴ | 4.41 × 10⁻²² |
| cotG | spore morphogenetic protein | 15 h/12 h | 172.24 | 5.10 × 10−45 | 1.99 × 10−41 |
| sppO | spore protein cse15 | 10 h/8 h | 166.91 | 9.57 × 10⁻²⁰ | 1.97 × 10⁻¹⁷ |
| gsiB | general stress protein glucose starvation induced | 15 h/12 h | −16.30 | 1.02 × 10⁻⁹ | 3.60 × 10⁻⁸ |
| frlO | fructose amino acid-binding lipoprotein | 12 h/10 h | −16.78 | 2.48 × 10⁻¹⁰ | 1.31 × 10⁻⁸ |
| cheY | regulator of chemotaxis and motility | 10 h/8 h | −17.47 | 2.11 × 10⁻¹⁰ | 4.17 × 10⁻⁹ |
| gbsB | choline dehydrogenase | 12 h/10 h | −20.41 | 2.69 × 10⁻⁵ | 2.07 × 10⁻⁴ |
| frlN | fructose-amino acid permease | 12 h/10 h | −20.81 | 2.75 × 10⁻¹¹ | 1.76 × 10⁻⁹ |
| frlM | fructose-amino acid permease | 12 h/10 h | −25.96 | 1.06 × 10⁻¹² | 9.63 × 10⁻¹¹ |
| gbsA | glycine betaine aldehyde dehydrogenase, NAD+-dependent | 12 h/10 h | −36.86 | 3.30 × 10⁻⁷ | 5.59 × 10⁻⁶ |
| gabT | 4-aminobutyrate aminotransferase | 10 h/8 h | −39.08 | 3.16 × 10⁻¹⁸ | 3.75 × 10⁻¹⁶ |
| xpt | xanthine phosphoribosyltransferase | 10 h/8 h | −48.69 | 2.65 × 10⁻¹⁸ | 3.30 × 10⁻¹⁶ |
| pbuX | xanthine permease | 10 h/8 h | −88.52 | 1.81 × 10⁻¹⁹ | 3.07 × 10⁻¹⁷ |
| Pathway ID | KEGG Pathway | 10 h/8 h | 12 h/10 h | 15 h/12 h | 18 h/15 h | 24 h/18 h |
|---|---|---|---|---|---|---|
| Up-regulated | ||||||
| bsu01100 | Metabolic pathways | 111 | 120 | 87 | 39 | 0 |
| bsu01110 | Biosynthesis of secondary metabolites | 49 | 53 | 41 | 21 | 0 |
| bsu01120 | Microbial metabolism in diverse environments | 31 | 36 | 29 | 0 | 0 |
| bsu00500 | Starch and sucrose metabolism | 11 | 15 | 11 | 7 | 0 |
| bsu01250 | Biosynthesis of nucleotide sugars | 8 | 10 | 7 | 8 | 0 |
| bsu01230 | Biosynthesis of amino acids | 8 | 10 | 7 | 8 | 0 |
| bsu00541 | O-Antigen nucleotide sugar biosynthesis | 0 | 0 | 20 | 0 | 11 |
| bsu02010 | ABC transporters | 0 | 0 | 0 | 11 | 10 |
| bsu00520 | Amino sugar and nucleotide sugar metabolism | 0 | 12 | 9 | 0 | 0 |
| bsu00650 | Butanoate metabolism | 8 | 10 | 0 | 0 | 0 |
| Down-regulated | ||||||
| bsu01100 | Metabolic pathways | 0 | 0 | 73 | 61 | 25 |
| bsu01120 | Microbial metabolism in diverse environments | 38 | 34 | 0 | 23 | 10 |
| bsu02040 | Flagellar assembly | 31 | 22 | 0 | 0 | 0 |
| bsu02010 | ABC transporters | 26 | 26 | 0 | 0 | 0 |
| bsu02030 | Bacterial chemotaxis | 31 | 11 | 0 | 0 | 0 |
| bsu01230 | Biosynthesis of amino acids | 0 | 29 | 0 | 0 | 0 |
| bsu02020 | Two-component system | 28 | 0 | 0 | 0 | 0 |
| bsu00230 | Purine metabolism | 17 | 0 | 10 | 0 | 0 |
| bsu00650 | Butanoate metabolism | 7 | 6 | 6 | 0 | 0 |
| bsu00020 | Citrate cycle (TCA cycle) | 8 | 10 | 0 | 0 | 0 |
| Gene | Description | 8 h | 10 h | 12 h | 15 h | 18 h | 24 h |
|---|---|---|---|---|---|---|---|
| sigA | RNA polymerase major sigma-43 factor (sigma-A) | 984 | 863 | 1747 | 757 | 459 | 593 |
| sigB | RNA polymerase sigma-37 factor (sigma-B) | 383 | 618 | 317 | 105 | 120 | 120 |
| sigD | RNA polymerase sigma-28 factor (sigma-D) | 352 | 33 | 7 | 3 | 2 | 10 |
| sigE | RNA polymerase sporulation-specific sigma-29 factor (sigma-E) | 95 | 565 | 275 | 49 | 21 | 62 |
| sigF | RNA polymerase sporulation-specific sigma factor (sigma-F) | 2015 | 8531 | 6968 | 1215 | 741 | 873 |
| sigG | RNA polymerase sporulation-specific sigma factor (sigma-G) | 152 | 1073 | 1159 | 1444 | 140 | 287 |
| sigI | RNA polymerase sigma factor (heat stress responsive) | 8 | 10 | 10 | 6 | 4 | 17 |
| sigKc | RNA polymerase sporulation-specific sigma-K factor precursor (C-terminal fragment) | 1 | 5 | 112 | 426 | 71 | 66 |
| sigKn | RNA polymerase sporulation-specific sigma-K factor precursor (N-terminal half) | 9 | 37 | 231 | 538 | 87 | 102 |
| sigL | RNA polymerase sigma-54 factor (sigma-L) | 198 | 238 | 156 | 97 | 39 | 124 |
| sigM | RNA polymerase ECF (extracytoplasmic function)-type sigma factor (sigma-M) | 19 | 17 | 17 | 8 | 4 | 20 |
| sigX | RNA polymerase ECF (extracytoplasmic function)-type sigma factor (sigma-X) | 35 | 42 | 22 | 22 | 15 | 40 |
| sigW | RNA polymerase ECF (extracytoplasmic function)-type sigma factor (sigma-W) | 1304 | 1211 | 1100 | 254 | 150 | 437 |
| sigY | RNA polymerase ECF (extracytoplasmic function)-type sigma factor (sigma Y) | 8 | 14 | 16 | 9 | 8 | 18 |
| ylaA | conserved protein of unknown function | 0 | 0 | 1 | 0 | 0 | 1 |
Disclaimer/Publisher’s Note: The statements, opinions and data contained in all publications are solely those of the individual author(s) and contributor(s) and not of MDPI and/or the editor(s). MDPI and/or the editor(s) disclaim responsibility for any injury to people or property resulting from any ideas, methods, instructions or products referred to in the content. |
© 2023 by the authors. Licensee MDPI, Basel, Switzerland. This article is an open access article distributed under the terms and conditions of the Creative Commons Attribution (CC BY) license (https://creativecommons.org/licenses/by/4.0/).
Share and Cite
Jun, J.-S.; Jeong, H.-E.; Moon, S.-Y.; Shin, S.-H.; Hong, K.-W. Time-Course Transcriptome Analysis of Bacillus subtilis DB104 during Growth. Microorganisms 2023, 11, 1928. https://doi.org/10.3390/microorganisms11081928
Jun J-S, Jeong H-E, Moon S-Y, Shin S-H, Hong K-W. Time-Course Transcriptome Analysis of Bacillus subtilis DB104 during Growth. Microorganisms. 2023; 11(8):1928. https://doi.org/10.3390/microorganisms11081928
Chicago/Turabian StyleJun, Ji-Su, Hyang-Eun Jeong, Su-Yeong Moon, Se-Hee Shin, and Kwang-Won Hong. 2023. "Time-Course Transcriptome Analysis of Bacillus subtilis DB104 during Growth" Microorganisms 11, no. 8: 1928. https://doi.org/10.3390/microorganisms11081928
APA StyleJun, J.-S., Jeong, H.-E., Moon, S.-Y., Shin, S.-H., & Hong, K.-W. (2023). Time-Course Transcriptome Analysis of Bacillus subtilis DB104 during Growth. Microorganisms, 11(8), 1928. https://doi.org/10.3390/microorganisms11081928