

Study of a First Approach to the Controlled Fermentation for Lambic Beer Production


Abstract
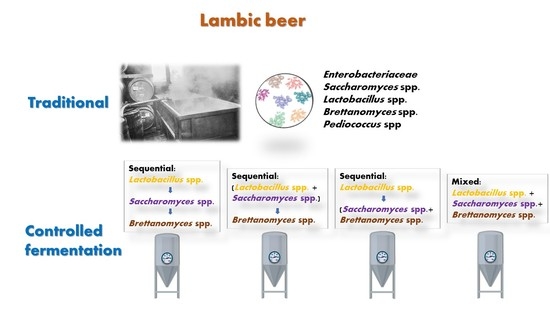
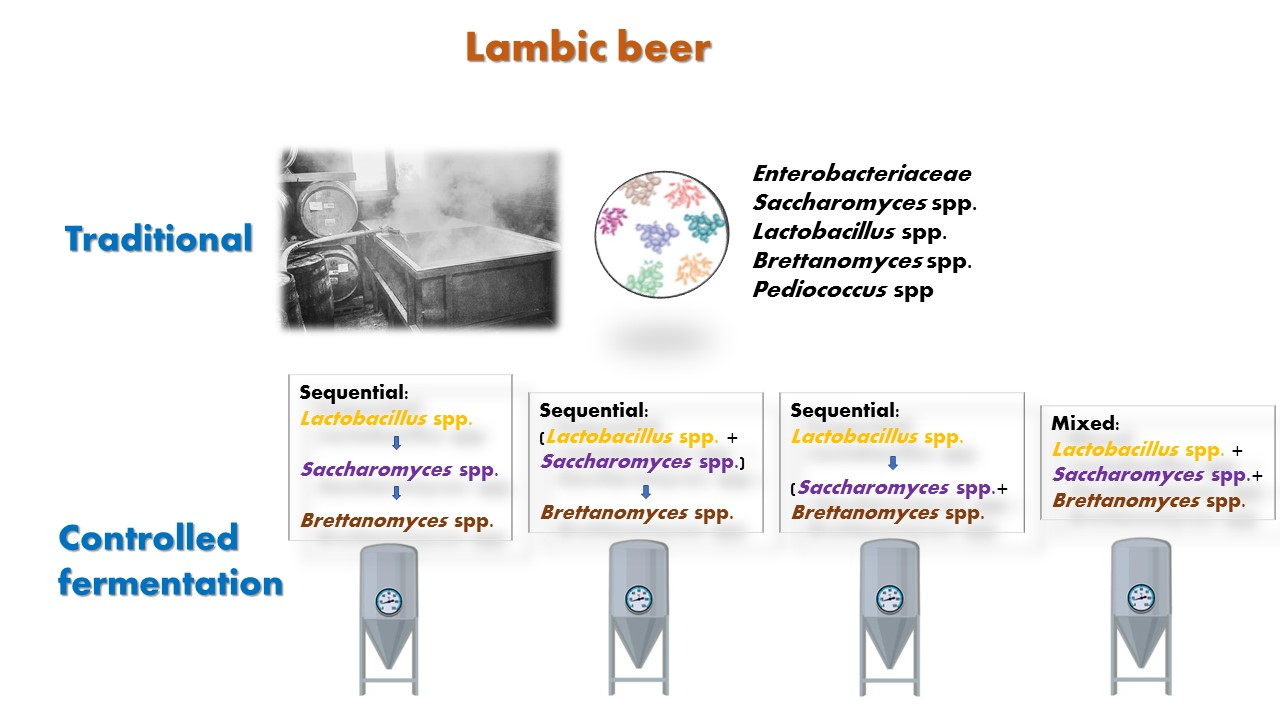
1. Introduction
2. Materials and Methods
2.1. Yeast Strains and Bacteria
2.2. Brettanomyces Yeast Preselection
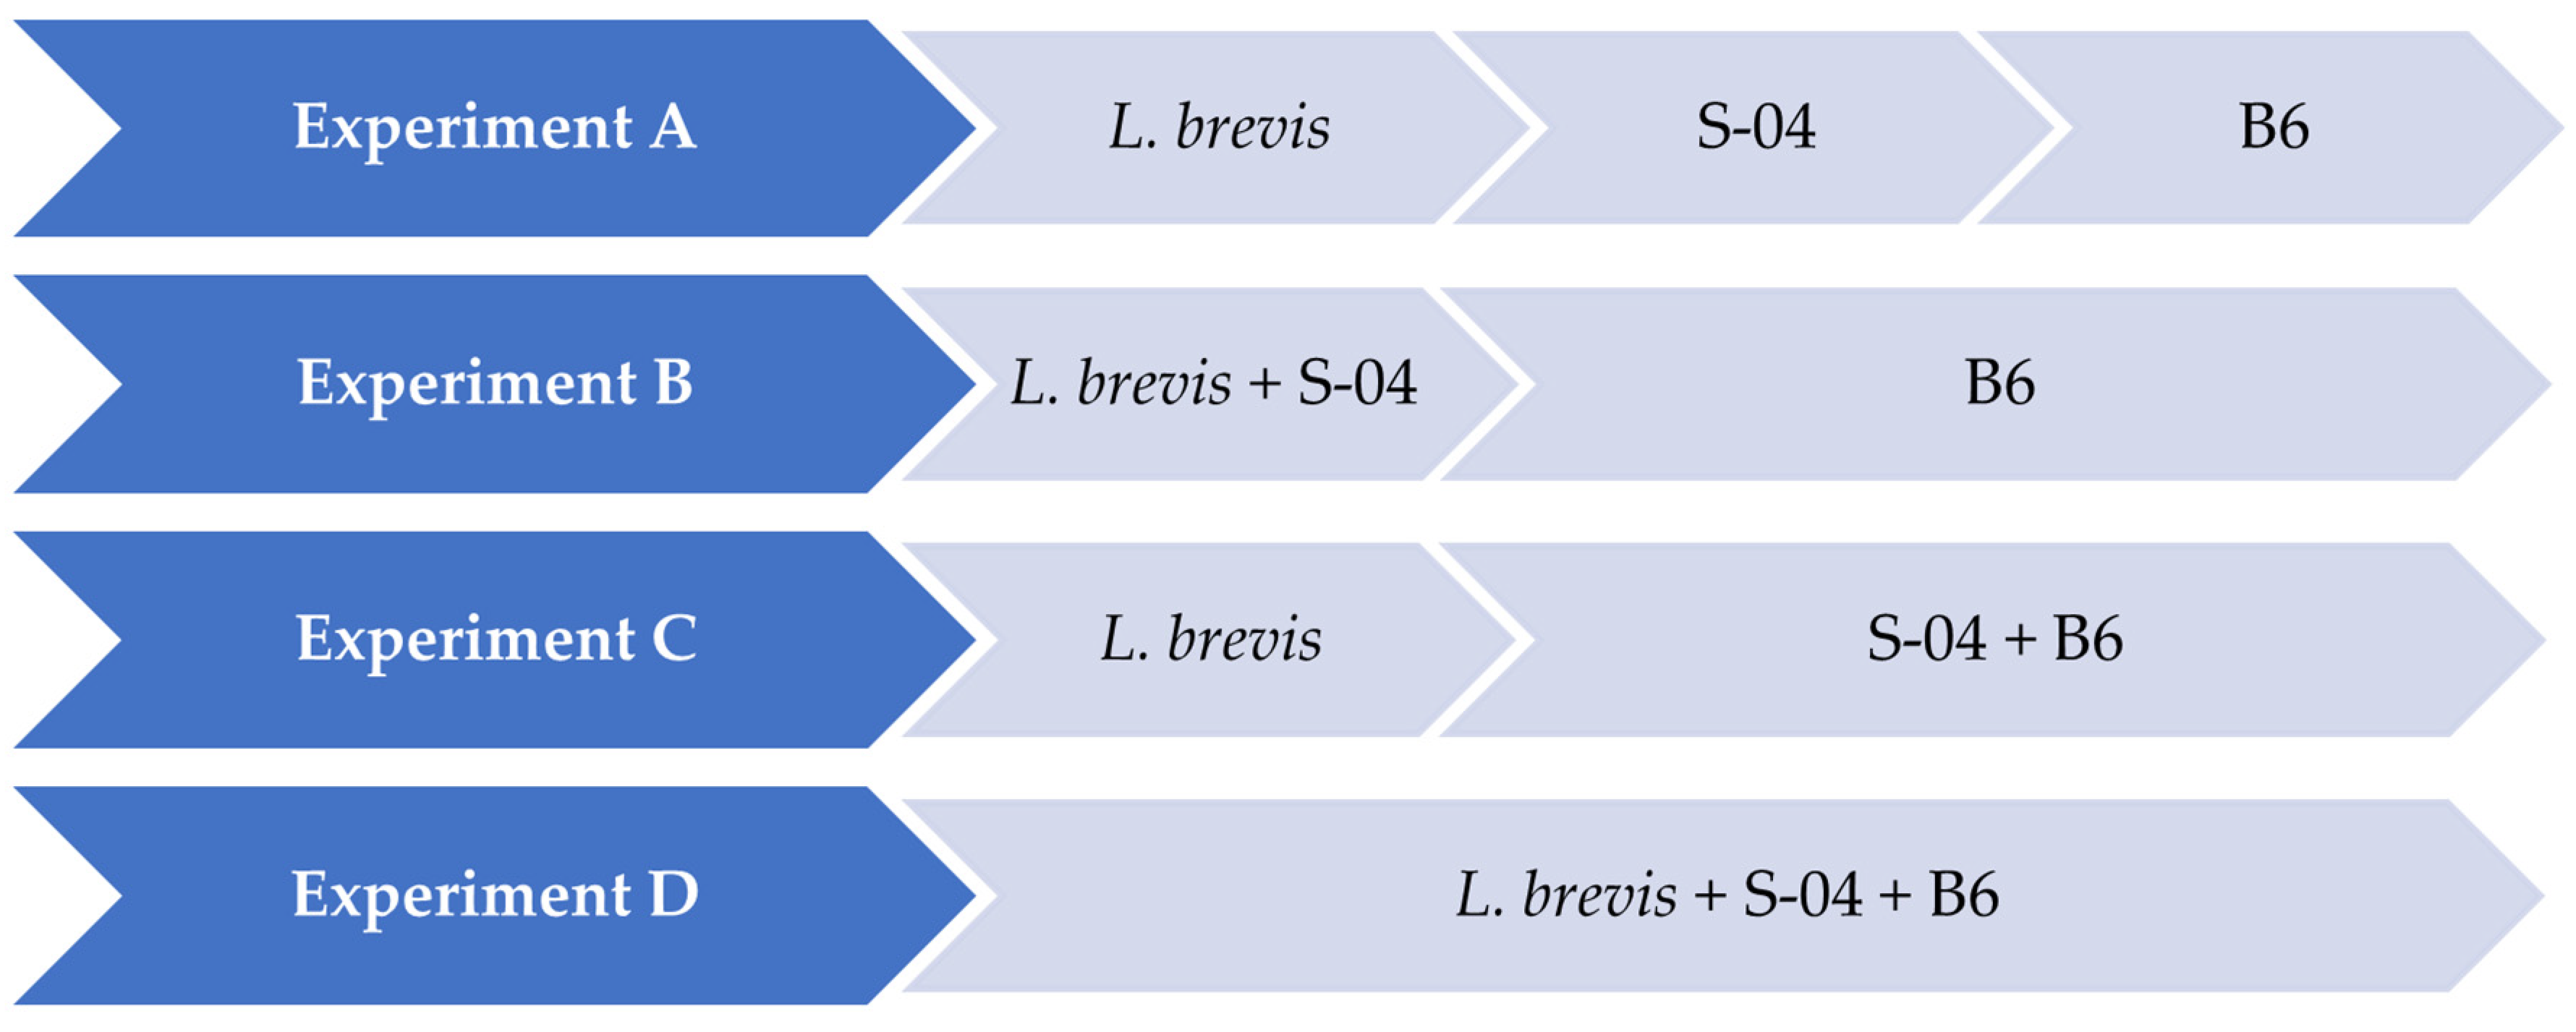
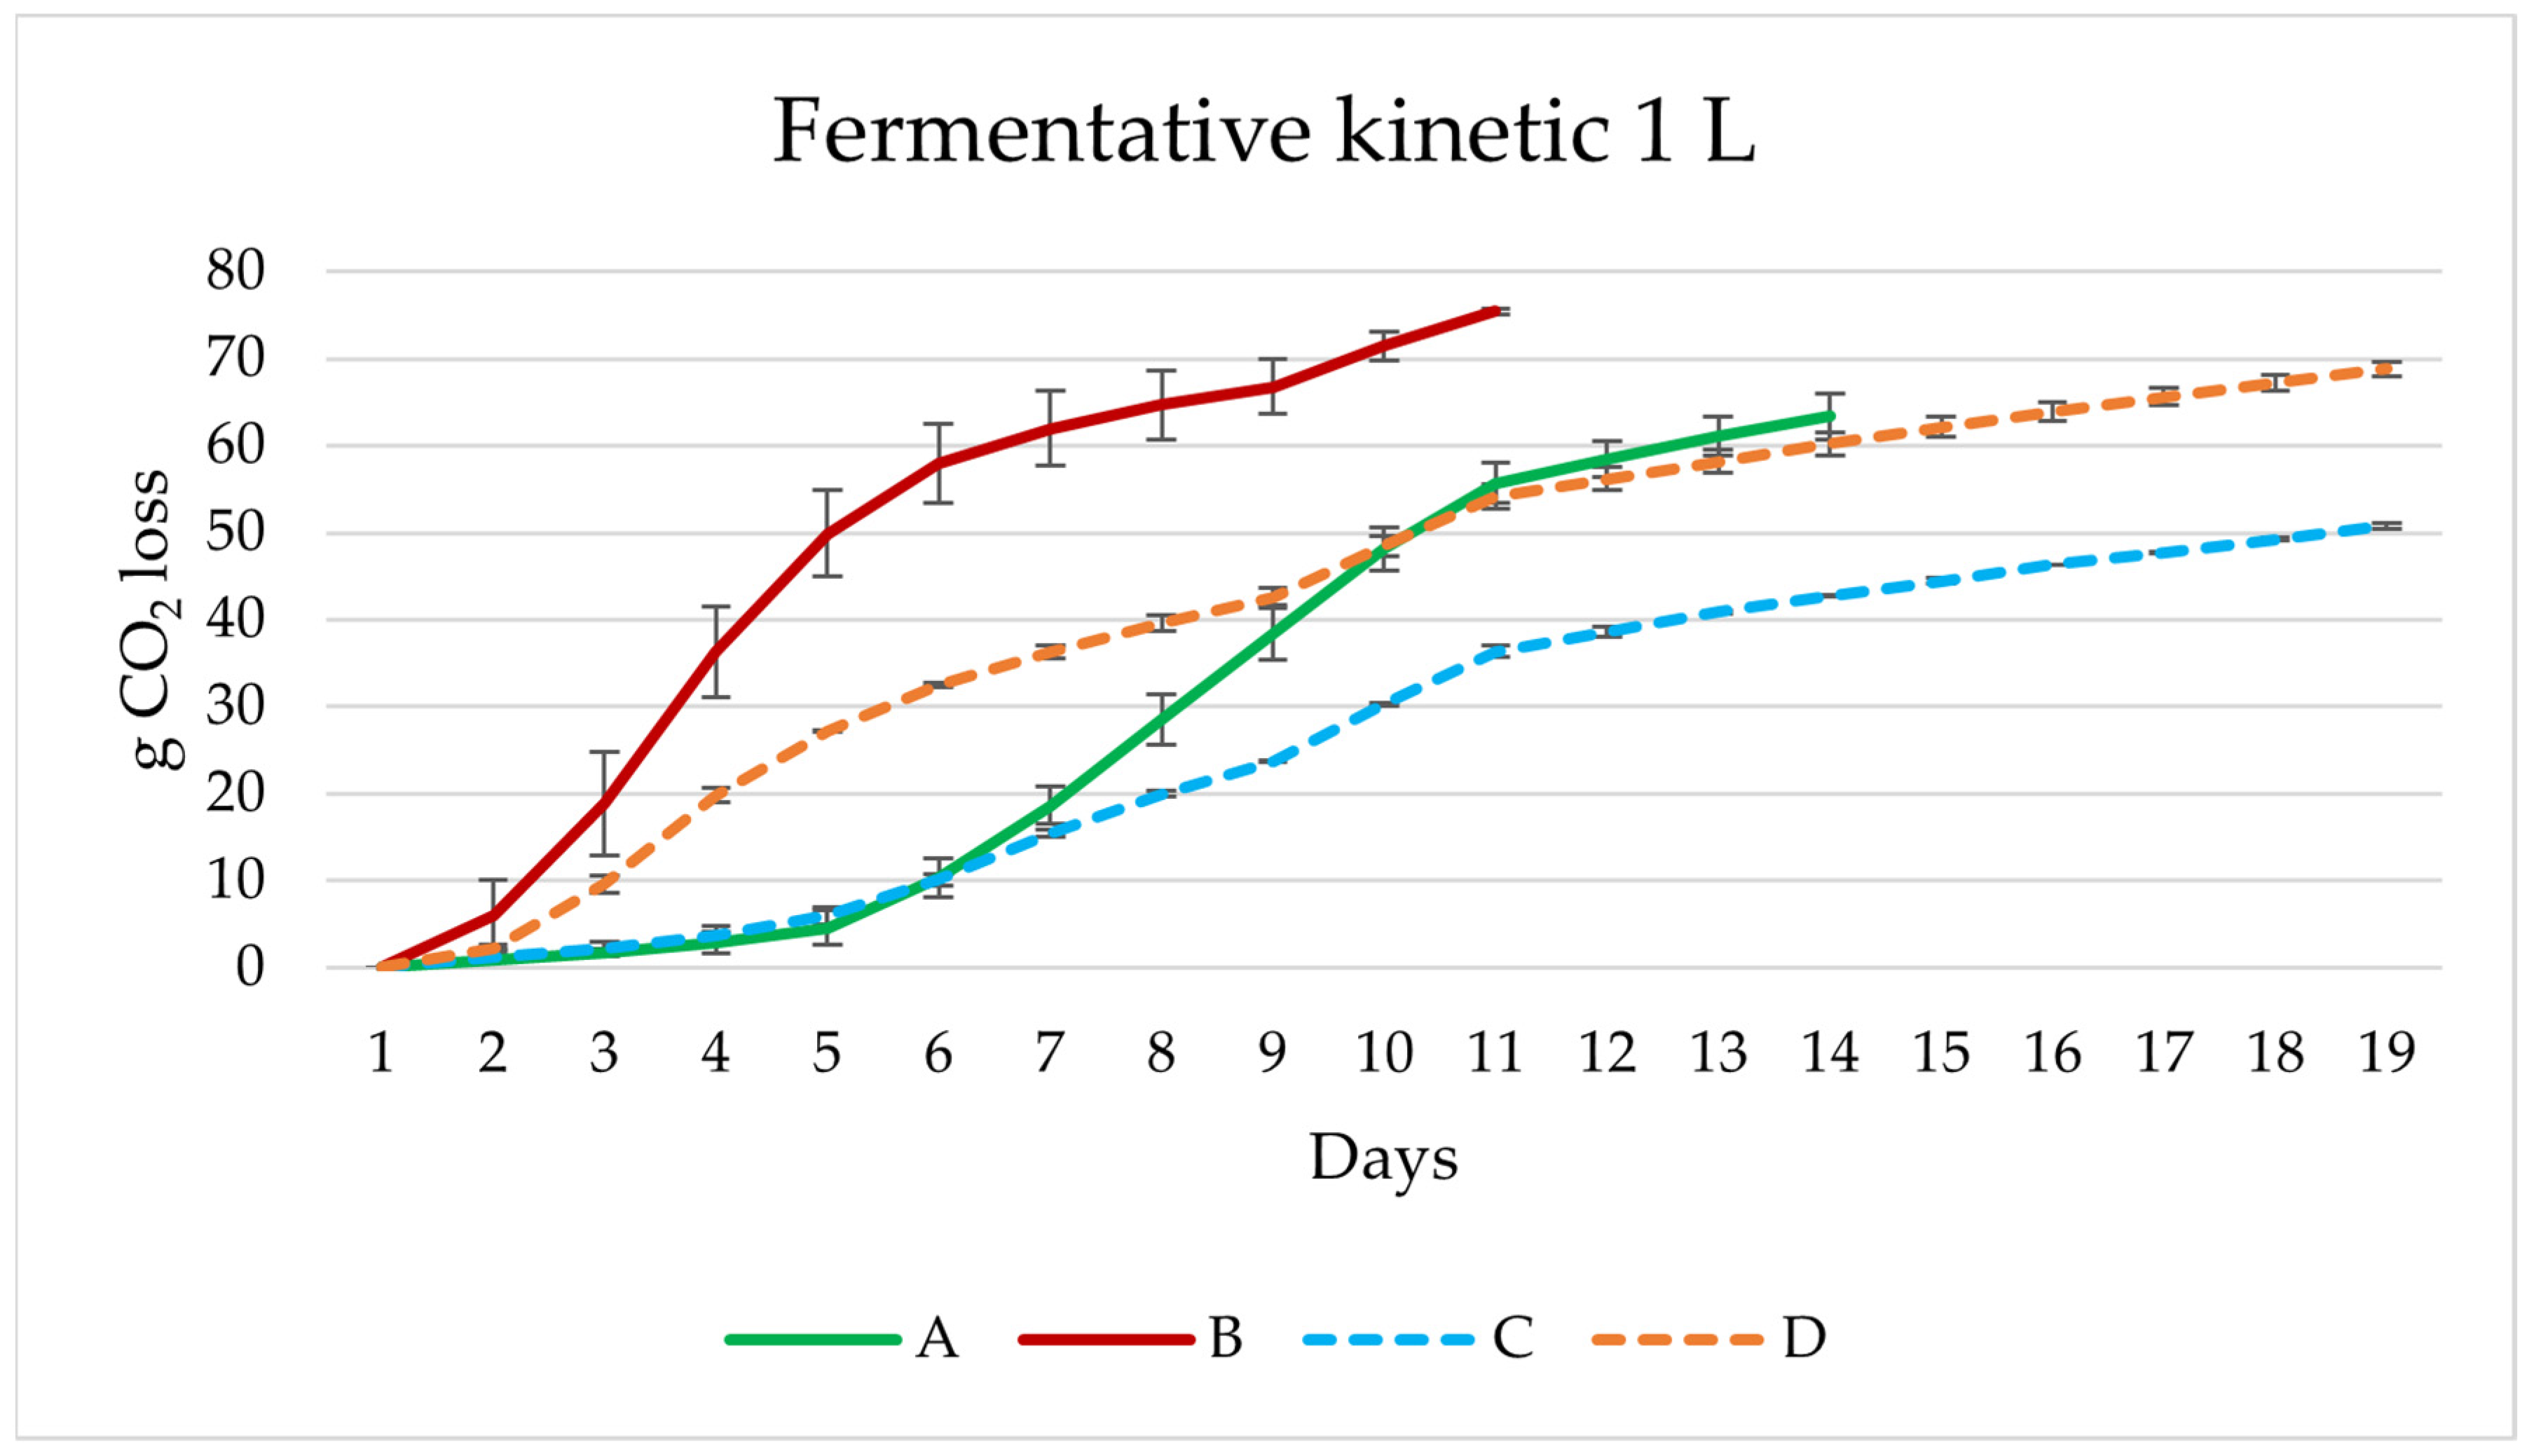
2.3. Experiments Performed in 1 L
- Experiment A (sequential fermentation): Lactobacillus brevis + S-04 + B6. Fermentation was performed sequentially, with the bacteria L. brevis being inoculated first, after three days the yeast strain Saccharomyces S-04 was inoculated and finally after four days, when fermentation activity was starting to decrease, the Brettanomyces bruxellensis B6 strain was added.
- Experiment B: (Lactobacillus brevis + S-04) + B6. First, the Saccharomyces yeast was inoculated together with the lactic acid bacteria. After three days the B. bruxellensis ((RS17/CR028) strain was inoculated.
- Experiment C: Lactobacillus brevis + (S-04 + B6). First, the L. brevis bacteria was added. After three days of fermentation, the S-04 strain and B. bruxellensis strain were inoculated.
- Experiment D (mixed fermentation): Lactobacillus brevis + S-04 + B6. The microorganisms were inoculated at the same time.
2.4. Fermentation in 14 L
2.5. Beer Analysis
2.6. Aromatic Compounds
2.7. Melatonin Production
2.8. Antioxidant Capacity
2.9. Sensory Analysis
2.10. Statistical Analysis
3. Results and Discussion
3.1. Brettanomyces Yeast Preselection
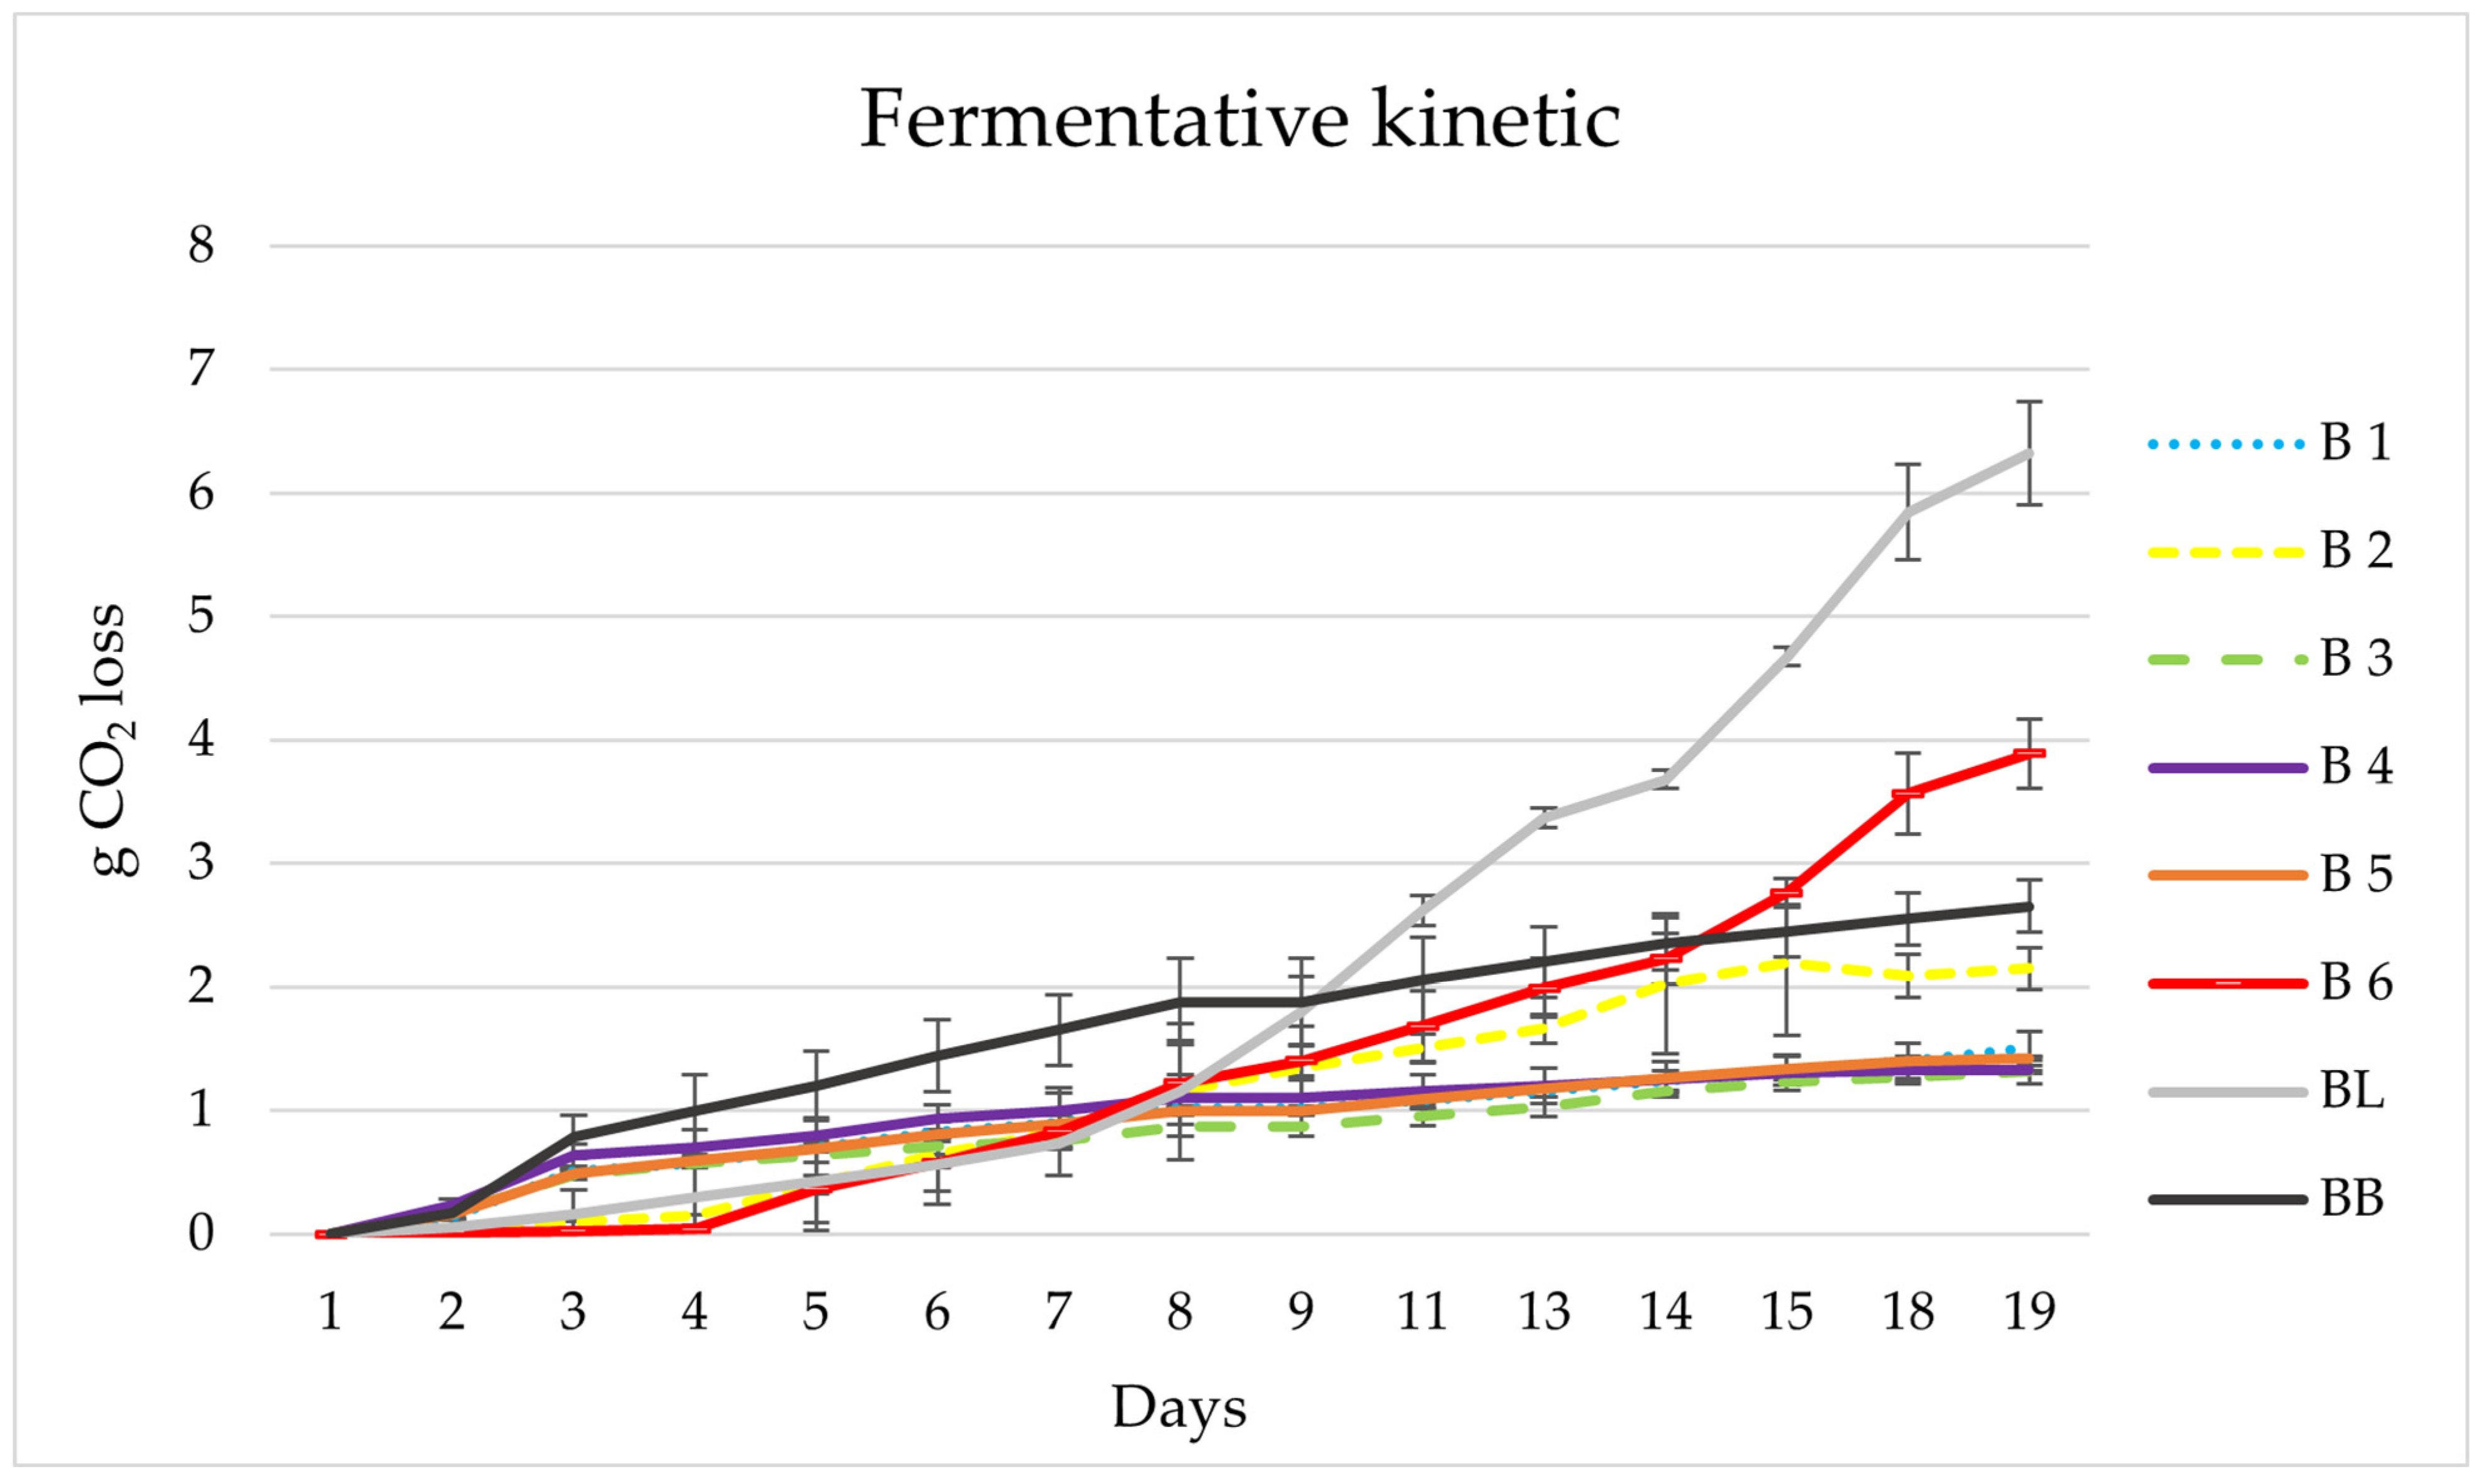
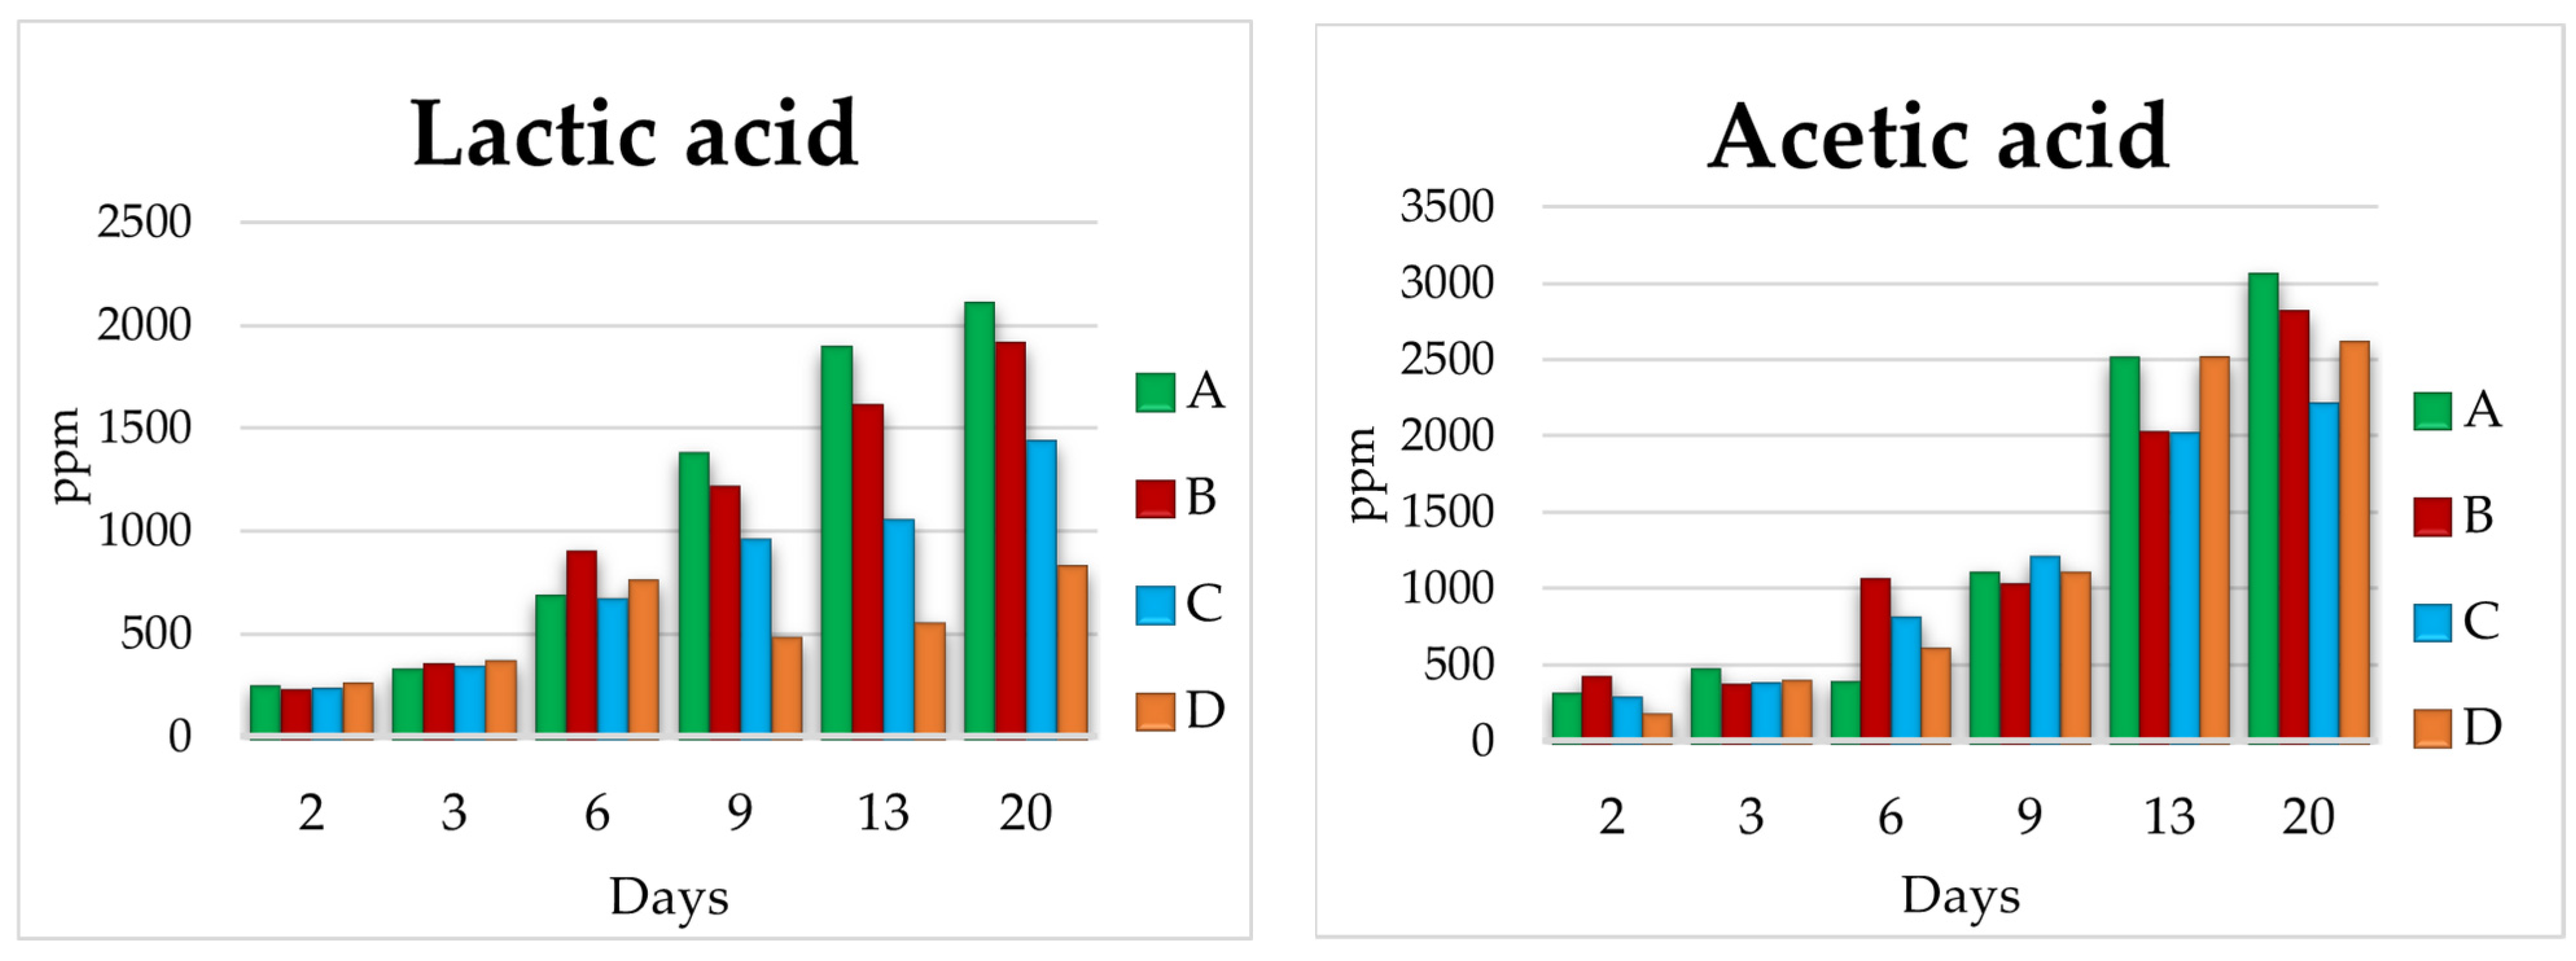
3.2. Lab Scale Fermentations 1 L
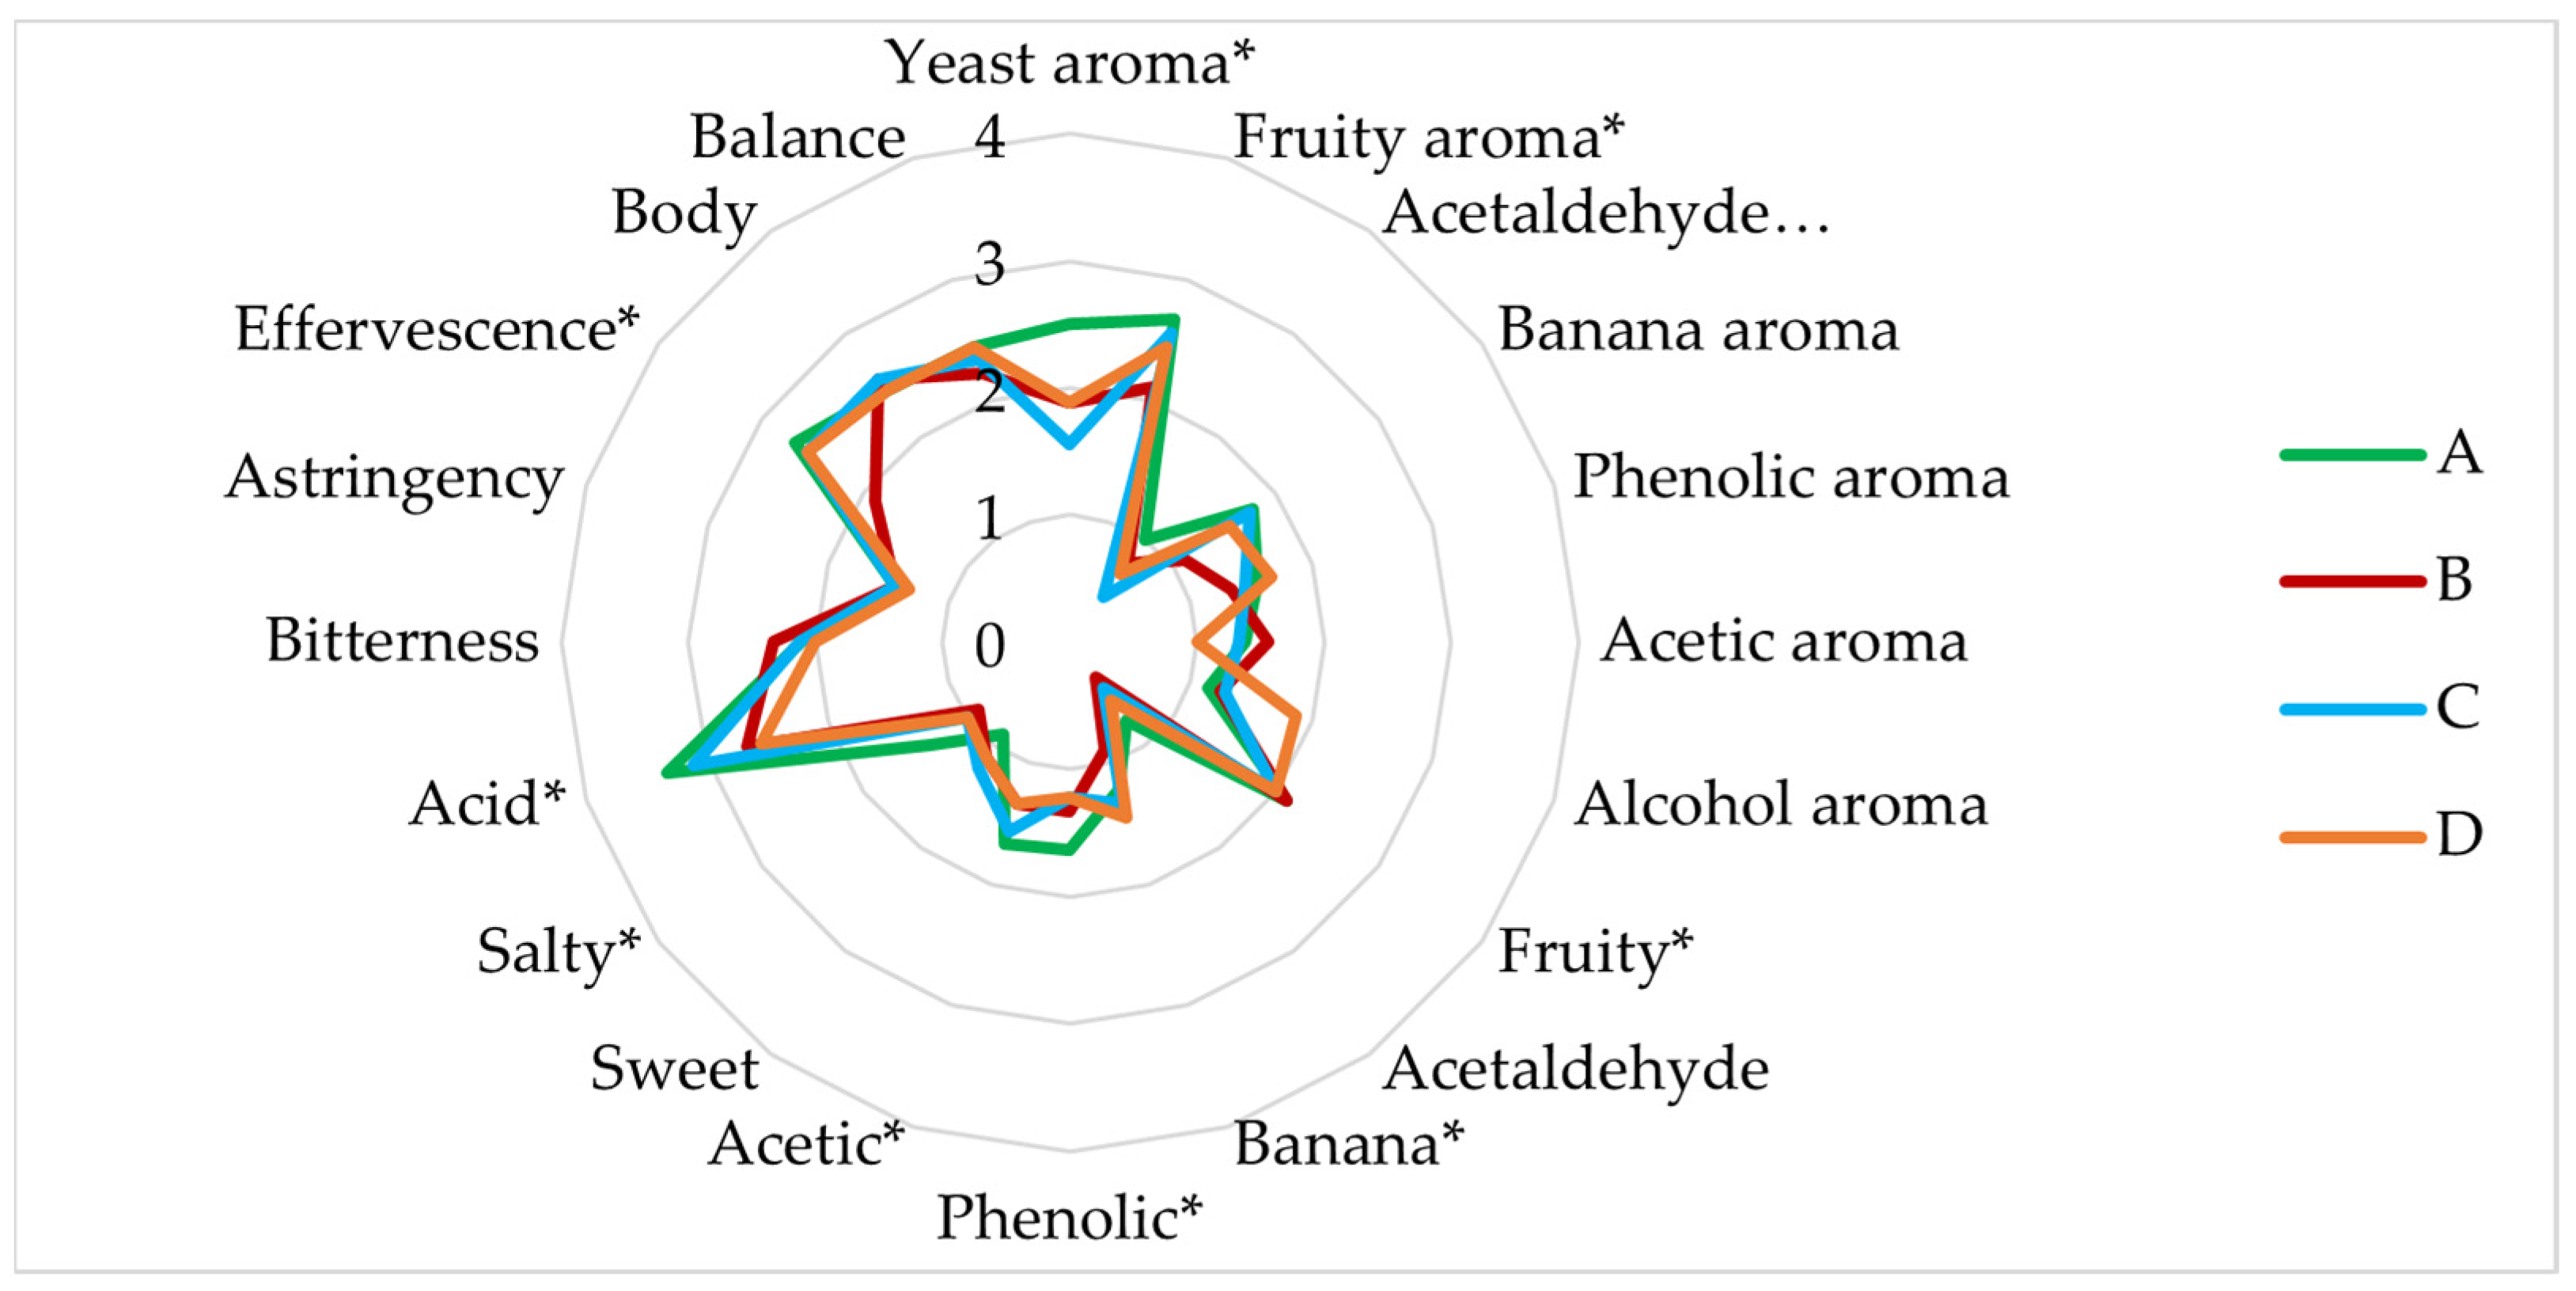
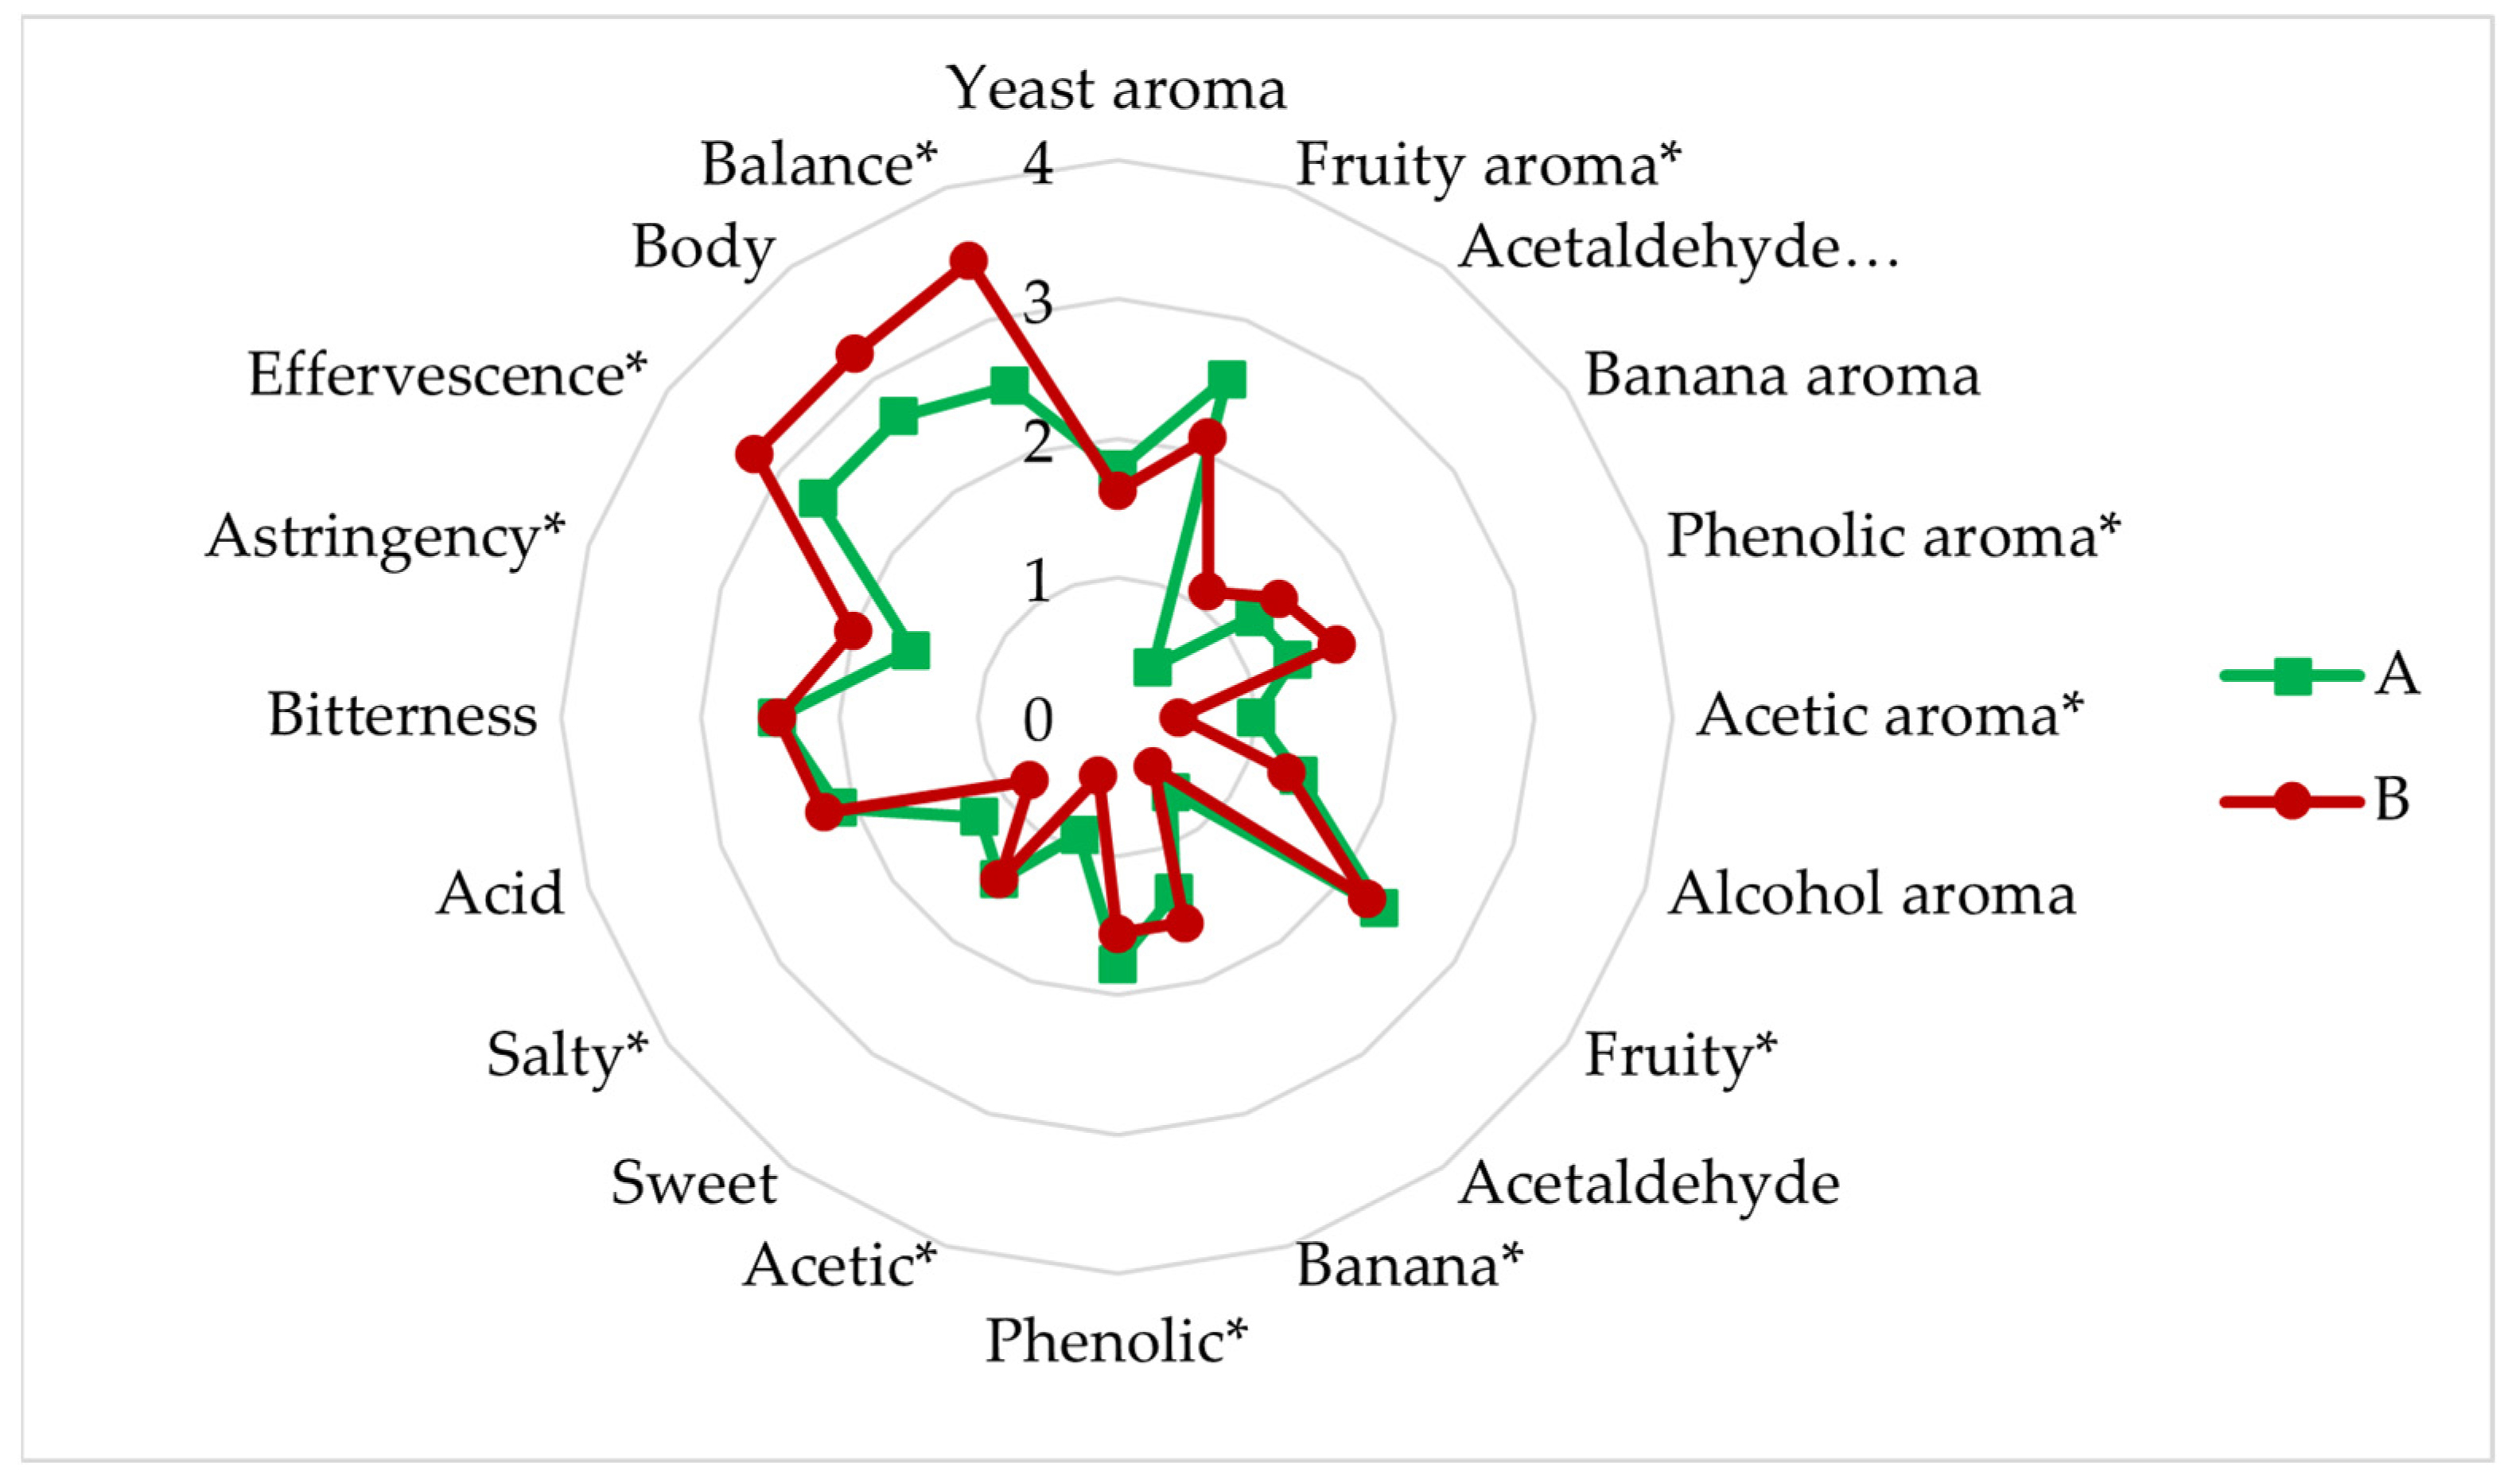
3.3. Sensory Analysis
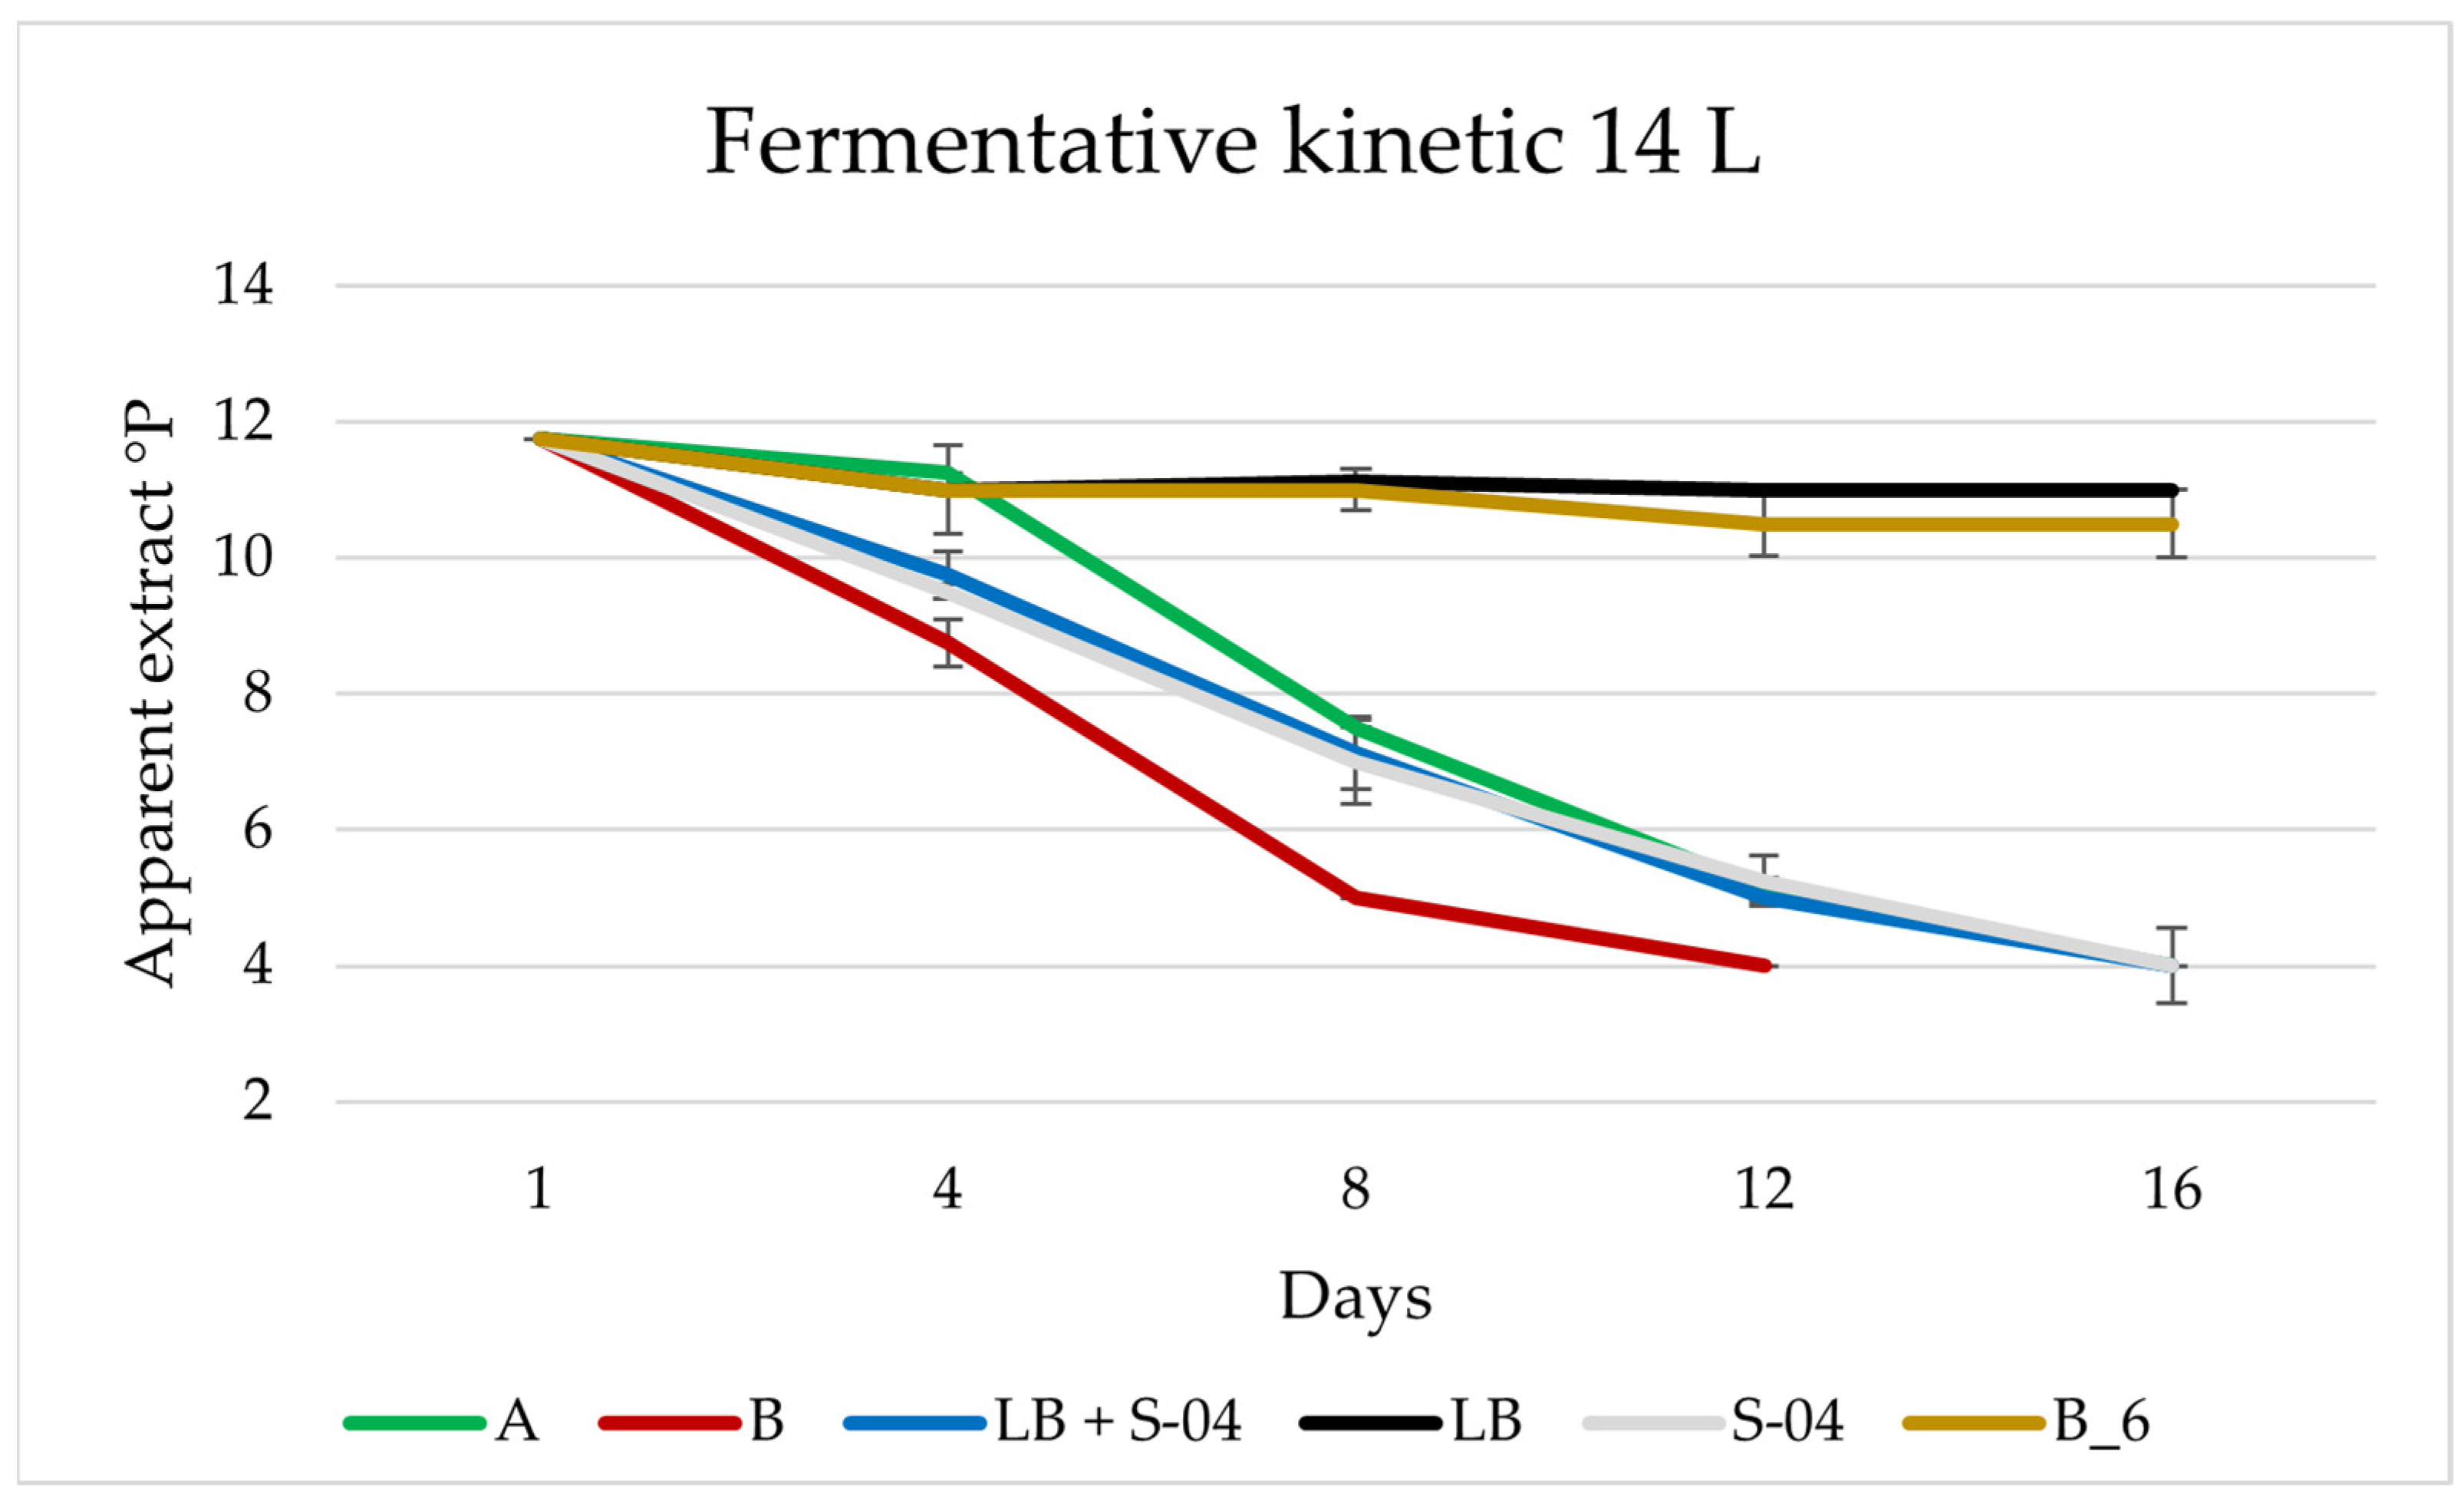
3.4. Larger Scale: 14 L
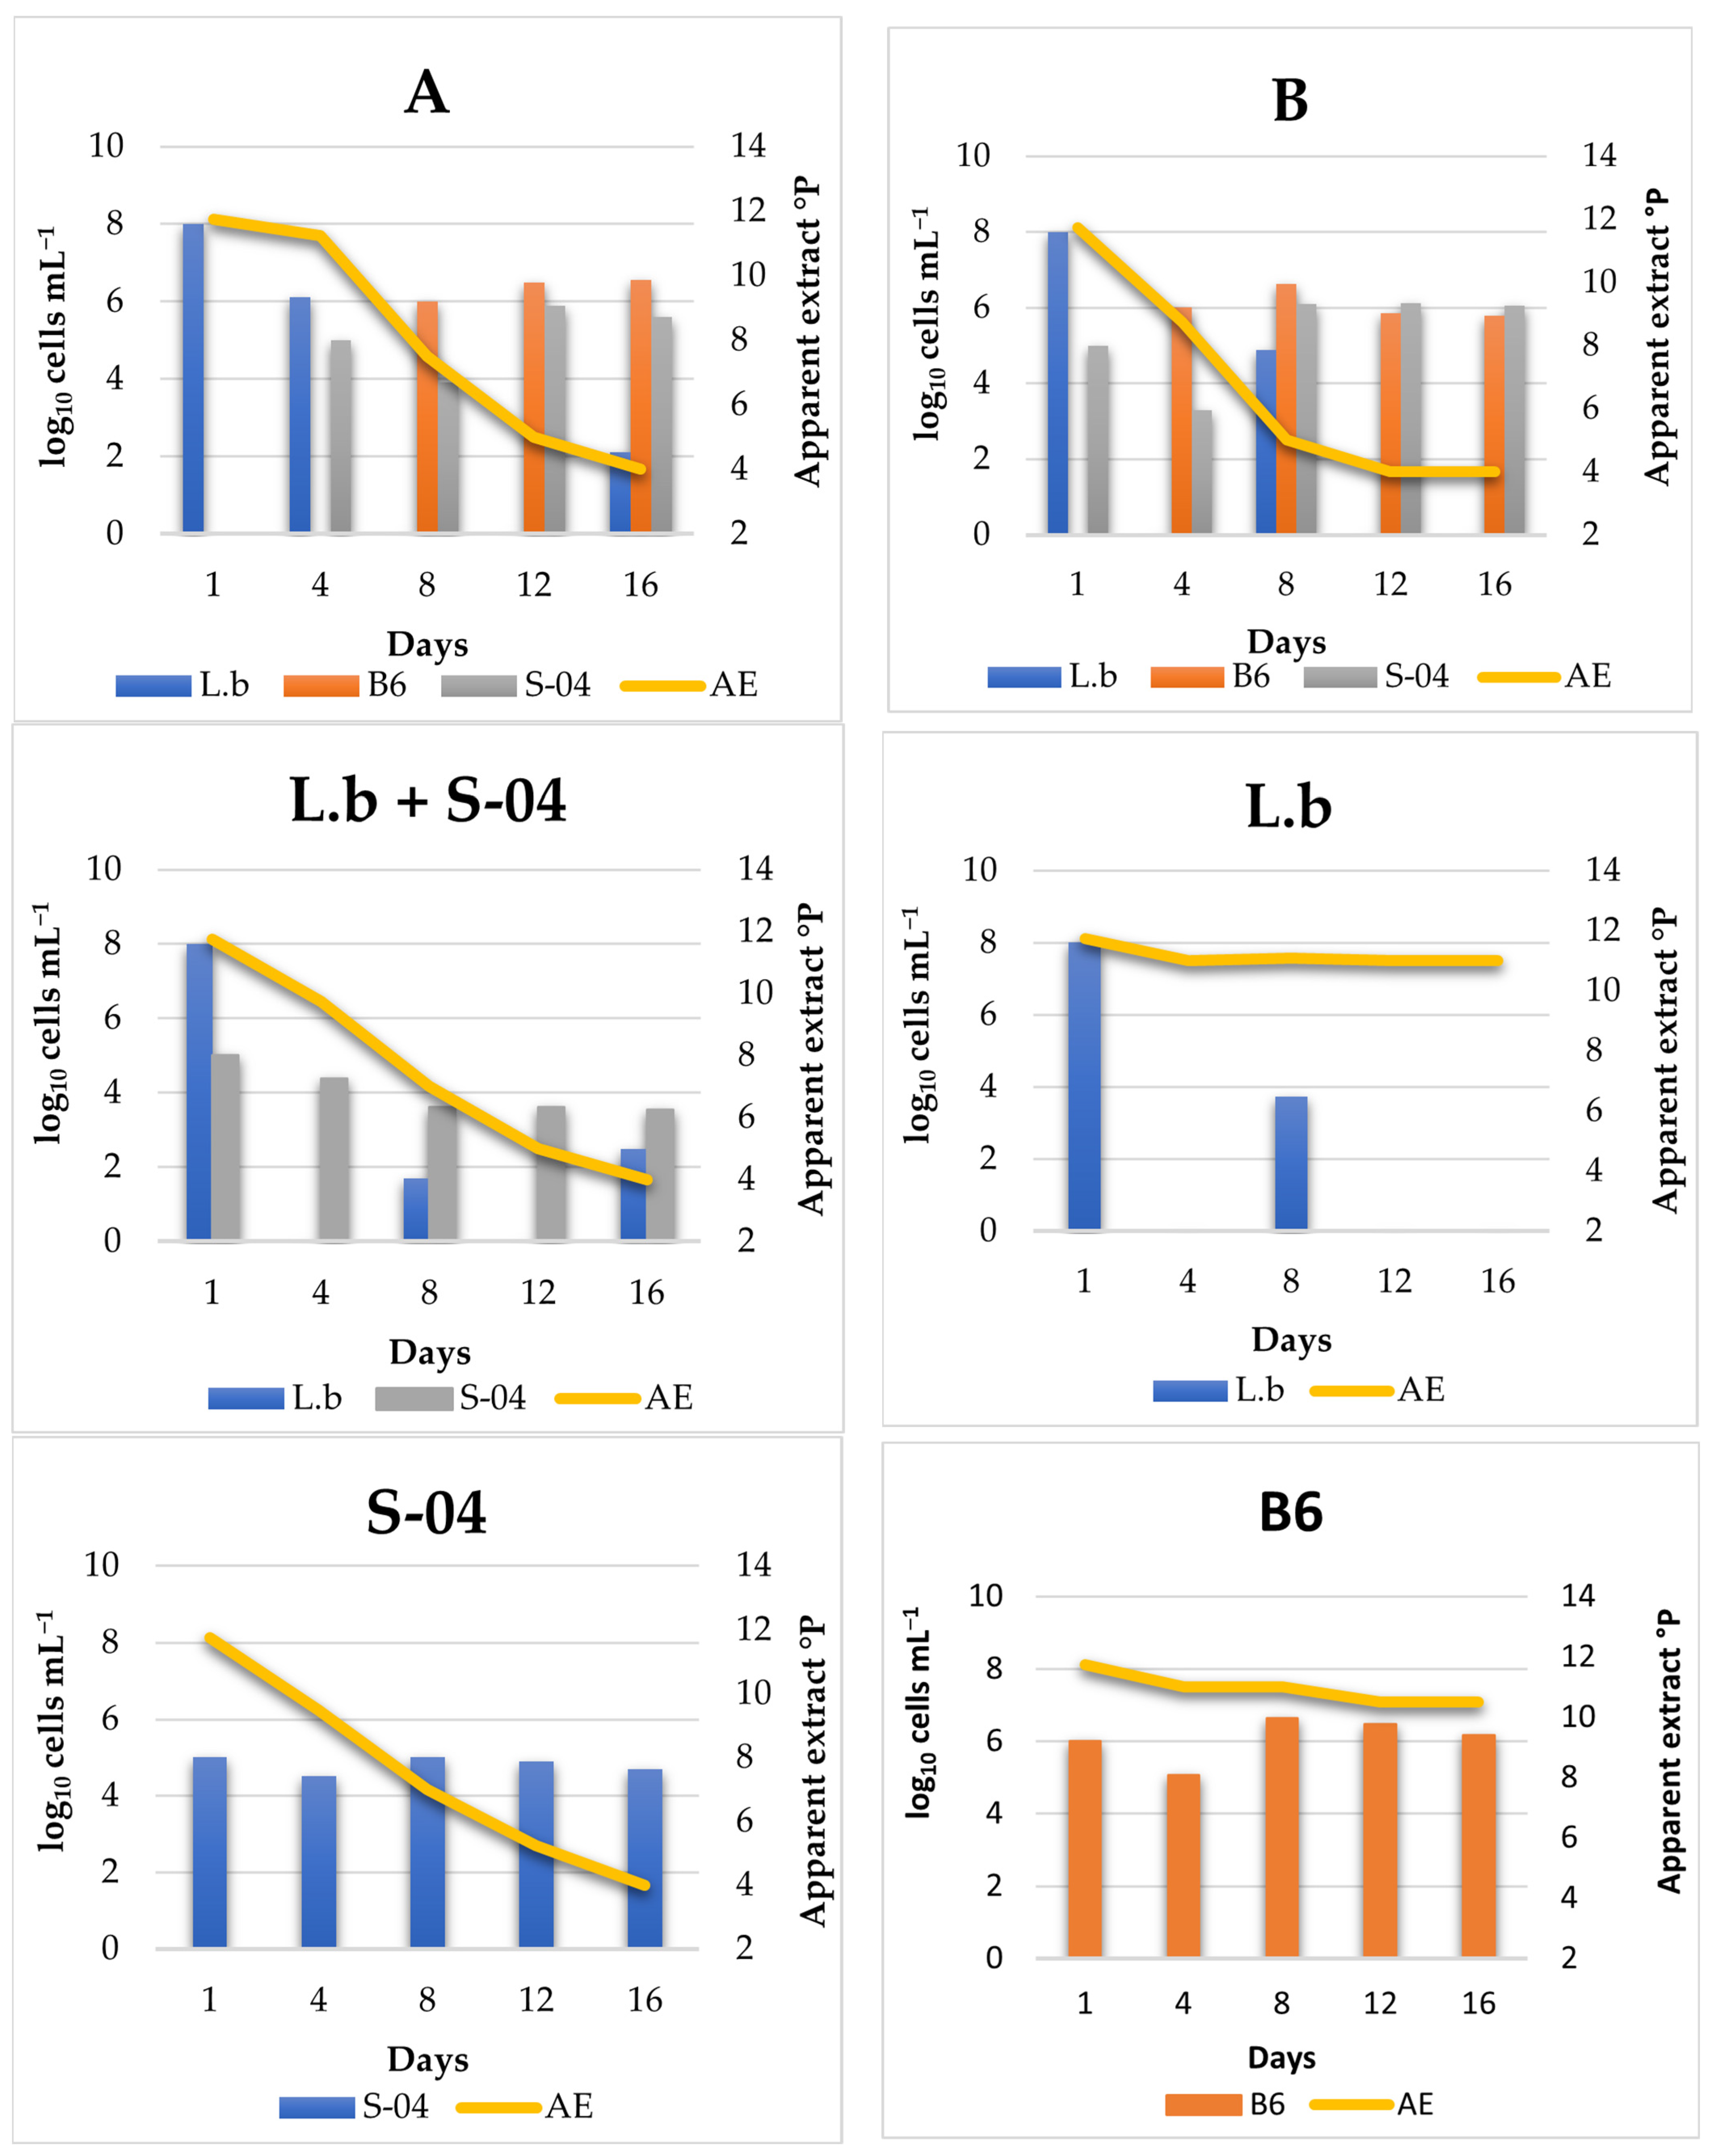
3.4.1. Cell Monitoring during 14 L Fermentation
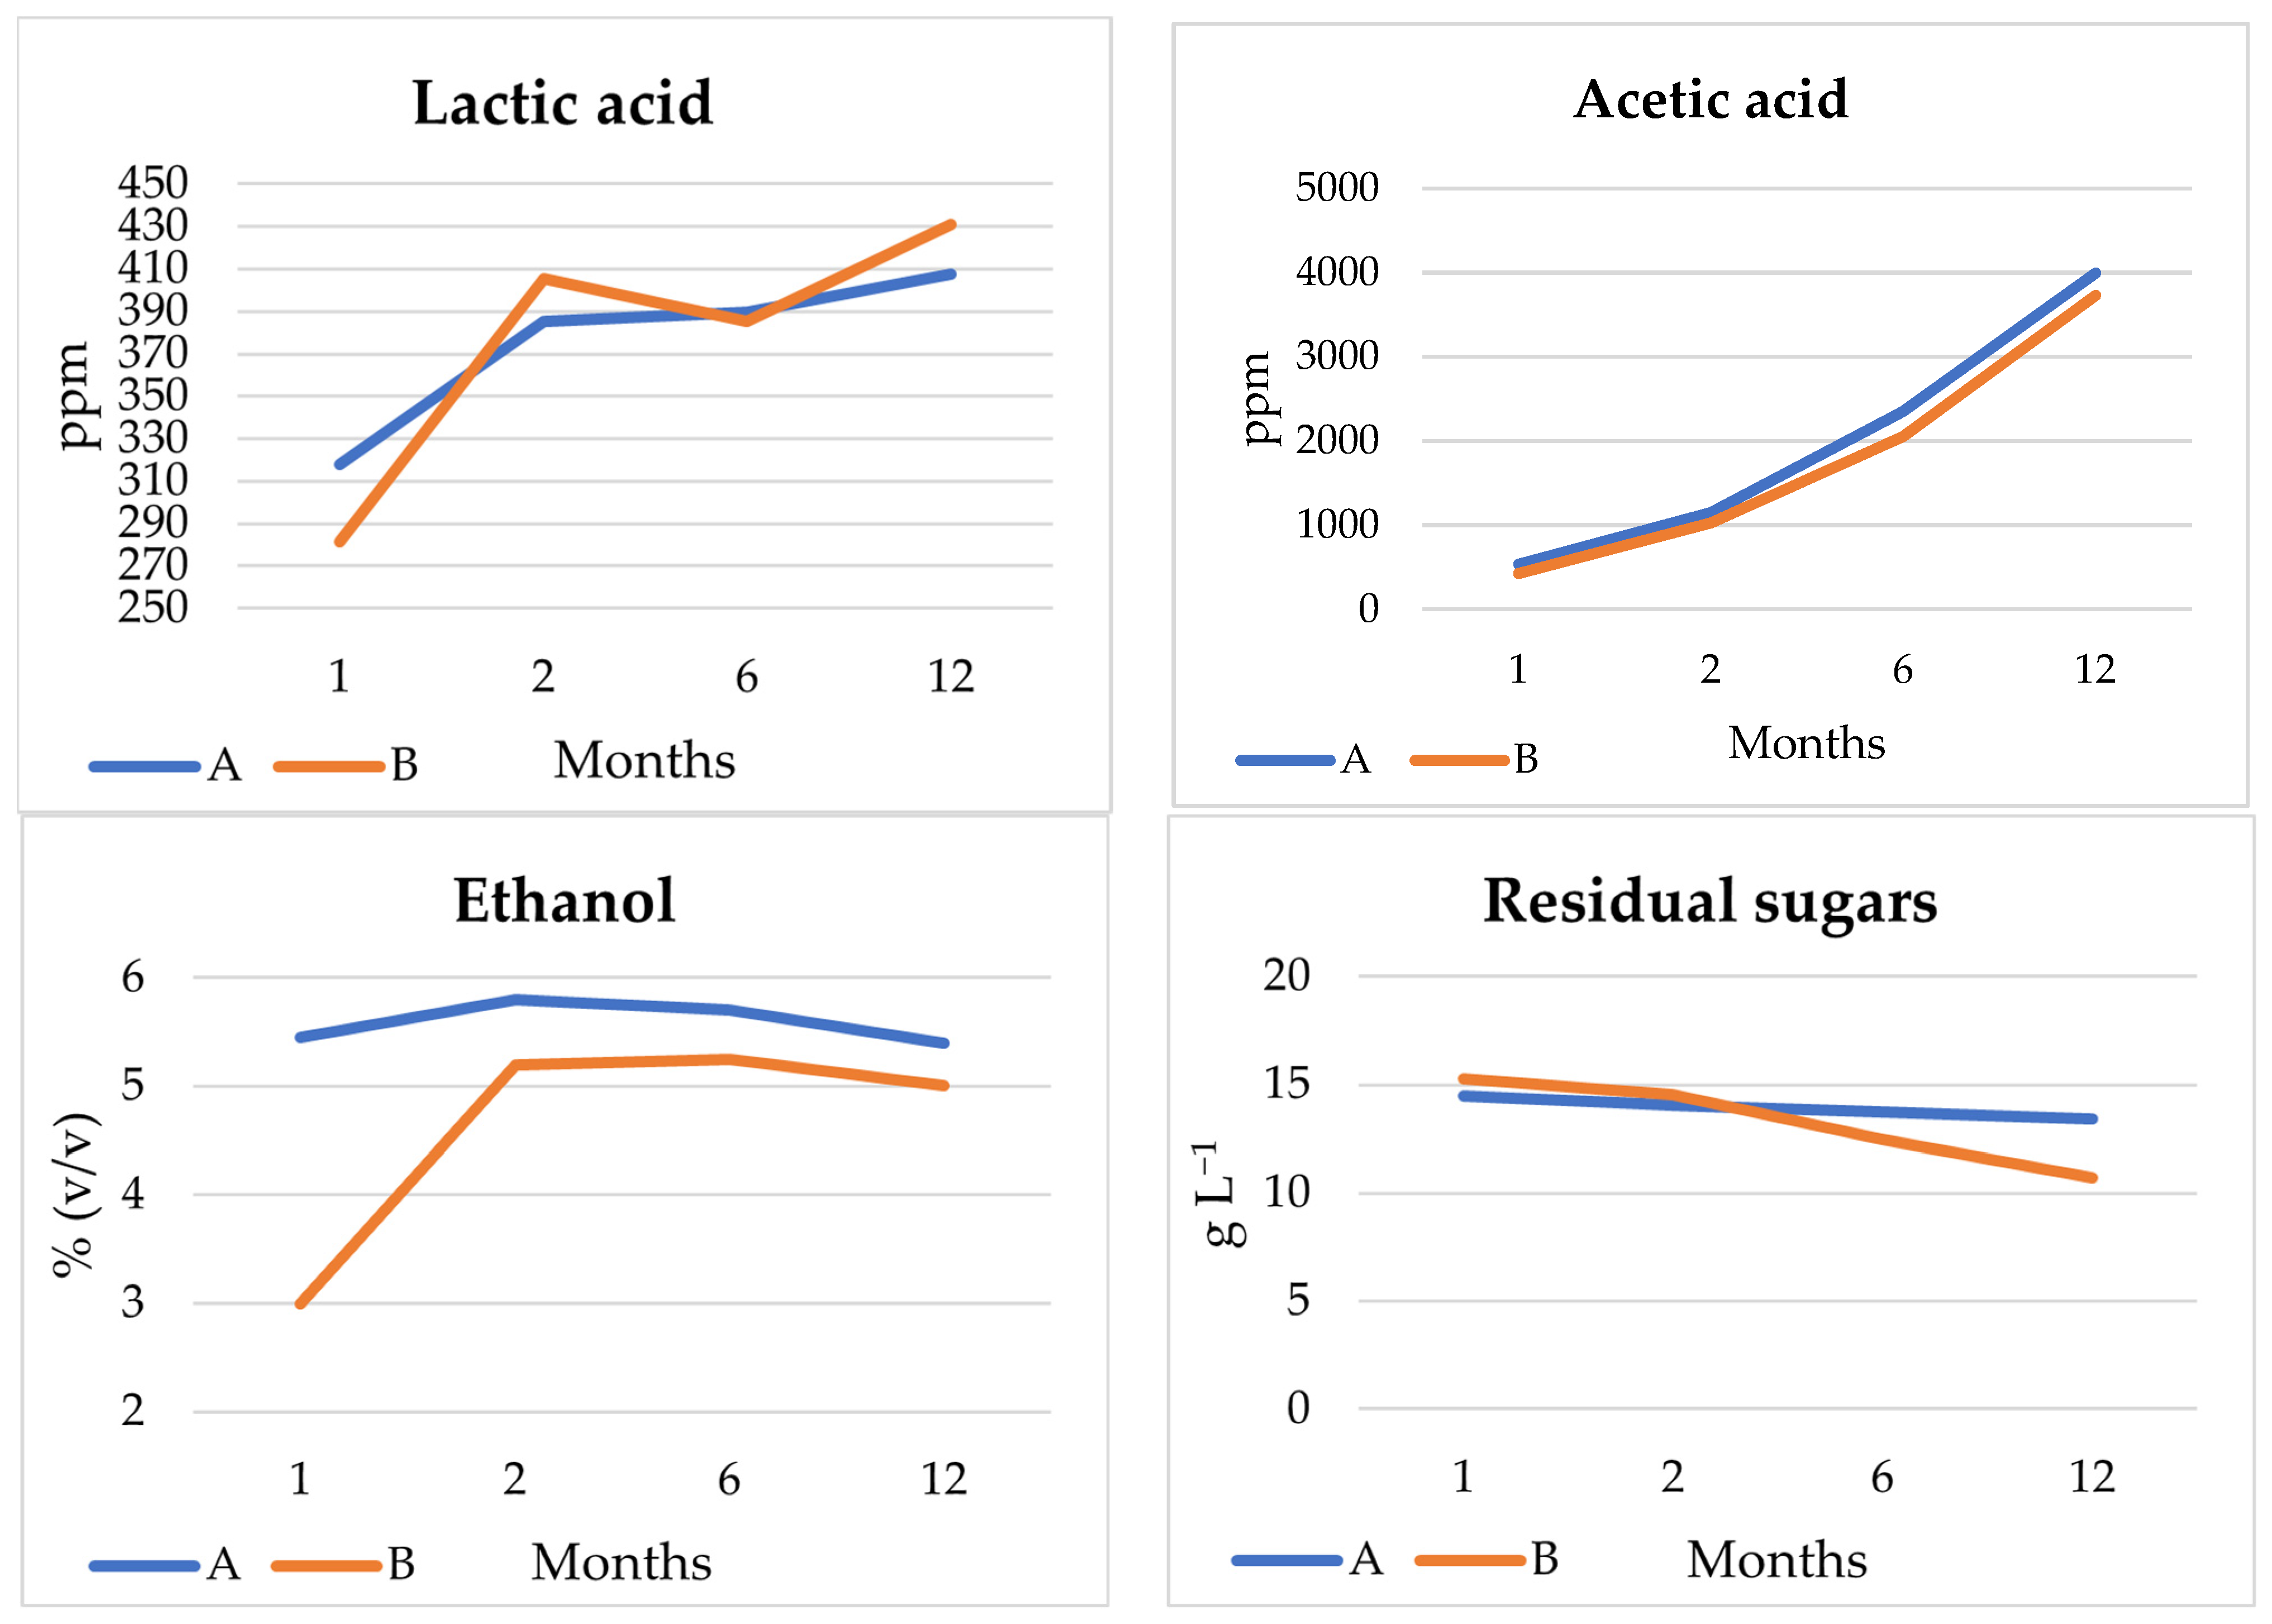
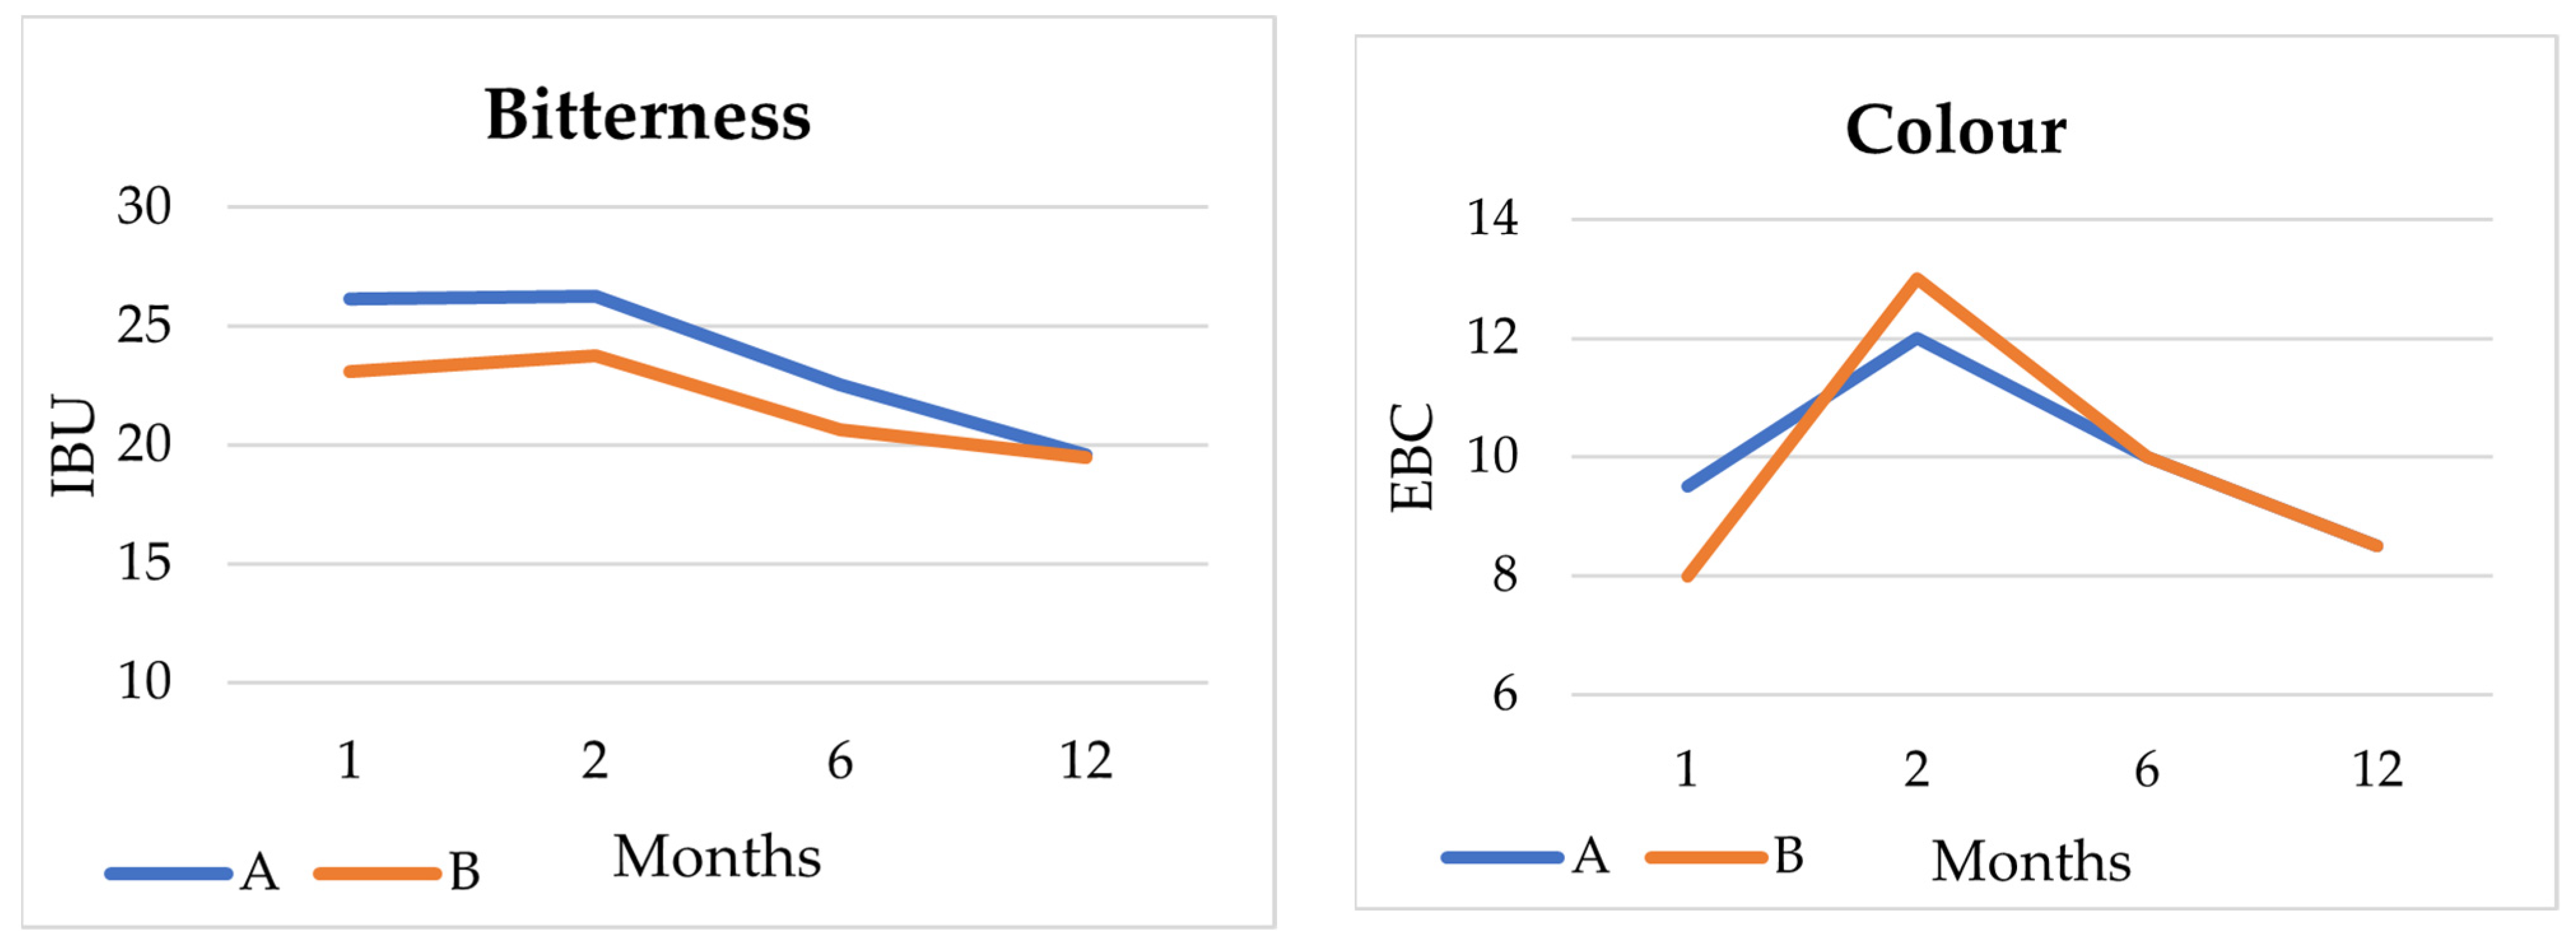
3.4.2. Beer Analysis
3.4.3. Volatile Compounds
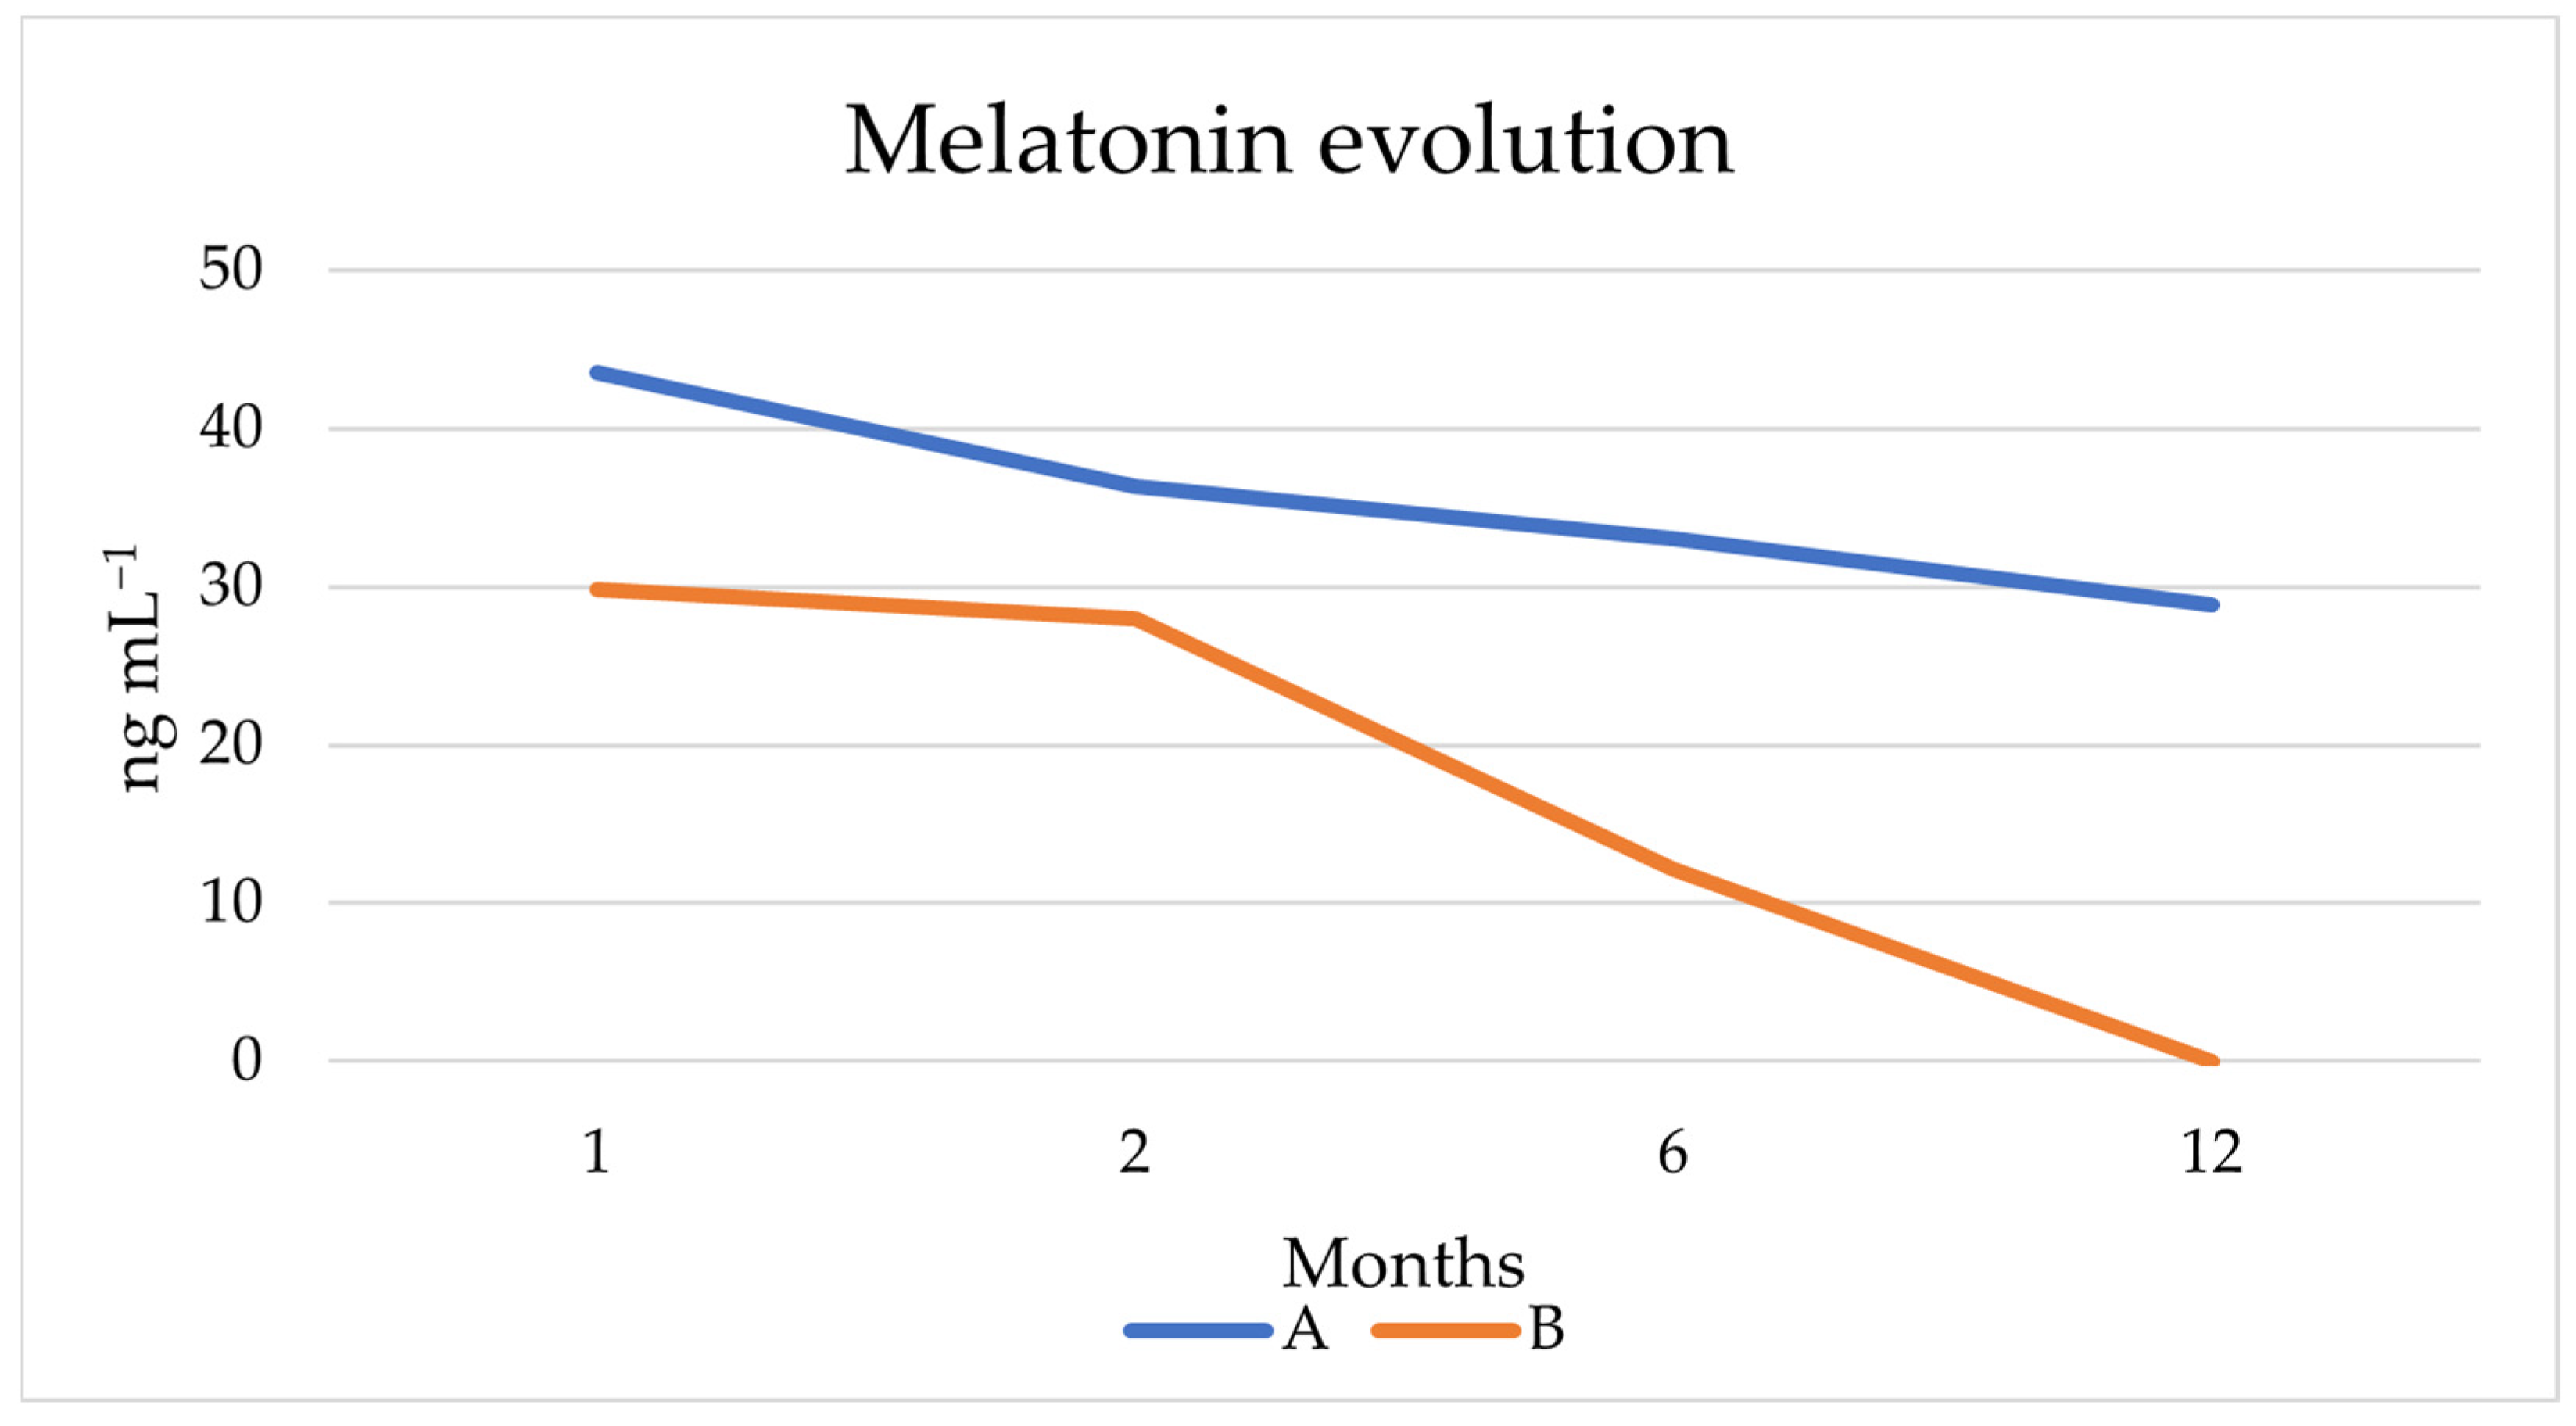
3.4.4. Melatonin Production
3.4.5. Antioxidant Capacity
3.4.6. Sensory Analysis
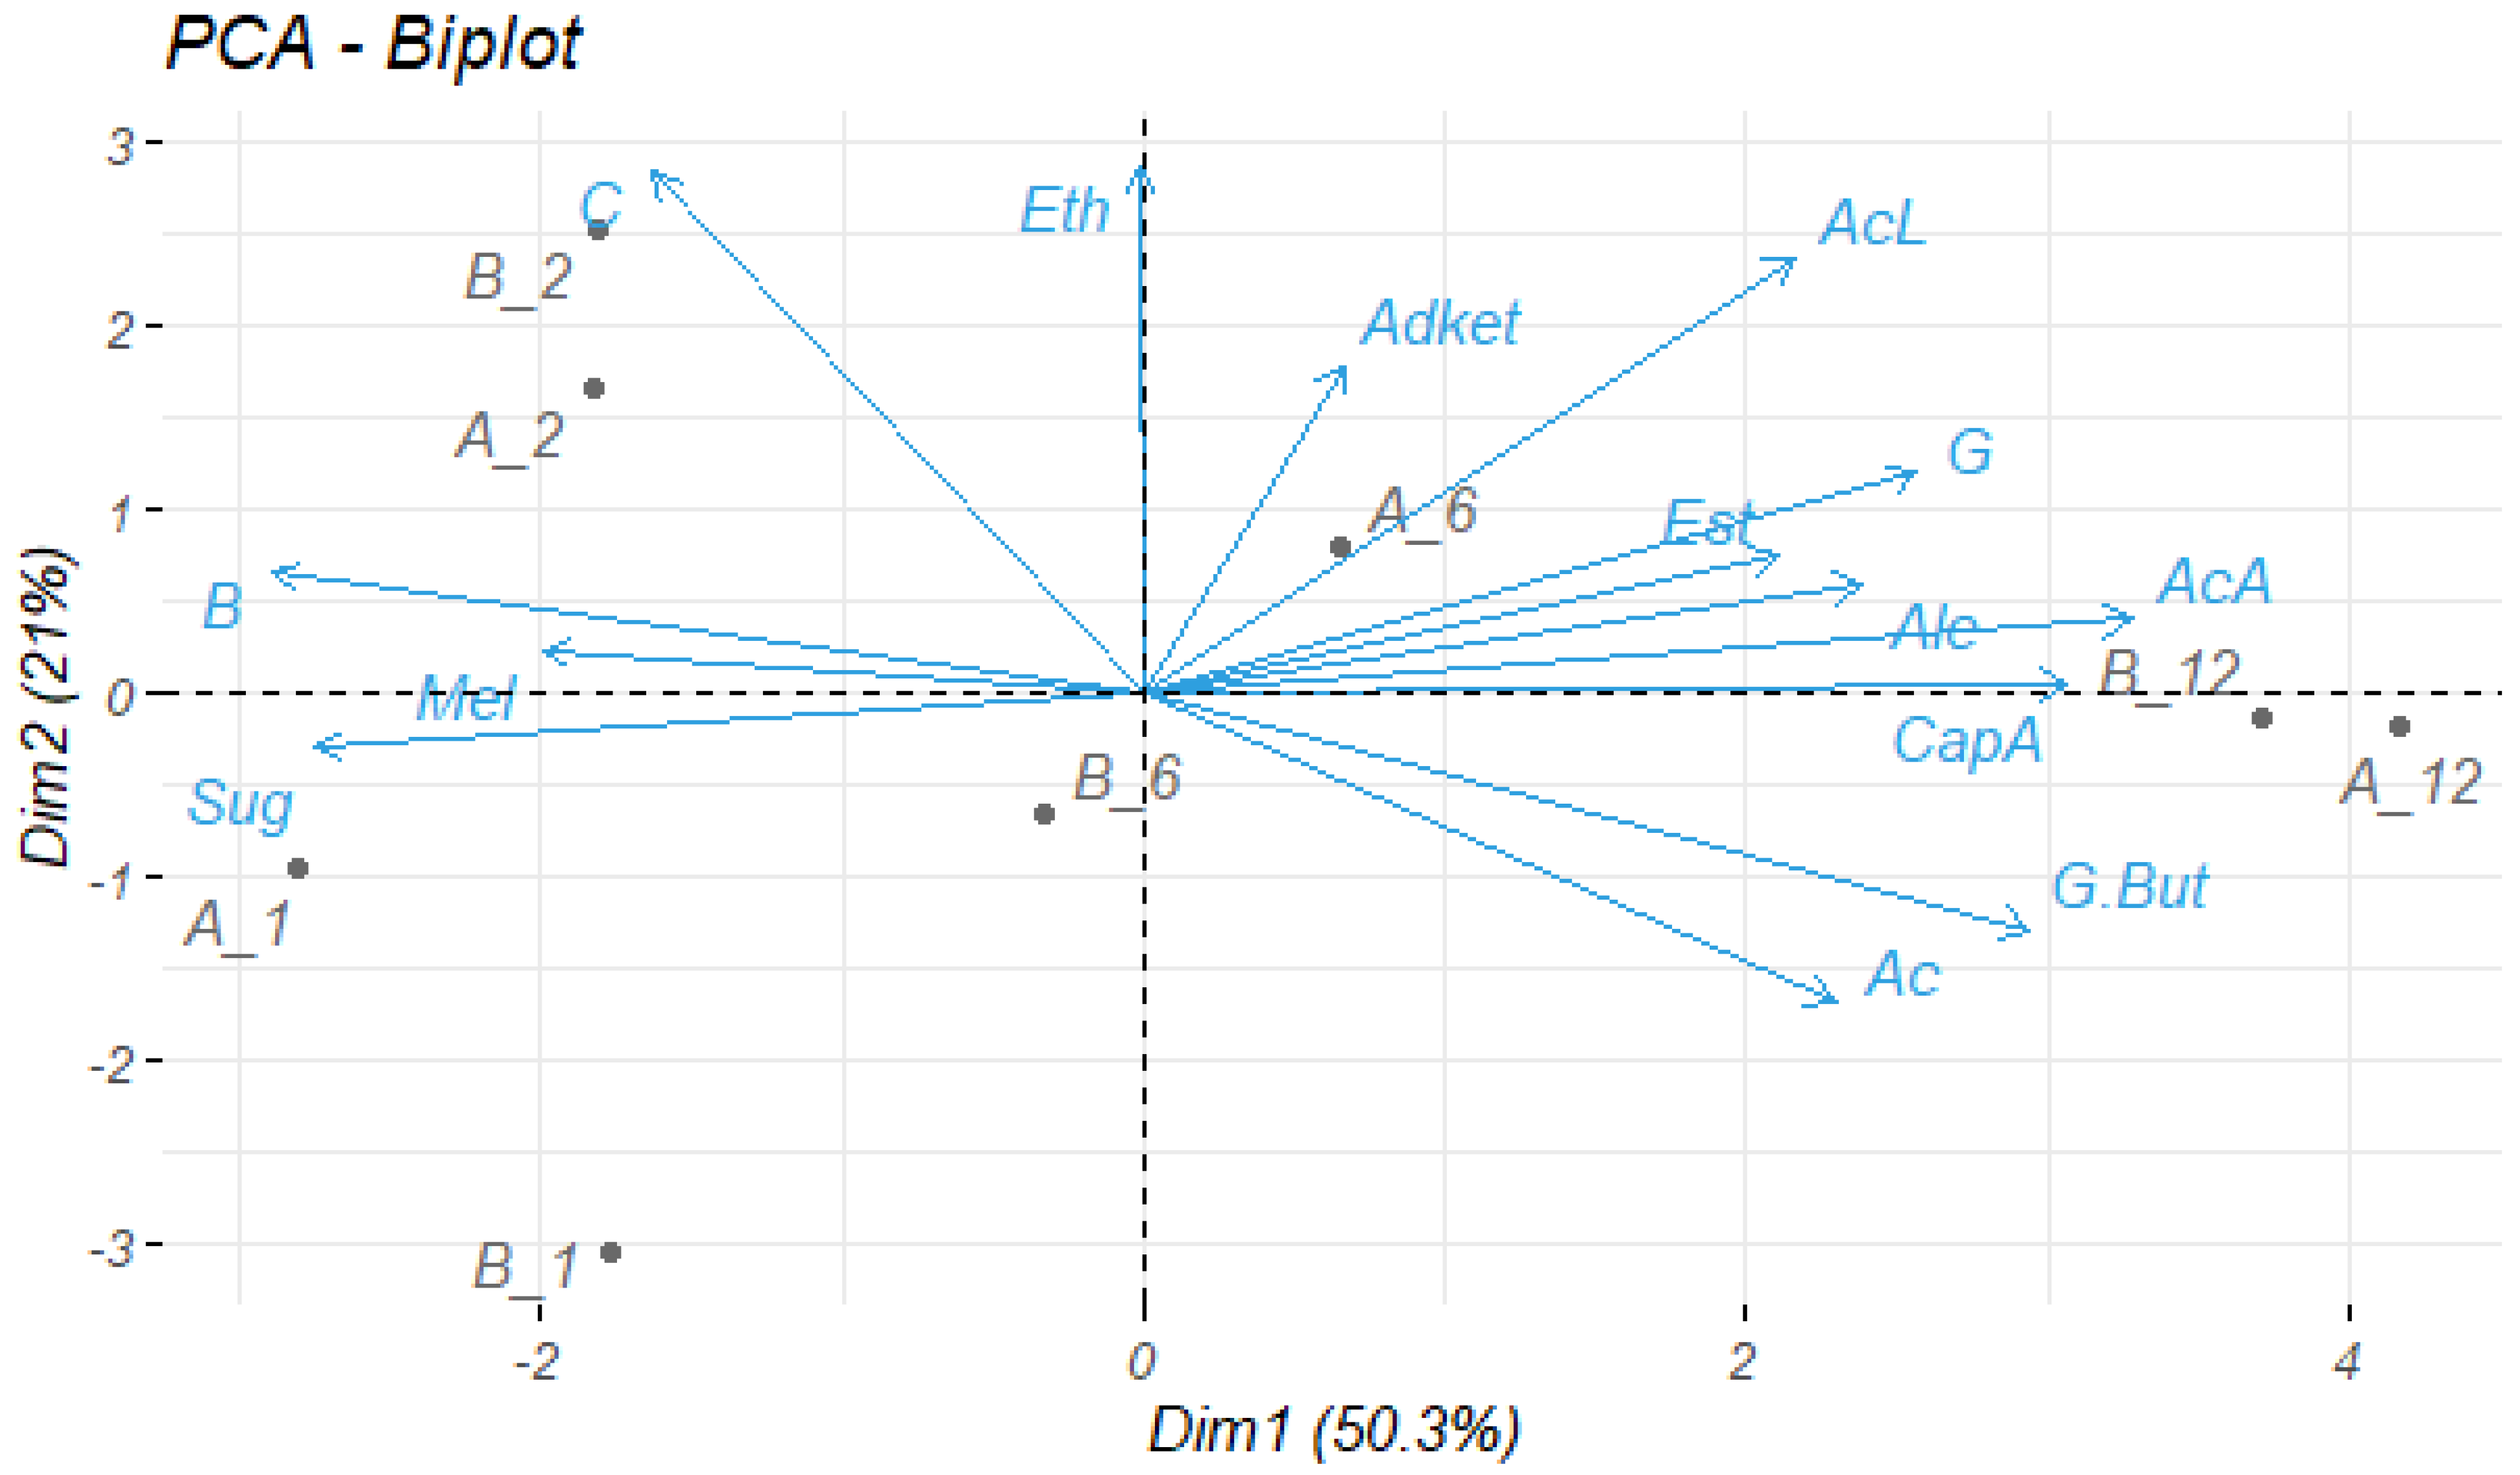
3.4.7. Statistical Analysis
4. Conclusions
Author Contributions
Funding
Data Availability Statement
Acknowledgments
Conflicts of Interest
References
- Bokulich, N.A.; Bamforth, C.W.; Mills, D.A. Brewhouse-Resident Microbiota Are Responsible for Multi-Stage Fermentation of American Coolship Ale. PLoS ONE 2012, 7, e35507. [Google Scholar] [CrossRef]
- Tonsmeire, M. American Sour Beer: Innovative Techniques for Mixed Fermentations; Brewers Publications: Portage Blvd. Kent, OH, USA, 2014. [Google Scholar]
- Spitaels, F.; Wieme, A.D.; Janssens, M.; Aerts, M.; Daniel, H.-M.; Van Landschoot, A.; De Vuyst, L.; Vandamme, P. The Microbial Diversity of Traditional Spontaneously Fermented Lambic Beer. PLoS ONE 2014, 9, e95384. [Google Scholar] [CrossRef]
- Oevelen, D.; Van De l’Escaille, F.; Verachtert, H. Synthesis of aroma components during the spontaneous fermentation of lambic and Gueuze. J. Inst. Brew. 1976, 82, 322–326. [Google Scholar] [CrossRef]
- Xu, Y.; Wang, D.; Li, H.; Hao, J.Q.; Jiang, W.; Liu, Z.; Qin, Q. Flavor Contribution of Esters in Lager Beers and an Analysis of Their Flavor Thresholds. J. Am. Soc. Brew. Chem. 2017, 75, 201–206. [Google Scholar] [CrossRef]
- Spitaels, F.; Wieme, A.D.; Snauwaert, I.; Vuyst, L.; De Vandamme, P. Microbial Ecology of Traditional Beer Fermentations. In Brewing Microbiology: Current Research, Omics and Microbial Ecology; Caister Academic Press: Poole, UK, 2017; ISBN 9781910190616. [Google Scholar]
- De Roos, J.; De Vuyst, L. Microbial Acidification, Alcoholization, and Aroma Production during Spontaneous Lambic Beer Production. J. Sci. Food Agric. 2019, 99, 25–38. [Google Scholar] [CrossRef]
- Martens, H.; Dawoud, E.; Verachtert, H. Wort enterobacteria and other microbial populations involved during the first month of lambic fermentation. J. Inst. Brew. 1991, 97, 435–439. [Google Scholar] [CrossRef]
- Van Oevelen, D.; Spaepen, M.; Timmermans, P.; Verachtert, H. Microbiological aspects of spontaneous wort fermentation in the production of lambic and gueuze. J. Inst. Brew. 1977, 83, 356–360. [Google Scholar] [CrossRef]
- Thompson Witrick, K.; Duncan, S.E.; Hurley, K.E.; O’keefe, S.F. Acid and Volatiles of Commercially—Available Lambic Beers. Beverages 2017, 3, 51. [Google Scholar] [CrossRef]
- Guinard, J.-X. Lambic; Tomas, V., Ed.; Brewers Publications: Boulder, CO, USA, 1990. [Google Scholar]
- Spaepen, M.; Van Oevelen, D.; Verachtert, H. Fatty acids and esters produced during the spontaneous fermentation of lambic and gueuze. J. Inst. Brew. 1978, 84, 278–282. [Google Scholar] [CrossRef]
- De Keersmaecker, J. The Mystery of Lambic Beer. Sci. Am. 1996, 275, 74–80. [Google Scholar] [CrossRef]
- Menz, G.; Andrighetto, C.; Lombardi, A.; Corich, V.; Aldred, P.; Vriesekoop, F. Isolation, Identification, and Characterisation of Beer-Spoilage Lactic Acid Bacteria from Microbrewed Beer from Victoria, Australia. J. Inst. Brew. 2010, 116, 14–22. [Google Scholar] [CrossRef]
- Verachtert, D.I.H. Properties of Belgian Acidic Beers and Their Microflora. I. The Production of Gueuze and Related Refreshing Acid Beers. Cerevisia 1995, 20, 37–41. [Google Scholar]
- Spitaels, F.; Wieme, A.D.; Janssens, M.; Aerts, M.; Van Landschoot, A.; De Vuyst, L.; Vandamme, P. The Microbial Diversity of an Industrially Produced Lambic Beer Shares Members of a Traditionally Produced One and Reveals a Core Microbiota for Lambic Beer Fermentation. Food Microbiol. 2015, 49, 23–32. [Google Scholar] [CrossRef]
- Steensels, J.; Daenen, L.; Malcorps, P.; Derdelinckx, G.; Verachtert, H.; Verstrepen, K.J. Brettanomyces Yeasts—From Spoilage Organisms to Valuable Contributors to Industrial Fermentations. Int. J. Food Microbiol. 2015, 206, 24–38. [Google Scholar] [CrossRef]
- Kumara, H.M.C.S.; Verachtert, H. Identification of lambic superattenuating micro-organisms by the use of selective antibiotics. J. Inst. Brew. 1991, 97, 181–185. [Google Scholar] [CrossRef]
- Spaepen, M.; Verachtert, H. Esterase Activity in the Genus Brettanomyces. J. Inst. Brew. 1982, 88, 11–17. [Google Scholar] [CrossRef]
- Maldonado, M.D.; Moreno, H.; Calvo, J.R. Melatonin Present in Beer Contributes to Increase the Levels of Melatonin and Antioxidant Capacity of the Human Serum. Clin. Nutr. 2009, 28, 188–191. [Google Scholar] [CrossRef]
- Granato, D.; Branco, G.F.; Faria, J.D.A.F.; Cruz, A.G. Characterization of Brazilian Lager and Brown Ale Beers Based on Color, Phenolic Compounds, and Antioxidant Activity Using Chemometrics. J. Sci. Food Agric. 2011, 91, 563–571. [Google Scholar] [CrossRef]
- Morera, A.L.; Abreu, P. Seasonality of Psychopathology and Circannual Melatonin Rhythm. J. Pineal Res. 2006, 41, 279–283. [Google Scholar] [CrossRef]
- Reiter, R.J.; Tan, D.-X.; Maldonado, M.D. Melatonin as an Antioxidant: Physiology versus Pharmacology. J. Pineal Res. 2005, 39, 215–216. [Google Scholar] [CrossRef]
- Maldonado, M.D.; Manfredi, M.; Ribas-Serna, J.; Garcia-Moreno, H.; Calvo, J.R. Melatonin Administrated Immediately before an Intense Exercise Reverses Oxidative Stress, Improves Immunological Defenses and Lipid Metabolism in Football Players. Physiol. Behav. 2012, 105, 1099–1103. [Google Scholar] [CrossRef] [PubMed]
- Poeggeler, B.; Reiter, R.J.; Tan, D.-X.; Chen, L.; Manchester, L.C. Melatonin, Hydroxyl Radical-Mediated Oxidative Damage, and Aging: A Hypothesis. J. Pineal Res. 1993, 14, 151–168. [Google Scholar] [CrossRef]
- Sanchez-Hidalgo, M.; de la Lastra, C.A.; Carrascosa-Salmoral, M.P.; Naranjo, M.C.; Gomez-Corvera, A.; Caballero, B.; Guerrero, J.M. Age-Related Changes in Melatonin Synthesis in Rat Extrapineal Tissues. Exp. Gerontol. 2009, 44, 328–334. [Google Scholar] [CrossRef] [PubMed]
- Maldonado, M.D.; Mora-Santos, M.; Naji, L.; Carrascosa-Salmoral, M.P.; Naranjo, M.C.; Calvo, J.R. Evidence of Melatonin Synthesis and Release by Mast Cells. Possible Modulatory Role on Inflammation. Pharmacol. Res. 2010, 62, 282–287. [Google Scholar] [CrossRef] [PubMed]
- Motilva, V.; García-Mauriño, S.; Talero, E.; Illanes, M. New Paradigms in Chronic Intestinal Inflammation and Colon Cancer: Role of Melatonin. J. Pineal Res. 2011, 51, 44–60. [Google Scholar] [CrossRef]
- Lee, S.E.; Kim, S.J.; Youn, J.-P.; Hwang, S.Y.; Park, C.-S.; Park, Y.S. MicroRNA and Gene Expression Analysis of Melatonin-Exposed Human Breast Cancer Cell Lines Indicating Involvement of the Anticancer Effect. J. Pineal Res. 2011, 51, 345–352. [Google Scholar] [CrossRef]
- Sanchez-Barcelo, E.J.; Mediavilla, M.D.; Alonso-Gonzalez, C.; Reiter, R.J. Melatonin Uses in Oncology: Breast Cancer Prevention and Reduction of the Side Effects of Chemotherapy and Radiation. Expert Opin. Investig. Drugs 2012, 21, 819–831. [Google Scholar] [CrossRef]
- Maldonado, M.D.; Siu, A.W.; Sánchez-Hidalgo, M.; Acuna-Castroviejo, D.; Escames, G. Melatonin and Lipid Uptake by Murine Fibroblasts: Clinical Implications. Neuroendocrinol. Lett. 2006, 27, 601–608. [Google Scholar]
- Koziróg, M.; Poliwczak, A.R.; Duchnowicz, P.; Koter-Michalak, M.; Sikora, J.; Broncel, M. Melatonin Treatment Improves Blood Pressure, Lipid Profile, and Parameters of Oxidative Stress in Patients with Metabolic Syndrome. J. Pineal Res. 2011, 50, 261–266. [Google Scholar] [CrossRef]
- Witrick, K.; Pitts, E.R.; O’Keefe, S.F. Analysis of Lambic Beer Volatiles during Aging Using Gas Chromatography–Mass Spectrometry (GCMS) and Gas Chromatography–Olfactometry (GCO). Beverages 2020, 6, 31. [Google Scholar] [CrossRef]
- Alcine Chan, M.Z.; Chua, J.Y.; Toh, M.; Liu, S.Q. Survival of Probiotic Strain Lactobacillus paracasei L26 during Co-Fermentation with S. cerevisiae for the Development of a Novel Beer Beverage. Food Microbiol. 2019, 82, 541–550. [Google Scholar] [CrossRef] [PubMed]
- Ortega, C.; López, R.; Cacho, J.; Ferreira, V. Fast Analysis of Important Wine Volatile Compounds—Development and Validation of a New Method Based on Gas Chromatographic-Flame Ionisation Detection Analysis of Dichloromethane Microextracts. J. Chromatogr. A 2001, 923, 205–214. [Google Scholar] [CrossRef] [PubMed]
- Rodriguez-Naranjo, M.I.; Gil-Izquierdo, A.; Troncoso, A.M.; Cantos, E.; Garcia-Parrilla, M.C. Melatonin: A New Bioactive Compound in Wine. J. Food Compos. Anal. 2011, 24, 603–608. [Google Scholar] [CrossRef]
- Kocadaǧli, T.; Yilmaz, C.; Gökmen, V. Determination of Melatonin and Its Isomer in Foods by Liquid Chromatography Tandem Mass Spectrometry. Food Chem. 2014, 153, 151–156. [Google Scholar] [CrossRef]
- Hevia, D.; Mayo, J.C.; Tan, D.-X.; Rodriguez-Garcia, A.; Sainz, R.M. Melatonin Enhances Photo-Oxidation of 2′,7′-Dichlorodihydrofluorescein by an Antioxidant Reaction That Renders N1-Acetyl-N2-Formyl-5-Methoxykynuramine (AFMK). PLoS ONE 2014, 9, e109257. [Google Scholar] [CrossRef]
- Huang, X.; Mazza, G. Simultaneous Analysis of Serotonin, Melatonin, Piceid and Resveratrol in Fruits Using Liquid Chromatography Tandem Mass Spectrometry. J. Chromatogr. A 2011, 1218, 3890–3899. [Google Scholar] [CrossRef]
- Vasilescu, A.; Fanjul-Bolado, P.; Titoiu, A.-M.; Porumb, R.; Epure, P. Progress in Electrochemical (Bio)Sensors for Monitoring Wine Production. Chemosensors 2019, 7, 66. [Google Scholar] [CrossRef]
- Viejo, C.G.; Fuentes, S.; Torrico, D.D.; Godbole, A.; Dunshea, F.R. Chemical Characterization of Aromas in Beer and Their Effect on Consumers Liking. Food Chem. 2019, 293, 479–485. [Google Scholar] [CrossRef]
- European Brewery Convention Analytica—EBC. Section 13 Sensory Analysis Method 13.10. In EBC Methods of Analysis; Fachverlag Hans Carl: Nürnberg, Germany, 1997. [Google Scholar]
- Blomqvist, J.; Eberhard, T.; Schnürer, J.; Passoth, V. Fermentation Characteristics of Dekkera Bruxellensis Strains. Appl. Microbiol. Biotechnol. 2010, 87, 1487–1497. [Google Scholar] [CrossRef]
- Oelofse, A.; Pretorius, I.S.; du Toit, M. Significance of Brettanomyces and Dekkera during Winemaking: A Synoptic Review. S. Afr. J. Enol. Vitic. 2008, 29, 128–144. [Google Scholar]
- Joseph, C.M.L.; Albino, E.; Bisson, L.F. Creation and Use of a Brettanomyces Aroma Wheel. Catal. Discov. Pract. 2017, 1, 12–20. [Google Scholar] [CrossRef]
- Sieuwerts, S.; Bron, P.A.; Smid, E.J. Mutually Stimulating Interactions between Lactic Acid Bacteria and Saccharomyces cerevisiae in Sourdough Fermentation. LWT 2018, 90, 201–206. [Google Scholar] [CrossRef]
- Crauwels, S.; Steensels, J.; Aerts, G.; Willems, K.A.; Verstrepen, K.J.; Lievens, B. Brettanomyces Bruxellensis, Essential Contributor in Spontaneous Beer Fermentations Providing Novel Opportunities for the Brewing Industry. BrewingScience 2015, 68, 110–121. [Google Scholar]
- Taillandier, P.; Lai, Q.P.; Julien-Ortiz, A.; Brandam, C. Interactions between Torulaspora delbrueckii and Saccharomyces cerevisiae in Wine Fermentation: Influence of Inoculation and Nitrogen Content. World J. Microbiol. Biotechnol. 2014, 30, 1959–1967. [Google Scholar] [CrossRef]
- Holt, S.; Mukherjee, V.; Lievens, B.; Verstrepen, K.J.; Thevelein, J.M. Bioflavoring by Non-Conventional Yeasts in Sequential Beer Fermentations. Food Microbiol. 2018, 72, 55–66. [Google Scholar] [CrossRef]
- Lentz, M. The Impact of Simple Phenolic Compounds on Beer Aroma and Flavor. Fermentation 2018, 4, 20. [Google Scholar] [CrossRef]
- Serra Colomer, M.; Funch, B.; Forster, J. The Raise of Brettanomyces Yeast Species for Beer Production. Curr. Opin. Biotechnol. 2019, 56, 30–35. [Google Scholar] [CrossRef]
- Verachtert, H.; Derdelinckx, G. Belgian Acidic Beers Daily Reminiscences of the Past. Cerevisia 2014, 38, 121–128. [Google Scholar] [CrossRef]
- Postigo, V.; Sanz, P.; García, M.; Arroyo, T. Impact of Non-Saccharomyces Wine Yeast Strains on Improving Healthy Characteristics and the Sensory Profile of Beer in Sequential Fermentation. Foods 2022, 11, 2029. [Google Scholar] [CrossRef]
- Bossaert, S.; Winne, V.; Van Opstaele, F.; Buyse, J.; Verreth, C.; Herrera-Malaver, B.; Van Geel, M.; Verstrepen, K.J.; Crauwels, S.; De Rouck, G.; et al. Description of the Temporal Dynamics in Microbial Community Composition and Beer Chemistry in Sour Beer Production via Barrel Ageing of Finished Beers. Int. J. Food Microbiol. 2021, 339, 109030. [Google Scholar] [CrossRef]
- Menoncin, M.; Bonatto, D. Molecular and Biochemical Aspects of Brettanomyces in Brewing. J. Inst. Brew. 2019, 125, 402–411. [Google Scholar] [CrossRef]
- Colomer, M.S.; Chailyan, A.; Fennessy, R.T.; Olsson, K.F.; Johnsen, L.; Solodovnikova, N.; Forster, J. Assessing Population Diversity of Brettanomyces Yeast Species and Identification of Strains for Brewing Applications. Front. Microbiol. 2020, 11, 637. [Google Scholar] [CrossRef] [PubMed]
- Vanderhaegen, B.; Delvaux, F.; Daenen, L.; Verachtert, H.; Delvaux, F.R. Aging Characteristics of Different Beer Types. Food Chem. 2007, 103, 404–412. [Google Scholar] [CrossRef]
- Šavel, J.; Košín, P.; Brož, A. Anaerobic and Aerobic Beer Aging. Czech J. Food Sci. 2010, 28, 18–26. [Google Scholar] [CrossRef]
- Postigo, V.; García, M.; Cabellos, J.M.; Arroyo, T. Wine Saccharomyces Yeasts for Beer Fermentation. Fermentation 2021, 7, 290. [Google Scholar] [CrossRef]
- Postigo, V.; Sánchez, A.; Cabellos, J.M.; Arroyo, T. New Approaches for the Fermentation of Beer: Non-Saccharomyces Yeasts from Wine. Fermentation 2022, 8, 280. [Google Scholar] [CrossRef]
- Hughes, P.S.; Baxter, E.D. Beer: Quality, Safety and Nutritional Aspects; Royal Society of Chemistry: Cambridge, UK, 2001; ISBN 0854045880. [Google Scholar]
- Pinho, O.; Ferreira, I.M.P.L.V.O.; Santos, L.H.M.L.M. Method Optimization by Solid-Phase Microextraction in Combination with Gas Chromatography with Mass Spectrometry for Analysis of Beer Volatile Fraction. J. Chromatogr. A 2006, 1121, 145–153. [Google Scholar] [CrossRef]
- Hill, P.G.; Smith, R.M. Determination of Sulphur Compounds in Beer Using Headspace Solid-Phase Microextraction and Gas Chromatographic Analysis with Pulsed Flame Photometric Detection. J. Chromatogr. A 2000, 872, 203–213. [Google Scholar] [CrossRef]
- Tressl, R.; Friese, L.; Fendesack, F.; Koeppler, H. Gas Chromatographic-Mass Spectrometric Investigation of Hop Aroma Constituents in Beer. J. Agric. Food Chem. 1978, 26, 1422–1426. [Google Scholar] [CrossRef]
- Galafassi, S.; Merico, A.; Pizza, F.; Hellborg, L.; Molinari, F.; Piškur, J.; Compagno, C. Dekkera/Brettanomyces Yeasts for Ethanol Production from Renewable Sources under Oxygen-Limited and Low-PH Conditions. J. Ind. Microbiol. Biotechnol. 2011, 38, 1079–1088. [Google Scholar] [CrossRef]
- Gamero, A.; Ferreira, V.; Pretorius, I.S.; Querol, A. Wine, Beer and Cider: Unravelling the Aroma Profile. In Molecular Mechanisms in Yeast Carbon Metabolism; Springer: Berlin/Heidelberg, Germany, 2014; pp. 261–297. [Google Scholar]
- Verachtert, H. Lambic and Gueuze Brewing: Mixed Cultures in Action. COMETT Course Microb. Contam. Hels. 1992, 243–262. [Google Scholar]
- Constant, M.; Collier, J. Headspace Gas Chromatography Profiles of Fruit-Flavored Malt Beverages Using Solid-Phase MicroExtraction. J. Am. Soc. Brew. Chem. 1997, 55, 112–118. [Google Scholar] [CrossRef]
- Meilgaard, M.; Elizondo, A.; Moya, E. A Study of Carbonyl Compounds in Beer, Part II. Flavor and Flavor Thresholds of Aldehydes and Ketones Added to Beer. Tec. Q. Master Brew. Assac. Am. 1970, 7, 143–149. [Google Scholar]
- Goode, J. Brettanomyces. In The Science of Wine, from Vine to Glass; University of California Press: Berkeley, CA, USA, 2005. [Google Scholar]
- Godoy, L.; Garrido, D.; Martínez, C.; Saavedra, J.; Combina, M.; Ganga, M.A. Study of the Coumarate Decarboxylase and Vinylphenol Reductase Activities of Dekkera bruxellensis (Anamorph Brettanomyces bruxellensis) Isolates. Lett. Appl. Microbiol. 2009, 48, 452–457. [Google Scholar] [CrossRef]
- Sterckx, F.L.; Missiaen, J.; Saison, D.; Delvaux, F.R. Contribution of Monophenols to Beer Flavour Based on Flavour Thresholds, Interactions and Recombination Experiments. Food Chem. 2011, 126, 1679–1685. [Google Scholar] [CrossRef]
- Que, Z.; Ma, T.; Shang, Y.; Ge, Q.; Zhang, Q.; Xu, P.; Zhang, J.; Francoise, U.; Liu, X.; Sun, X. Microorganisms: Producers of Melatonin in Fermented Foods and Beverages. J. Agric. Food Chem. 2020, 68, 4799–4811. [Google Scholar] [CrossRef] [PubMed]
- Postigo, V.; Esteban, S.; Arroyo, T. Lachancea thermotolerans, an Innovative Alternative for Sour Beer Production. Beverages 2023, 9, 20. [Google Scholar] [CrossRef]
- Pai, T.V.; Sawant, S.Y.; Ghatak, A.A.; Chaturvedi, P.A.; Gupte, A.M.; Desai, N.S. Characterization of Indian Beers: Chemical Composition and Antioxidant Potential. J. Food Sci. Technol. 2015, 52, 1414–1423. [Google Scholar] [CrossRef] [PubMed]
- Callejo, M.J.; González, C.; Morata, A. Use of Non-Saccharomyces Yeasts in Bottle Fermentation of Aged Beers. In Brewing Technology; IntechOpen: London, UK, 2017; pp. 101–119. [Google Scholar]
- Lytra, G.; Tempere, S.; Le Floch, A.; de Revel, G.; Barbe, J.-C. Study of Sensory Interactions among Red Wine Fruity Esters in a Model Solution. J. Agric. Food Chem. 2013, 61, 8504–8513. [Google Scholar] [CrossRef]
- Meilgaard, M. Flavor Chemistry of Beer. I. Flavor Interaction between Principal Volatiles. Master Brew. Assoc. Am. Technol. Q. 1975, 12, 107–117. [Google Scholar]
- San-Juan, F.; Ferreira, V.; Cacho, J.; Escudero, A. Quality and Aromatic Sensory Descriptors (Mainly Fresh and Dry Fruit Character) of Spanish Red Wines Can Be Predicted from Their Aroma-Active Chemical Composition. J. Agric. Food Chem. 2011, 59, 7916–7924. [Google Scholar] [CrossRef] [PubMed]
- Wu, J.; Liu, Y.; Zhao, H.; Huang, M.; Sun, Y.; Zhang, J.; Sun, B. Recent Advances in the Understanding of Off-Flavors in Alcoholic Beverages: Generation, Regulation, and Challenges. J. Food Compos. Anal. 2021, 103, 104117. [Google Scholar] [CrossRef]
- Haslbeck, K.; Bub, S.; von Kamp, K.; Michel, M.; Zarnkow, M.; Hutzler, M.; Coelhan, M. The Influence of Brewing Yeast Strains on Monoterpene Alcohols and Esters Contributing to the Citrus Flavour of Beer. J. Inst. Brew. 2018, 124, 403–415. [Google Scholar] [CrossRef]


| Microorganism | Strain | Origin |
|---|---|---|
| Brettanomyces bruxellensis | Doemens, Munich, Germany | |
| Brettanomyces lambicus | Doemens, Munich, Germany | |
| Brettanomyces bruxellensis | RS15/CR002_1 (B1) | D.O. “Ribeira Sacra”, Galicia, Spain |
| Brettanomyces bruxellensis | RS16/CR001-T2_1 (B2) | D.O. “Ribeira Sacra”, Galicia, Spain |
| Brettanomyces bruxellensis | RS16/CR003_1 (B3) | D.O. “Ribeira Sacra”, Galicia, Spain |
| Brettanomyces bruxellensis | RS16/CR003-T2 (B4) | D.O. “Ribeira Sacra”, Galicia, Spain |
| Brettanomyces bruxellensis | RS17/CR020 (B5) | D.O. “Ribeira Sacra”, Galicia, Spain |
| Brettanomyces bruxellensis | RS17/CR028 (B6) | D.O. “Ribeira Sacra”, Galicia, Spain |
| Saccharomyces cerevisiae | S-04 | Fermentis, Lesaffre, Marcq-en-Barœul France |
| Lactobacillus brevis | Doemens, Munich, Germany |
| Maturation Times | 1 Month | 2 Months | 6 Months | 12 Months | ||||
|---|---|---|---|---|---|---|---|---|
| A | B | A | B | A | B | A | B | |
| Isobutanol | 7.03 ± 0.39 b | 7.86 ± 1.10 b | 8.04 ± 0.30 b | 8.13 ± 0.02 ab | 7.68 ± 0.23 b | 7.59 ± 0.08 b | 11.27 ± 1.61 a | 10.04 ± 0.97 ab |
| Isoamyl alcohol | 35.12 ± 2.17 b | 41.56 ± 9.84 ab | 45.26 ± 1.10 ab | 44.19 ± 0.45 ab | 45.81 ± 0.37 ab | 44.97 ± 2.34 ab | 55.95 ± 2.88 a | 44.28 ± 6.85 ab |
| 1-hexanol | nd | 0.01 ± 0.00 b | nd | nd | nd | nd | 0.14 ± 0.02 a | 0.12 ± 0.02 a |
| Methionol | 0.08 ± 0.01 b | 0.07 ± 0.00 b | 0.10 ± 0.01 b | 0.10 ± 0.01 b | 0.05 ± 0.08 b | nd | 1.36 ± 0.01 a | 1.30 ± 0.19 a |
| β-phenylethanol | 2.81 ± 0.26 b | 2.86 ± 0.04 b | 4.48 ± 0.09 b | 4.76 ± 0.65 b | 4.50 ± 0.40 b | 3.93 ± 0.33 b | 10.57 ± 1.36 a | 9.45 ± 0.82 a |
| Total higher alcohols | 45.04 ± 2.84 | 52.36 ± 10.98 | 57.88 ± 1.50 | 57.18 ± 1.13 | 47.24 ± 1.28 | 42.50 ± 2.76 | 79.29 ± 5.88 | 65.19 ± 8.85 |
| Ethyl butyrate | nd | nd | nd | nd | nd | nd | 0.13 ± 0.01 a | 0.06 ± 0.09 a |
| Ethyl isovalerate | 0.08 ± 0.01 a | 0.09 ± 0.00 a | 0.08 ± 0.09 a | 0.08 ± 0.00 a | 0.09 ± 0.00 a | 0.09 ± 0.00 a | 0.08 ± 0.02 a | 0.07 ± 0.00 a |
| Isoamyl acetate | nd | nd | nd | nd | nd | nd | 0.07 ± 0.01 a | 0.08 ± 0.01 a |
| Ethyl hexanoate | 0.04 ± 0.00 | 0.41 ± 0.53 | 0.05 ± 0.00 | 0.04 ± 0.00 | 0.06 ± 0.00 | 0.02 ± 0.03 | 0.10 ± 0.12 | 0.04 ± 0.01 |
| Ethyl octanoate | nd | nd | 0.02 ± 0.00 | 0.01 ± 0.00 | 0.02 ± 0.00 | 0.02 ± 0.00 | 0.24 ± 0.01 | 0.26 ± 0.03 |
| 2-phenylethyl acetate | nd | 0.00 ± 0.00 b | 0.00 ± 0.00 b | 0.00 ± 0.00 b | 0.00 ± 0.00 b | 0.00 ± 0.00 b | 0.01 ± 0.00 a | 0.01 ± 0.00 a |
| Total esters | 0.12 ± 0.01 | 0.50 ± 0.53 | 0.15 ± 0.09 | 0.13 ± 0.00 | 0.17 ± 0.00 | 0.13 ± 0.03 | 0.63 ± 0.20 | 0.52 ± 0.14 |
| Butyric acid | 0.02 ± 0.03 b | nd | 0.15 ± 0.01 b | 0.05 ± 0.08 b | 0.07 ± 0.00 b | 0.06 ± 0.00 b | 2.04 ± 0.05 a | 1.94 ± 0.44 a |
| Isovaleric acid | 0.00 ± 0.00 b | 0.00 ± 0.00 b | 0.01 ± 0.00 b | 0.01 ± 0.00 b | 0.01 ± 0.00 b | 0.01 ± 0.00 b | 5.59 ± 0.20 a | 4.72 ± 1.28 a |
| Hexanoic acid | 0.67 ± 0.07 b | 0.93 ± 0.03 b | 0.79 ± 0.18 b | 0.73 ± 0.00 b | 0.93 ± 0.23 b | 1.09 ± 0.06 ab | 1.58 ± 0.07 a | 1.60 ± 0.21 a |
| Octanoic acid | 0.97 ± 0.09 | 1.99 ± 0.07 | 1.28 ± 0.37 | 1.22 ± 0.03 | 1.60 ± 0.75 | 2.12 ± 0.06 | 1.81 ± 0.50 | 2.30 ± 0.12 |
| Decanoic acid | 0.10 ± 0.04 ab | 0.07 ± 0.00 b | 0.18 ± 0.03 ab | 0.14 ± 0.03 ab | 0.16 ± 0.01 ab | 0.14 ± 0.03 ab | 0.23 ± 0.07 a | 0.22 ± 0.06 ab |
| Total fatty acids | 1.77 ± 0.17 | 3.00 ± 0.11 | 2.41 ± 0.60 | 2.15 ± 0.08 | 2.77 ± 0.97 | 3.41 ± 0.09 | 11.26 ± 0.49 | 10.78 ± 2.11 |
| Diacetyl | nd | nd | 0.33 ± 0.03 | 0.20 ± 0.29 | 0.18 ± 0.02 | nd | nd | nd |
| Furfural | nd | nd | 0.02 ± 0.01 a | nd | nd | nd | nd | nd |
| Acetoin | nd | nd | nd | nd | nd | nd | nd | 0.45 ± 0.01 a |
| Benzaldehyde | 0.01 ± 0.01 | 0.04 ± 0.01 | 0.02 ± 0.02 | 0.01 ± 0.01 | 0.04 ± 0.02 | 0.04 ± 0.01 | nd | nd |
| T. aldehydes/ ketones | 0.01 ± 0.01 | 0.04 ± 0.01 | 0.35 ± 0.05 | 0.22 ± 0.30 | 0.22 ± 0.04 | 0.04 ± 0.01 | nd | 0.45 ± 0.01 |
| γ-Butyrolactone | 2.62 ± 0.00 b | 2.62 ± 0.00 b | nd | nd | 2.62 ± 0.00 b | 2.62 ± 0.00 b | 7.20 ± 0.24 a | 6.67 ± 0.34 a |
| Guaiacol | 0.03 ± 0.00 | 0.03 ± 0.00 | 0.05 ± 0.01 | 0.05 ± 0.00 | 0.05 ± 0.01 | 0.03 ± 0.04 | 0.09 ± 0.05 | 0.06 ± 0.00 |
| Yeast Strains | Q1 | Q2 | Qt | |
|---|---|---|---|---|
| 1 month | A | 3.41 ± 0.68 a | 6.50 ± 2.40 a | 9.91 ± 3.09 a |
| B | 3.61 ± 0.37 a | 6.32 ± 0.39 a | 9.93 ± 0.76 a | |
| 2 months | A | 2.78 ± 0.16 a | 6.28 ± 0.48 a | 10.06 ± 0.32 a |
| B | 3.62 ± 0.21 a | 6.57 ± 0.96 a | 10.19 ± 1.17 a | |
| 6 months | A | 4.09 ± 0.47 a | 8.12 ± 0.84 a | 12.20 ± 1.31 a |
| B | 4.02 ± 0.93 a | 7.46 ± 1.80 a | 11.48 ± 2.73 a | |
| 12 months | A | 4.31 ± 0.06 a | 8.72 ± 0.34 a | 13.03 ± 0.40 a |
| B | 4.31 ± 0.39 a | 11.25 ± 4.20 a | 15.56 ± 3.81 a | |
Disclaimer/Publisher’s Note: The statements, opinions and data contained in all publications are solely those of the individual author(s) and contributor(s) and not of MDPI and/or the editor(s). MDPI and/or the editor(s) disclaim responsibility for any injury to people or property resulting from any ideas, methods, instructions or products referred to in the content. |
© 2023 by the authors. Licensee MDPI, Basel, Switzerland. This article is an open access article distributed under the terms and conditions of the Creative Commons Attribution (CC BY) license (https://creativecommons.org/licenses/by/4.0/).
Share and Cite
Postigo, V.; García, M.; Arroyo, T. Study of a First Approach to the Controlled Fermentation for Lambic Beer Production. Microorganisms 2023, 11, 1681. https://doi.org/10.3390/microorganisms11071681
Postigo V, García M, Arroyo T. Study of a First Approach to the Controlled Fermentation for Lambic Beer Production. Microorganisms. 2023; 11(7):1681. https://doi.org/10.3390/microorganisms11071681
Chicago/Turabian StylePostigo, Vanesa, Margarita García, and Teresa Arroyo. 2023. "Study of a First Approach to the Controlled Fermentation for Lambic Beer Production" Microorganisms 11, no. 7: 1681. https://doi.org/10.3390/microorganisms11071681
APA StylePostigo, V., García, M., & Arroyo, T. (2023). Study of a First Approach to the Controlled Fermentation for Lambic Beer Production. Microorganisms, 11(7), 1681. https://doi.org/10.3390/microorganisms11071681