Article

Effects of LPS from Rhodobacter sphaeroides, a Purple Non-Sulfur Bacterium (PNSB), on the Gene Expression of Rice Root

1
Department of Applied Life Science, Sojo University, 4-22-1 Ikeda, Nishiku, Kumamoto 860-0082, Japan
2
Ciamo Co., Ltd., G-2F Sojo University, 4-22-1 Ikeda, Nishiku, Kumamoto 860-0082, Japan
*
Author to whom correspondence should be addressed.
Microorganisms 2023, 11(7), 1676; https://doi.org/10.3390/microorganisms11071676
Submission received: 9 May 2023 / Revised: 18 June 2023 / Accepted: 26 June 2023 / Published: 28 June 2023
(This article belongs to the Special Issue Biotechnological Application of Photosynthetic Bacteria 2.0)

Abstract

:
The effects of lipopolysaccharide (LPS) from Rhodobacter sphaeroides, a purple non-sulfur bacterium (PNSB), on the gene expression of the root of rice (Oryza sativa) were investigated by next generation sequencing (NGS) RNA-seq analysis. The rice seeds were germinated on agar plates containing 10 pg/mL of LPS from Rhodobacter sphaeroides NBRC 12203 (type culture). Three days after germination, RNA samples were extracted from the roots and analyzed by RNA-seq. The effects of dead (killed) PNSB cells of R. sphaeroides NBRC 12203T at the concentration of 101 cfu/mL (ca. 50 pg cell dry weight/mL) were also examined. Clean reads of NGS were mapped to rice genome (number of transcript ID: 44785), and differentially expressed genes were analyzed by DEGs. As a result of DEG analysis, 300 and 128 genes, and 86 and 8 genes were significantly up- and down-regulated by LPS and dead cells of PNSB, respectively. The plot of logFC (fold change) values of the up-regulated genes of LPS and PNSB dead cells showed a significant positive relationship (r2 = 0.6333, p < 0.0001), indicating that most of the effects of dead cell were attributed to those of LPS. Many genes related to tolerance against biotic (fungal and bacterial pathogens) and abiotic (cold, drought, and high salinity) stresses were up-regulated, and the most strikingly up-regulated genes were those involved in the jasmonate signaling pathway, and the genes of chalcone synthase isozymes, indicating that PNSB induced defense response against biotic and abiotic stresses via the jasmonate signaling pathway, despite the non-pathogenicity of PNSB.

1. Introduction

Purple non-sulfur bacteria (PNSB) are one of the various phototrophic microorganisms [1,2]. PNSB have photosynthetic reaction centers and light-absorbing pigments (bacteriochlorophyll and carotenoids) to convert light energy into chemical energy (ATP). Unlike cyanobacteria, PNSB do not use water as an electron donor for photochemical reaction, and do not emit oxygen. This type of photosynthesis is called anoxygenic photosynthesis. PNSB are facultative anaerobes and relatively easy to cultivate. PNSB are Gram-negative bacteria. Gram-negative bacteria are sometimes pathogenic, but to our knowledge, there has been no report of pathogenic PNSB and there have been no reports of opportunistic infection by PNSB in humans. PNSB have a wide variety of biotechnological applications in agriculture [3,4,5], aquaculture [6,7], biomaterial production [8,9,10], renewable energy production [11,12], wastewater treatment [13], and bioremediation [14].
The most widespread application of PNSB is the promotion of plant growth and the improvement of the quality of food crops. The mechanisms for the promotion of plant growth by the PNSB have been the subject of intensive studies [3,15], and the mechanisms can be classified under (1) the biological activities of the PNSB and (2) the production of various beneficial (promoting plant growth) substances by the PNSB. The biological activities include nitrogen fixation, solubilization of soil phosphate, and degradation of toxic hydrogen sulfide. PNSB also suppresses the generation of methane, a greenhouse gas, from paddy fields by competing organic substrates with methanogenic bacteria [16]. The beneficial substances produced by PNSB include polyphosphate, pigments, vitamins, and plant growth-promoting substances (PGPSs), such as indole-3-acetic acid (IAA), a plant hormone, and 5-aminolevulinic acid (ALA). ALA is a plant growth regulator that assists in plant growth and yield and alleviates various abiotic stresses [17].
In addition to these aforementioned mechanisms, we recently proposed lipopolysaccharide (LPS), a component of the Gram-negative bacterial cell wall, as a new active ingredient in PNSB [18,19]. Hayashi et al. [18] reported the growth-promoting effect of lipopolysaccharide (LPS) from PNSB in plants for the first time, and the effective concentration of LPS from Rhodobacter sphaeroides NBRC 12203T was 10 pg/mL. Iwai et al. [19] reported that biopriming of rice seeds by LPS from R. sphaeroides NBRC 12203T at a concentration of 5 ng/mL improved the root growth of rice seedlings, providing further evidence of the effectiveness of LPS from PNSB in plants. In mammals, LPS acts as an endotoxin, causing inflammatory responses through a TLR4-like signaling pathway at concentrations ranging from pg/mL to ng/mL. In plants, the receptor for LPS, known as lipooligosaccharide-specific reduced elicitation (LORE), has been identified [20], but compared to mammals, plants are believed to be much less sensitive to LPS [21]. There have been many reports on the effects of LPSs on plant cells and tissues, and these effects include reactive oxygen species (ROS) generation [22,23,24], induction of secondary metabolites production [25], induction of resistance to plant pathogens, such as fungi [26] and nematode [27], and growth promotion [28]. In all of these previous studies reporting the effects of LPSs from various Gram-negative bacteria on plants, the effective LPS concentration was 10 to 100 μg/mL or higher, which was a thousand to a million times higher than the effective concentration range (pg/mL to ng/mL) in mammals. Thus the much lower effective concentration of LPSs from R. sphaeroides NBRC 12203T in plants than those of other various Gram-negative bacteria is of great interest in terms of biotechnological application of PNSB in agriculture. Additionally of great interest, in terms of basic biology, for example, what kind of genes are induced by LPSs from PNSB, and how different (or similar) are they to those induced by the other members of LPSs. In this study, to better understand the effects of LPS from R. sphaeroides NBRC 12203T in plants, we examined its effects on the gene expression of the roots of rice by RNA-seq analyses.

2. Materials and Methods

2.1. Rice Cultivar

A rice (Oryza sativa) cultivar, Akita-komachi, was used, and the seeds were purchased from Noken Co., Ltd., Kyoto, Japan.

2.2. PNSB Strain and LPS

Rhodobacter sphaeroides NBRC 12203T, the type culture of Rhodobacter sphaeroides, was obtained from the NBRC (Biological Resource Center, NITE, Kisarazu, Japan) culture collection. LPS of R. sphaeroides ATCC 17,023 [29] was purchased from InvivoGen (San Diego, CA, USA). R. sphaeroides NBRC 12203T and R. sphaeroides ATCC 17,023 are the identical strains with different culture collection numbers. To avoid confusion, in the present paper, we call this LPS as LPS from R. sphaeroides NBRC 12203T.
For the preparation of dead (killed) PNSB cells, the cells were collected by centrifugation, and the cell pellet was dried at 60 °C for 6 h. Distilled water was added to the dried cell pellet, and the pellet was disrupted by sonication.

2.3. Cultivation of Rice Seedlings on Agar Plates

Rice seeds were surface sterilized by immersion in 70% (v/v) ethanol for 2 min followed by 2% sodium hypochlorite for 20 min. The seeds were germinated on no nutrient agar (0.8%) square plates (140 mm × 100 mm × 14.5 mm, Tokyo Garasu Kikai Co., Ltd., Tokyo, Japan), and the seedlings were grown on vertically oriented plates at 28 °C in the dark.

2.4. Analysis of Root Development by WinRhizo Image Analyzing System

Analysis of root development by WinRhizo image analyzing system was carried out as described previously [19]. Root images were acquired using a scanner (Epson GT-X970, Seiko Epson Co., Ltd., Suwa, Japan), and analyzed by automatic image processing with WinRhizo software (version 2019a, Regent Instruments, Québec, QC, Canada). Data on total root length, root surface area, and number of root tips were used for analysis.

2.5. RNA Extraction and RNA-seq

For RNA extraction, the roots were ground to powder in the presence of liquid nitrogen, and RNA samples were isolated using Isogen (Nippon Gene Co., Ltd., Tokyo, Japan). Briefly, the powdered samples were homogenized in Isogen using a homogenizer (Physcotron, Microtech Co., Ltd., Funabashi, Japan), and the RNA samples were then purified using the RNeasy kit (Qiagen, Venlo, The Netherlands) and treated with RNase-free DNase (Qiagen). For each condition, three biological replicates were used. Isolation of mRNA and cDNA synthesis was carried out by using NEBNext® Poly(A) mRNA Magnetic Isolation Module (NEB E7490) and NEBNext® Ultra RNA Library Prep Kit for Illumina® (E7530), respectively.
Next generation sequencing (NGS) analyses were conducted by Rhelixa (Tokyo, Japan). The NGS conditions were as follows: Sequence Mode: PE150 (150 bp × 2 paired-end), Instrument: Illumina NovaSeq 6000, Sofware: HiSeq Control Software 2.2.58, RTA 1.18.64, and bcl2fastq 1.8.4. The read numbers: 40.0 M reads per sample (20.0 M pairs). The raw paired-end reads were cleaned by using the Trimmomatic (ver. 0.38) program, and the cleaned reads were stored as FASTq format. The SRA accession numbers of the NGS data in GenBank/EMBL/DDBJ database are DRR450980, DRR450981, and DRR450982 for control, DRR450986, DRR450987, and DRR450988 for LPS from PNSB, and DRR450983, DRR450984, and DRR450985 for dead PNSB cells, respectively.
The rice genome IRGSP-1.0 (ver. 2021-05-10) was used for the reference sequences (number of transcript ID: 44,785), and the mapping of cleaned reads to the reference sequences was performed by HISAT2 (ver. 2.1.0). The log2 ratio of baseMean (baseMean: the mean of normalized counts of all samples) was used to calculate the fold-change in the expression of genes in two samples, and DESeq2 (1.24.0) was used to screen the differentially expressed genes (DEGs) as the criteria adjusted p-value (Padj) < 0.05.

2.6. Statistical Analysis

For statistical analyses, one-way ANOVA with a post hoc Duncan’s test was used for multiple comparison. To examine the relationship of logFC values of LPS and dead cells, Pearson’s correlation coefficient was calculated based on the distribution patterns of the two variables, and the significance of correlation coefficient was tested using the t-distribution.

3. Results

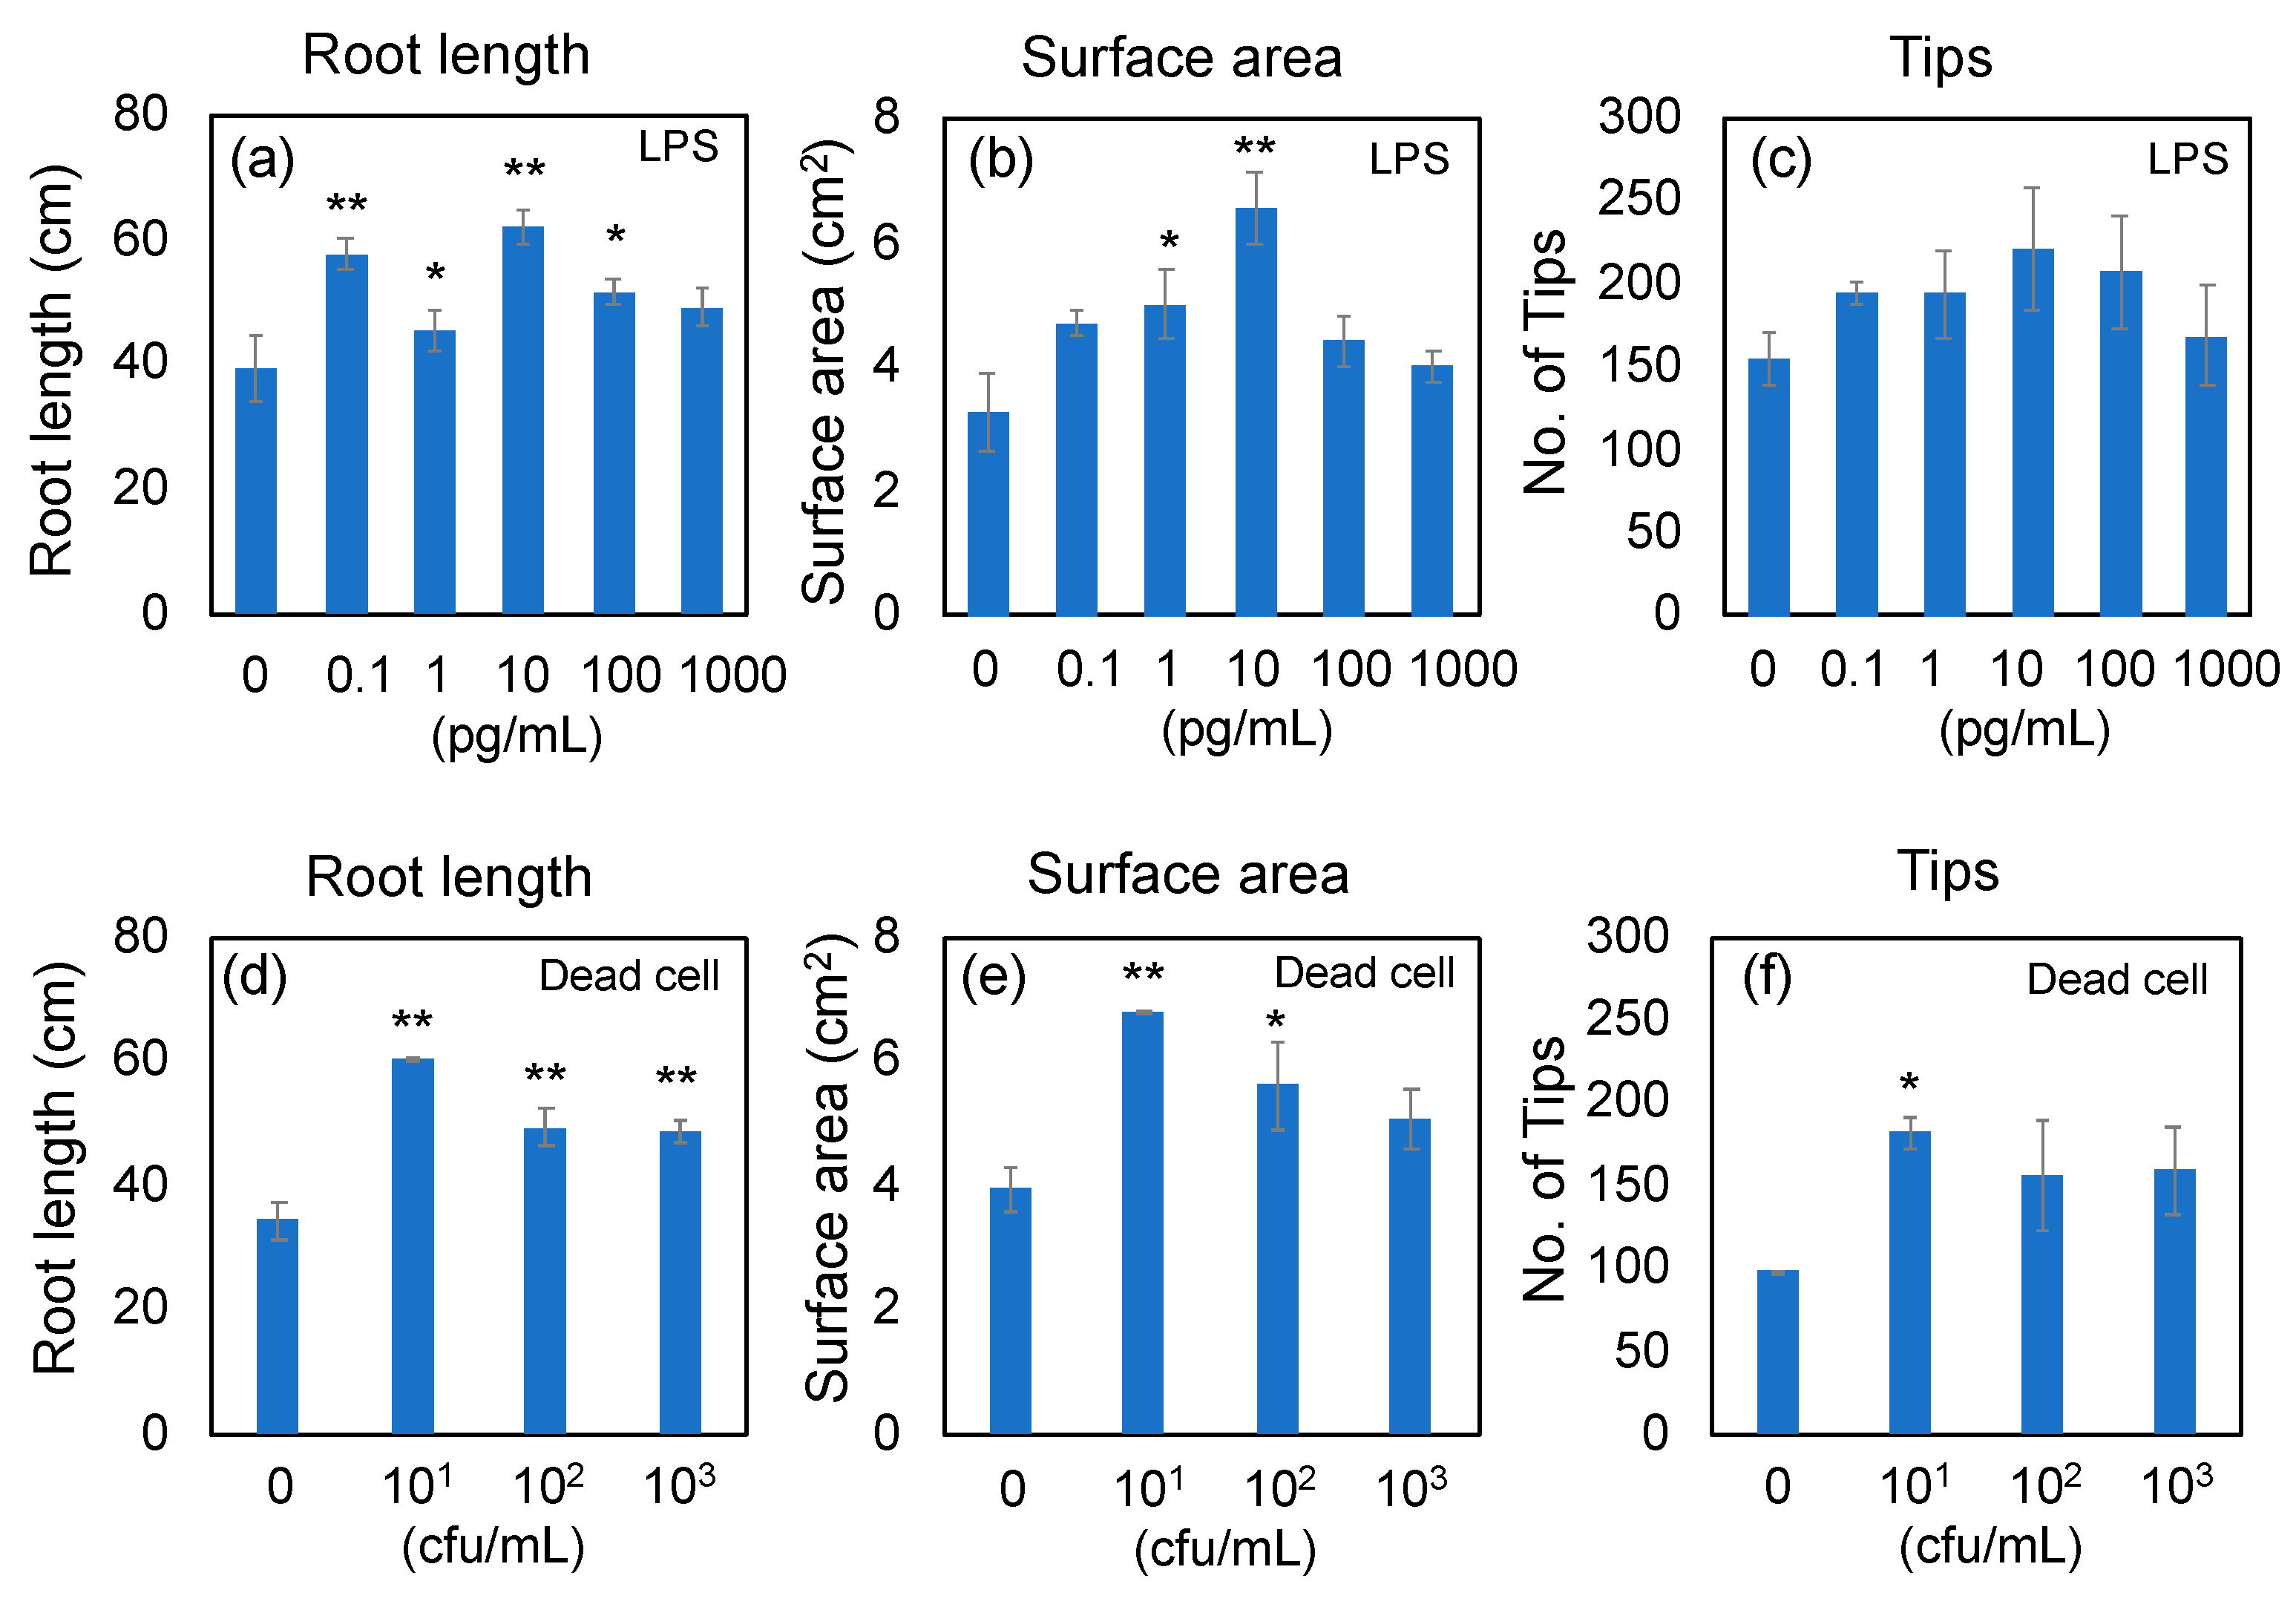
3.1. Effects of LPS from PNSB (R. sphaeroides NBRC 12203T) and Dead PNSB Cells on the Root Development of Rice Seedlings

To determine the concentrations of LPS and dead cells of PNSB for RNA-seq analyses, the rice seeds were aseptically germinated on agar plates containing LPS or dead cells, and grown for 7 days on vertically oriented plates. Root development of rice seedlings was assessed using WinRhizo imaging analyses. The root development was evaluated by total root length (Figure 1a,d), root surface area (Figure 1b,e), and number of root tips (Figure 1c,f). The effective concentration of LPS in root development was 10 pg/mL, and that of dead cells was 1 × 101 to 1 × 10² cfu/mL. Based on these results, the concentrations of LPS and dead cells for RNA-seq analyses were determined to 10 pg/mL and 1 × 101 cfu/mL, respectively. The effective concentration of LPS (10 pg/mL) was further confirmed by an additional experiment (n = 5; see Supplementary Figure S1a for the results of the WinRhizo analysis, and Figure S1b for scan images of the roots). The approximate LPS content of 1 × 101 cfu/mL condition was estimated to be 5 pg/mL from the following calculation. The cell dry weight (d.w.) of PNSB culture of 1 × 10⁹ cfu/mL (stationary phase culture) is about 5 mg/mL, and the cell d.w. for 1 × 101 cfu/mL culture is calculated to be 50 pg/mL. Bacterial LPS content would have been about 10% [30], and therefore the content of LPS in the cells of 1 × 101 cfu/mL (50 pg d.w./mL) can be estimated to be about 5 pg/mL.

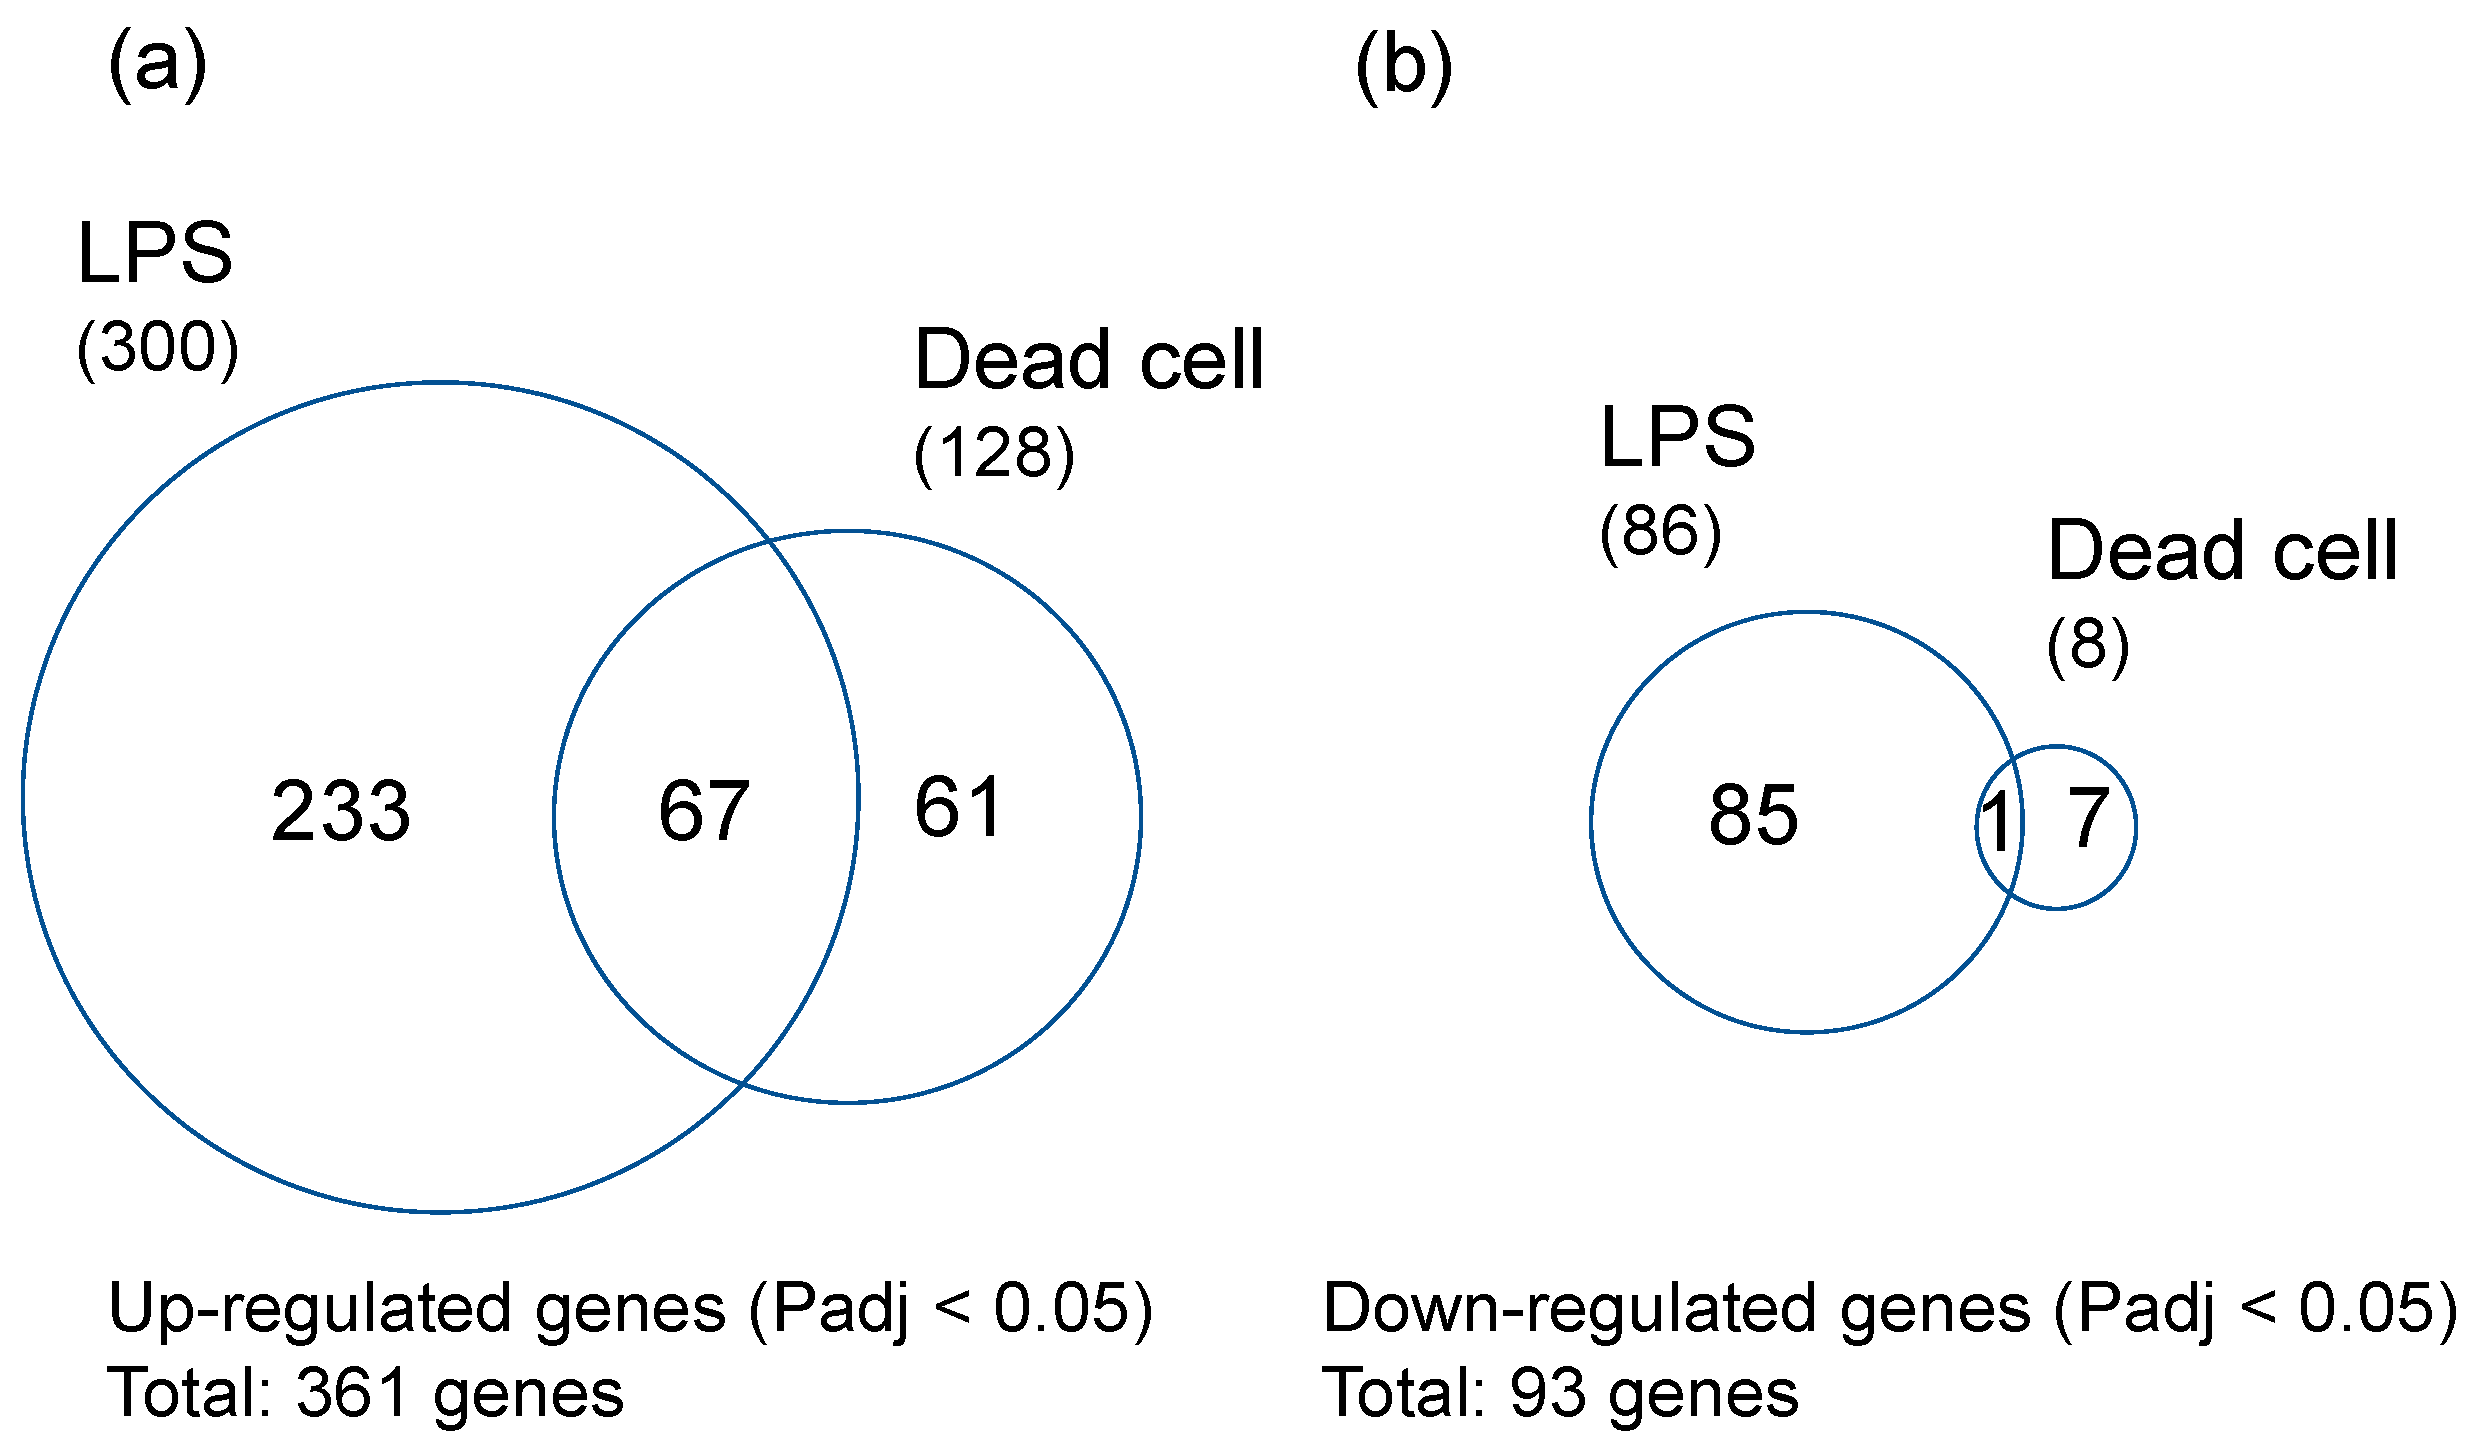
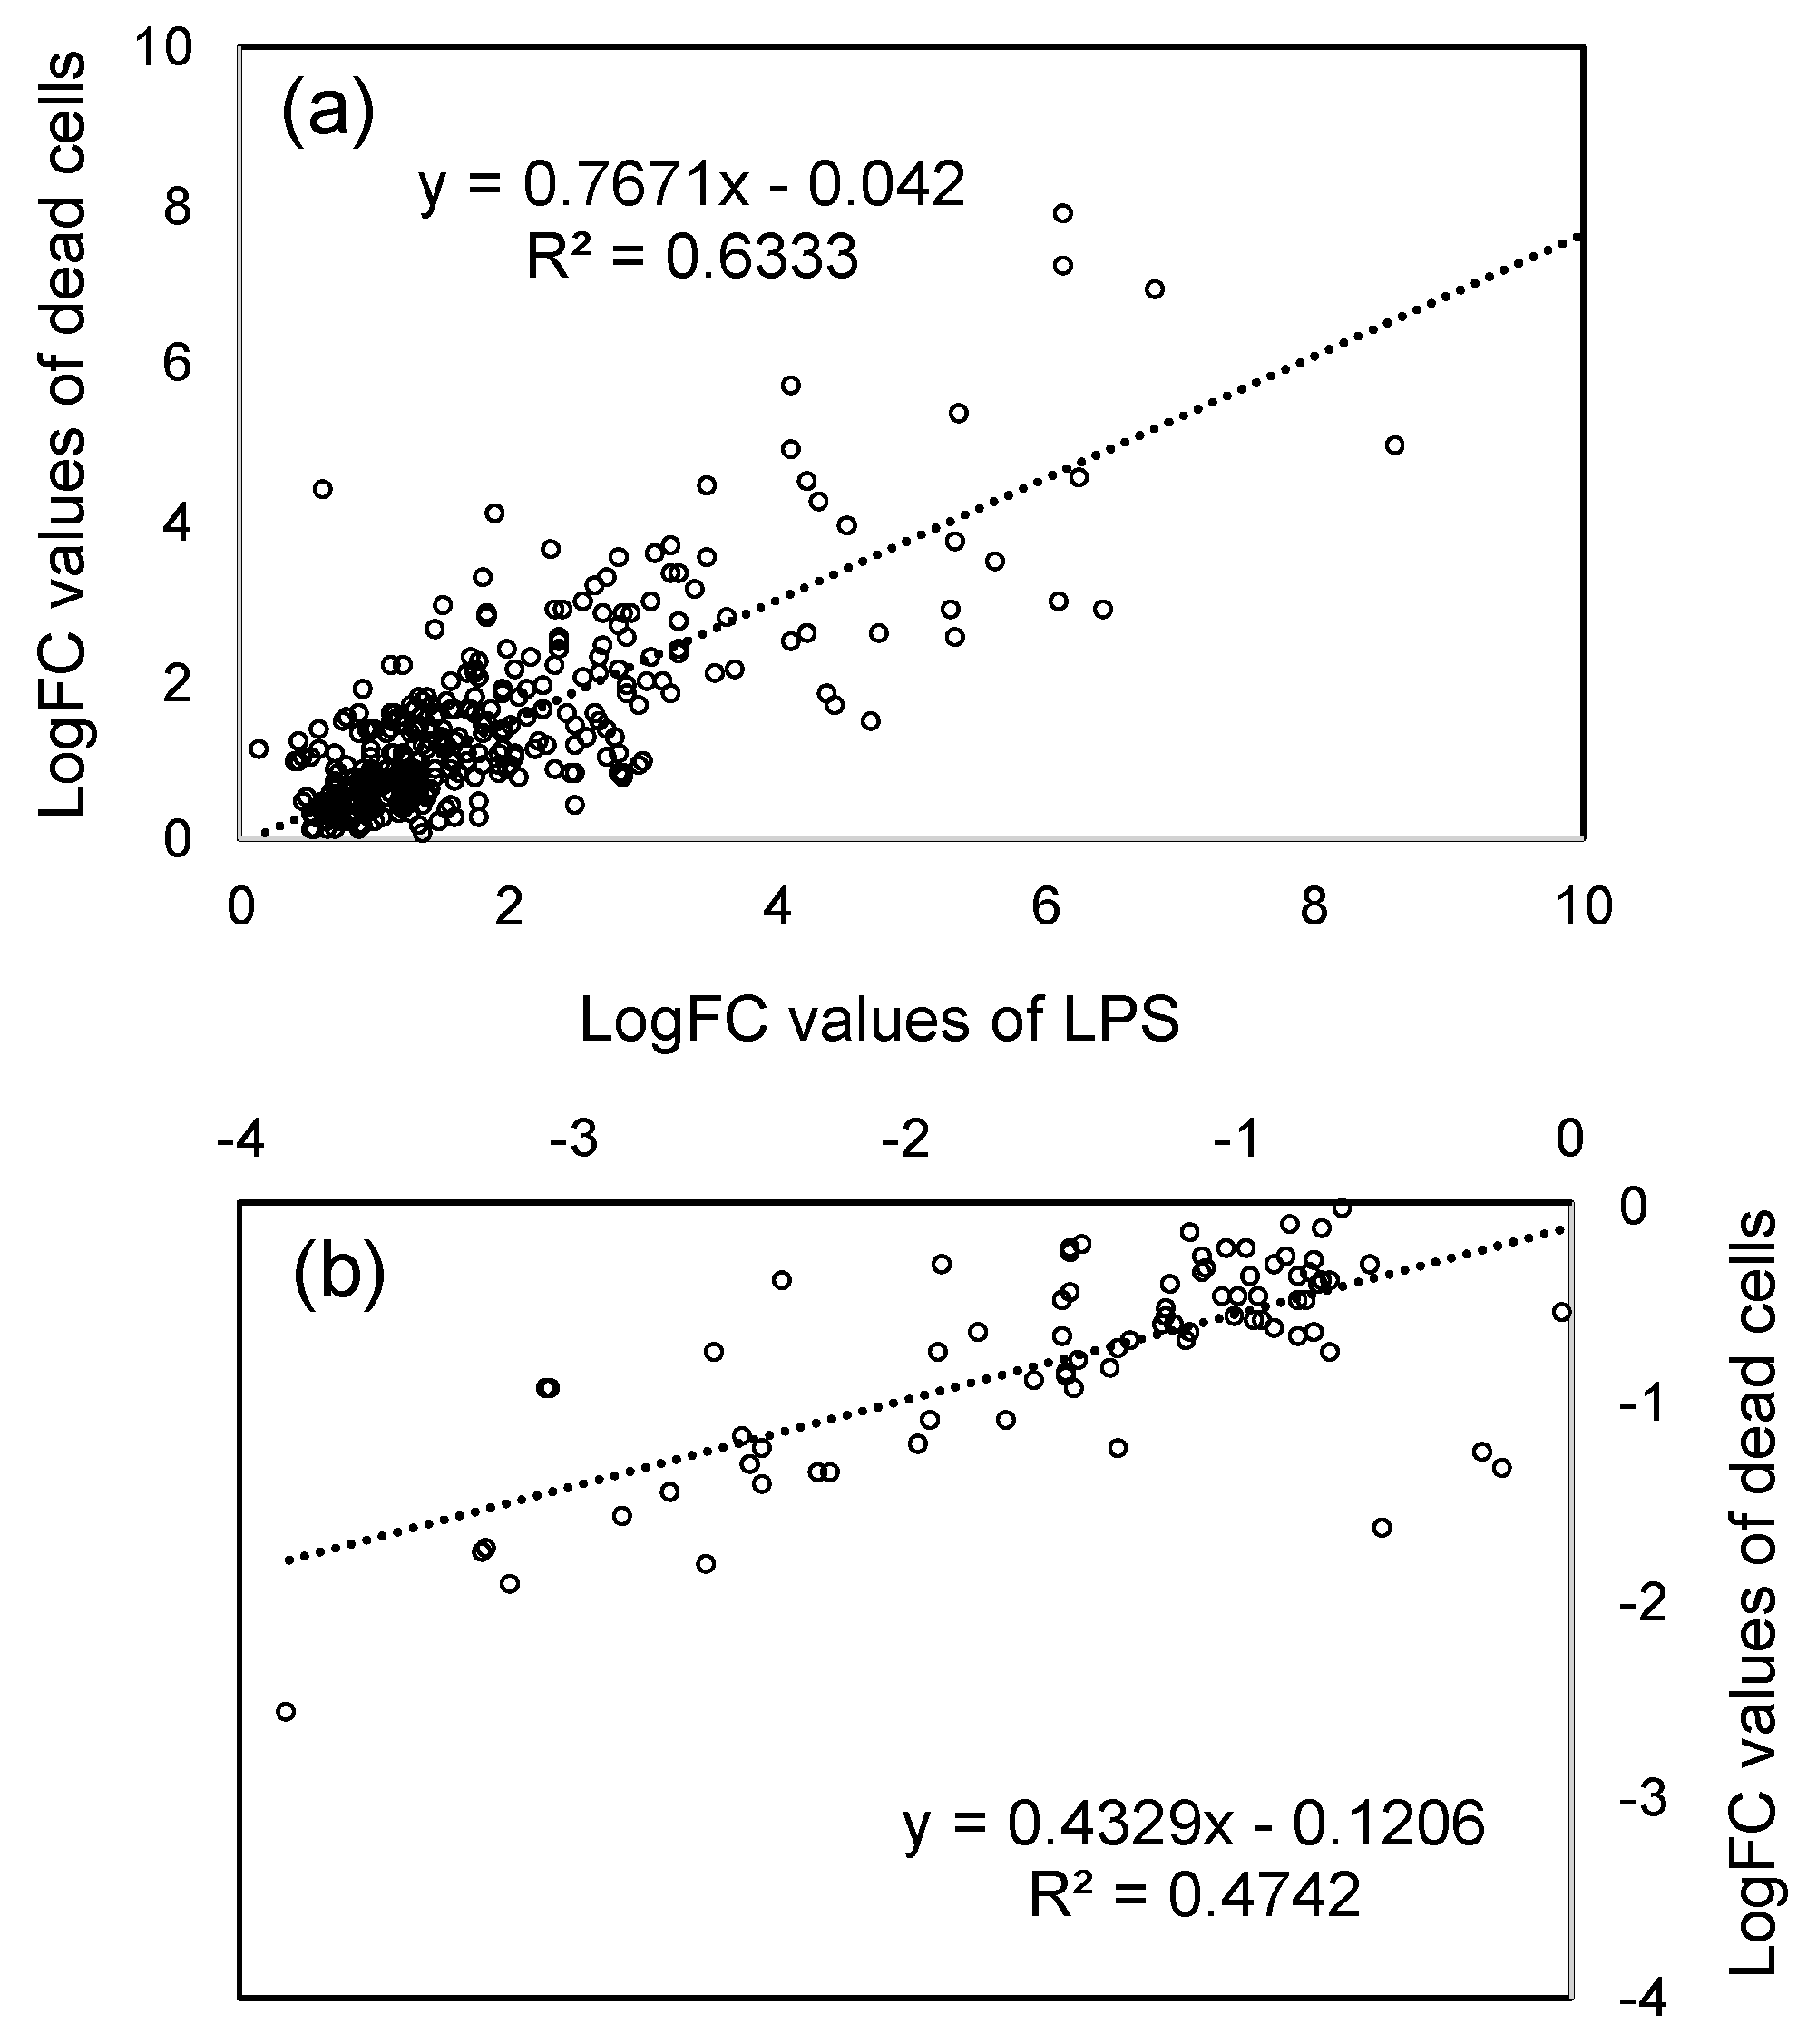
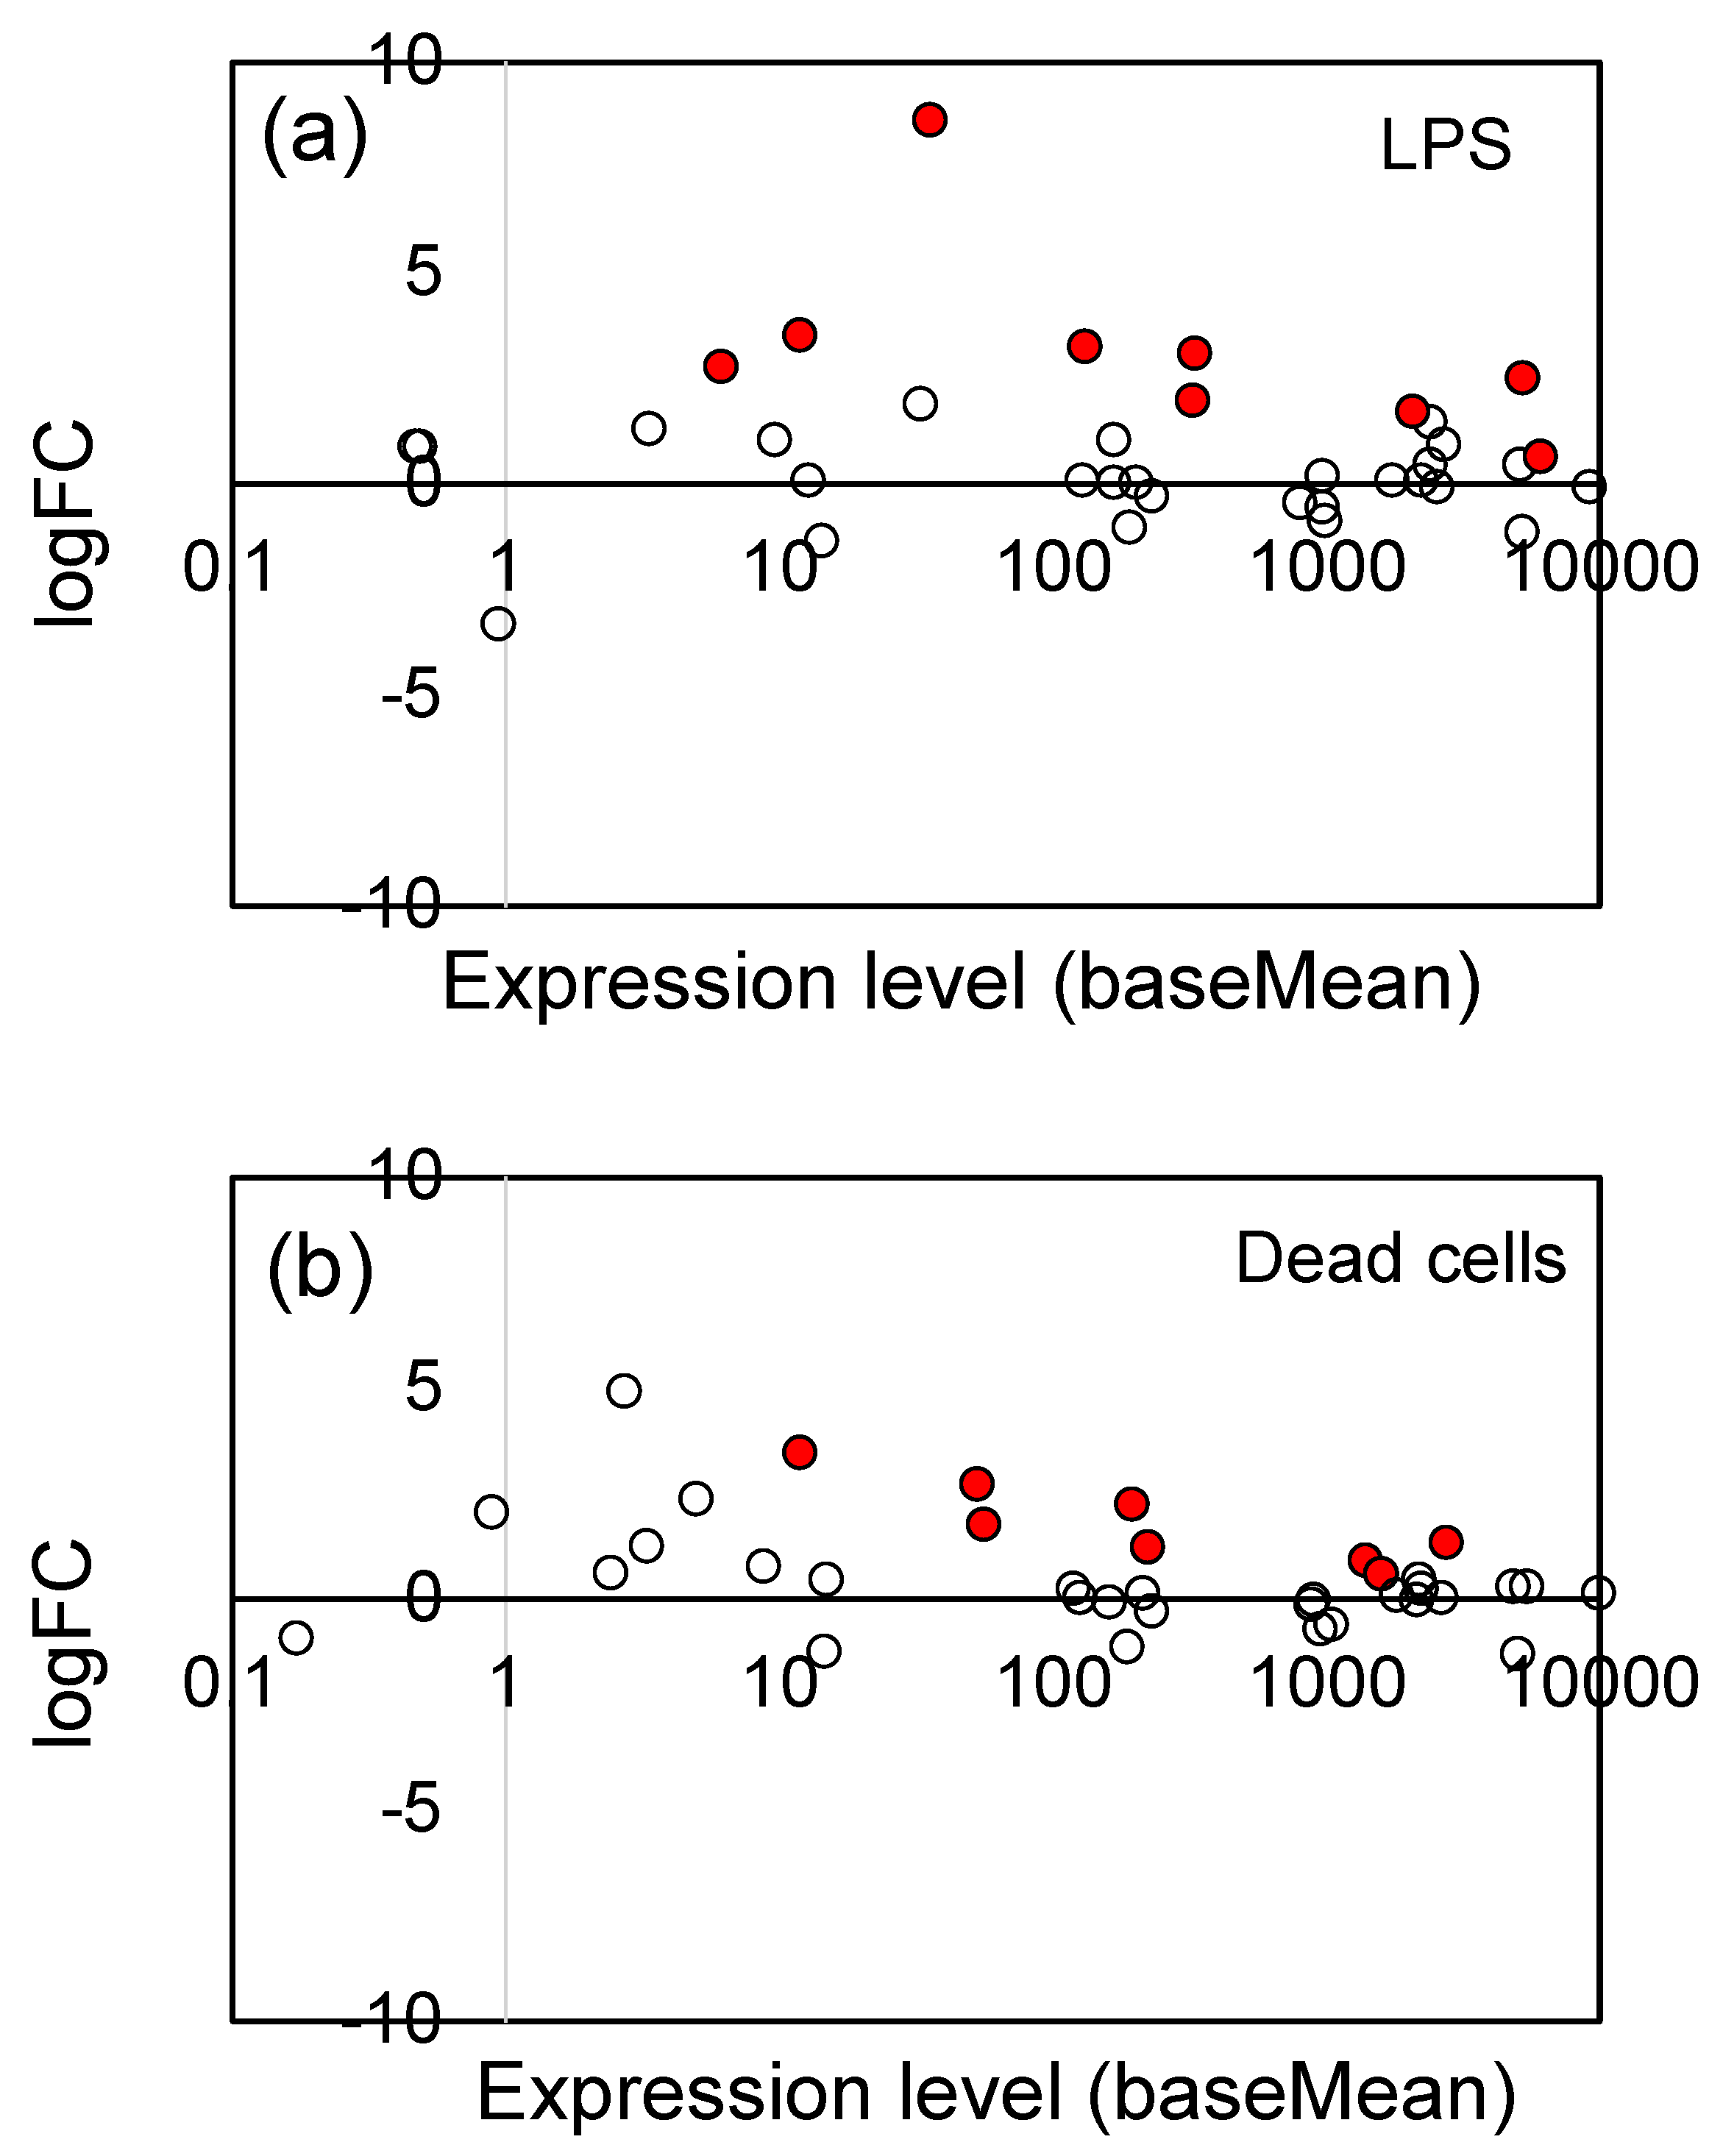
3.2. Effects of LPS from PNSB and Dead PNSB Cells on the Gene Expression of the Root of Rice Seedlings -RNA-Seq Analyses-

Rice seeds were germinated on agar plates containing LPS from PNSB (R. sphaeroides NBRC 12203T) at the concentration of 10 pg/mL or the dead PNSB cells at the concentration of 1 × 101 cuf/mL (50 pg d.w./mL). Three days after germination, the RNA samples were extracted from the roots and analyzed by RNA-seq. Clean reads of NGS were mapped to rice genome, and the numbers of mapped genes were 34,060 for both conditions. The numbers of significantly (Padj < 0.05) up-regulated genes were 300 and 128 for LPS and dead cells, respectively, and the numbers of significantly (Padj < 0.05) down-regulated genes were 86 and 8, respectively. Figure 2 shows the Venn diagrams of the significantly up- and down-regulated genes of rice roots treated by LPS and dead cells. The total number of significantly up-regulated genes was 361, and that for down-regulated genes was 93. The number of mutual genes of significantly up-regulated genes was 67, and that for down-regulated genes was 1.
The 67 significantly up-regulated mutual genes contain 47 genes with functional annotation and 20 genes with no functional annotation (hypothetical proteins). Table 1 shows the list of these 47 genes with functional annotation sorted by logFC values of LPS. Among the 47 significantly up-regulated genes, 45 genes were stress response-related genes, clearly indicating that LPS and dead cells induced stress response in rice root. The gene of highest logFC value was thionin [31], an antimicrobial peptide against root pathogens, and there were many biotic and abiotic stress-resistant genes, such as glucan endo-1,3-beta-glucosidase [32], germin-like protein [33], Bowman–Birk type protease inhibitor [34], and late embryogenesis abundant protein [35]. The most notable genes related to biotic and abiotic stress are the genes involved in the jasmonate (JA) signaling pathway (18 genes). The list of significantly up- or down-regulated genes (361 up-regulated and 93 down-regulated genes in Figure 2) is shown in Supplementary Table S1. Among these significantly up-regulated genes, there are many genes related to tolerance against biotic (fungal and bacterial pathogens) and abiotic (cold, drought, and high salinity) stresses. There are also some genes related to ethylene and abscisic acid (ABA) signaling.
The purpose of this study is to obtain further evidence for LPS as one of the active principles of PNSB. To compare the effects of LPS and dead cells at the gene expression level, the correlation between logFC value of both conditions was examined. Figure 3a shows the scatter plot of the logFC values of significantly up-regulated genes (361 genes in Figure 2) of LPS (horizontal axis) and dead cells (vertical axis), and Figure 3b shows that (93 genes in Figure 2) of significantly down-regulated genes. In both up-regulated and down-regulated genes, the logFC values showed a significant positive relationship between LPS and dead cells with p-values (Pearson’s correlation coefficient) of 8.31 × 10−78 and 8.70 × 10⁻¹³ for up-regulated and down-regulated genes, respectively. These results indicated that most of the effects of dead cells could be accounted for by those of LPS. These results also provided supporting evidence, in terms of gene expression, for LPS as one of the active principles of PNSB. The slope of the regression line for up-regulated genes (Figure 3a) was 0.7671, while that for down-regulated genes was 0.4329. This difference in slope values between up-regulated genes and down-regulated genes indicated that the LPS was acting more potently for down-regulation than up-regulation compared to dead cells.

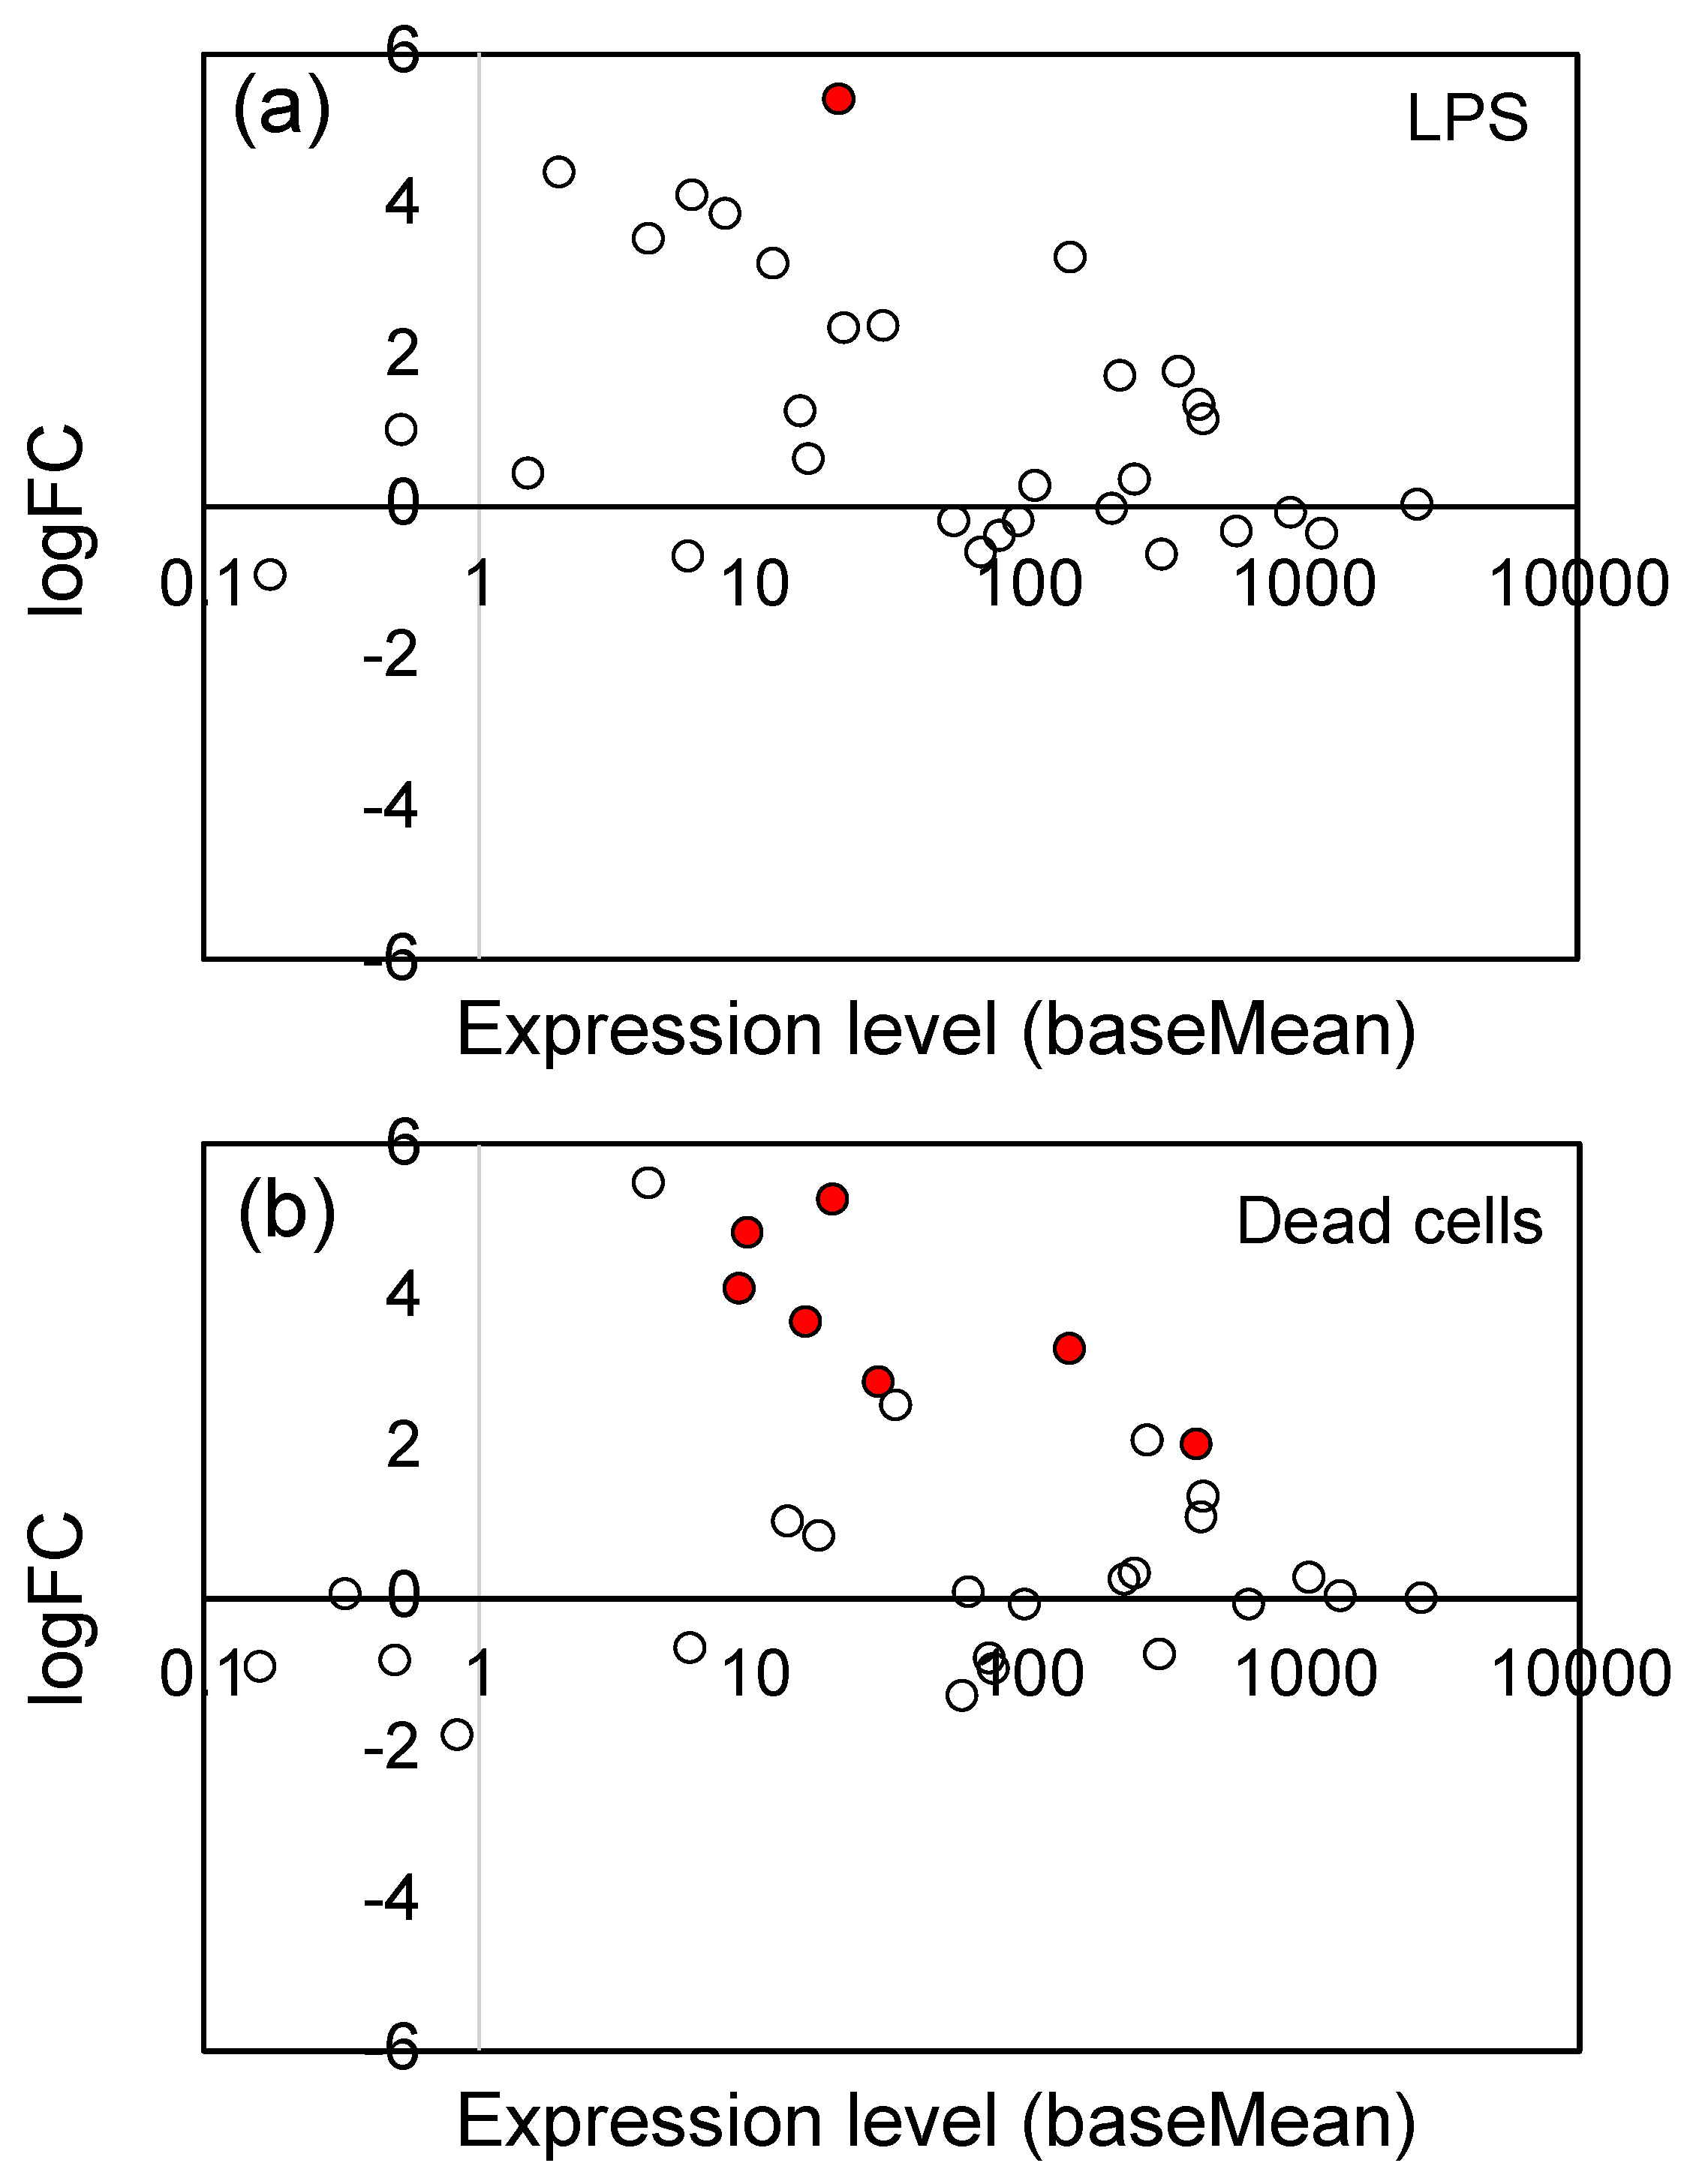
3.3. Effects of LPS from PNSB and Dead PNSB Cells on the Gene Expression of the Gene-Related JA Signaling Pathway

The jasmonates (JAs), including jasmonic acid and its derivatives, are plant hormones that control plant defenses against biotic stress, such as herbivore attack and pathogen infection [39,60]. They also play an important role in tolerance to abiotic stresses, including ozone, ultraviolet radiation, high temperatures, drought, and freezing [39,60]. As shown in Table 1, LPS and dead cells particularly stimulated the expression of genes associated with the JA signaling pathway. We examined the changes in gene expression of all genes related to the JA signaling pathway, including the genes which showed no significant change (Padj ≥ 0.05). Figure 4 shows the logFC values (vertical axis) and expression level (baseMean, horizontal axis) of 36 JA signaling pathway genes (see Supplementary Table S2 for the list of these genes). The significantly (Padj < 0.05) up-regulated genes were indicated by red circles. For both LPS (Figure 4a) and dead cells (Figure 4b), a general tendency for up-regulation was observed, indicating that LPS and dead cells stimulated the JA signaling pathway.

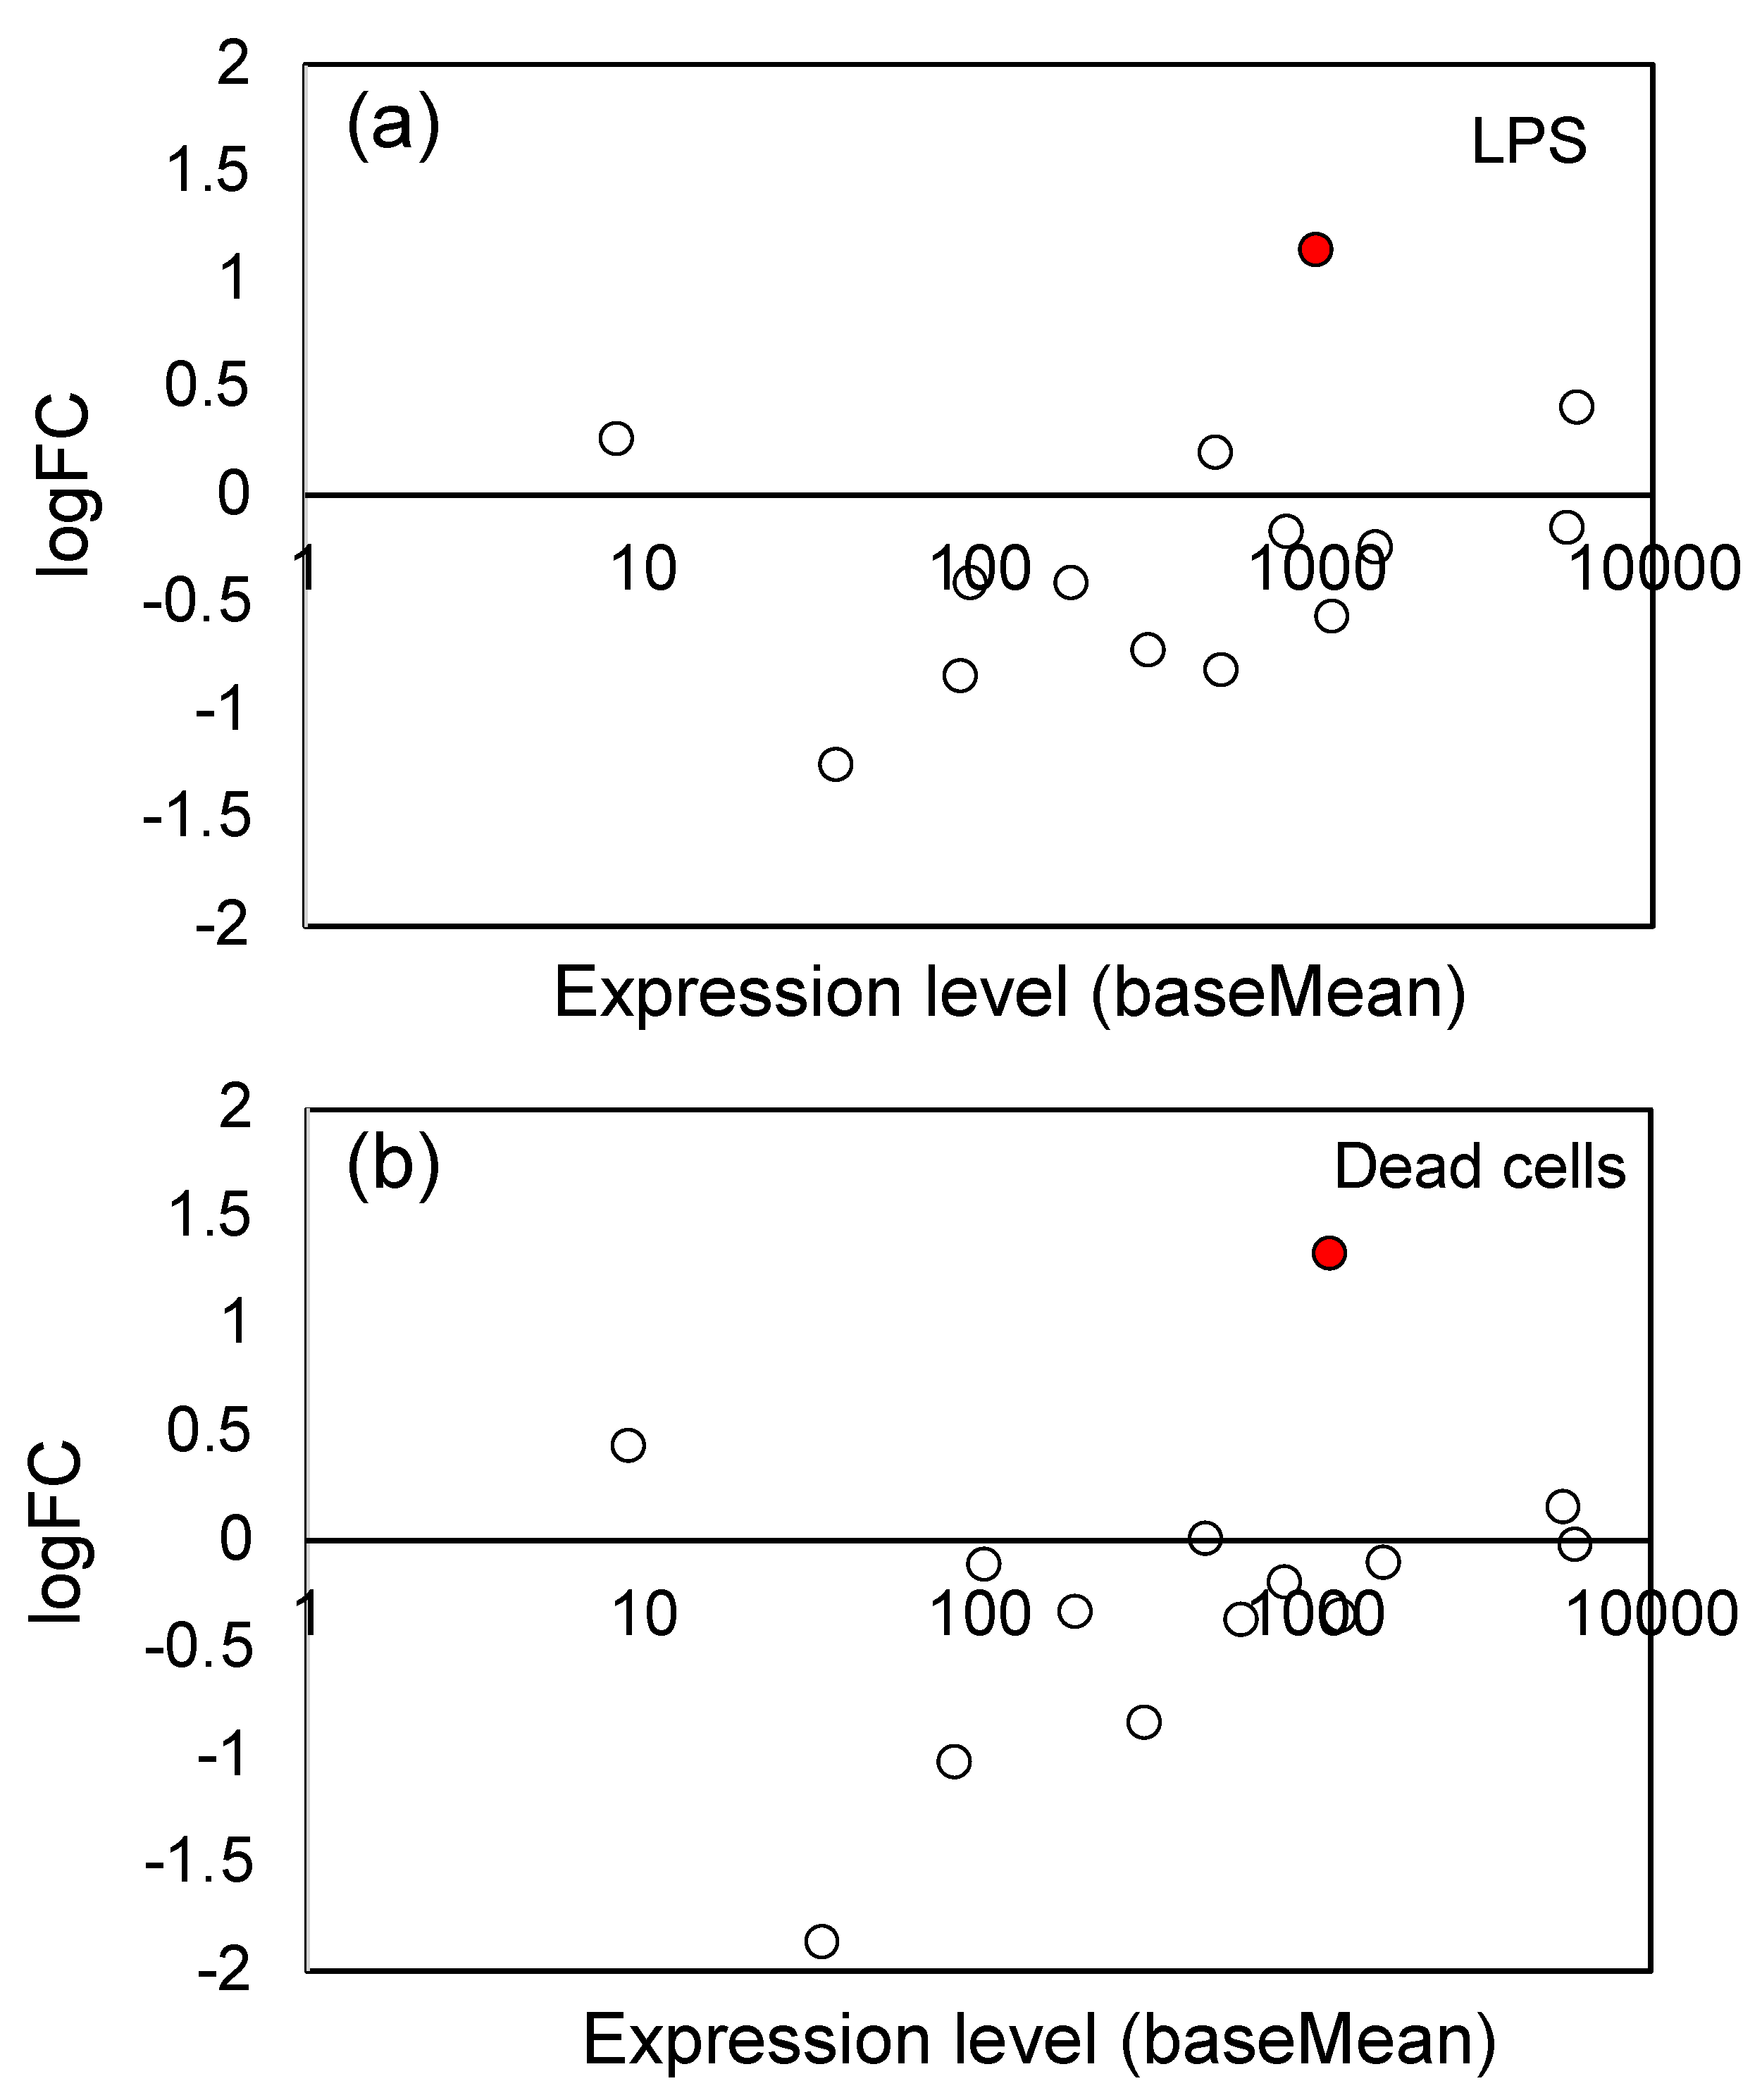
3.4. Effects of LPS from PNSB and Dead PNSB Cells on the Gene Expression of the Genes-Related Biosynthesis of Chalcone and Other Secondary Metabolites

Induction of secondary metabolites production is one of the most important reactions against herbivore attack and pathogen infection. The signaling pathways of JA, salicylic acid (SA), and ethylene are involved in inducing the production of secondary metabolites [61]. As shown in Table 1, we observed a significant up-regulation of chalcone and stilbene synthases gene; logFC value was 5.38 and 5.28 for LPS and dead cells, respectively. Chalcone synthase (CHS) and stilbene synthase (STS), are plant-specific type III polyketide synthase (PKS) [36,62]. CHS and STS catalyze a sequential decarboxylative addition of three acetate units from malonyl-CoA to a p-coumaryl-CoA starter molecule to produce naringenin chalcone and resveratrol, respectively. Naringenin chalcone is the precursor of many polyphenolic compounds, such as anthocyanins, chalcones, flavans, flavones, flavonols, and isoflavonoids. These secondary metabolites play an important role in tolerance against various biotic and abiotic stresses [63]. Figure 5 shows the logFC values and expression levels of the 21 CHS gene family (see Supplementary Table S3 for the list of these genes). The significantly (Padj < 0.05) up-regulated genes were indicated by red circles. For both LPS and dead cells, a general tendency to up-regulation has been observed, indicating that the flavonoid/isoflavonoid biosynthesis pathways were up-regulated by LPS and dead cells.
We also examined the effects of LPS and dead cells on the expression of the genes involved in other secondary metabolites biosynthesis, including terpenoid biosynthesis (30 genes) and cytochrome P450 (CYP; 233 genes), but no consistent upward or downward trend in regulation was observed in these gene groups (see Supplementary Figures S2 and S3).

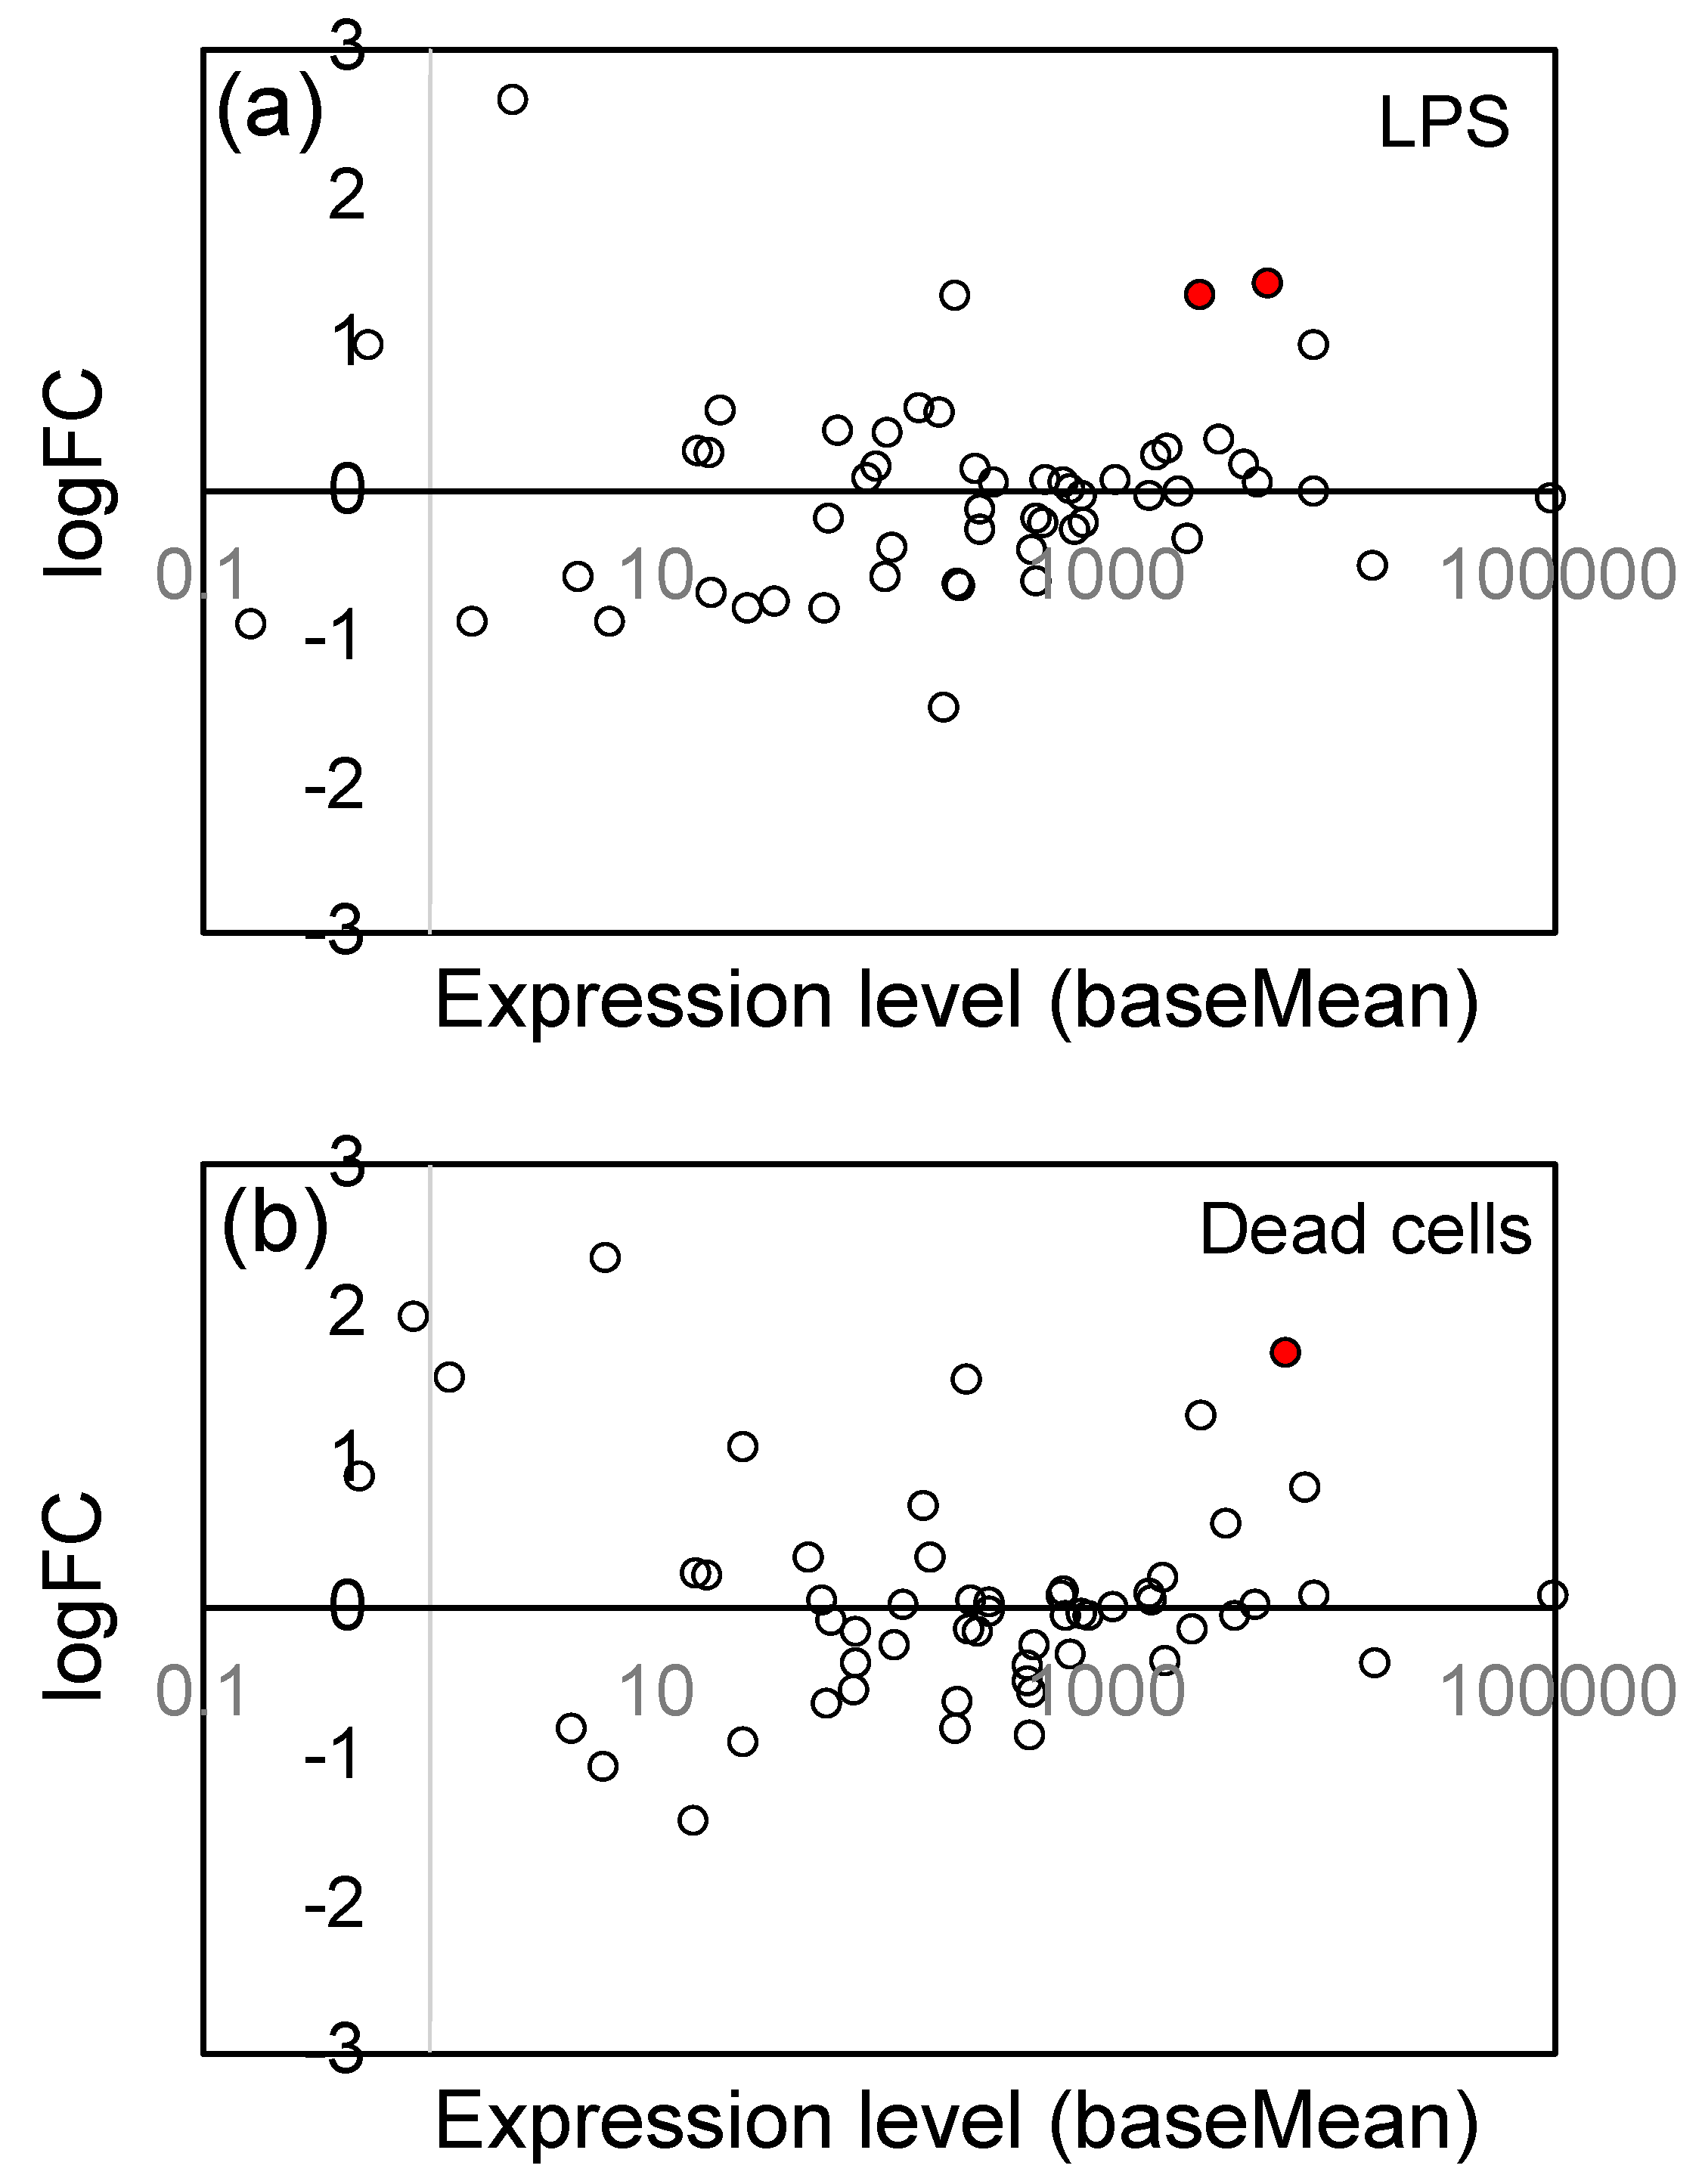
3.5. Effects of LPS from PNSB and Dead PNSB Cells on the Gene Expression of the Genes-Related Reactive Oxygen Species (ROS) Generation/Elimination

A characteristic effect of LPS in plants and animals is the generation of ROS and reactive nitrogen species (RNS) [64]. Enzymatic ROS generation is catalyzed by some oxidases such as NAD(P)H oxidase and dual oxidase, and that for RNS is catalyzed by nitric oxide synthase. In Table 1, we observed significant up-regulation of NADH oxidase genes (Os01g0370000); logFC value was 1.14 and 1.33 for LPS and dead cells, respectively, suggesting that ROS generation was accelerated by LPS and dead cells. However, there was no overall tendency for up-regulation in 14 genes coding ROS/RNS-generating enzymes (Figure 6), including one NADH oxidase, 9 NADPH oxidase, and 4 nitric oxide synthase genes (see Supplementary Table S4 for the list of these genes).
To protect themselves from the toxicity of ROS, the host cells up-regulate the ROS elimination system, including SOD, catalase, and peroxidase. We examined the changes in gene expression levels related to the ROS elimination system, and found that expression of glutathione S-transferase, which has glutathione peroxidase activity, was up-regulated. Figure 7 shows the logFC values and expression levels of 57 glutathione S-transferase (GST) genes (see Supplementary Table S5 for the list of these genes), and a general tendency to up-regulation has been observed. The significantly (Padj < 0.05) up-regulated genes were indicated by red circles, and 2 genes for LPS and 1 gene for dead cells were significantly up-regulated. We, however, observed no up-regulation in SOD (11 genes), catalase (5 genes), and peroxidase (ascorbate peroxidase and guaiacol peroxidase; 149 genes) (see Supplementary Figures S4–S6).

4. Discussion

4.1. Unique Property of LPS from R. sphaeroides NBRC 12203T

LPS is the major component of the outer membrane of Gram-negative bacteria. LPS acts as microbe-associated molecular patterns (MAMPs) in plants as elicitors of plant innate immunity [65,66]. The receptor for LPS in plants, named lipooligosaccharide-specific reduced elicitation (LORE), has also been identified [21]. In our two previous studies [18,19], we proposed that LPS acts as one of the active principles of plant growth-promoting effects of PNSB. In the first study [18], we disrupted the PNSB cells by sonication in water, and fractionated the cell lysate by centrifugation into the supernatant and pellet, and examined their effects on the growth of Brassica rapa var. perviridis (komatsuna) through foliar feeding. We found that both the supernatant and pellet promoted the growth of the plants, and the effective concentration for supernatant and pellet were about 107 cfu/mL and 103 cfu/mL, respectively. The effective concentration of pellet, 103 cfu/mL, was approximately one million times the dilution of the well-grown PNSB culture (109 cfu/mL), and the active component in pellet was supposed to be a compound which showed biological activity at a very low concentration. Based on this finding, we expected that the LPS in the pellet could act as an active principle, and found that LPS from PNSB (R. sphaeroides NBRC 12203T) promoted the growth of the plants when added by foliar feeding at the concentrations of 10 pg/mL and 100 pg/mL. In the second study [19], we examined the effects of LPS by bio-priming method and found that bio-priming of rice seed by LPS from R. sphaeroides NBRC 12203T at the concentration of 5 ng/mL enhanced the root growth of rice seedlings.
There have been numerous studies on the effects of LPS in plants, but compared to mammals, plants are considered to be much less sensitive to LPS [21]. The effective concentration of LPS for endotoxic reaction in mammals is generally pg/mL to ng/mL order, but that for plants was reported to be μg/mL order. Table 2 outlines 33 previous studies on the effects of LPS on plants, as well as our three studies, including this study. In the 33 previous studies, the highest concentration was 1000 μg/mL [27,67] and the lowest was 2 μg/mL [28], and in 30 studies, the LPS concentration ranged from 10 μg/mL to 100 μg/mL. The much lower effective concentration of LPS from PNSB than that of other various Gram-negative bacteria underlines the unique property of this LPS in plants. It should be also mentioned that LPS from R. sphaeroides NBRC 12203T shows unique biological properties also found in mammals. It lacks endotoxic activity and acts as an antagonist against toxic LPSs (endotoxins) from various Gram-negative bacteria in the TLR4 signaling pathway [68,69]. This unique biological property can be attributed to its unique structure of lipid A, which is a hydrophobic domain of LPS that anchors LPS to the outer membrane of Gram-negative bacteria. The chemically synthesized lipid A of R. sphaeroides, named eritoran (E5564; Eisai), which protects mammals from a lethal cytokine storm by blocking the TLR4 signaling pathway [70], has also been developed for therapeutic application [71].

4.2. Comparison of the Effects of LPS and Dead Cells of PNSB on the Gene Expression of Rice Seedlings

In the present study, to gain a better understanding of the effects of LPS from PNSB (R. sphaeroides NBRC 12203T) in plants, we examined the effects of LPS on the gene expression of roots of rice seedlings by RNA-seq analyses. We first compared the effects of LPS and dead cells of PNSB on the gene expression of rice seedlings. In the scatter plots of logFC values of significantly up- and down-regulated genes of LPS and dead cells (Figure 2), there was a significant positive relationship between LPS and dead cells. This result indicated that most of the effects of dead cells could be explained by those of LPS, and provided evidence in support of the LPS as one of the active principles of PNSB at the gene expression level. The difference in the slope values in the scatter plots (Figure 2) for up-regulation (0.7671) and down-regulation (0.4329) indicated that the effects of LPS were more potent for down-regulation than up-regulation, and this suggests that other cellular components act differently with LPS for up- and down-regulation.

4.3. Effects of LPS on the Expression of Genes Related to the JA Signaling Pathway

As shown in Table 1, the LPS from PNSB obviously stimulated the expression of genes related to the JA signaling pathway. The innate immune response in plants is regulated through multiple signaling networks, including SA, JA, and ethylene [95]. JA is a plant hormone that is inductively synthesized in response to wounding, pathogen infections, and attack by herbivorous arthropods. The plant pathogens, which stimulate the JA signaling pathway, are fungi, such as Alternaria brassiicola, Pythium irregulare, Botrytis cinerea, and Magnaporthe oryzae, and bacteria such as Pseudomonas syringae [60].
Several studies in Table 2 indicated the involvement of the JA signaling pathway in the response of plants to LPS. Finnegan et al. [25] reported that in Arabidopsis thaliana there was an induction of phytoalexin synthesis by the LPS from Burkholderia cepacian. Their metabolome analysis revealed an increase in JA and jasmonoyl-L-isoleucine, indicating the involvement of a JA signaling pathway. Tinte et al. [81] reported in A. thaliana the induction of biosynthesis of defense-related metabolites including 9,10-dihydrohydroxy-jasmonic acid sulphate, a catabolite of the JA signaling pathway. Mareya et al. [93] examined the induction of secondary metabolites synthesis by LPS from Burkholderia andropogonis in Sorghum bicolor using a metabolome analysis, and revealed that the JA and methyl jasmonic acid (MeJA) accumulated to significantly high levels in LPS-treated plants. Shilina et al. [80] examined the effects of combined treatment with LPS from pathogenic Pseudomonas aeruginosa strain 9096 and SA on the disease resistance of wild-type (Col-0) and jin1 mutant (with impaired JA signaling) A. thaliana. They found that treatment of A. thaliana seeds with a composite preparation (LPS and SA) increased the resistance of seedlings to P. aeruginosa, and the protective effect was more pronounced in jin1 mutant, indicating the possibility of compensation for JA signaling impairment by activation of the SA signaling pathway. Rapicavoli et al. [94] reported that in Vitis vinifera, the LPS from Xylella fastidiosa induced the expression of genes of secondary metabolite biosynthesis, such as chalcone/stilbene synthase and chalcone reductase, as observed in the current study. Their GO enrichment analysis on RNA-seq data indicated the involvement of SA and JA signaling pathways in the elicitation of defense response by LPS.
In Table 2, several studies also indicated the involvement of an SA signaling pathway in the response of plants to LPS. Mishina and Zeier [73] examined the induction of systemic acquired resistance (SAR) by LPS from P. syringae and E. coli in A. thaliana. The LPS treatment elevated the level of SA, suggesting that LPS affected the SA signaling pathway. They also used a JA-insensitive A. thaliana jar1 mutant, and found that the effect of LPS was independent of the JA signaling pathway. Stomatal closure is one of the plant’s defense responses to pathogen infection, and this response is regulated by ABA signaling. Melotto et al. [78] examined the stomatal closure in A. thaliana in response to LPS from P. aeruginosa by using a cronatine-insensitive mutant coi1-20, and indicated the response to LPS was regulated through both ABA and SA signaling. Iizasa et al. [23] reported the induction of defense response by LPS from P. aeruginosa in A. thaliana. The gene ontology (GO) analysis of RNA-seq revealed that GO terms, “response to bacterium”, “response to SA stimulus”, and “response to abscisic acid (ABA) stimulus” were enriched in up-regulated genes, suggesting the involvement of SA and ABA signaling in the response of plants to LPS. Sanabria et al. [90] reported that LPS from B. cepacia induced in Nicotiana tabacum the defense response S-domain receptor-like kinase, which plays a crucial role in sensing the presence of invading micro-organisms, and suggested the involvement of the SA pathway in this reaction.

4.4. Effects of LPS on the Expression of Genes Related to Secondary Metabolism

Production of secondary metabolites, such as phenylpropanoids, terpenoids, polyketides, and alkaloids, is one of the most important defense mechanisms of plants against microbial pathogens and also herbivores [96]. As shown in Figure 5, we observed significant up-regulation of the CHS gene family. CHS is a key enzyme of the flavonoid/isoflavonoid biosynthesis pathway [36]. A CHS plays a crucial role in verticillium disease resistance in plants, and Lei et al. [97] reported that knockdown of the CHS gene in both A. thaliana and cotton (Gossypium arboreum) increased their susceptibility to V. dahliae infection. In Table 2, several studies reported the up-regulation of secondary metabolism by LPS. Rapicavoli et al. [94] reported the induction of a defense response against pathogens in grapevine (Vitis vinifera) by LPS from Xylella fastidiosa. They found an increase in the expression of enzymes contributing to phenylpropanoid biosynthesis, such as a chalcone/stilbene synthase, as we observed in the present study, and a chalcone reductase. Finnegan et al. [25] examined the changes in secondary metabolism in A. thaliana elicited by LPS from B. cepacia by liquid chromatography coupled to mass spectrometry detection (LC-MS) analysis and found the induction of biosynthesis of phytoalexin, including various flavonoids. Tinte et al. [81] compared the effects of LPS from B. cepacian, P. syringae, and X. campestris on the defense-related metabolites synthesis, and found that secondary metabolites, such as flavonoids and terpenoids, were differentially up-regulated by the different kinds of LPS. Mhlongo et al. [91] reported the induction of phenylpropanoid biosynthesis in the cell culture of Nicotiana tabacum elicited by LPS from B. cepaci by metabolome analysis with LC-MS. They also showed that the treatment with the phytohormones SA, MeJA, and ABA resulted in differentially induced phenylpropanoid pathway metabolites. Newman et al. [92] reported the induction of the phenylpropanoid pathway and of tyramine metabolism by LPS from X. campestris pv. campestris in leaves of pepper (Capsicum annuum). They observed the accumulation of SA, coumaroyl-tyramine (CT), and feruloyl-tyramine, and also up-regulation of the genes of tyramine hydroxycinnamoyl transferase (THT) and phenylalanine ammonia lyase (PAL) by LPS treatment. Mareya et al. [93] used cell suspension culture of Sorghum bicolor and examined the effects of LPS from B. andropogonis using untargeted metabolomics with LC-MS, and found the accumulation of defense-related metabolites, including phenylpropanoids, indole alkaloids, and oxylipins. In the present study, we observed no consistent up-reregulation of the genes related to terpenoid biosynthesis (30 genes) and CYP genes (233 genes) (see Supplementary Figures S2 and S3). However, we anticipate that these secondary metabolisms will also be up-regulated at some point after exposure to PNSB, because various secondary metabolisms are involved in the defense reaction of plants. The results of the RNA-seq analysis of the present study only reflect the effects of LPS at a specific time (3 days after germination), and further experiments on the time course of LPS effects, are needed to evaluate the effects of LPS from PNSB on the overall secondary metabolisms in plants.

4.5. Effects of LPS on the Expression of Genes Related to ROS Generation/Elimination

Generating ROS is a typical effect of LPS in plants [98,99], and many studies listed in Table 2 reported on ROS generation by LPS. In the present study, we observed significant up-regulation of the gene of NADH oxidase (Os01g0370000), a ROS-generating enzyme, but there was no consistent tendency of up-regulation of the genes of 14 ROS-generating enzymes (Figure 5). With respect to ROS elimination, 2 GST genes (Os01g0371500 and Os10g0530900) were significantly upregulated by LPS, and a general trend was observed in the up-regulation of the genes of GST isozymes (Figure 6). Similar to our results, Van Loon et al. [99] reported the induction of ROS generation and up-regulation of GST in tobacco cell suspension culture elicited by the LPS-containing cell walls of Pseudomonas putida WCS358.

4.6. Promotion of Root Development by LPS

As regards promoting root development by LPS (Figure 1), a possible explanation of its mechanism is that a generation of weak ROS (non-harmful level) by LPS promoted root development. It is well established that a weak ROS stimulated root development [100,101]. Three studies listed in Table 2 reported contradictory results on the effects of ROS on plant development, two promotive and one inhibitory. Chávez-Herrera et al. [28] examined the effects of LPS from Azospirillum brasilense Sp245 on the leaf and root development of Triticum aestivum by pot experiment, and found that both leaf and root development were promoted by LPS. The same research group reported the ROS (H2O2) generation and plant growth promotion (leaf and root) by LPS from A. brasilense Sp245 in T. aestivum [85]. They also treated the LPS-elicited plants with catalase, which catalyzes the decomposition of hydrogen peroxide to water and oxygen, and found a decrease in H2O2 content in the roots and also a decrease in the growth of seedlings. Their results, therefore, indicated that the generation of ROS by LPS promoted the growth of plants. In contrast to their conclusions, Shang-Guan et al. [24] reported that the generation of ROS by LPS from P. aeruginosa inhibited seeding growth in A. thaliana. To clarify the mechanisms for promoting root development by LPS from R. sphaeroides, more detailed studies on the relationship between ROS generation and root development in LPS-treated plants, including the experiments using inhibitors of LPS, such as polymyxin B, and that of NAD(P)H oxidase, such as diphenyleneiodonium chloride, and detection of ROS by image analyzing, are required, and these studies are being carried out in our laboratory.

4.7. Stimulation of Defense Response by LPS

This study is the first report that showed PNSB stimulate the defense response of plants at the level of gene expression. According to the review article by Sakarika et al. [3], there have been 10 studies on the enhanced tolerance against abiotic stress by PNSB treatment. The mechanisms which underlie these effects have been discussed mainly with respect to the effects of ALA produced by PNSB, because ALA is a precursor of the synthesis of chlorophyll, vitamin B12, anti-oxidative enzymes, and other metabolites which ameliorate various abiotic stresses [16,102]. The results obtained in this study, therefore, shed new light on the mechanisms behind the protective effects of PNSB against abiotic stress in plants. To our knowledge, there has been only one study on the enhanced tolerance against biotic stress by PNSB. Su et al. [103] reported an enhanced resistance of plants, by PNSB treatment, against tobacco mosaic virus (TMV) infection. One possible explanation for the small number of examples on the protective effects of PNSB against biotic stress is an overdose of PNSB cells. As shown in Figure 1, an adequate concentration for LPS was about 10 pg/mL and that for PNSB dead cells was about 101 to 102 cfu/mL, and higher concentrations led to lower effects. PNSB concentrations in most studies presented in the review article by Sakarika et al. [3] are 107 to 108 cfu/mL and/or above 109 cfu/plants. The results of the present study therefore suggest the need to re-examine the optimal concentration of PNSB in plant treatment.

4.8. Practical Application of LPS

From a practical point of view, the much lower effective concentration of LPS from PNSB compared with LPS from other bacteria is a great advantage for application in agriculture. In addition to plant growth promotion, the up-regulation of various genes related to biotic and abiotic stresses as shown in Table 1 and Table S1 indicated a potential of LPS and dead cells of PNSB for stimulation of a defense response in plants and enhance their tolerance both against biotic and abiotic stresses.
Another potential application of LPS from PNSB is the stimulation of secondary metabolisms in plant cell cultures. Plant secondary metabolites are considered important sources of pharmaceuticals, food additives, flavors, cosmetics, and other industrial products. The JA regulates the synthesis of secondary metabolites in a wide range of plant species [104,105], and there has been a lot of research on the enhancement of secondary metabolites production of plant cell cultures by exogenous application of JA and MeJA [106,107]. Chen et al. [108] also reported that constitutive activation of the JA signaling pathway by genetic engineering in tomato enhanced the production of secondary metabolites. Thus the application of LPS from PNSB and also with a combination of JA/MeJA to plant cell culture must be a promising approach to improve secondary metabolite productivity in plant cell culture.
Finally, another matter of interest is the question of the effects of lipid A of LPS from R. sphaeroides. Among the studies listed in Table 2, seven [24,65,66,72,75,76,84] examined the effects of lipid A, a hydrophobic domain of LPS, in comparison with those of whole LPS, and found that lipid A also induced defense response. It is therefore of a great interest to examine whether the lipid A of R. sphaeroides and also eritoran (E5564; Eisai), the chemically synthesized analog of lipid A of R. sphaeroides, can induce a defense response in plants like as LPS of R. sphaeroides does. Eritoran is an endotoxin-antagonist for the TLR4 signaling pathway, and has been developed for therapeutic application to suppress a cytokine storm in patients [70,71]. Particularly, if eritoran can stimulate a defense response in plants, it is quite advantageous for agricultural use, because compared to the natural lipid A of R. sphaeroides, we can expect higher uniformity of material quality of chemically synthesized eritoran. Eritoran has undergone clinical trials and its cost-effective manufacturing process is also beneficial for practical application.

5. Conclusions

The results obtained with rice (Oryza sativa) seedlings provided supporting evidence, in terms of gene expression, to our previous proposal that LPS acts as one of the active principles of PNSB in plants. This study is the first report that showed PNSB stimulate the defense response of plants at the level of gene expression, and up-regulated genes including the genes of the JA signaling pathway and various genes related to biotic and abiotic stress tolerances, despite the non-pathogenicity of PNSB. A significant up-regulation of CHS, a key enzyme of the flavonoid/isoflavonoid biosynthesis pathway, gene family by LPS was also observed. LPS from R. sphaeroides stimulated the gene expression at the concentration of 10 pg/mL, and this concentration was a thousand to a million times lower compared to those reported in previous studies on other LPS from various Gram-negative bacteria. From a practical point of view, this much lower effective concentration of LPS from PNSB is a great advantage for application in agriculture, and also for stimulation of secondary metabolisms in plant cell culture.

Supplementary Materials

The following are available online at https://www.mdpi.com/article/10.3390/microorganisms11071676/s1. Table S1: List of 447 genes which showed Padj < 0.05 values in LPS or dead cells, Table S2: List of 36 JA signaling pathway genes, Table S3: List of 21 CHS genes, Table S4: List of 14 genes coding ROS/RNS-generating enzymes, including one NADH oxidase, 9 NADPH oxidase, and 4 nitric oxide synthase genes, Table S5: List of 57 GST genes, Figure S1: (a) Effects of LPS of Rhodobacter sphaeroides NBRC 12203 on root development of rice seedlings, (b) Scan images of the roots of seedlings, Figure S2: Plot of the logFC values and expression levels (baseMean) of 30 terpenoid biosynthesis genes, Figure S3: Plot of the logFC values and expression levels (baseMean) of 233 CYP genes, Figure S4: Plot of the logFC values and expression levels (baseMean) of 11 SOD genes, Figure S5: Plot of the logFC values and expression levels (baseMean) of 5 catalase genes, Figure S6: Plot of the logFC values and expression levels (baseMean) of 149 peroxidase (ascorbate peroxidase and guaiacol peroxidase) genes.

Author Contributions

H.M.; experimental work, R.I., S.U., S.Y. (Sayaka Yamaguchi), D.N., A.K. and S.H.; statistical data analysis, R.I. and H.M.; writing—original draft preparation, H.M. and S.Y. (Shinjiro Yamamoto); writing—review and editing, all authors; funding acquisition, A.K. and H.M. All authors have read and agreed to the published version of the manuscript.

Funding

This research was partly funded by JSBBA (Japan Society for Bioscience, Biotechnology, and Agrochemistry) Academic Industrial R&D Support for Small-to-Medium-Sized Enterprises.

Institutional Review Board Statement

Not applicable.

Informed Consent Statement

Not applicable.

Data Availability Statement

The data presented in this study are available upon request from the corresponding author.

Acknowledgments

We would like to thank Midori Goto of Ciamo Co., Ltd., and Naoki Yamada and Taka-aki Maki of Matsumoto Institute of Microorganisms Co., Ltd., for their helpful suggestions for this work.

Conflicts of Interest

The authors declare no conflict of interest.

References

  1. Oelze, J.; Drews, G. Membranes of photosynthetic bacteria. Biochim. Biophys. Acta-Rev. Biomembr. 1972, 265, 209–239. [Google Scholar] [CrossRef]
  2. George, D.M.; Vincent, A.S.; Mackey, H.R. An overview of anoxygenic phototrophic bacteria and their applications in environmental biotechnology for sustainable Resource recovery. Biotechnol. Rep. 2020, 28, e00563. [Google Scholar] [CrossRef]
  3. Sakarika, M.; Spanoghe, J.; Sui, Y.; Wambacq, E.; Grunert, O.; Haesaert, G.; Spiller, M.; Vlaeminck, S.E. Purple non-sulphur bacteria and plant production: Benefits for fertilization, stress resistance and the environment. Microb. Biotechnol. 2020, 13, 1336–1365. [Google Scholar] [CrossRef] [Green Version]
  4. Wong, W.-T.; Tseng, C.-H.; Hsu, S.-H.; Lur, H.-S.; Mo, C.-W.; Huang, C.-N.; Hsu, S.-C.; Lee, K.-T.; Liu, C.-T. Promoting effects of a single Rhodopseudomonas palustris inoculant on plant growth by Brassica rapa chinensis under low fertilizer input. Microbes Environ. 2014, 29, 303–313. [Google Scholar] [CrossRef] [Green Version]
  5. Sundar, L.S.; Chao, Y.Y. Potential of purple non-sulfur bacteria in sustainably enhancing the agronomic and physiological performances of rice. Agronomy 2022, 12, 2347. [Google Scholar] [CrossRef]
  6. Qi, Z.; Zhang, X.H.; Boon, N.; Bossier, P. Probiotics in aquaculture of China—Current state, problems and prospect. Aquaculture 2009, 290, 15–21. [Google Scholar] [CrossRef] [Green Version]
  7. Miyasaka, H.; Koga, A.; Maki, T. Recent progress in the use of purple non-sulfur bacteria as probiotics in aquaculture. World J. Microbiol. Biotechnol. 2023, 39, 145. [Google Scholar] [CrossRef]
  8. Capson-Tojo, G.; Batstone, D.J.; Grassino, M.; Vlaeminck, S.E.; Puyol, D.; Verstraete, W.; Kleerebezem, R.; Oehmen, A.; Ghimire, A.; Pikaar, I.; et al. Purple phototrophic bacteria for resource recovery: Challenges and opportunities. Biotechnol Adv 2020, 43, 107567. [Google Scholar] [CrossRef]
  9. Higuchi-Takeuchi, M.; Numata, K. Marine purple photosynthetic bacteria as sustainable microbial production hosts. Front. Bioeng. Biotechnol. 2019, 7, 258. [Google Scholar]
  10. Kikuchi, Y.; Umekage, S. Extracellular nucleic acids of the marine bacterium Rhodovulum sulfidophilum and recombinant RNA production technology using bacteria. FEMS Microbiol. Lett. 2018, 365, fnx268. [Google Scholar] [CrossRef]
  11. Ghosh, S.; Dairkee, U.K.; Chowdhury, R.; Bhattacharya, P. Hydrogen from food processing wastes via photofermentation using Purple Non-sulfur Bacteria (PNSB)—A review. Energy Convers. Manag. 2017, 141, 299–314. [Google Scholar] [CrossRef]
  12. Sagir, E.; Alipour, S. Photofermentative hydrogen production by immobilized photosynthetic bacteria: Current perspectives and challenges. Renew. Sustain. Energy Rev. 2021, 141, 110796. [Google Scholar] [CrossRef]
  13. Lu, H.; Zhang, G.; He, S.; Zhao, R.; Zhu, D. Purple non-sulfur bacteria technology: A promising and potential approach for wastewater treatment and bioresources recovery. World J. Microbiol. Biotechnol. 2021, 37, 161. [Google Scholar] [CrossRef]
  14. Nookongbut, P.; Kantachote, D.; Krishnan, K.; Megharaj, M. Arsenic resistance genes of As-resistant purple nonsulfur bacteria isolated from As-contaminated sites for bioremediation application. J. Basic Microbiol. 2017, 57, 316–324. [Google Scholar] [CrossRef]
  15. Lee, S.K.; Lur, H.S.; Liu, C. Te From lab to farm: Elucidating the beneficial roles of photosynthetic bacteria in sustainable agriculture. Microorganisms 2021, 9, 2453. [Google Scholar] [CrossRef]
  16. Sakpirom, J.; Kantachote, D.; Nunkaew, T.; Khan, E. Characterizations of purple non-sulfur bacteria isolated from paddy fields, and identification of strains with potential for plant growth-promotion, greenhouse gas mitigation and heavy metal bioremediation. Res. Microbiol. 2017, 168, 266–275. [Google Scholar] [CrossRef]
  17. Sasaki, K.; Watanabe, M.; Tanaka, T.; Tanaka, T. Biosynthesis, biotechnological production and applications of 5-aminolevulinic acid. Appl. Microbiol. Biotechnol. 2002, 58, 23–29. [Google Scholar] [CrossRef]
  18. Hayashi, S.; Iwamoto, Y.; Hirakawa, Y.; Mori, K.; Yamada, N.; Maki, T.; Yamamoto, S.; Miyasaka, H. Plant-growth-promoting effect by cell components of purple non-sulfur photosynthetic bacteria. Microorganisms 2022, 10, 771. [Google Scholar] [CrossRef]
  19. Iwai, R.; Uchida, S.; Yamaguchi, S.; Sonoda, F.; Tsunoda, K.; Nagata, H.; Nagata, D.; Koga, A.; Goto, M.; Maki, T.; et al. Effects of seed bio-priming by purple non-sulfur bacteria (PNSB) on the root development of rice. Microorganisms 2022, 10, 2197. [Google Scholar] [CrossRef]
  20. Kagan, J.C. Lipopolysaccharide Detection across the Kingdoms of Life. Trends Immunol. 2017, 38, 696–704. [Google Scholar] [CrossRef]
  21. Ranf, S. Immune sensing of lipopolysaccharide in plants and animals: Same but different. PLoS Pathog. 2016, 12, e1005596. [Google Scholar] [CrossRef]
  22. Desaki, Y.; Miya, A.; Venkatesh, B.; Tsuyumu, S.; Yamane, H.; Kaku, H.; Minami, E.; Shibuya, N. Bacterial lipopolysaccharides induce defense responses associated with programmed cell death in rice cells. Plant Cell Physiol. 2006, 47, 1530–1540. [Google Scholar] [CrossRef]
  23. Iizasa, S.; Iizasa, E.; Matsuzaki, S.; Tanaka, H.; Kodama, Y.; Watanabe, K.; Nagano, Y. Arabidopsis LBP/BPI related-1 and -2 bind to LPS directly and regulate PR1 expression. Sci. Rep. 2016, 6, 27527. [Google Scholar] [CrossRef] [Green Version]
  24. Shang-Guan, K.; Wang, M.; Htwe, N.M.P.S.; Li, P.; Li, Y.; Qi, F.; Zhang, D.; Cao, M.; Kim, C.; Weng, H.; et al. Lipopolysaccharides trigger two successive bursts of reactive oxygen species at distinct cellular locations. Plant Physiol. 2018, 176, 2543–2556. [Google Scholar] [CrossRef] [PubMed] [Green Version]
  25. Finnegan, T.; Steenkamp, P.A.; Piater, L.A.; Dubery, I.A. The lipopolysaccharide-induced metabolome signature in Arabidopsis thaliana reveals dynamic reprogramming of phytoalexin and phytoanticipin pathways. PLoS ONE 2016, 11, e0163572. [Google Scholar] [CrossRef] [Green Version]
  26. Van Peer, R.; Schippers, B. Lipopolysaccharides of plant-growth promoting Pseudomonas sp. strain WCS417r induce resistance in carnation to Fusarium wilt. Neth. J. Plant Pathol. 1992, 98, 129–139. [Google Scholar] [CrossRef]
  27. Reitz, M.; Rudolph, K.; Schroder, I.; Hoffmann-Hergarten, S.; Hallmann, J.; Sikora, R.A. Lipopolysaccharides of Rhizobium etli strain G12 act in potato roots as an inducing agent of systemic resistance to infection by the cyst nematode Globodera pallida. Appl. Environ. Microbiol. 2000, 66, 3515–3518. [Google Scholar] [CrossRef] [PubMed] [Green Version]
  28. Chávez-Herrera, E.; Hernández-Esquivel, A.A.; Castro-Mercado, E.; García-Pineda, E. Effect of Azospirillum brasilense Sp 245 lipopolysaccharides on wheat plant development. J. Plant Growth Regul. 2018, 37, 859–866. [Google Scholar] [CrossRef]
  29. Coats, S.R.; Pham, T.-T.T.; Bainbridge, B.W.; Reife, R.A.; Darveau, R.P. MD-2 mediates the ability of tetra-acylated and penta-acylated lipopolysaccharides to antagonize Escherichia coli lipopolysaccharide at the TLR4 signaling complex. J. Immunol. 2005, 175, 4490–4498. [Google Scholar] [CrossRef] [PubMed] [Green Version]
  30. Darveau, R.P.; Hancock, R.E.W. Procedure for isolation of bacterial lipopolysaccharides from both smooth and rough Pseudomonas aeruginosa and Salmonella typhimurium strains. J. Bacteriol. 1983, 155, 831–838. [Google Scholar] [CrossRef] [Green Version]
  31. Pelegrini, P.B.; Franco, O.L. Plant γ-thionins: Novel insights on the mechanism of action of a multi-functional class of defense proteins. Int. J. Biochem. Cell Biol. 2005, 37, 2239–2253. [Google Scholar] [CrossRef]
  32. Kebede, A.; Kebede, M. In silico analysis of promoter region and regulatory elements of glucan endo-1,3-beta-glucosidase encoding genes in Solanum tuberosum: Cultivar DM 1-3 516 R44. J. Genet. Eng. Biotechnol. 2021, 19, 145. [Google Scholar] [CrossRef] [PubMed]
  33. Dunwell, J.M.; Gibbings, J.G.; Mahmood, T.; Saqlan Naqvi, S.M. Germin and germin-like proteins: Evolution, structure, and function. CRC Crit. Rev. Plant Sci. 2008, 27, 342–375. [Google Scholar] [CrossRef]
  34. Othman, T.A.; Bakar, N.A.; Abidin, R.A.Z.; Mahmood, M.; Saidi, N.B.; Shaharuddin, N.A. Potential of plant’s Bowman-Birk protease inhibitor in combating abiotic stresses: A Mini Review. Bioremediat. Sci. Technol. Res. 2015, 2, 25–33. [Google Scholar] [CrossRef]
  35. Tunnacliffe, A.; Wise, M.J. The continuing conundrum of the LEA proteins. Naturwissenschaften 2007, 94, 791–812. [Google Scholar] [CrossRef]
  36. Watanabe, K.; Praseuth, A.P.; Wang, C.C. A comprehensive and engaging overview of the type III family of polyketide synthases. Curr. Opin. Chem. Biol. 2007, 11, 279–286. [Google Scholar] [CrossRef]
  37. Wang, J.D.; Li, Z.; Liang, Y.; Zheng, J.; Gong, Z.; Zhou, G.; Xu, Y.; Li, X. Genome-wide identification and expression reveal the involvement of the FCS-like zinc finger (FLZ) gene family in Gossypium hirsutum at low temperature. PeerJ 2023, 11, e14690. [Google Scholar] [CrossRef]
  38. Huang, H.; Liu, B.; Liu, L.; Song, S. Jasmonate action in plant growth and development. J. Exp. Bot. 2017, 68, 1349–1359. [Google Scholar] [CrossRef] [PubMed] [Green Version]
  39. Nguyen, H.T.; To, H.T.M.; Lebrun, M.; Bellafiore, S.; Champion, A. Jasmonates—The master regulator of rice development, adaptation and defense. Plants 2019, 8, 339. [Google Scholar] [CrossRef] [Green Version]
  40. Chen, C.; Li, Q.; Wang, Q.; Lu, D.; Zhang, H.; Wang, J.; Fu, R. Transcriptional profiling provides new insights into the role of nitric oxide in enhancing Ganoderma oregonense resistance to heat stress. Sci. Rep. 2017, 7, 15694. [Google Scholar] [CrossRef] [PubMed] [Green Version]
  41. He, H.; He, L.F. Crosstalk between melatonin and nitric oxide in plant development and stress responses. Physiol. Plant 2020, 170, 218–226. [Google Scholar] [CrossRef] [PubMed]
  42. Chutoam, P.; Charoensawan, V.; Wongtrakoongate, P.; Kum-arth, A.; Buphamalai, P.; Tungpradabkul, S. RpoS and oxidative stress conditions regulate succinyl-CoA: 3-ketoacid-coenzyme A transferase (SCOT) expression in Burkholderia pseudomallei. Microbiol. Immunol. 2013, 57, 605–615. [Google Scholar] [CrossRef] [PubMed]
  43. Field, B. Green magic: Regulation of the chloroplast stress response by (p)ppGpp in plants and algae. J. Exp. Bot. 2018, 69, 2797–2807. [Google Scholar] [CrossRef] [PubMed] [Green Version]
  44. He, Z.H.; He, D.; Kohorn, B.D. Requirement for the induced expression of a cell wall associated receptor kinase for survival during the pathogen response. Plant J. 1998, 14, 55–63. [Google Scholar] [CrossRef] [Green Version]
  45. Jez, J.M. Connecting primary and specialized metabolism: Amino acid conjugation of phytohormones by GRETCHEN HAGEN 3 (GH3) acyl acid amido synthetases. Curr. Opin. Plant Biol. 2022, 66, 102194. [Google Scholar] [CrossRef]
  46. Kaur, H.; Chowrasia, S.; Gaur, V.S.; Mondal, T.K. Allantoin: Emerging role in plant abiotic stress tolerance. Plant Mol. Biol. Report. 2016, 39, 648–661. [Google Scholar] [CrossRef]
  47. Mutuku, J.M.; Yoshida, S.; Shimizu, T.; Ichihashi, Y.; Wakatake, T.; Takahashi, A.; Seo, M.; Shirasu, K. The WRKY45-dependent signaling pathway is required for resistance against Striga hermonthica parasitism. Plant Physiol. 2015, 168, 1152–1163. [Google Scholar] [CrossRef] [PubMed] [Green Version]
  48. Perotti, M.F.; Arce, A.L.; Chan, R.L. The underground life of homeodomain-leucine zipper transcription factors. J. Exp. Bot. 2021, 72, 4005–4021. [Google Scholar] [CrossRef]
  49. Stotz, H.U.; Mueller, S.; Zoeller, M.; Mueller, M.J.; Berger, S. TGA transcription factors and jasmonate-independent COI1 signalling regulate specific plant responses to reactive oxylipins. J. Exp. Bot. 2013, 64, 963–975. [Google Scholar] [CrossRef]
  50. Domsalla, A.; Melzig, M.F. Occurrence and properties of proteases in plant latices. Planta Med. 2008, 74, 699–711. [Google Scholar] [CrossRef] [Green Version]
  51. Lin, K.; Zeng, M.; Williams, D.V.; Hu, W.; Shabala, S.; Zhou, M.; Cao, F. Integration of transcriptome and metabolome analyses reveals the mechanistic basis for cadmium accumulation in maize. iScience 2022, 25, 105484. [Google Scholar] [CrossRef] [PubMed]
  52. Beier, M.P.; Obara, M.; Taniai, A.; Sawa, Y.; Ishizawa, J.; Yoshida, H.; Tomita, N.; Yamanaka, T.; Ishizuka, Y.; Kudo, S.; et al. Lack of ACTPK1, an STY kinase, enhances ammonium uptake and use, and promotes growth of rice seedlings under sufficient external ammonium. Plant J. 2018, 93, 992–1006. [Google Scholar] [CrossRef] [PubMed] [Green Version]
  53. Onyemaobi, O.; Sangma, H.; Garg, G.; Wallace, X.; Kleven, S.; Dolferus, R. Transcriptome profiling of the chilling response in wheat spikes: I, acclimation response to long-term chilling treatment. Curr. Plant Biol. 2022, 31, 100255. [Google Scholar] [CrossRef]
  54. Nakashima, K.; Takasaki, H.; Mizoi, J.; Shinozaki, K.; Yamaguchi-Shinozaki, K. NAC transcription factors in plant abiotic stress responses. Biochim. Biophys. Acta-Gene Regul. Mech. 2012, 1819, 97–103. [Google Scholar] [CrossRef] [PubMed]
  55. Feys, B.J.; Parker, J.E. Interplay of signaling pathways in plant disease resistance. Trends Genet. 2000, 16, 449–455. [Google Scholar] [CrossRef]
  56. Jia, J.; Fu, J.; Zheng, J.; Zhou, X.; Huai, J.; Wang, J.; Wang, M.; Zhang, Y.; Chen, X.; Zhang, J.; et al. Annotation and expression profile analysis of 2073 full-length cDNAs from stress-induced maize (Zea mays L.) seedlings. Plant J. 2006, 48, 710–727. [Google Scholar] [CrossRef]
  57. Al-Momany, B.; Abu-Romman, S. Cloning and molecular characterization of a flavin-dependent oxidoreductase gene from barley. J. Appl. Genet. 2014, 55, 457–468. [Google Scholar] [CrossRef]
  58. Collins, C.; Keane, T.M.; Turner, D.J.; O’Keeffe, G.; Fitzpatrick, D.A.; Doyle, S. Genomic and proteomic dissection of the ubiquitous plant pathogen, Armillaria mellea: Toward a new infection model system. J. Proteome Res. 2013, 12, 2552–2570. [Google Scholar] [CrossRef]
  59. James, D.; Tarafdar, A.; Biswas, K.; Sathyavathi, T.C.; Padaria, J.C.; Kumar, P.A. Development and characterization of a high temperature stress responsive subtractive cDNA library in Pearl Millet Pennisetum glaucum (L.) R. Br. Indian J. Exp. Biol. 2015, 53, 543–550. [Google Scholar]
  60. Li, C.; Xu, M.; Cai, X.; Han, Z.; Si, J.; Chen, D. Jasmonate signaling pathway modulates plant defense, growth, and their trade-offs. Int. J. Mol. Sci. 2022, 23, 3945. [Google Scholar] [CrossRef]
  61. Miyamoto, K.; Shimizu, T.; Okada, K. Transcriptional regulation of the biosynthesis of phytoalexin: A lesson from specialized metabolites in rice. Plant Biotechnol. 2014, 31, 377–388. [Google Scholar] [CrossRef] [Green Version]
  62. Austin, M.B.; Noel, J.P. The chalcone synthase superfamily of type III polyketide synthases. Nat. Prod. Rep. 2003, 20, 79–110. [Google Scholar] [CrossRef] [PubMed]
  63. Dao, T.T.H.; Linthorst, H.J.M.; Verpoorte, R. Chalcone synthase and its functions in plant resistance. Phytochem. Rev. 2011, 10, 397–412. [Google Scholar] [CrossRef] [PubMed] [Green Version]
  64. Meyer, A.; Pühler, A.; Niehaus, K. The lipopolysaccharides of the phytopathogen Xanthomonas campestris pv. campestris induce an oxidative burst reaction in cell cultures of Nicotiana tabacum. Planta 2001, 213, 214–222. [Google Scholar] [CrossRef]
  65. Silipo, A.; Molinaro, A.; Sturiale, L.; Dow, J.M.; Erbs, G.; Lanzetta, R.; Newman, M.A.; Parrilli, M. The elicitation of plant innate immunity by lipooligosaccharide of Xanthomonas campestris. J. Biol. Chem. 2005, 280, 33660–33668. [Google Scholar] [CrossRef] [Green Version]
  66. Madala, N.E.; Molinaro, A.; Dubery, I.A. Distinct carbohydrate and lipid-based molecular patterns within lipopolysaccharides from Burkholderia cepacia contribute to defense-associated differential gene expression in Arabidopsis thaliana. Innate Immun. 2012, 18, 140–154. [Google Scholar] [CrossRef] [PubMed] [Green Version]
  67. Sigida, E.N.; Fedonenko, Y.P.; Shashkov, A.S.; Toukach, P.V.; Shelud’ko, A.V.; Zdorovenko, E.L.; Knirel, Y.A.; Konnova, S.A. Structural studies of O-specific polysaccharide(s) and biological activity toward plants of the lipopolysaccharide from Azospirillum brasilense SR8. Int. J. Biol. Macromol. 2019, 126, 246–253. [Google Scholar] [CrossRef]
  68. Oblak, A.; Jerala, R. The molecular mechanism of species-specific recognition of lipopolysaccharides by the MD-2/TLR4 receptor complex. Mol. Immunol. 2015, 63, 134–142. [Google Scholar] [CrossRef]
  69. Steimle, A.; Autenrieth, I.B.; Frick, J.S. Structure and function: Lipid A modifications in commensals and pathogens. Int. J. Med. Microbiol. 2016, 306, 290–301. [Google Scholar] [CrossRef] [PubMed] [Green Version]
  70. Shirey, K.A.; Lai, W.; Scott, A.J.; Lipsky, M.; Mistry, P.; Pletneva, L.M.; Karp, C.L.; McAlees, J.; Gioannini, T.L.; Weiss, J.; et al. The TLR4 antagonist Eritoran protects mice from lethal influenza infection. Nature 2013, 497, 498–502. [Google Scholar] [CrossRef] [Green Version]
  71. Rossignol, D.P.; Lynn, M. TLR4 antagonists for endotoxemia and beyond. Curr. Opin. Investig. Drugs 2005, 6, 496–502. [Google Scholar] [PubMed]
  72. Zeidler, D.; Zähringer, U.; Gerber, I.; Dubery, I.; Hartung, T.; Bors, W.; Hutzler, P.; Durner, J. Innate immunity in Arabidopsis thaliana: Lipopolysaccharides activate nitric oxide synthase (NOS) and induce defense genes. Proc. Natl. Acad. Sci. USA 2004, 101, 15811–15816. [Google Scholar] [CrossRef] [PubMed] [Green Version]
  73. Mishina, T.E.; Zeier, J. Pathogen-associated molecular pattern recognition rather than development of tissue necrosis contributes to bacterial induction of systemic acquired resistance in Arabidopsis. Plant J. 2007, 50, 500–513. [Google Scholar] [CrossRef]
  74. Song, M.C.; Beom, R.K.; Song, H.H.; Anderson, A.J.; Park, J.Y.; Lee, Y.H.; Baik, H.C.; Yang, K.Y.; Ryu, C.M.; Kim, Y.C. 2R,3R-butanediol, a bacterial volatile produced by Pseudomonas chlororaphis O6, is involved in induction of systemic tolerance to drought in Arabidopsis thaliana. Mol. Plant-Microbe Interact. 2008, 21, 1067–1075. [Google Scholar] [CrossRef] [Green Version]
  75. Silipo, A.; Sturiale, L.; Garozzo, D.; Erbs, G.; Jensen, T.T.; Lanzetta, R.; Dow, J.M.; Parrilli, M.; Newman, M.A.; Molinaro, A. The acylation and phosphorylation pattern of lipid A from Xanthomonas campestris strongly influence its ability to trigger the innate immune response in Arabidopsis. ChemBioChem 2008, 9, 896–904. [Google Scholar] [CrossRef] [PubMed]
  76. Madala, N.E.; Leone, M.R.; Molinaro, A.; Dubery, I.A. Deciphering the structural and biological properties of the lipid A moiety of lipopolysaccharides from Burkholderia cepacia strain ASP B 2D, in Arabidopsis thaliana. Glycobiology 2011, 21, 184–194. [Google Scholar] [CrossRef] [Green Version]
  77. Mohamed, K.H.; Daniel, T.; Aurélien, D.; El-Maarouf-Bouteau, H.; Rafik, E.; Arbelet-Bonnin, D.; Biligui, B.; Florence, V.; Mustapha, E.M.; François, B. Deciphering the dual effect of lipopolysaccharides from plant pathogenic Pectobacterium. Plant Signal. Behav. 2015, 10, e1000160. [Google Scholar] [CrossRef] [PubMed] [Green Version]
  78. Melotto, M.; Underwood, W.; Koczan, J.; Nomura, K.; He, S.Y. Plant stomata function in innate immunity against bacterial invasion. Cell 2006, 126, 969–980. [Google Scholar] [CrossRef] [Green Version]
  79. Iizasa, S.; Iizasa, E.; Watanabe, K.; Nagano, Y. Transcriptome analysis reveals key roles of AtLBR-2 in LPS-induced defense responses in plants. BMC Genom. 2017, 18, 995. [Google Scholar] [CrossRef] [PubMed] [Green Version]
  80. Shilina, J.V.; Gushcha, M.I.; Molozhava, O.S.; Litvinov, S.V.; Dmitriev, A.P. Induction of Arabidopsis thaliana resistance to pathogenic bacteria by lipopolysaccharide and salicylic acid. Cytol. Genet. 2018, 52, 169–173. [Google Scholar] [CrossRef]
  81. Tinte, M.M.; Steenkamp, P.A.; Piater, L.A.; Dubery, I.A. Lipopolysaccharide perception in Arabidopsis thaliana: Diverse LPS chemotypes from Burkholderia cepacia, Pseudomonas syringae and Xanthomonas campestris trigger differential defence-related perturbations in the metabolome. Plant Physiol. Biochem. 2020, 156, 267–277. [Google Scholar] [CrossRef]
  82. Hussan, R.H.; Dubery, I.A.; Piater, L.A. Identification of mamp-responsive plasma membrane-associated proteins in Arabidopsis thaliana following challenge with different LPS chemotypes from Xanthomonas campestris. Pathogens 2020, 9, 787. [Google Scholar] [CrossRef] [PubMed]
  83. Girija, A.M.; Kinathi, B.K.; Madhavi, M.B.; Ramesh, P.; Vungarala, S.; Patel, H.K.; Sonti, R.V. Rice leaf transcriptional profiling suggests a functional interplay between Xanthomonas oryzae pv. oryzae lipopolysaccharide and extracellular polysaccharide in modulation of defense responses during infection. Mol. Plant-Microbe Interact. 2017, 30, 16–27. [Google Scholar] [CrossRef] [Green Version]
  84. Desaki, Y.; Kouzai, Y.; Ninomiya, Y.; Iwase, R.; Shimizu, Y.; Seko, K.; Molinaro, A.; Minami, E.; Shibuya, N.; Kaku, H.; et al. OsCERK1 plays a crucial role in the lipopolysaccharide-induced immune response of rice. New. Phytol. 2018, 217, 1042–1049. [Google Scholar] [CrossRef] [Green Version]
  85. Vallejo-Ochoa, J.; López-Marmolejo, M.; Hernández-Esquivel, A.A.; Méndez-Gómez, M.; Suárez-Soria, L.N.; Castro-Mercado, E.; García-Pineda, E. Early plant growth and biochemical responses induced by Azospirillum brasilense Sp 245 lipopolysaccharides in wheat (Triticum aestivum L.) seedlings are attenuated by procyanidin B2. Protoplasma 2018, 255, 685–694. [Google Scholar] [CrossRef] [PubMed]
  86. Coventry, H.S.; Dubery, I.A. Lipopolysaccharides from Burkholderia cepacia contribute to an enhanced defensive capacity and the induction of pathogenesis-related proteins in Nicotianae tabacum. Physiol. Mol. Plant Pathol. 2001, 58, 149–158. [Google Scholar] [CrossRef]
  87. Gerber, I.B.; Zeidler, D.; Durner, J.; Dubery, I.A. Early perception responses of Nicotiana tabacum cells in response to lipopolysaccharides from Burkholderia cepacia. Planta 2004, 218, 647–657. [Google Scholar] [CrossRef]
  88. Braun, S.G.; Meyer, A.; Holst, O.; Pühler, A.; Niehaus, K. Characterization of the Xanthomonas campestris pv. campestris lipopolysaccharide substructures essential for elicitation of an oxidative burst in tobacco cells. Mol. Plant-Microbe Interact. 2005, 18, 674–681. [Google Scholar] [CrossRef] [Green Version]
  89. Sanabria, N.M.; Dubery, I.A. Differential display profiling of the Nicotiana response to LPS reveals elements of plant basal resistance. Biochem. Biophys. Res. Commun. 2006, 344, 1001–1007. [Google Scholar] [CrossRef]
  90. Sanabria, N.M.; van Heerden, H.; Dubery, I.A. Molecular characterisation and regulation of a Nicotiana tabacum S-domain receptor-like kinase gene induced during an early rapid response to lipopolysaccharides. Gene 2012, 501, 39–48. [Google Scholar] [CrossRef]
  91. Mhlongo, M.I.; Piater, L.A.; Madala, N.E.; Steenkamp, P.A.; Dubery, I.A. Phenylpropanoid defences in Nicotiana tabacum cells: Overlapping metabolomes indicate common aspects to priming responses induced by lipopolysaccharides, chitosan and flagellin-22. PLoS ONE 2016, 11, e0151350. [Google Scholar] [CrossRef] [PubMed]
  92. Newman, M.A.; Von Roepenack-Lahaye, E.; Parr, A.; Daniels, M.J.; Dow, J.M. Prior exposure to lipopolysaccharide potentiates expression of plant defenses in response to bacteria. Plant J. 2002, 29, 487–495. [Google Scholar] [CrossRef]
  93. Mareya, C.R.; Tugizimana, F.; Di Lorenzo, F.; Silipo, A.; Piater, L.A.; Molinaro, A.; Dubery, I.A. Adaptive defence-related changes in the metabolome of Sorghum bicolor cells in response to lipopolysaccharides of the pathogen Burkholderia andropogonis. Sci. Rep. 2020, 10, 7626. [Google Scholar] [CrossRef] [PubMed]
  94. Rapicavoli, J.N.; Blanco-Ulate, B.; Muszyński, A.; Figueroa-Balderas, R.; Morales-Cruz, A.; Azadi, P.; Dobruchowska, J.M.; Castro, C.; Cantu, D.; Roper, M.C. Lipopolysaccharide O-antigen delays plant innate immune recognition of Xylella fastidiosa. Nat. Commun. 2018, 9, 390. [Google Scholar] [CrossRef] [PubMed] [Green Version]
  95. Nürnberger, T.S.D. Signal transmission in the plant immune response. Trends Plant Sci. 2018, 6, 372–379. [Google Scholar] [CrossRef]
  96. Bennett, R.N.; Wallsgrove, R.M. Secondary metabolites in plant defence mechanisms. New. Phytol. 1994, 127, 617–633. [Google Scholar] [CrossRef]
  97. Lei, K.J.; Zhang, L.; Du, X.Y.; An, Y.; Chang, G.H.; An, G.Y. A chalcone synthase controls the verticillium disease resistance response in both Arabidopsis thaliana and cotton. Eur. J. Plant Pathol. 2018, 152, 769–781. [Google Scholar] [CrossRef]
  98. Newman, M.A.; Dow, M.J.; Molinaro, A.; Parrilli, M. Priming, induction and modulation of plant defence responses by bacterial lipopolysaccharides. J. Endotoxin Res. 2007, 13, 69–84. [Google Scholar] [CrossRef] [Green Version]
  99. Van Loon, L.C.; Bakker, P.A.H.M.; Van Der Heijdt, W.H.W.; Wendehenne, D.; Pugin, A. Early responses of tobacco suspension cells to rhizobacterial elicitors of induced systemic resistance. Mol. Plant-Microbe Interact. 2008, 21, 1609–1621. [Google Scholar] [CrossRef] [Green Version]
  100. Foreman, J.; Demidchik, V.; Bothwell, J.H.F.; Mylona, P.; Miedema, H.; Torres, M.A.; Linstead, P.; Costa, S.; Brownlee, C.; Jones, J.D.G.; et al. Reactive oxygen species produced by NADPH oxidase regulate plant cell growth. Nature 2003, 422, 442–446. [Google Scholar] [CrossRef]
  101. Takeda, S.; Gapper, C.; Kaya, H.; Bell, E.; Kuchitsu, K.; Dolan, L. Local positive feedback regulation determines cell shape in root hair cells. Science 2008, 319, 1241–1244. [Google Scholar] [CrossRef]
  102. Wongkantrakorn, N.; Sunohara, Y.; Matsumoto, H. Mechanism of growth amelioration of NaCl-stressed rice (Oryza sativa L.) by δ-aminolevulinic acid. J. Pestic. Sci. 2009, 34, 89–95. [Google Scholar] [CrossRef] [Green Version]
  103. Su, P.; Tan, X.; Li, C.; Zhang, D.; Cheng, J.; Zhang, S.; Zhou, X.; Yan, Q.; Peng, J.; Zhang, Z.; et al. Photosynthetic bacterium Rhodopseudomonas palustris GJ-22 induces systemic resistance against viruses. Microb. Biotechnol. 2017, 10, 612–624. [Google Scholar] [CrossRef] [PubMed]
  104. De Geyter, N.; Gholami, A.; Goormachtig, S.; Goossens, A. Transcriptional machineries in jasmonate-elicited plant secondary metabolism. Trends Plant Sci. 2012, 17, 349–359. [Google Scholar] [CrossRef] [PubMed]
  105. Zhou, M.; Memelink, J. Jasmonate-responsive transcription factors regulating plant secondary metabolism. Biotechnol. Adv. 2016, 34, 441–449. [Google Scholar] [CrossRef]
  106. Nabi, N.; Singh, S.; Saffeullah, P. Responses of in vitro cell cultures to elicitation: Regulatory role of jasmonic acid and methyl jasmonate: A review. In Vitro Cell. Dev. Biol.-Plant 2021, 57, 341–355. [Google Scholar] [CrossRef]
  107. Ho, T.; Murthy, H.N.; Park, S. Methyl jasmonate induced oxidative stress and accumulation of secondary metabolites in plant cell and organ cultures. Int. J. Mol. Sci. 2020, 21, 716. [Google Scholar] [CrossRef] [PubMed] [Green Version]
  108. Chen, H.; Jones, A.D.; Howe, G.A. Constitutive activation of the jasmonate signaling pathway enhances the production of secondary metabolites in tomato. FEBS Lett. 2006, 580, 2540–2546. [Google Scholar] [CrossRef] [Green Version]
Figure 1. Effects of LPS and dead cells of Rhodobacter sphaeroides NBRC 12203T on root development of rice seedlings. Rice seeds were aseptically germinated on agar plates, and grown for 7 days on vertically oriented plates containing LPS and dead cells of Rhodobacter sphaeroides NBRC 12203T. Root development was evaluated by WinRhizo imaging analyses. The root development was evaluated by total root length (a,d), root surface area (b,e), and number of root tips (c,f). Data are means ± SD (n = 3). Asterisk indicates the result that was significantly different (* p < 0.05, ** p < 0.01) from the control.
Microorganisms 11 01676 g001
Figure 2. Venn diagrams of the significantly up- and down-regulated genes of rice roots treated by LPS and dead cells: (a) Significantly (Padj < 0.05) up-regulated genes (total gene number: 361) and (b) significantly (Padj < 0.05) down-regulated genes (total gene number: 93). RNA-seq analysis was carried out with three biological replicates.
Microorganisms 11 01676 g002
Figure 3. Scatter plot of the logFC values of significantly up- and down-regulated genes of LPS and dead cells: (a) Significantly up-regulated genes (361 genes in Figure 2a), and (b) significantly down-regulated genes (93 genes in Figure 2b). Horizontal axis: LPS; vertical axis: dead cells.
Microorganisms 11 01676 g003
Figure 4. Plot of the logFC values and expression levels (baseMean) of 36 JA signaling pathway genes: (a) LPS and (b) dead cells. The significantly (Padj < 0.05) up-regulated genes were indicated by red circles (), and the open (white) circles are the genes which showed no significant change. See Supplementary Table S2 for the list of 36 genes.
Microorganisms 11 01676 g004
Figure 5. Plot of the logFC values and expression levels (baseMean) of the 21 chalcone synthase gene family: (a) LPS and (b) dead cells. The significantly (Padj < 0.05) up-regulated genes were indicated by red circles (), and the open (white) circles are the genes which showed no significant change. See Supplementary Table S3 for the list of 21 genes.
Microorganisms 11 01676 g005
Figure 6. Plot of the logFC values and expression levels (baseMean) of 14 genes coding ROS/RNS-generating enzymes: (a) LPS and (b) dead cells. The significantly (Padj < 0.05) up-regulated genes were indicated by red circles (), and the open (white) circles are the genes which showed no significant change. See Supplementary Table S4 for the list of 14 genes.
Microorganisms 11 01676 g006
Figure 7. Plot of the logFC values and expression levels (baseMean) of 57 glutathione S-transferase (GST) genes: (a) LPS and (b) dead cells. The significantly (Padj < 0.05) up-regulated genes were indicated by red circles (), and the open (white) circles are the genes which showed no significant change. See Supplementary Table S5 for the list of 57 genes.
Microorganisms 11 01676 g007
Table 1. List of 47 significantly (Padj < 0.05) up-regulated genes, in both conditions, with functional annotation sorted by logFC values of LPS.
LPSDead Cells
Gene IDlogFCGene DescriptionStress
Response
JA *Reference
Os06g05141006.177.82Thionin; antimicrobial peptideX [31]
Os10g01773005.385.28Chalcone and stilbene synthasesX [36]
Os03g01835004.543.88FCS-like zinc finger proteinXX[37,38]
Os11g06030004.344.17Basic helix-loop-helix dimerization region bHLH domain containing proteinXX[38,39]
Os02g01377004.252.53NAD(P)-binding domain containing proteinX [40]
Os01g09466003.652.74Glucan endo-1,3-beta-glucosidaseX [32]
Os10g03924003.552.01Tify domain containing proteinXX[38,39]
Os07g01530003.513.48Jasmonate ZIM-domain (JAZ) familyXX[38,39]
Os06g05137813.413.09Thionin; antimicrobial peptideX [31]
Os03g07411003.292.67Basic helix-loop-helix transcription factor, drought toleranceXX[38,39]
Os11g06840003.251.76Myb transcription factorXX[38,39]
Os01g09467003.171.93Glucan endo-1,3-beta-glucosidaseX [32]
Os03g01426003.103.52Myb transcription factorXX[38,39]
Os03g01809003.092.22Jasmonate ZIM-domain containing proteinXX[38,39]
Os10g01182003.082.94Acetylserotonin O-methyltransferaseX [41]
Os01g01247003.041.93Bowman–Birk type protease inhibitorX [34]
Os03g01811002.922.78Tify domain containing proteinXX[38,39]
Os12g04784002.902.46EGF-type aspartate/asparagine hydroxylation site domain containing protein
Os01g02255002.853.473-methyl-2-oxobutanoate hydroxymethyltransferaseX [42]
Os01g01246502.911.84Bowman–Birk type protease inhibitorX [34]
Os05g01615002.732.75Calcium-activated (p)ppGpp synthetaseX [43]
Os02g08080002.571.98Wall-associated receptor kinase 2X [44]
Os05g05862002.531.35Gretchen hagen 3 (GH3)X [45]
Os08g01901002.382.12Germin-like proteinX [33]
Os12g05030002.082.08Allantoin transporterX [46]
Os09g04392001.971.24Jasmonate ZIM-domain proteinXX[38,39]
Os01g01086001.761.51Basic helix-loop-helix dimerization region bHLH domain containing proteinXX[38,39]
Os02g01813001.751.56WRKY transcription factorXX[38,47]
Os03g04028001.710.89TIFY family protein, JASMONATE-ZIM domain (JAZ) proteinXX[38,39]
Os03g01986001.711.56Homeodomain-leucine zipper transcription factor; regulation of panicle exertionXX[38,48]
Os12g01388001.591.92Six-bladed beta-propeller, TolB-like domain containing proteinXX[38,49]
Os12g05484011.581.64Proteinase inhibitorX [50]
Os06g02316001.531.13RING-H2 finger protein ATL1QX [51]
Os07g04759001.501.52ACT domain containing protein kinaseX [52]
Os12g02672001.461.32Cyclopropane-fatty-acyl-phospholipid synthaseX [53]
Os09g04013001.450.57JASMONATE ZIM-domain (JAZ)XX[38,39]
Os07g01382001.371.51NAC transcription factor; ABA-induced leaf senescence and tilleringX [54]
Os01g03148001.321.11Late embryogenesis abundant protein 3X [35]
Os11g06447001.291.61Plant disease-resistance response proteinX [55]
Os06g01121001.171.03Nucleoside phosphorylase
Os05g01268001.151.02Mss4-like domain containing proteinX [56]
Os01g03700001.141.33NADH:flavin oxidoreductase/NADH oxidaseX [57]
Os05g05422001.060.69Alpha/beta hydrolase fold-1 domain containing proteinX [58]
Os09g02489001.041.30Myb/SANT-like domain containing proteinXX[38,39]
Os07g06334000.901.51IQ calmodulin-binding region domain containing proteinX [59]
Os12g06264000.820.84Phytoene synthase 1
Os04g05171000.740.61SG2-type MYB transcription factor; cold tolerance; resistance to fungal and bacterial pathogensXX[38,39]
* Genes involved in jasmonate (JA) signaling pathway.
Table 2. Outline of previous studies on the effects of LPS in plants.
PlantBacteriaConcentration (μg/mL)Response to LPSReference
Arabidopsis thalianaBurkholderia cepacia100Activation of nitric oxide synthase (NOS) and induction of defense genes[72]
Arabidopsis thalianaXanthomonas campestris50Elicitation of innate immunity[65]
Arabidopsis thalianaPseudomonas syringae
E. coli
100Induction of systemic acquired resistance (SAR)[73]
Arabidopsis thalianaPseudomonas chlororaphis O6100Stomatal closure and induction of systemic tolerance to drought[74]
Arabidopsis thalianaXanthomonas campestris50 (lipid A)Induction of pathogenesis-related 1 (PR1) gene[75]
Arabidopsis thalianaBurkholderia cepacia20 (lipid A).Induction of defense-related genes[76]
Arabidopsis thalianaBurkholderia cepacia100 (LPS)
20 (lipid A)
Induction of defense-related metabolites synthesis[66]
Arabidopsis thalianaPectobacterium atrosepticum
Pectobacterium carotovorum subsp. carotovorum
10 to 100Induction of defense response[77]
Arabidopsis thalianaBurkholderia cepacia80Induction of phytoalexin synthesis[25]
Arabidopsis thalianaPseudomonas aeruginosa100Stomatal closure[78]
Arabidopsis thalianaE. coli
Pseudomonas aeruginosa
LPS (E.) 10
LPS (P.) 100
ROS generation[23]
Arabidopsis thalianaPseudomonas aeruginosa100Induction of defense response[79]
Arabidopsis thalianaPseudomonas aeruginosaLPS 25
Lipid A 10
ROS generation
Inhibition of seedling growth
[24]
Arabidopsis thalianaPseudomonas aeruginosa100Enhanced resistance to pathogen
Activation of SA signaling pathway
[80]
Arabidopsis thalianaBurkholderia cepacian
Pseudomonas syringae
Xanthomonas campestris
100Induction of defense-related metabolites synthesis[81]
Arabidopsis thalianaXanthomonas campestris100Induction of defense response[82]
Oryza sativaXanthomonas oryzae50ROS generation[22]
Oryza sativaXanthomonas oryzae100Induction of defense response[83]
Oryza sativaPseudomonas aeruginosa, E. coli50Induction of immune response[84]
Solanum tuberosumRhizobium etli strain G12100 to 1000Resistance to nematode infection[27]
Triticum aestivumAzospirillum brasilense Sp245100Growth promotion, ROS generation[85]
Triticum aestivumAzospirillum brasilense Sp2452–5Promotion of plant development (plant aging, spike formation, and size)[28]
Triticum aestivumAzospirillum brasilense SR81000Root hair deformations[67]
Nicotiana tabacumBurkholderia cepacia100Induction of defense response[86]
Nicotiana tabacumBurkholderia cepacia100ROS generation[87]
Nicotiana tabacumXanthomonas campestris10
(5 to 500)
ROS generation[64]
Nicotiana tabacumXanthomonas campestris pv. campestris20ROS generation[88]
Nicotiana tabacumBurkholderia cepacia100Induction of innate immunity
ROS generation
[89]
Nicotiana tabacumBurkholderia cepacia100Induction of defense response
S-domain receptor-like kinase (RLK)
[90]
Nicotiana tabacumBurkholderia cepacia100Induction of phenylpropanoid biosynthesis[91]
Capsicum annuumXanthomonas axonopodis pv. Vesicatoria
X. campestris pv. campestris
50Accumulation of salicylic acid (SA), coumaroyl-tyramine (CT), and feruloyl-tyramine (FT)[92]
Sorghum bicolorBurkholderia andropogonis100Induction of secondary metabolites synthesis[93]
Vitis viniferaXylella fastidiosa50Induction of defense response against pathogens[94]
PNSBConcentration
Brassica rapa var. perviridisRhodobacter sphaeroides NBRC 12203T10 pg/mLGrowth promotion[18]
Oryza sativaR. sphaeroides NBRC 12203T5 ng/mLPromotion of root development[19]
Oryza sativaR. sphaeroides NBRC 12203T10 pg/mLStimulation of JA signaling pathway
Induction of secondary metabolites synthesis
Present study
Disclaimer/Publisher’s Note: The statements, opinions and data contained in all publications are solely those of the individual author(s) and contributor(s) and not of MDPI and/or the editor(s). MDPI and/or the editor(s) disclaim responsibility for any injury to people or property resulting from any ideas, methods, instructions or products referred to in the content.

