
Shared and Distinct Gut Microbial Profiles in Saudi Women with Metabolically Healthy and Unhealthy Obesity

 ,
,  , , and
Abstract
1. Introduction
2. Materials and Methods
2.1. Study Design
2.2. Biochemical Data
2.3. Anthropometric Indices
2.4. Obesity Phenotypes
2.5. Stool Collection Characterization of Gut Composition
2.6. Dietary Data
2.7. Statistical Analyses
3. Results
3.1. Characteristics of Participants
3.2. Anthropometric Indices, Biochemical Data, and Gut Flora Stratified by Obesity Phenotype
3.3. Correlations of Metabolic Markers with Gut Flora for Each Obesity Phenotype
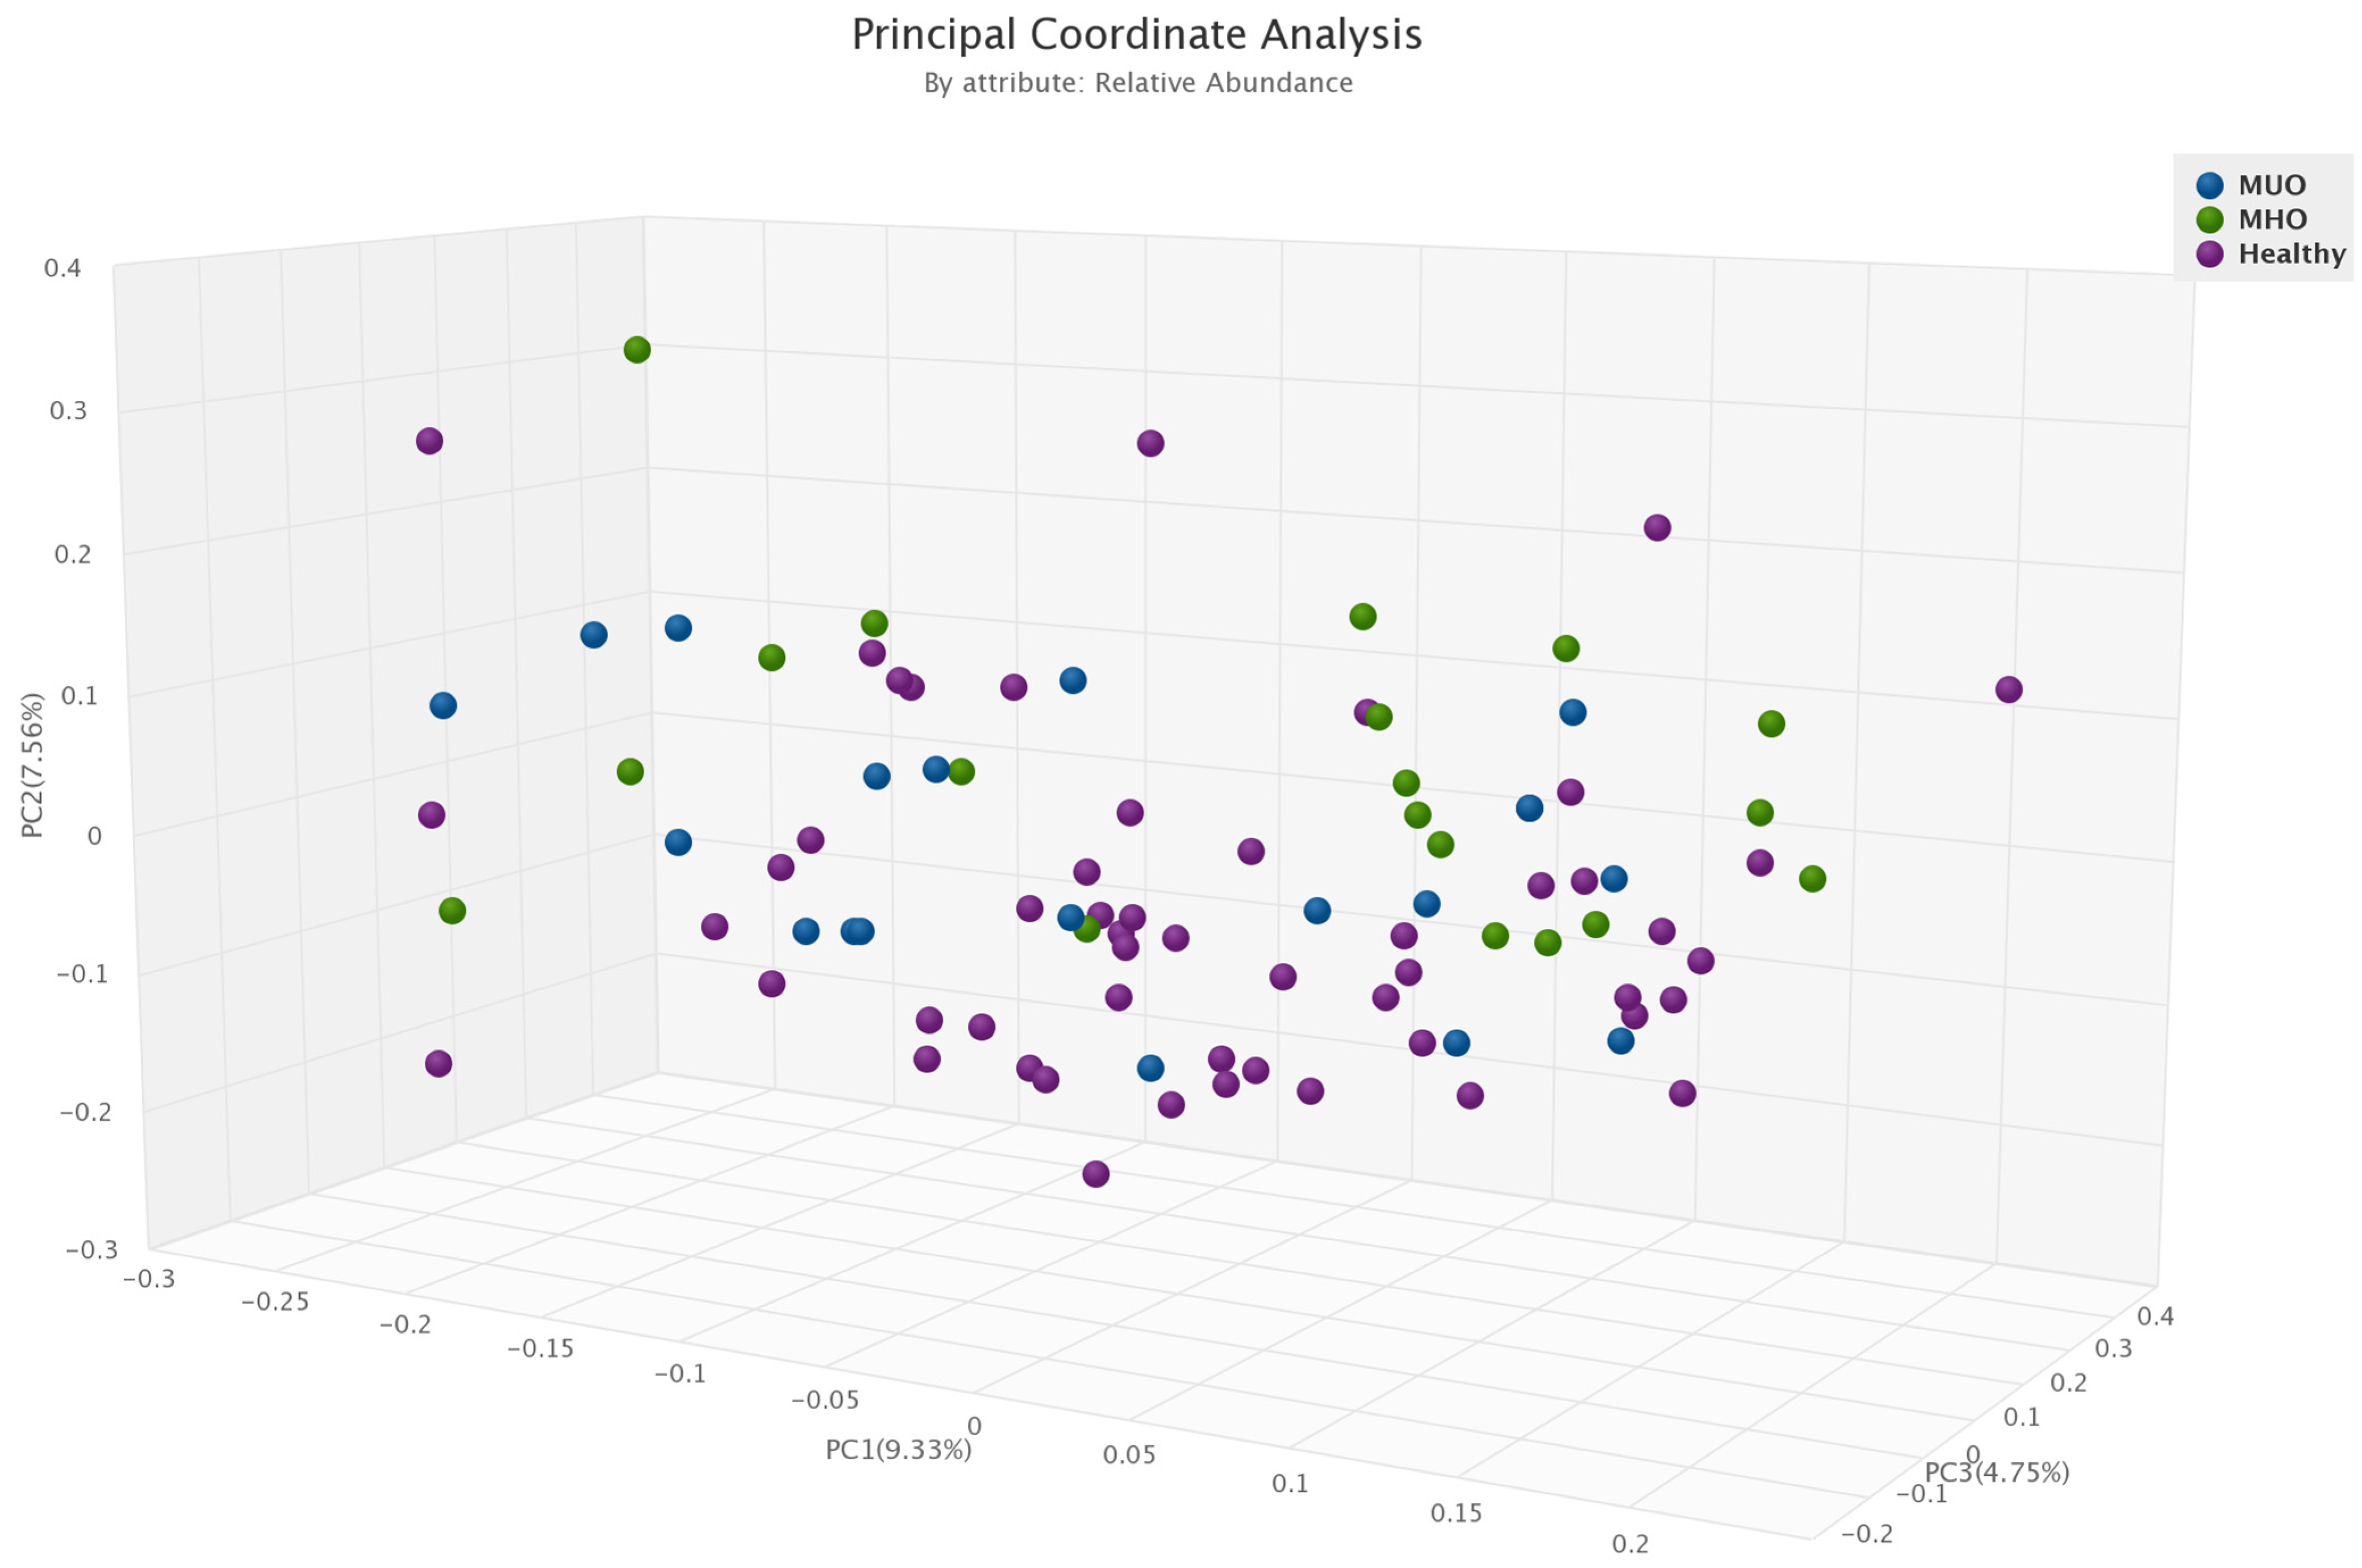
3.4. α- and β-Diversity in Each Obesity Phenotype
4. Discussion
5. Conclusions
Supplementary Materials
Author Contributions
Funding
Institutional Review Board Statement
Informed Consent Statement
Data Availability Statement
Conflicts of Interest
References
- World Health Organization (WHO). Obesity. 2016. Available online: https://www.who.int/topics/obesity/en/ (accessed on 25 February 2023).
- Dixon, J.B. The effect of obesity on health outcomes. Mol. Cell. Endocrinol. 2010, 316, 104–108. [Google Scholar] [CrossRef]
- Nuttall, F.Q. Body mass index: Obesity, BMI, and health: A critical review. Nutr. Today 2015, 50, 117. [Google Scholar] [CrossRef] [PubMed]
- Iacobini, C.; Pugliese, G.; Fantauzzi, C.B.; Federici, M.; Menini, S. Metabolically healthy versus metabolically unhealthy obesity. Metabolism 2019, 92, 51–60. [Google Scholar] [CrossRef] [PubMed]
- Phillips, C.M. Metabolically healthy obesity: Definitions, determinants and clinical implications. Rev. Endocr. Metab. Disord. 2013, 14, 219–227. [Google Scholar] [CrossRef]
- Hinnouho, G.-M.; Czernichow, S.; Dugravot, A.; Nabi, H.; Brunner, E.J.; Kivimaki, M.; Singh-Manoux, A. Metabolically healthy obesity and the risk of cardiovascular disease and type 2 diabetes: The Whitehall II cohort study. Eur. Heart J. 2015, 36, 551–559. [Google Scholar] [CrossRef]
- Kim, M.-H.; Yun, K.E.; Kim, J.; Park, E.; Chang, Y.; Ryu, S.; Kim, H.-L.; Kim, H.-N. Gut microbiota and metabolic health among overweight and obese individuals. Sci. Rep. 2020, 10, 19417. [Google Scholar] [CrossRef]
- Den Besten, G.; Van Eunen, K.; Groen, A.K.; Venema, K.; Reijngoud, D.-J.; Bakker, B.M. The role of short-chain fatty acids in the interplay between diet, gut microbiota, and host energy metabolism. J. Lipid Res. 2013, 54, 2325–2340. [Google Scholar] [CrossRef] [PubMed]
- Arora, T.; Bäckhed, F. The gut microbiota and metabolic disease: Current understanding and future perspectives. J. Intern. Med. 2016, 280, 339–349. [Google Scholar] [CrossRef]
- Qin, J.; Li, R.; Raes, J.; Arumugam, M.; Burgdorf, K.S.; Manichanh, C.; Nielsen, T.; Pons, N.; Levenez, F.; Yamada, T.; et al. A human gut microbial gene catalogue established by metagenomic sequencing. Nature 2010, 464, 59–65. [Google Scholar] [CrossRef]
- Gensollen, T.; Iyer, S.S.; Kasper, D.L.; Blumberg, R.S. How colonization by microbiota in early life shapes the immune system. Science 2016, 352, 539–544. [Google Scholar] [CrossRef]
- Natividad, J.M.; Verdu, E.F. Modulation of intestinal barrier by intestinal microbiota: Pathological and therapeutic implications. Pharmacol. Res. 2013, 69, 42–51. [Google Scholar] [CrossRef]
- Bäumler, A.J.; Sperandio, V. Interactions between the microbiota and pathogenic bacteria in the gut. Nature 2016, 535, 85–93. [Google Scholar] [CrossRef] [PubMed]
- Thursby, E.; Juge, N. Introduction to the human gut microbiota. Biochem. J. 2017, 474, 1823–1836. [Google Scholar] [CrossRef] [PubMed]
- Moreno-Indias, I.; Sánchez-Alcoholado, L.; García-Fuentes, E.; Cardona, F.; Queipo-Ortuño, M.I.; Tinahones, F.J. Insulin resistance is associated with specific gut microbiota in appendix samples from morbidly obese patients. Am. J. Transl. Res. 2016, 8, 5672. [Google Scholar] [PubMed]
- Tilg, H.; Moschen, A.R. Microbiota and diabetes: An evolving relationship. Gut 2014, 63, 1513–1521. [Google Scholar] [CrossRef]
- Stachowicz, N.; Kiersztan, A. The role of gut microbiota in the pathogenesis of obesity and diabetes. Postep. Hig. Med. Dosw. (Online) 2013, 67, 288–303. [Google Scholar] [CrossRef]
- Tagliabue, A.; Elli, M. The role of gut microbiota in human obesity: Recent findings and future perspectives. Nutr. Metab. Cardiovasc. Dis. 2013, 23, 160–168. [Google Scholar] [CrossRef]
- Eckburg, P.B.; Bik, E.M.; Bernstein, C.N.; Purdom, E.; Dethlefsen, L.; Sargent, M.; Gill, S.R.; Nelson, K.E.; Relman, D.A. Diversity of the human intestinal microbial flora. Science 2005, 308, 1635–1638. [Google Scholar] [CrossRef]
- Hermes, G.D.; Reijnders, D.; Kootte, R.S.; Goossens, G.H.; Smidt, H.; Nieuwdorp, M.; Blaak, E.E.; Zoetendal, E.G. Individual and cohort-specific gut microbiota patterns associated with tissue-specific insulin sensitivity in overweight and obese males. Sci. Rep. 2020, 10, 7523. [Google Scholar] [CrossRef]
- Duncan, S.H.; Lobley, G.E.; Holtrop, G.; Ince, J.; Johnstone, A.M.; Louis, P.; Flint, H.J. Human colonic microbiota associated with diet, obesity and weight loss. Int. J. Obes. 2008, 32, 1720–1724. [Google Scholar] [CrossRef]
- Yasir, M.; Angelakis, E.; Bibi, F.; Azhar, E.I.; Bachar, D.; Lagier, J.C.; Gaborit, B.; Hassan, A.M.; Jiman-Fatani, A.A.; Alshali, K.Z.; et al. Comparison of the gut microbiota of people in France and Saudi Arabia. Nutr. Diabetes 2015, 5, e153. [Google Scholar] [CrossRef]
- Hermes, G.D.; Zoetendal, E.G.; Smidt, H. Molecular ecological tools to decipher the role of our microbial mass in obesity. Benef. Microbes 2015, 6, 61–81. [Google Scholar] [CrossRef] [PubMed]
- Karlsson, F.H.; Tremaroli, V.; Nookaew, I.; Bergström, G.; Behre, C.J.; Fagerberg, B.; Nielsen, J.; Bäckhed, F. Gut metagenome in European women with normal, impaired and diabetic glucose control. Nature 2013, 498, 99–103. [Google Scholar] [CrossRef]
- Aljazairy, E.A.A.; Al-Musharaf, S.; Abudawood, M.; Almaarik, B.; Hussain, S.D.; Alnaami, A.M.; Sabico, S.; Al-Daghri, N.M.; Clerici, M.; Aljuraiban, G.S. Influence of Adiposity on the Gut Microbiota Composition of Arab Women: A Case-Control Study. Biology 2022, 11, 1586. [Google Scholar] [CrossRef]
- Friedewald, W.T.; Levy, R.I.; Fredrickson, D.S. Estimation of the concentration of low-density lipoprotein cholesterol in plasma, without use of the preparative ultracentrifuge. Clin. Chem. 1972, 18, 499–502. [Google Scholar] [CrossRef]
- WHO. Obesity and Overweight. Available online: http://www.who.int/news-room/fact-sheets/detail/obesity-and-overweight (accessed on 25 February 2023).
- So, W.-Y.; Swearingin, B.; Crooms, B.; Lee, R.; Choi, Y.; Dail, T.K.; Ha, C. Body composition measurements determined by air displacement plethysmography and eight-polar bioelectrical impedance analysis are equivalent in African American college students. HealthMED 2012, 6, 1896–1899. [Google Scholar]
- Al-Lawati, J.A.; Barakat, N.M.; Al-Lawati, A.M.; Mohammed, A.J. Optimal cut-points for body mass index, waist circumference and waist-to-hip ratio using the Framingham coronary heart disease risk score in an Arab population of the Middle East. Diabetes Vasc. Dis. Res. 2008, 5, 304–309. [Google Scholar] [CrossRef]
- Balkau, B.; Charles, M.A. Comment on the provisional report from the WHO consultation. European Group for the Study of Insulin Resistance (EGIR). Diabet Med. 1999, 16, 442–443. [Google Scholar] [CrossRef] [PubMed]
- Executive Summary of The Third Report of The National Cholesterol Education Program (NCEP) Expert Panel on Detection, Evaluation, And Treatment of High Blood Cholesterol In Adults (Adult Treatment Panel III). JAMA 2001, 285, 2486–2497. [CrossRef] [PubMed]
- Karelis, A.D.; Brochu, M.; Rabasa-Lhoret, R. Can we identify metabolically healthy but obese individuals (MHO)? Diabetes Metab. 2004, 30, 569–572. [Google Scholar] [CrossRef] [PubMed]
- Rey-López, J.P.; de Rezende, L.F.; Pastor-Valero, M.; Tess, B.H. The prevalence of metabolically healthy obesity: A systematic review and critical evaluation of the definitions used. Obes. Rev. 2014, 15, 781–790. [Google Scholar] [CrossRef]
- Mas-Lloret, J.; Obón-Santacana, M.; Ibáñez-Sanz, G.; Guinó, E.; Pato, M.L.; Rodriguez-Moranta, F.; Mata, A.; García-Rodríguez, A.; Moreno, V.; Pimenoff, V.N. Gut microbiome diversity detected by high-coverage 16S and shotgun sequencing of paired stool and colon sample. Sci. Data 2020, 7, 92. [Google Scholar] [CrossRef]
- Ottesen, A.; Ramachandran, P.; Reed, E.; White, J.R.; Hasan, N.; Subramanian, P.; Ryan, G.; Jarvis, K.; Grim, C.; Daquiqan, N.; et al. Enrichment dynamics of Listeria monocytogenes and the associated microbiome from naturally contaminated ice cream linked to a listeriosis outbreak. BMC Microbiol. 2016, 16, 275. [Google Scholar] [CrossRef]
- Ponnusamy, D.; Kozlova, E.V.; Sha, J.; Erova, T.E.; Azar, S.R.; Fitts, E.C.; Kirtley, M.L.; Tiner, B.L.; Andersson, J.A.; Grim, C.J.; et al. Cross-talk among flesh-eating Aeromonas hydrophila strains in mixed infection leading to necrotizing fasciitis. Proc. Natl. Acad. Sci. USA 2016, 113, 722. [Google Scholar] [CrossRef]
- Hasan, N.A.; Young, B.A.; Minard-Smith, A.T.; Saeed, K.; Li, H.; Heizer, E.M.; McMillan, N.J.; Isom, R.; Abdullah, A.S.; Bornman, D.M.; et al. Microbial community profiling of human saliva using shotgun metagenomic sequencing. PLoS ONE 2014, 9, e97699. [Google Scholar] [CrossRef] [PubMed]
- Lax, S.; Smith, D.P.; Hampton-Marcell, J.; Owens, S.M.; Handley, K.M.; Scott, N.M.; Gibbons, S.M.; Larsen, P.; Shogan, B.D.; Weiss, S.; et al. Longitudinal analysis of microbial interaction between humans and the indoor environment. Science 2014, 345, 1048. [Google Scholar] [CrossRef]
- Alkhalaf, M.; Edwards, C.; Combet, E. Validation of a food frequency questionnaire specific for salt intake in Saudi Arabian adults using urinary biomarker and repeated multiple pass 24-hour dietary recall. Proc. Nutr. Soc. 2015, 74, e337. [Google Scholar] [CrossRef]
- Cheng, J.; Hu, J.; Geng, F.; Nie, S. Bacteroides utilization for dietary polysaccharides and their beneficial effects on gut health. Food Sci. Hum. Wellness 2022, 11, 1101–1110. [Google Scholar] [CrossRef]
- Crovesy, L.; Masterson, D.; Rosado, E.L. Profile of the gut microbiota of adults with obesity: A systematic review. Eur. J. Clin. Nutr. 2020, 74, 1251–1262. [Google Scholar] [CrossRef] [PubMed]
- Ley, R.E.; Turnbaugh, P.J.; Klein, S.; Gordon, J.I. Microbial ecology: Human gut microbes associated with obesity. Nature 2006, 444, 1022–1023. [Google Scholar] [CrossRef] [PubMed]
- Wang, C.; Zhao, J.; Zhang, H.; Lee, Y.-K.; Zhai, Q.; Chen, W. Roles of intestinal bacteroides in human health and diseases. Crit. Rev. Food Sci. Nutr. 2021, 61, 3518–3536. [Google Scholar] [CrossRef]
- Duan, M.; Wang, Y.; Zhang, Q.; Zou, R.; Guo, M.; Zheng, H. Characteristics of gut microbiota in people with obesity. PLoS ONE 2021, 16, e0255446. [Google Scholar] [CrossRef] [PubMed]
- Lee, D.K.; Jang, S.; Kim, M.J.; Kim, J.H.; Chung, M.J.; Kim, K.J.; Ha, N.J. Anti-proliferative effects of Bifidobacterium adolescentis SPM0212 extract on human colon cancer cell lines. BMC Cancer 2008, 8, 310. [Google Scholar] [CrossRef] [PubMed]
- Rerksuppaphol, S.; Rerksuppaphol, L. Lactobacillus acidophilus and Bifidobacterium bifidum stored at ambient temperature are effective in the treatment of acute diarrhoea. Ann. Trop. Paediatr. 2010, 30, 299–304. [Google Scholar] [CrossRef] [PubMed]
- Zhang, X.-F.; Guan, X.-X.; Tang, Y.-J.; Sun, J.-F.; Wang, X.-K.; Wang, W.-D.; Fan, J.-M. Clinical effects and gut microbiota changes of using probiotics, prebiotics or synbiotics in inflammatory bowel disease: A systematic review and meta-analysis. Eur. J. Nutr. 2021, 60, 2855–2875. [Google Scholar] [CrossRef]
- Solito, A.; Bozzi Cionci, N.; Calgaro, M.; Caputo, M.; Vannini, L.; Hasballa, I.; Archero, F.; Giglione, E.; Ricotti, R.; Walker, G.E.; et al. Supplementation with Bifidobacterium breve BR03 and B632 strains improved insulin sensitivity in children and adolescents with obesity in a cross-over, randomized double-blind placebo-controlled trial. Clin. Nutr. 2021, 40, 4585–4594. [Google Scholar] [CrossRef]
- Schellekens, H.; Torres-Fuentes, C.; van de Wouw, M.; Long-Smith, C.M.; Mitchell, A.; Strain, C.; Berding, K.; Bastiaanssen, T.F.S.; Rea, K.; Golubeva, A.V.; et al. Bifidobacterium longum counters the effects of obesity: Partial successful translation from rodent to human. EBioMedicine 2021, 63, 103176. [Google Scholar] [CrossRef]
- Fu, J.; Bonder, M.J.; Cenit, M.C.; Tigchelaar, E.F.; Maatman, A.; Dekens, J.A.; Brandsma, E.; Marczynska, J.; Imhann, F.; Weersma, R.K. The gut microbiome contributes to a substantial proportion of the variation in blood lipids. Circ. Res. 2015, 117, 817–824. [Google Scholar] [CrossRef]
- Chen, Z.; Radjabzadeh, D.; Chen, L.; Kurilshikov, A.; Kavousi, M.; Ahmadizar, F.; Ikram, M.A.; Uitterlinden, A.G.; Zhernakova, A.; Fu, J. Association of insulin resistance and type 2 diabetes with gut microbial diversity: A microbiome-wide analysis from population studies. JAMA Netw. Open 2021, 4, e2118811. [Google Scholar] [CrossRef]
- Alcazar, M.; Escribano, J.; Ferré, N.; Closa-Monasterolo, R.; Selma-Royo, M.; Feliu, A.; Castillejo, G.; Luque, V.; Feliu-Rovira, A.; Muñoz-Hernando, J. Gut microbiota is associated with metabolic health in children with obesity. Clin. Nutr. 2022, 41, 1680–1688. [Google Scholar] [CrossRef]
- Zhong, X.; Harrington, J.M.; Millar, S.R.; Perry, I.J.; O’Toole, P.W.; Phillips, C.M. Gut microbiota associations with metabolic health and obesity status in older adults. Nutrients 2020, 12, 2364. [Google Scholar] [CrossRef] [PubMed]
- Chávez-Carbajal, A.; Nirmalkar, K.; Pérez-Lizaur, A.; Hernández-Quiroz, F.; Ramírez-del-Alto, S.; García-Mena, J.; Hernández-Guerrero, C. Gut microbiota and predicted metabolic pathways in a sample of Mexican women affected by obesity and obesity plus metabolic syndrome. Int. J. Mol. Sci. 2019, 20, 438. [Google Scholar] [CrossRef] [PubMed]
- Ferrocino, I.; Di Cagno, R.; De Angelis, M.; Turroni, S.; Vannini, L.; Bancalari, E.; Rantsiou, K.; Cardinali, G.; Neviani, E.; Cocolin, L. Fecal microbiota in healthy subjects following omnivore, vegetarian and vegan diets: Culturable populations and rRNA DGGE profiling. PLoS ONE 2015, 10, e0128669. [Google Scholar] [CrossRef]
- Salazar, N.; Arboleya, S.; Fernández-Navarro, T.; de Los Reyes-Gavilán, C.G.; Gonzalez, S.; Gueimonde, M. Age-associated changes in gut microbiota and dietary components related with the immune system in adulthood and old age: A cross-sectional study. Nutrients 2019, 11, 1765. [Google Scholar] [CrossRef]
- Wang, T.; Goyal, A.; Dubinkina, V.; Maslov, S. Evidence for a multi-level trophic organization of the human gut microbiome. PLoS Comput. Biol. 2019, 15, e1007524. [Google Scholar] [CrossRef] [PubMed]
- Goyal, A.; Wang, T.; Dubinkina, V.; Maslov, S. Ecology-guided prediction of cross-feeding interactions in the human gut microbiome. Nat. Commun. 2021, 12, 1335. [Google Scholar] [CrossRef] [PubMed]
- Holmes, E.; Loo, R.L.; Stamler, J.; Bictash, M.; Yap, I.K.; Chan, Q.; Ebbels, T.; De Iorio, M.; Brown, I.J.; Veselkov, K.A. Human metabolic phenotype diversity and its association with diet and blood pressure. Nature 2008, 453, 396–400. [Google Scholar] [CrossRef]
- Sung, J.; Kim, S.; Cabatbat, J.J.T.; Jang, S.; Jin, Y.-S.; Jung, G.Y.; Chia, N.; Kim, P.-J. Global metabolic interaction network of the human gut microbiota for context-specific community-scale analysis. Nat. Commun. 2017, 8, 15393. [Google Scholar] [CrossRef]
- Visconti, A.; Le Roy, C.I.; Rosa, F.; Rossi, N.; Martin, T.C.; Mohney, R.P.; Li, W.; de Rinaldis, E.; Bell, J.T.; Venter, J.C. Interplay between the human gut microbiome and host metabolism. Nat. Commun. 2019, 10, 4505. [Google Scholar] [CrossRef]
- The Human Microbiome Project Consortium. Structure, function and diversity of the healthy human microbiome. Nature 2012, 486, 207–214. [Google Scholar] [CrossRef]
- Cheng, D.; Zhao, X.; Yang, S.; Cui, H.; Wang, G. Metabolomic signature between metabolically healthy overweight/obese and metabolically unhealthy overweight/obese: A systematic review. Diabetes Metab. Syndr. Obes. Targets Ther. 2021, 14, 991–1010. [Google Scholar] [CrossRef]
- Phillips, C.M. Metabolically healthy obesity across the life course: Epidemiology, determinants, and implications. Ann. N. Y. Acad. Sci. J. 2017, 1391, 85–100. [Google Scholar] [CrossRef] [PubMed]
- Karelis, A.D.; Faraj, M.; Bastard, J.-P.; St-Pierre, D.H.; Brochu, M.; Prud’homme, D.; Rabasa-Lhoret, R. The metabolically healthy but obese individual presents a favorable inflammation profile. J. Clin. Endocrinol. Metab. 2005, 90, 4145–4150. [Google Scholar] [CrossRef]
- Shaharyar, S.; Roberson, L.L.; Jamal, O.; Younus, A.; Blaha, M.J.; Ali, S.S.; Zide, K.; Agatston, A.A.; Blumenthal, R.S.; Conceição, R.D. Obesity and metabolic phenotypes (metabolically healthy and unhealthy variants) are significantly associated with prevalence of elevated C-reactive protein and hepatic steatosis in a large healthy Brazilian population. J. Obes. 2015, 2015, 178526. [Google Scholar] [CrossRef]
- Liao, C.; Gao, W.; Cao, W.; Lv, J.; Yu, C.; Wang, S.; Pang, Z.; Cong, L.; Wang, H.; Wu, X. Associations of metabolic/obesity phenotypes with insulin resistance and C-reactive protein: Results from the cntr study. Diabetes Metab. Syndr. Obes. Targets Ther. 2021, 14, 1141–1151. [Google Scholar] [CrossRef] [PubMed]
- Iglesias Molli, A.E.; Penas Steinhardt, A.; López, A.P.; González, C.D.; Vilarino, J.; Frechtel, G.D.; Cerrone, G.E. Metabolically healthy obese individuals present similar chronic inflammation level but less insulin-resistance than obese individuals with metabolic syndrome. PLoS ONE 2017, 12, e0190528. [Google Scholar] [CrossRef]
- Oguoma, V.M.; Abu-Farha, M.; Coffee, N.T.; Alsharrah, S.; Al-Refaei, F.H.; Abubaker, J.; Daniel, M.; Al-Mulla, F. Metabolically healthy and unhealthy obese phenotypes among Arabs and South Asians: Prevalence and relationship with cardiometabolic indicators. Nutrients 2022, 14, 915. [Google Scholar] [CrossRef] [PubMed]
- Brumfield, K.D.; Huq, A.; Colwell, R.R.; Olds, J.L.; Leddy, M.B. Microbial resolution of whole genome shotgun and 16S amplicon metagenomic sequencing using publicly available NEON data. PLoS ONE 2020, 15, e0228899. [Google Scholar] [CrossRef]


| Variables | Healthy (n = 48) | Metabolically Healthy Obesity (n = 19) | Metabolically Unhealthy Obesity (n = 19) | p-Value |
|---|---|---|---|---|
| Age (years) | 21.1 (21.1–21.1) | 21.1 (21.1–21.1) | 21.1 (21.1–21.1) | 1.00 |
| Energy (Kcal/day) | 4397.3 (2871.2–5923.5) | 3078.9 (546.8–5611) | 3340.9 (680.6–6001.2) | 0.61 |
| BMI (kg/m2) | 23.3 (22.1–24.5) | 36.2 (34.2–38.2) | 35.8 (33.7–38) | <0.0001 |
| Waist (cm) | 68 (65.6–70.3) | 97.8 (94–101.7) | 99.1 (95.1–103.1) | <0.0001 |
| WHR (ratio) | 0.7 (0.7–0.7) | 0.8 (0.8–0.9) | 0.8 (0.8–0.9) | <0.0001 |
| Fat (%) | 38.1 (36–40.3) | 53.1 (50.1–56) | 51.2 (48.3–54) | <0.0001 |
| Muscle mass (%) | 29.5 (27.1–31.8) | 26.3 (22.5–30.2) | 27.2 (23.2–31.3) | 0.33 |
| Biochemical Data | ||||
| Total Cholesterol (mmol/L) | 3.7 (3.3–4.1) | 3.8 (3.1–4.5) | 5.2 (4.5–5.8) | 0.002 |
| HDL-C (mmol/L) | 1 (0.8–1.1) | 1.1 (0.9–1.2) | 1.1 (0.9–1.2) | 0.41 |
| LDL-C (mmol/L) | 2.7 (2.3–3) | 2.6 (2–3.2) | 3.9 (3.4–4.5) | 0.001 |
| Triglycerides (mmol/L) | 0.6 (0.5–0.7) | 1 (0.8–1.1) | 1 (0.9–1.2) | <0.0001 |
| FBG (mmol/L) | 4.3 (4.1–4.5) | 5 (4.6–5.3) | 4.8 (4.4–5.2) | 0.01 |
| Insulin (µIU/mL) | 7.9 (6.4–9.4) | 15.7 (13.3–18.2) | 17.4 (14.9–19.9) | <0.0001 |
| HOMA-IR | 1.4 (1.1–1.8) | 3.5 (2.9–4.1) | 3.7 (3.2–4.3) | <0.0001 |
| hs-CRP (mg/L) | 2.2 (7.6–3.7) | 5.9 (3.5–8.3) | 10.4 (8.3–13.2) | <0.0001 |
| Gut flora | ||||
| Bacteroidetes | 0.7 (0.7–0.7) | 0.7 (0.6–0.8) | 0.8 (0.7–0.8) | 0.23 |
| Bacteria (unidentified phylum) | 0.001 (0.001–0.001) | 0.001 (0.0002–0.001) | 0.0004 (−0.0003–0.001) | 0.41 |
| Bacteroides (unidentified species) | 0.003 (0.001–0.005) | 0.01 (0.003–0.01) | 0.01 (0.003–0.01) | 0.06 |
| Bacteroides uniformis | 0.1 (0.1–0.1) | 0.1 (0.03–0.1) | 0.1 (0.1–0.1) | 0.03 |
| Bifidobacterium adolescentis | 0.01 (0.01–0.01) | 0.01 (0.002–0.01) | 0.01 (−0.0003–0.01) | 0.51 |
| Bifidobacterium kashiwanohense | 0.001 (0.001–0.002) | 0.001 (0.0002–0.002) | 0.0005 (−0.0005–0.001) | 0.51 |
| Bifidobacterium longum | 0.01 (0.01–0.01) | 0.01 (0.003–0.01) | 0.01 (0.003–0.01) | 0.69 |
| Bifidobacterium merycicum | 0.00002 (−0.0001–0.0001) | 0.0003 (0.0001–0.0004) | 0.00001 (0.0002–0.0002) | 0.03 |
| Clostridium difficile | 0.0001 (−0.00003–0.0002) | 0.00004 (−0.0002–0.0003) | 0.0002 (−0.00004–0.0004) | 0.63 |
| Clostridium Bolteae | 0.001 (0.0003–0.001) | 0.001 (0.0002–0.002) | 0.001 (−0.0001–0.002) | 0.82 |
| Fusobacteria | 0.00005 (−0.0002–0.0003) | 0.00001 (−0.0004–0.0004) | 0.0003 (−0.0001–0.001) | 0.43 |
| Actinobacteria | 0.04 (0.03–0.1) | 0.04 (0.02–0.1) | 0.03 (0.01–0.04) | 0.18 |
| Akkermansia muciniphila | 0.01 (0.003–0.01) | 0.002 (−0.003–0.01) | 0.003 (−0.002–0.01) | 0.28 |
| Proteobacteria | 0.01 (0.01–0.02) | 0.02 (0.01–0.02) | 0.01 (0.01–0.02) | 0.73 |
| Faecalibacterium Prausnitzii | 0.02 (0.02–0.03) | 0.02 (0.02–0.03) | 0.02 (0.01–0.03) | 0.76 |
| Firmicutes | 0.2 (0.2–0.3) | 0.2 (0.2–0.3) | 0.2 (0.2–0.3) | 0.39 |
| Flavonifractor plautii | 0.001 (0.001–0.001) | 0.001 (0.0005–0.002) | 0.001 (0.0004–0.002) | 0.98 |
| Lactobacillus acidophilus | 0.00002 (−0.00003–0.0001) | 0.0001 (0.0001–0.0002) | 0.00001 (−0.0001–0.0001) | 0.32 |
| Verrucomicrobia | 0.01 (0.003–0.01) | 0.002 (−0.003–0.01) | 0.003 (−0.002–0.01) | 0.31 |
| Dietary Data | ||||
| Total energy (kcal/d) | 3222 (841–1503) | 3149 (678–1619) | 4564 (1951–2177) | 0.08 |
| Carbohydrate (%) | 49.3 (44.0–54.5) | 41.7 (36.0–47.4) | 45.7 (42.0–49.4) | 0.15 |
| Protein (%) | 16.3 (13.5–18.2) | 15.2 (13.2–17.2) | 15.5 (14.2–16.8) | 0.60 |
| Fat (%) | 34.4 (29.5–39.2) | 38.7 (35.3–42.2) | 43.1 (37.9–48.4) | 0.05 |
| BMI | Waist | HDL-C (mmol/L) | LDL-C (mmol/L) | TG (mmol/L) | FBG (mmol/L) | Insulin (µIU/mL) | HOMA-IR | hs-CRP ng/mL | |
|---|---|---|---|---|---|---|---|---|---|
| Bacteroidetes | −0.07 | 0.16 | −0.13 | −0.04 | −0.04 | 0.03 | 0.23 | 0.23 | −0.11 |
| Bacteria (unidentified phylum) | 0.07 | 0.03 | 0.02 | −0.01 | 0.24 | 0.09 | −0.09 | −0.10 | 0.01 |
| Bacteroides (unidentified species) | −0.16 | 0.07 | 0.16 | −0.16 | −0.12 | 0.01 | −0.01 | 0.04 | −0.22 |
| Bacteroides uniformis | 0.24 * | −0.08 | 0.09 | −0.05 | −0.02 | −0.16 | 0.08 | −0.11 | −0.01 |
| Bifidobacterium adolescentis | −0.06 | 0.05 | 0.02 | 0.01 | −0.09 | −0.03 | −0.14 | −0.10 | −0.26 * |
| Bifidobacterium kashiwanohense | −0.11 | 0.01 | 0.10 | 0.05 | 0.12 | −0.19 | −0.22 | −0.21 | −0.01 |
| Bifidobacterium longum | −0.01 | −0.25 * | 0.07 | 0.03 | 0.01 | −0.10 | −0.13 | −0.20 | −0.24 * |
| Bifidobacterium merycicum | −0.01 | −0.01 | −0.20 | 0.06 | −0.01 | −0.26 * | 0.02 | −0.05 | −0.11 |
| Clostridium difficile | −0.15 | −0.08 | −0.08 | −0.02 | −0.05 | −0.05 | 0.09 | 0.05 | −0.11 |
| Clostridium Bolteae | 0.14 | 0.09 | 0.22 | 0.01 | 0.13 | 0.22 | −0.18 | −0.17 | −0.02 |
| Actinobacteria | −0.06 | −0.08 | 0.19 | 0.07 | 0.05 | −0.09 | −0.25 * | −0.22 | −0.14 |
| Akkermansia muciniphila | −0.11 | −0.02 | 0.01 | 0.13 | 0.05 | −0.02 | −0.16 | −0.13 | −0.02 |
| Proteobacteria | −0.07 | −0.02 | −0.09 | −0.24 | −0.27 * | −0.18 | −0.30 * | −0.30 * | −0.20 |
| Faecalibacterium Prausnitzii | 0.07 | −0.09 | 0.03 | 0.09 | 0.03 | 0.06 | 0.01 | 0.06 | 0.27 |
| Firmicutes | 0.13 | −0.17 | 0.11 | 0.04 | 0.05 | 0.01 | −0.14 | −0.17 | 0.20 |
| Flavonifractor plautii | 0.17 | 0.16 | 0.49 * | 0.04 | 0.39 * | 0.15 | −0.07 | −0.06 | 0.10 |
| Lactobacillus acidophilus | 0.11 | −0.20 | 0.01 | −0.20 | −0.17 | −0.16 | 0.09 | −0.14 | −0.06 |
| Verrucomicrobia | −0.10 | −0.02 | 0.01 | 0.10 | 0.03 | −0.03 | −0.16 | −0.13 | −0.01 |
| Bacteroides faecichinchillae | −0.14 | −0.05 | −0.05 | −0.23 | −0.21 | −0.25 | 0.03 | −0.07 | −0.10 |
| Bacteroides thetaiotaomicron | −0.01 | −0.04 | 0.07 | 0.24 | 0.17 | 0.19 | −0.04 | 0.04 | −0.21 |
| Bifidobacterium pseudocatenulatu | −0.11 | −0.12 | 0.07 | 0.14 | 0.16 | 0.01 | −0.14 | −0.08 | 0.01 |
| BMI | Waist | HDL-C (mmol/L) | LDL-C (mmol/L) | TG (mmol/L) | FBG (mmol/L) | Insulin (µIU/mL) | HOMA-IR | hs-CRP ng/mL | |
|---|---|---|---|---|---|---|---|---|---|
| Bacteroidetes | 0.31 | 0.19 | 0.30 | −0.02 | 0.20 | 0.24 | 0.25 | 0.28 | 0.07 |
| Bacteria (unidentified phylum) | −0.45 * | −0.11 | −0.02 | −0.06 | 0.10 | 0.15 | −0.48 * | −0.37 | −0.23 |
| Bacteroides (unidentified species) | −0.12 | −0.26 | 0.10 | −0.01 | 0.79 * | 0.13 | 0.17 | 0.18 | −0.30 |
| Bacteroides uniformis | −0.04 | −0.04 | −0.06 | −0.07 | −0.32 | −0.29 | −0.25 | −0.28 | −0.04 |
| Bifidobacterium adolescentis | −0.54 * | −0.24 | −0.46 * | −0.08 | −0.28 | −0.55 * | −0.61 * | −0.66 * | −0.40 |
| Bifidobacterium kashiwanohense | −0.21 | −0.08 | −0.04 | 0.07 | −0.10 | −0.48 * | −0.13 | −0.25 | 0.38 |
| Bifidobacterium longum | −0.43 * | −0.07 | −0.40 | −0.03 | −0.20 | −0.54 * | −0.33 | −0.42 * | −0.15 |
| Bifidobacterium merycicum | −0.26 | 0.47 * | −0.02 | −0.05 | −0.41 * | −0.14 | −0.46 * | −0.43 * | −0.12 |
| Clostridium difficile | −0.23 | −0.25 | 0.23 | −0.02 | 0.79 * | 0.08 | 0.10 | 0.10 | −0.20 |
| Clostridium Bolteae | 0.13 | 0.16 | 0.36 | 0.29 | 0.02 | −0.03 | 0.25 | 0.20 | 0.46 |
| Actinobacteria | −0.49 * | −0.02 | −0.32 | −0.10 | −0.28 | −0.51 * | −0.46 * | −0.54 * | 0.03 |
| Akkermansia muciniphila | 0.24 | −0.04 | −0.12 | −0.09 | −0.32 | 0.45 * | 0.41 | 0.51 * | 0.04 |
| Proteobacteria | −0.32 | −0.33 | −0.42 | −0.13 | −0.17 | −0.65 * | −0.21 | −0.35 | −0.30 |
| Faecalibacterium Prausnitzii | −0.17 | −0.38 | 0.17 | 0.14 | 0.61 * | −0.06 | 0.11 | 0.08 | −0.29 |
| Firmicutes | −0.16 | −0.16 | −0.19 | 0.08 | −0.12 | −0.03 | −0.13 | −0.13 | −0.05 |
| Flavonifractor plautii | 0.07 | 0.20 | 0.35 | 0.29 | −0.01 | −0.01 | 0.17 | 0.13 | 0.38 |
| Lactobacillus acidophilus | 0.10 | −0.02 | 0.28 | 0.13 | −0.07 | 0.14 | −0.02 | 0.02 | 0.46 * |
| Verrucomicrobia | 0.24 | −0.04 | −0.12 | −0.10 | −0.30 | 0.46 | 0.42 * | 0.52 * | 0.05 |
| Bacteroides faecichinchillae | 0.44 * | 0.18 | 0.09 | 0.05 | −0.33 | 0.22 | 0.33 | 0.35 | 0.46 * |
| Bacteroides thetaiotaomicron | 0.11 | 0.02 | 0.27 | 0.15 | −0.05 | 0.07 | −0.01 | 0.01 | 0.45 * |
| BMI | Waist | HDL-C (mmol/L) | LDL-C (mmol/L) | TG (mmol/L) | FBG (mmol/L) | Insulin (µIU/mL) | HOMA-IR | hs-CRP ng/mL | |
|---|---|---|---|---|---|---|---|---|---|
| Bacteroidetes | 0.16 | 0.24 | −0.26 | 0.20 | −0.03 | 0.05 | 0.08 | 0.11 | −0.01 |
| Bacteria (unidentified phylum) | 0.36 | 0.32 | −0.01 | 0.14 | −0.07 | 0.12 | 0.26 | 0.31 | 0.31 |
| Bacteroides (unidentified species) | 0.26 | 0.33 | −0.03 | 0.30 | −0.14 | 0.24 | 0.09 | 0.22 | 0.24 |
| Bacteroides uniformis | 0.12 | 0.36 | −0.02 | 0.01 | −0.30 | −0.03 | 0.18 | 0.21 | 0.31 |
| Bifidobacterium adolescentis | −0.33 | −0.28 | 0.10 | −0.01 | −0.15 | −0.11 | 0.02 | −0.02 | −0.08 |
| Bifidobacterium kashiwanohense | −0.03 | −0.01 | −0.12 | −0.19 | −0.40 * | −0.20 | −0.19 | −0.20 | 0.15 |
| Bifidobacterium longum | −0.13 | 0.03 | −0.21 | −0.13 | −0.33 | −0.09 | 0.03 | 0.01 | −0.07 |
| Bifidobacterium merycicum | 0.02 | 0.20 | −0.29 | −0.33 | −0.24 | 0.11 | −0.17 | −0.14 | −0.37 |
| Clostridium difficile | 0.42 * | 0.47 * | −0.50 * | 0.10 | 0.24 | 0.01 | 0.19 | 0.17 | −0.01 |
| Clostridium Bolteae | 0.35 | 0.28 | −0.33 | 0.38 | 0.55 * | −0.10 | 0.18 | 0.13 | 0.17 |
| Actinobacteria | −0.27 | −0.20 | 0.07 | −0.20 | −0.49 * | −0.30 | −0.08 | −0.14 | 0.03 |
| Akkermansia muciniphila | −0.04 | −0.20 | 0.44 * | −0.30 | −0.32 | −0.12 | −0.02 | −0.04 | −0.18 |
| Proteobacteria | 0.05 | −0.01 | 0.17 | 0.08 | 0.29 | −0.20 | −0.11 | −0.16 | 0.25 |
| Faecalibacterium Prausnitzii | −0.36 | −0.48 | −0.08 | 0.13 | −0.09 | 0.17 | −0.44 * | −0.37 | 0.06 |
| Firmicutes | −0.13 | −0.21 | 0.22 | −0.17 | 0.12 | 0.03 | −0.06 | −0.07 | −0.01 |
| Flavonifractor plautii | 0.47 | 0.45 | 0.09 | 0.02 | 0.10 | 0.19 | 0.34 | 0.39 | −0.08 |
| Lactobacillus acidophilus | −0.04 | −0.20 | 0.44 * | −0.30 | −0.32 | −0.12 | −0.02 | −0.04 | −0.18 |
| Verrucomicrobia | −0.03 | −0.13 | 0.50 * | −0.22 | −0.08 | 0.17 | 0.07 | 0.10 | −0.31 |
| Bacteroides faecichinchillae | 0.71 * | 0.68 * | −0.06 | −0.01 | 0.10 | 0.09 | 0.39 | 0.40 * | 0.04 |
| Bacteroides thetaiotaomicron | 0.09 | 0.01 | −0.07 | −0.05 | −0.25 | −0.07 | −0.09 | −0.08 | 0.15 |
Disclaimer/Publisher’s Note: The statements, opinions and data contained in all publications are solely those of the individual author(s) and contributor(s) and not of MDPI and/or the editor(s). MDPI and/or the editor(s) disclaim responsibility for any injury to people or property resulting from any ideas, methods, instructions or products referred to in the content. |
© 2023 by the authors. Licensee MDPI, Basel, Switzerland. This article is an open access article distributed under the terms and conditions of the Creative Commons Attribution (CC BY) license (https://creativecommons.org/licenses/by/4.0/).
Share and Cite
Aljuraiban, G.S.; Alfhili, M.A.; Aldhwayan, M.M.; Aljazairy, E.A.; Al-Musharaf, S. Shared and Distinct Gut Microbial Profiles in Saudi Women with Metabolically Healthy and Unhealthy Obesity. Microorganisms 2023, 11, 1430. https://doi.org/10.3390/microorganisms11061430
Aljuraiban GS, Alfhili MA, Aldhwayan MM, Aljazairy EA, Al-Musharaf S. Shared and Distinct Gut Microbial Profiles in Saudi Women with Metabolically Healthy and Unhealthy Obesity. Microorganisms. 2023; 11(6):1430. https://doi.org/10.3390/microorganisms11061430
Chicago/Turabian StyleAljuraiban, Ghadeer S., Mohammad A. Alfhili, Madhawi M. Aldhwayan, Esra’a A. Aljazairy, and Sara Al-Musharaf. 2023. "Shared and Distinct Gut Microbial Profiles in Saudi Women with Metabolically Healthy and Unhealthy Obesity" Microorganisms 11, no. 6: 1430. https://doi.org/10.3390/microorganisms11061430
APA StyleAljuraiban, G. S., Alfhili, M. A., Aldhwayan, M. M., Aljazairy, E. A., & Al-Musharaf, S. (2023). Shared and Distinct Gut Microbial Profiles in Saudi Women with Metabolically Healthy and Unhealthy Obesity. Microorganisms, 11(6), 1430. https://doi.org/10.3390/microorganisms11061430