1. Introduction
Yeast is a very important eukaryotic microorganism in the food industry because of its excellent ability to ferment carbohydrates [
1]. Among them, the budding yeast
Saccharomyces cerevisiae is highly safe as a microorganism that has been used in fermentation production of bread, sake, and beer since ancient times [
1]. Therefore,
S. cerevisiae is a familiar strain to industry, so that many studies have been enthusiastically conducted on its life cycles [
2,
3], genetic engineering [
4], the controlling ploidy such as haploid and diploid [
5], and improving the activities of its growth and fermentation [
6]. In particular, BY4741 and BY4742, prepared as experimental strains of
S. cerevisiae, are haploid, so the effects of the introduced genes are readily expressed in the phenotype [
7]; those strains have
his3,
leu2,
met15, and
ura3 deleted as the essential genes for life maintenance [
8], so that those are used in genetic engineering as the nutritional requirement markers, with the result that there are many reports of the creation of mutants by using the plasmid vector system and genome integration system and of the evaluation of the activities of those strains [
9]. Although many reports regarding those experimental strains do indeed exist, traditional selective media are still mostly used [
10]. A commonly used selection medium for
S. cerevisiae strains like BY4741 is synthetic dextrose medium (SD medium with essential nutrients (YG-group medium, as it is termed in this study)), which contains glucose as a carbon source, yeast nitrogen base without amino acid (YNB) as a nutrient source, and other elements to meet the nutritional requirements of each
S. cerevisiae genotype [
10]. However, this synthetic medium is expensive, and YNB, which is a constituent nutrient, is extremely expensive. As of August 2023, the YNBs were 14,096 JPY per 100 g by Funakoshi Co., Ltd. (Tokyo, Japan), 16,500 JPY by Merck KGaA (Darmstadt, Germany), and 15,600 JPY by Nacalai Tesque Inc. (Kyoto, Japan). YNB popularly contains salts (KH
2PO
4 1000 mg·L
−1; MgSO
4 500 mg·L
−1; NaCl 100 mg·L
−1; CaCl
2 100 mg·L
−1), vitamins (biotin 0.002 mg·L
−1; Ca pantothenate 0.4 mg·L
−1; folic acid 0.002 mg·L
−1; inositol 2.0 mg·L
−1; niacin 0.4 mg·L
−1; PABA 0.2 mg·L
−1; pyridoxine-HCl 0.4 mg·L
−1; riboflavin 0.2 mg·L
−1; thiamine-HCl 0.4 mg·L
−1), and trace elements (boric acid 0.5 mg·L
−1; CuSO
4 0.04 mg·L
−1; KI 0.1 mg·L
−1; FeCl
3 0.2 mg·L
−1; MnSO
4 0.4 mg·L
−1; Na
2MoO
4 0.2 mg·L
−1; ZnSO
4 0.4 mg·L
−1) [
11], and replacing YNB with cheaper nutrient sources could greatly reduce the economic cost of experimentation with
S. cerevisiae strains like BY4741. Food residues containing various elements are powerful nutrient sources for cultivating
S. cerevisiae, and wheat bran, which is rich in nutrient sources such as vitamins and minerals, was focused on in this study. In addition, wheat bran has an advantage in price [
12,
13]. Moreover, if wheat bran could be used as a nutrient source in a restricted medium instead of YNB, the cost of culturing experimental
S. cerevisiae strains such as BY4741 in the restricted medium could be greatly reduced; however, there have been few reports regarding the use of wheat bran as a nutrient, meaning that the cell responses of
S. cerevisiae in medium containing wheat bran have not been clear. Therefore, the investigation of the effects on
S. cerevisiae of the use of wheat bran as a nutrient source has significance for the field in microorganisms. In the use of wheat bran, the evaluation of the effects on fermentation by
S. cerevisiae especially should be deeply analyzed because
S. cerevisiae has fermentable strains and their fermentability would be important in the food industry. Regarding the fermentation by
S. cerevisiae using food residues, for instance, the ethanol production by
S. cerevisiae was 49.5 g·L
−1 using 100 g·L
−1 of instant noodle waste as a nutrient source [
14] and 21 g·L
−1 using 69 g·L
−1 of reducing sugar derived from potato peel [
15], indicating the differences in fermentability due to differences in substrates. Additionally, the cells are possibly caused to switch the metabolic flow depending on the gene transcription levels in the medium containing wheat bran, so that the comprehensively shifted transcription levels as direct cell responses should be as the subject of transcriptome analysis. Transcriptome analysis is a powerful assessment tool to understand how the strains tend to alter their metabolic activities [
16], and can reveal how strains tend to switch their metabolic response due to using the food residues. Recently, as a value-added substance-producing strain, mutants of
S. cerevisiae have been created to produce those substances instead of ethanol [
17], and in particular, genetically modified strains were used to produce various substances such as butanol [
18] and amino acids [
19]. Therefore, fermentation should be evaluated in the use of the food residues from the viewpoint of not only production of several substances but also the transcription levels relating to that production in broad areas. To date, using food residues, although the evaluation of the fermentative production by
S. cerevisiae has been reported many researchers [
20,
21,
22], there are few reports of detailed evaluation of the cell responses by transcriptome analysis. The evaluation of the cell responses from the viewpoint of transcriptome analysis could have a significant impact, in the sense that it could lead to controlling intracellular metabolism.
In this study, the laboratory yeast
S. cerevisiae BY4741 was selected as a targeted strain, and cultured in a wheat bran-fed medium to determine whether wheat bran could be used as a medium component (
Table 1). At that time, the cell responses were evaluated by analyses of cell proliferation, growth under nutrient limitation, the production of cells and ethanol, and transcriptomic analysis. This study finally showed the possibility of wheat bran as an alternative nutrient to YNB especially as a templated medium component for
S. cerevisiae, indicating the reduction in research costs and the expansion of substance-producing possibilities. Therefore, the study of using wheat bran as the nutrient for yeast fermentation could demonstrate an industrial impact.
Table 1.
List of medium compositions.
Table 1.
List of medium compositions.
| Medium Name | Main Component | Essential Nutrients | Corresponding Figure |
|---|
| WG+HLMU medium | wheat bran | glucose | histidine | leucine | methionine | uracil | Figure 1, Figure 2, Figure 3, Figure 4, Figure 5 and Figure 6 |
| W+HLMU medium | wheat bran | | histidine | leucine | methionine | uracil | Figure 1 |
| WG+LMU medium | wheat bran | glucose | | leucine | methionine | uracil | Figure 2 |
| WG+HMU medium | wheat bran | glucose | histidine | | methionine | uracil | Figure 2 |
| WG+HLU medium | wheat bran | glucose | histidine | leucine | | uracil | Figure 2 |
| WG+HLM medium | wheat bran | glucose | histidine | leucine | methionine | | Figure 2 |
| YG+HLMU medium (SD medium) | YNB | glucose | histidine | leucine | methionine | uracil | Figure 1, Figure 3, Figure 4, Figure 5 and Figure 6 |
| Y+HLMU medium | YNB | | histidine | leucine | methionine | uracil | Figure 1 |
| G+HLMU medium | | glucose | histidine | leucine | methionine | uracil | Figure 1 |
| HLMU medium | | | histidine | leucine | methionine | uracil | Figure 1 |
Figure 1.
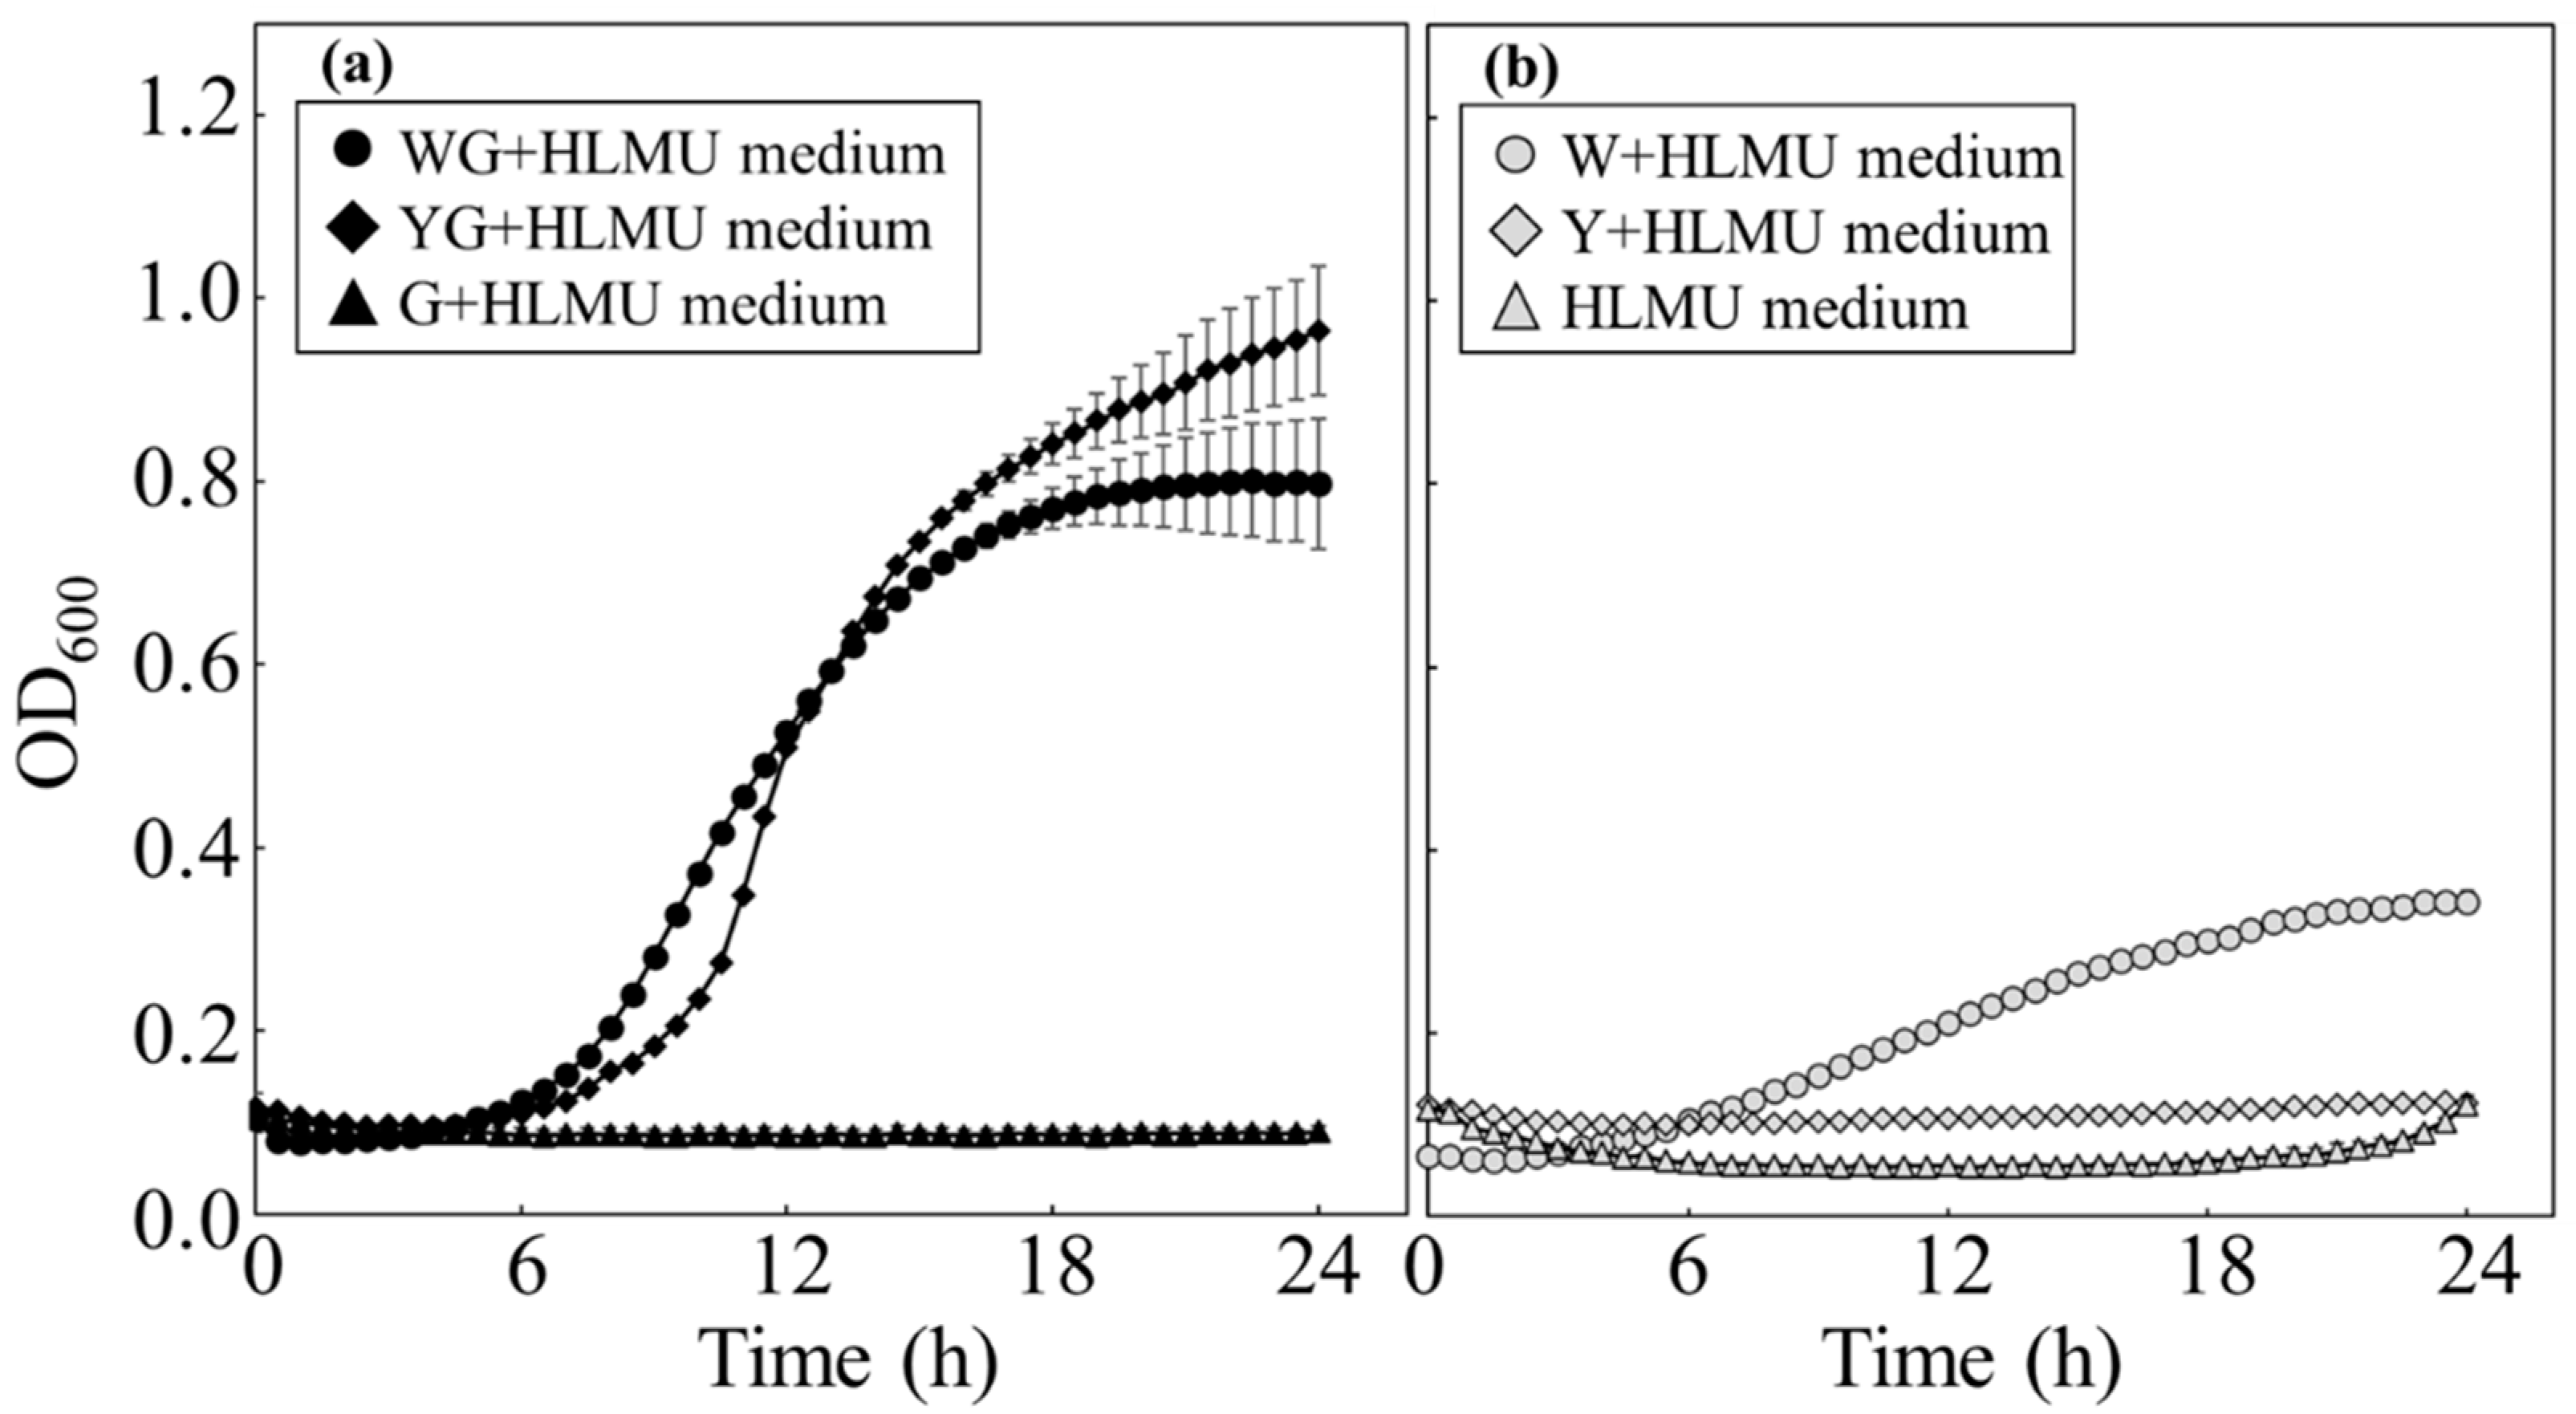
Time course profiles of growth of BY4741 in each medium. BY4741 was cultivated to evaluate the growth manners in each medium. (a) With glucose, BY4741 was cultured in WG+HLMU medium (●), in YG+HLMU medium (◆), and in G+HLMU medium (▲). (b) Without glucose, BY4741 was cultured in W+HLMU medium (○), in Y+HLMU medium (◇), and in HLMU medium (△). (n = 6~12).
Figure 1.
Time course profiles of growth of BY4741 in each medium. BY4741 was cultivated to evaluate the growth manners in each medium. (a) With glucose, BY4741 was cultured in WG+HLMU medium (●), in YG+HLMU medium (◆), and in G+HLMU medium (▲). (b) Without glucose, BY4741 was cultured in W+HLMU medium (○), in Y+HLMU medium (◇), and in HLMU medium (△). (n = 6~12).
Figure 2.
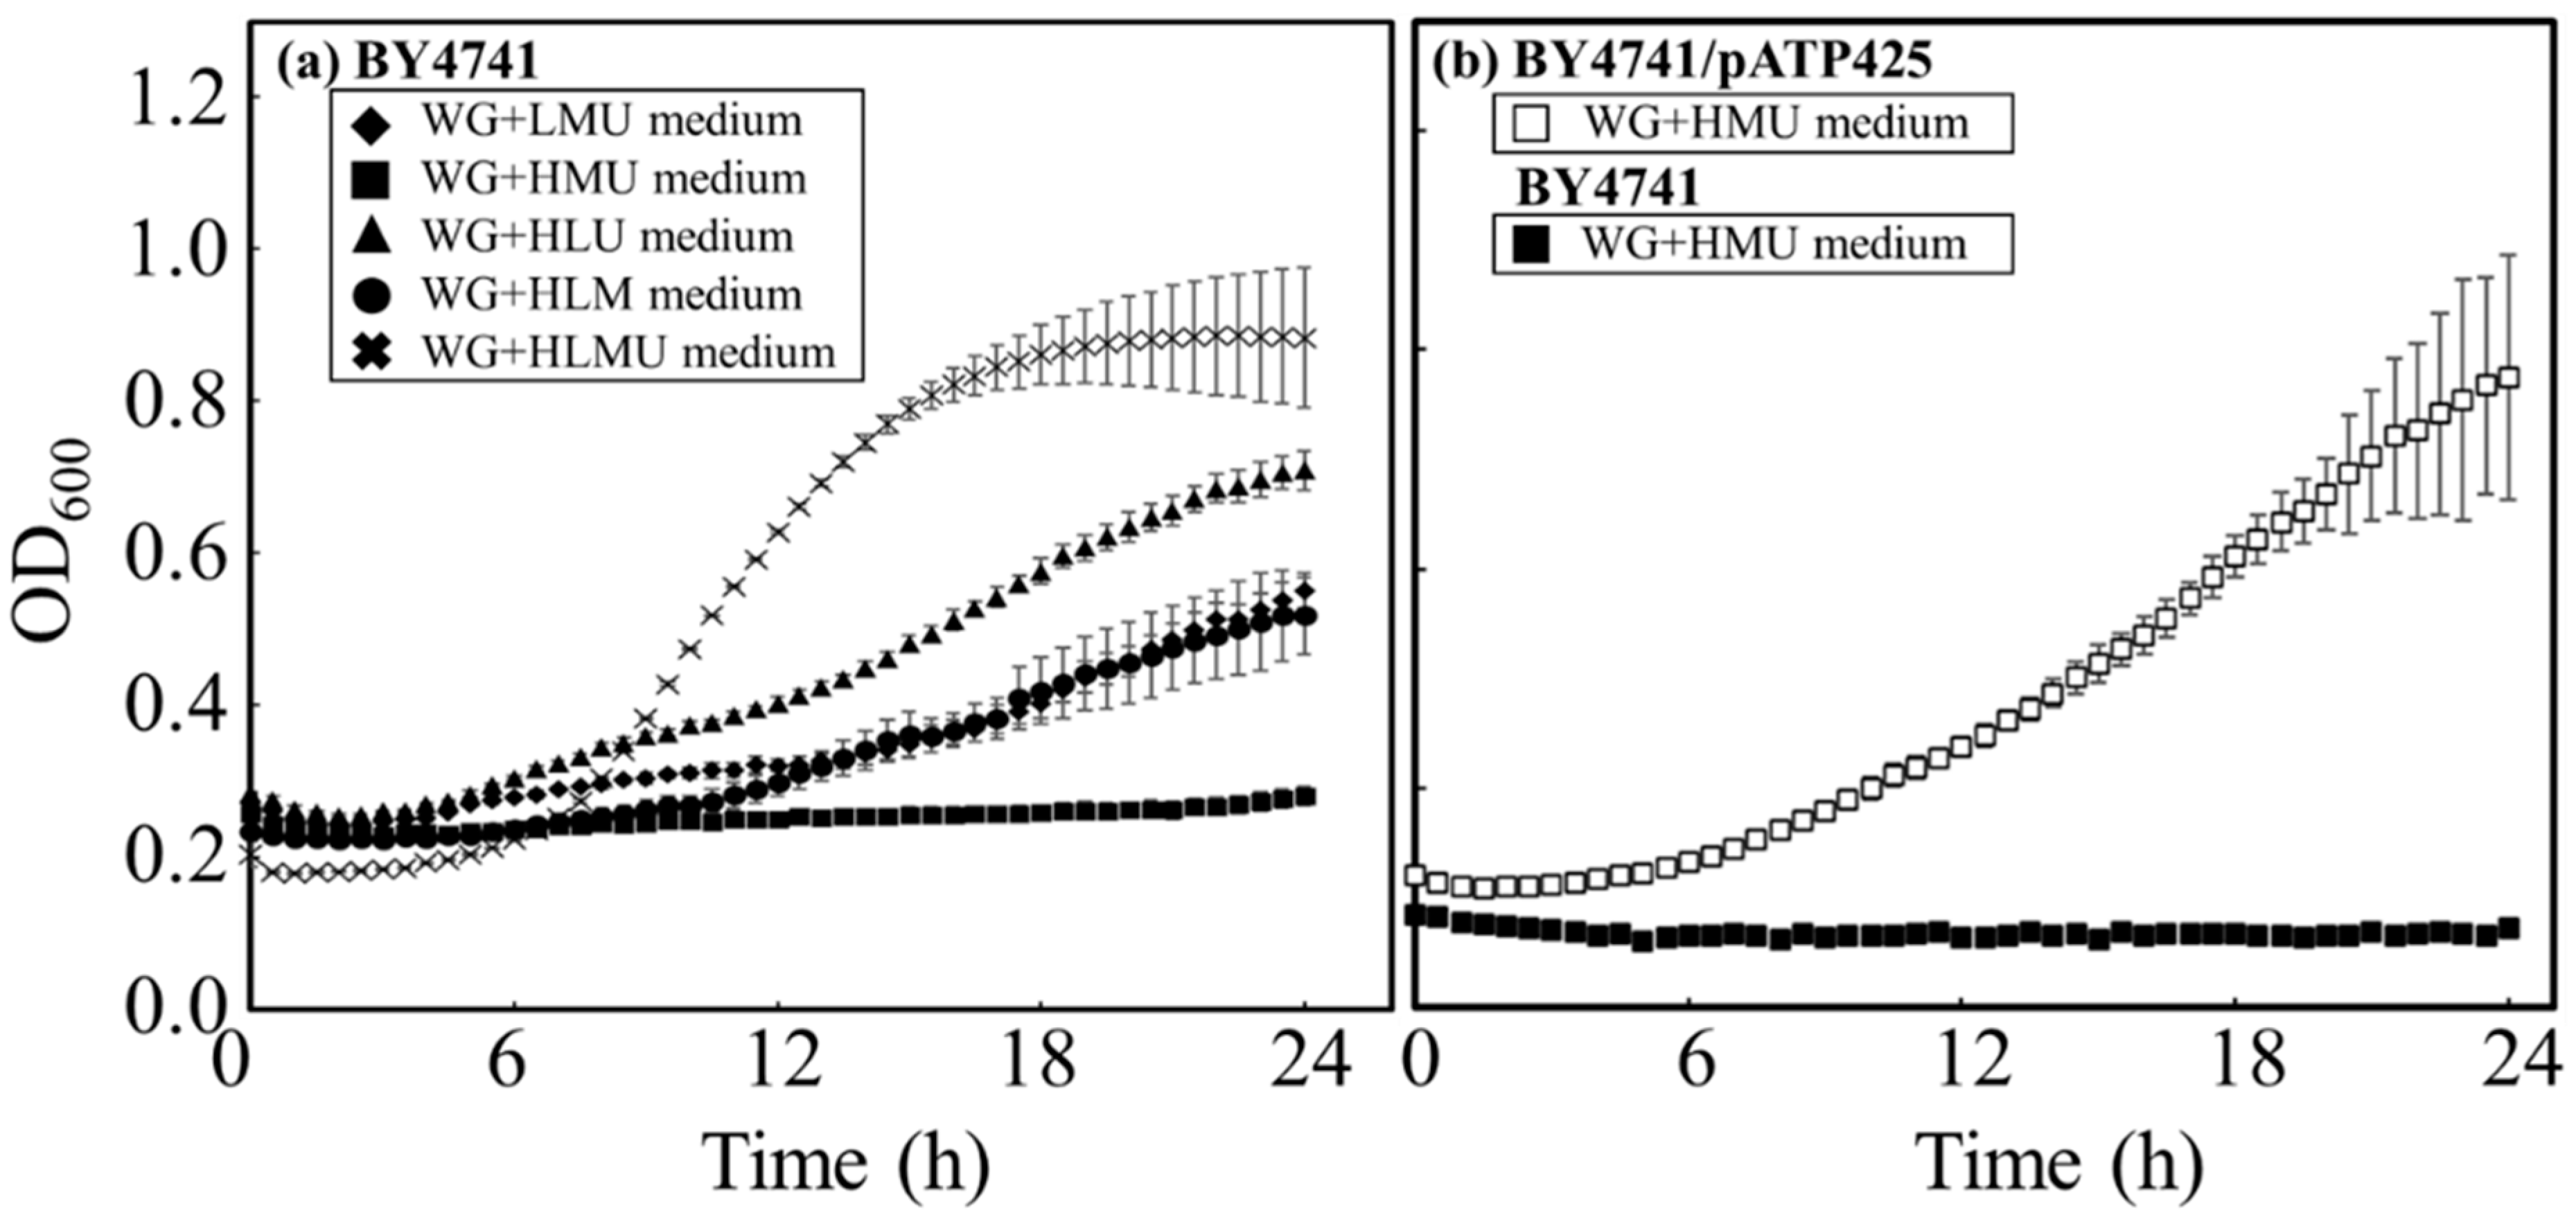
Time course profiles of growth of BY4741 and BY4741/pATP425 in each restricted medium. BY4741 was cultured to evaluate cell usability in each restricted medium prepared with wheat bran. (a) BY4741 was cultured in wheat bran media without histidine (◆: WG+LMU medium), without leucine (◼: WG+HMU medium), without methionine (▲: WG+HLU medium), without uracil (●: WG+HLM medium), and with nothing missing (×: WG+HLMU medium) (n = 6~12). (b) BY4741/pATP425 was cultured in wheat bran media without leucine (□: WG+HMU medium) and BY4741 was also cultured in wheat bran media without leucine (◼: WG+HMU medium) (n = 6~12).
Figure 2.
Time course profiles of growth of BY4741 and BY4741/pATP425 in each restricted medium. BY4741 was cultured to evaluate cell usability in each restricted medium prepared with wheat bran. (a) BY4741 was cultured in wheat bran media without histidine (◆: WG+LMU medium), without leucine (◼: WG+HMU medium), without methionine (▲: WG+HLU medium), without uracil (●: WG+HLM medium), and with nothing missing (×: WG+HLMU medium) (n = 6~12). (b) BY4741/pATP425 was cultured in wheat bran media without leucine (□: WG+HMU medium) and BY4741 was also cultured in wheat bran media without leucine (◼: WG+HMU medium) (n = 6~12).
Figure 3.
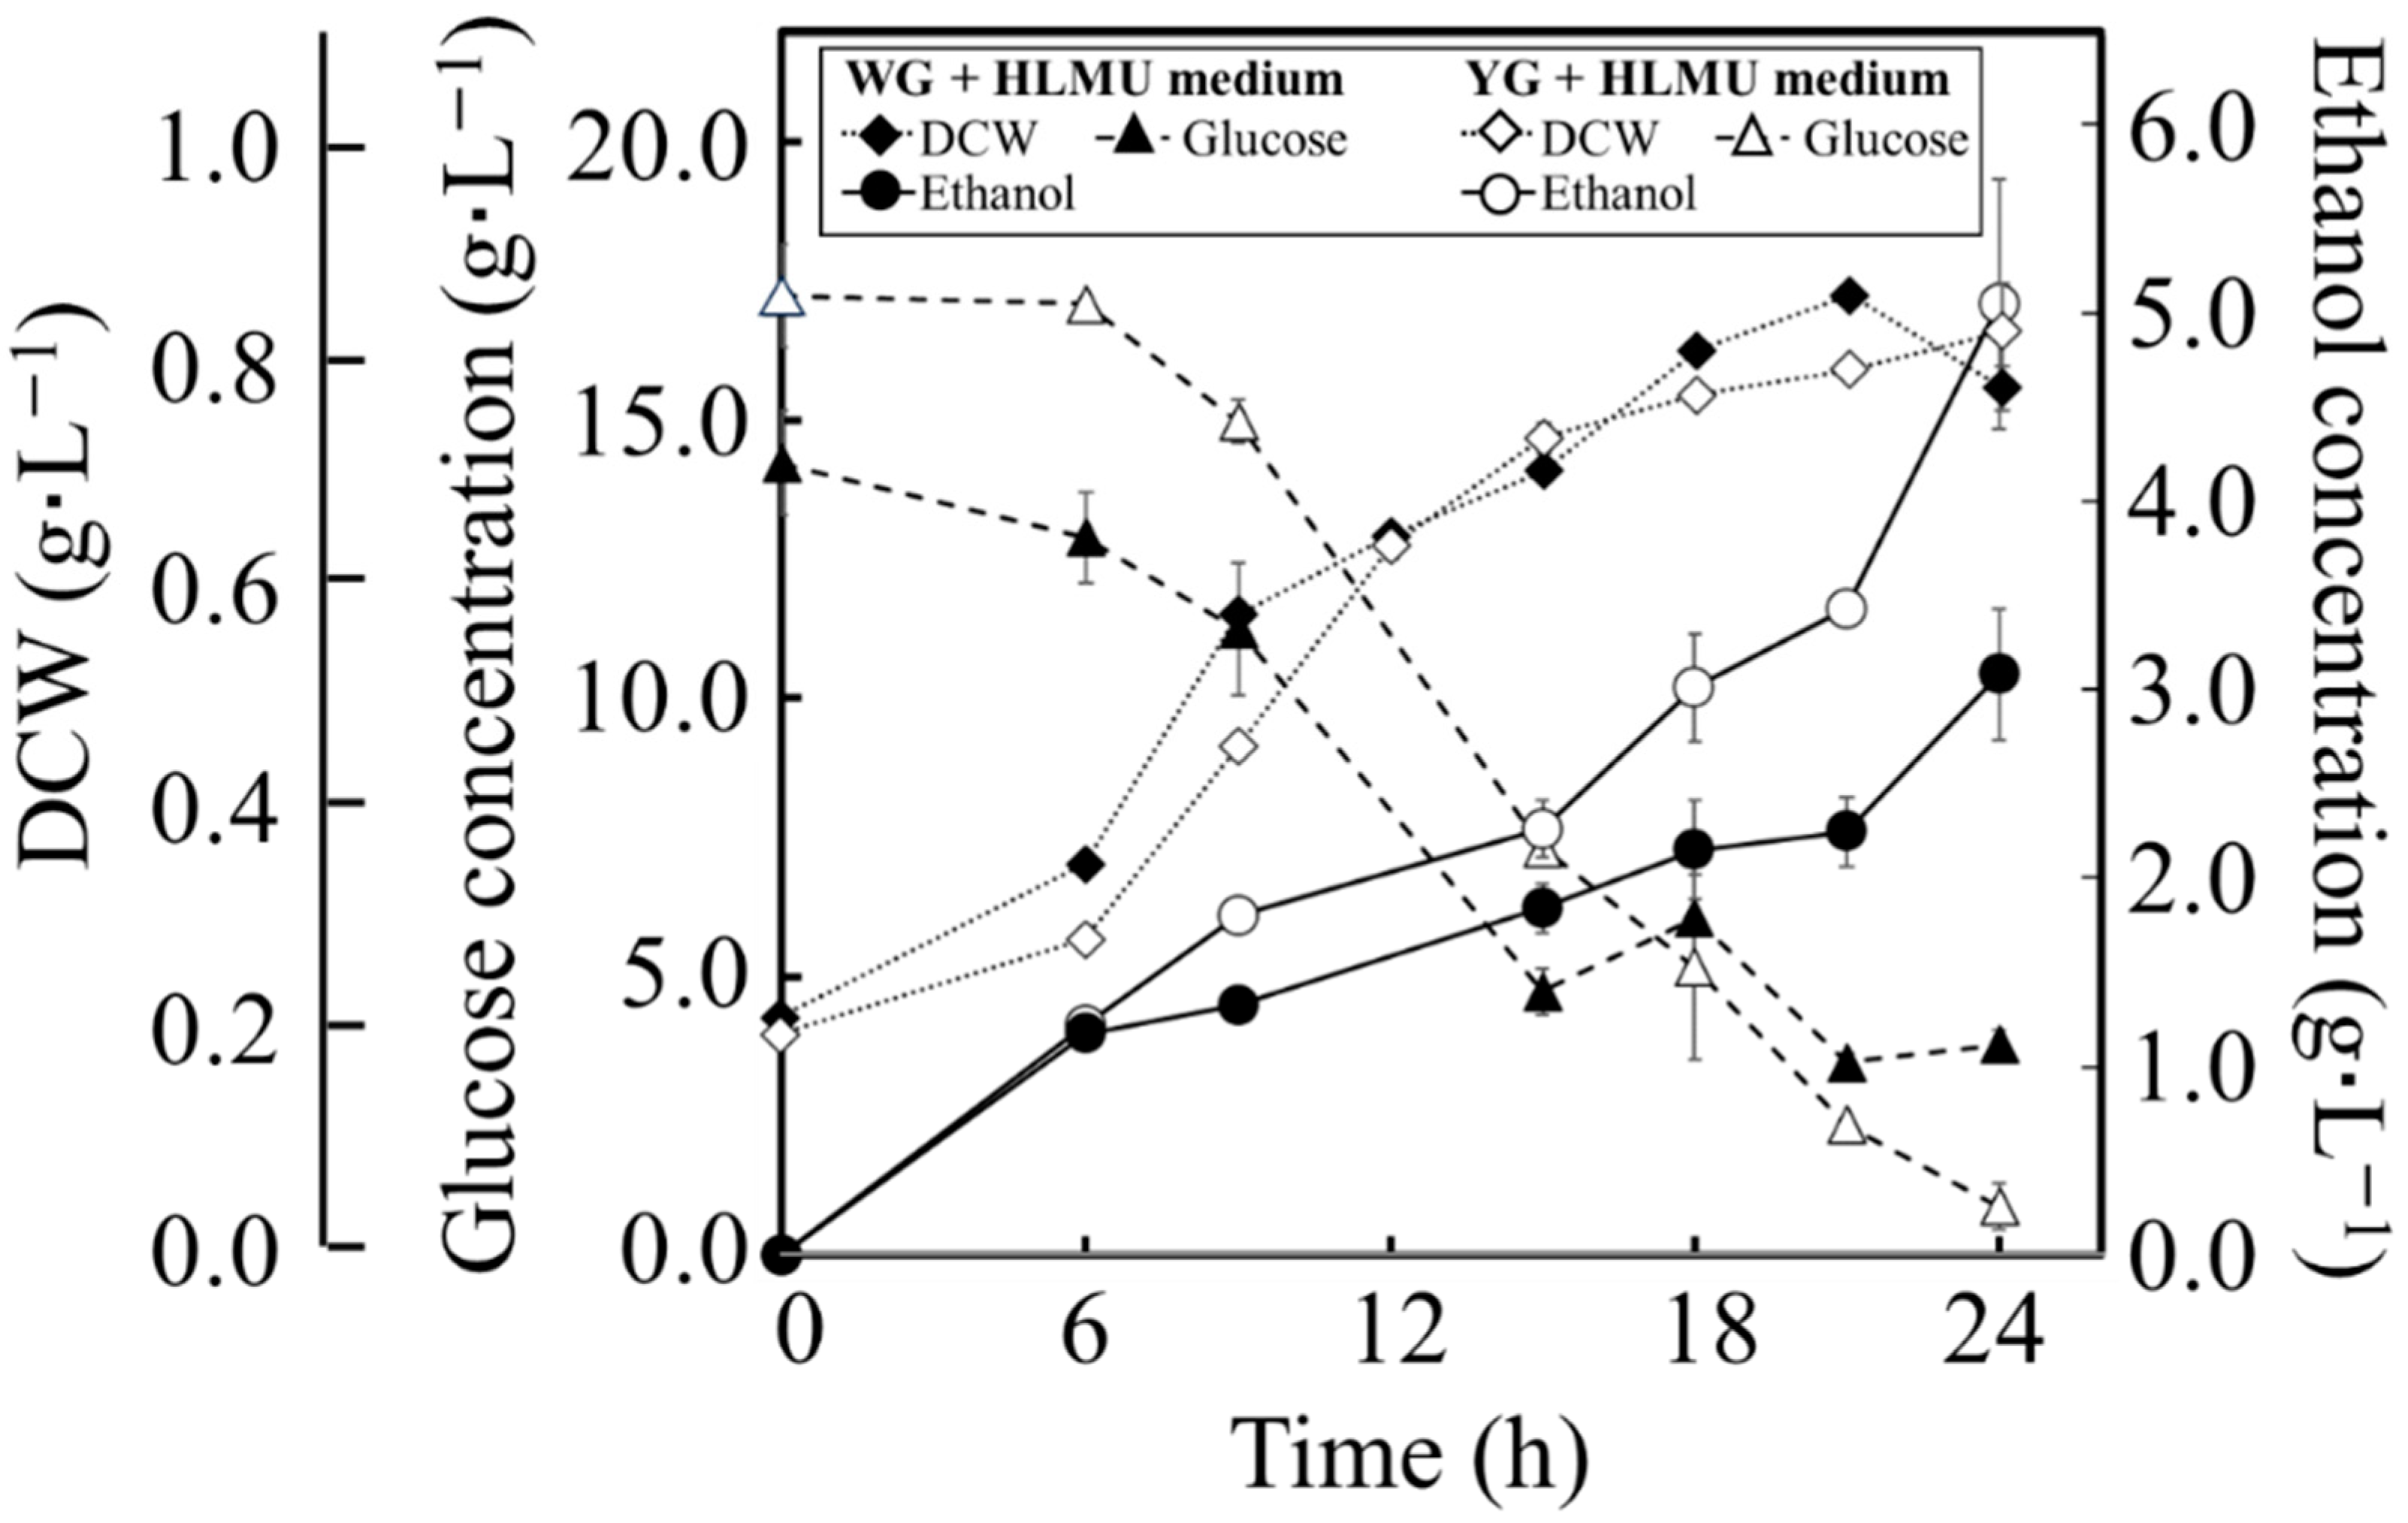
Time course profiles of fermentation by BY4741 in each medium. BY4741 was cultured in WG+HLMU medium and YG+HLMU medium to evaluate DCW as cell production (◆: in WG+HLMU medium; ◇: in YG+HLMU medium), glucose concentration as glucose consumption (▲: in WG+HLMU medium; △: in YG+HLMU medium), and ethanol concentration as ethanol production (●: in WG+HLMU medium; ○: in YG+HLMU medium) over time (n = 6~12).
Figure 3.
Time course profiles of fermentation by BY4741 in each medium. BY4741 was cultured in WG+HLMU medium and YG+HLMU medium to evaluate DCW as cell production (◆: in WG+HLMU medium; ◇: in YG+HLMU medium), glucose concentration as glucose consumption (▲: in WG+HLMU medium; △: in YG+HLMU medium), and ethanol concentration as ethanol production (●: in WG+HLMU medium; ○: in YG+HLMU medium) over time (n = 6~12).
Figure 4.
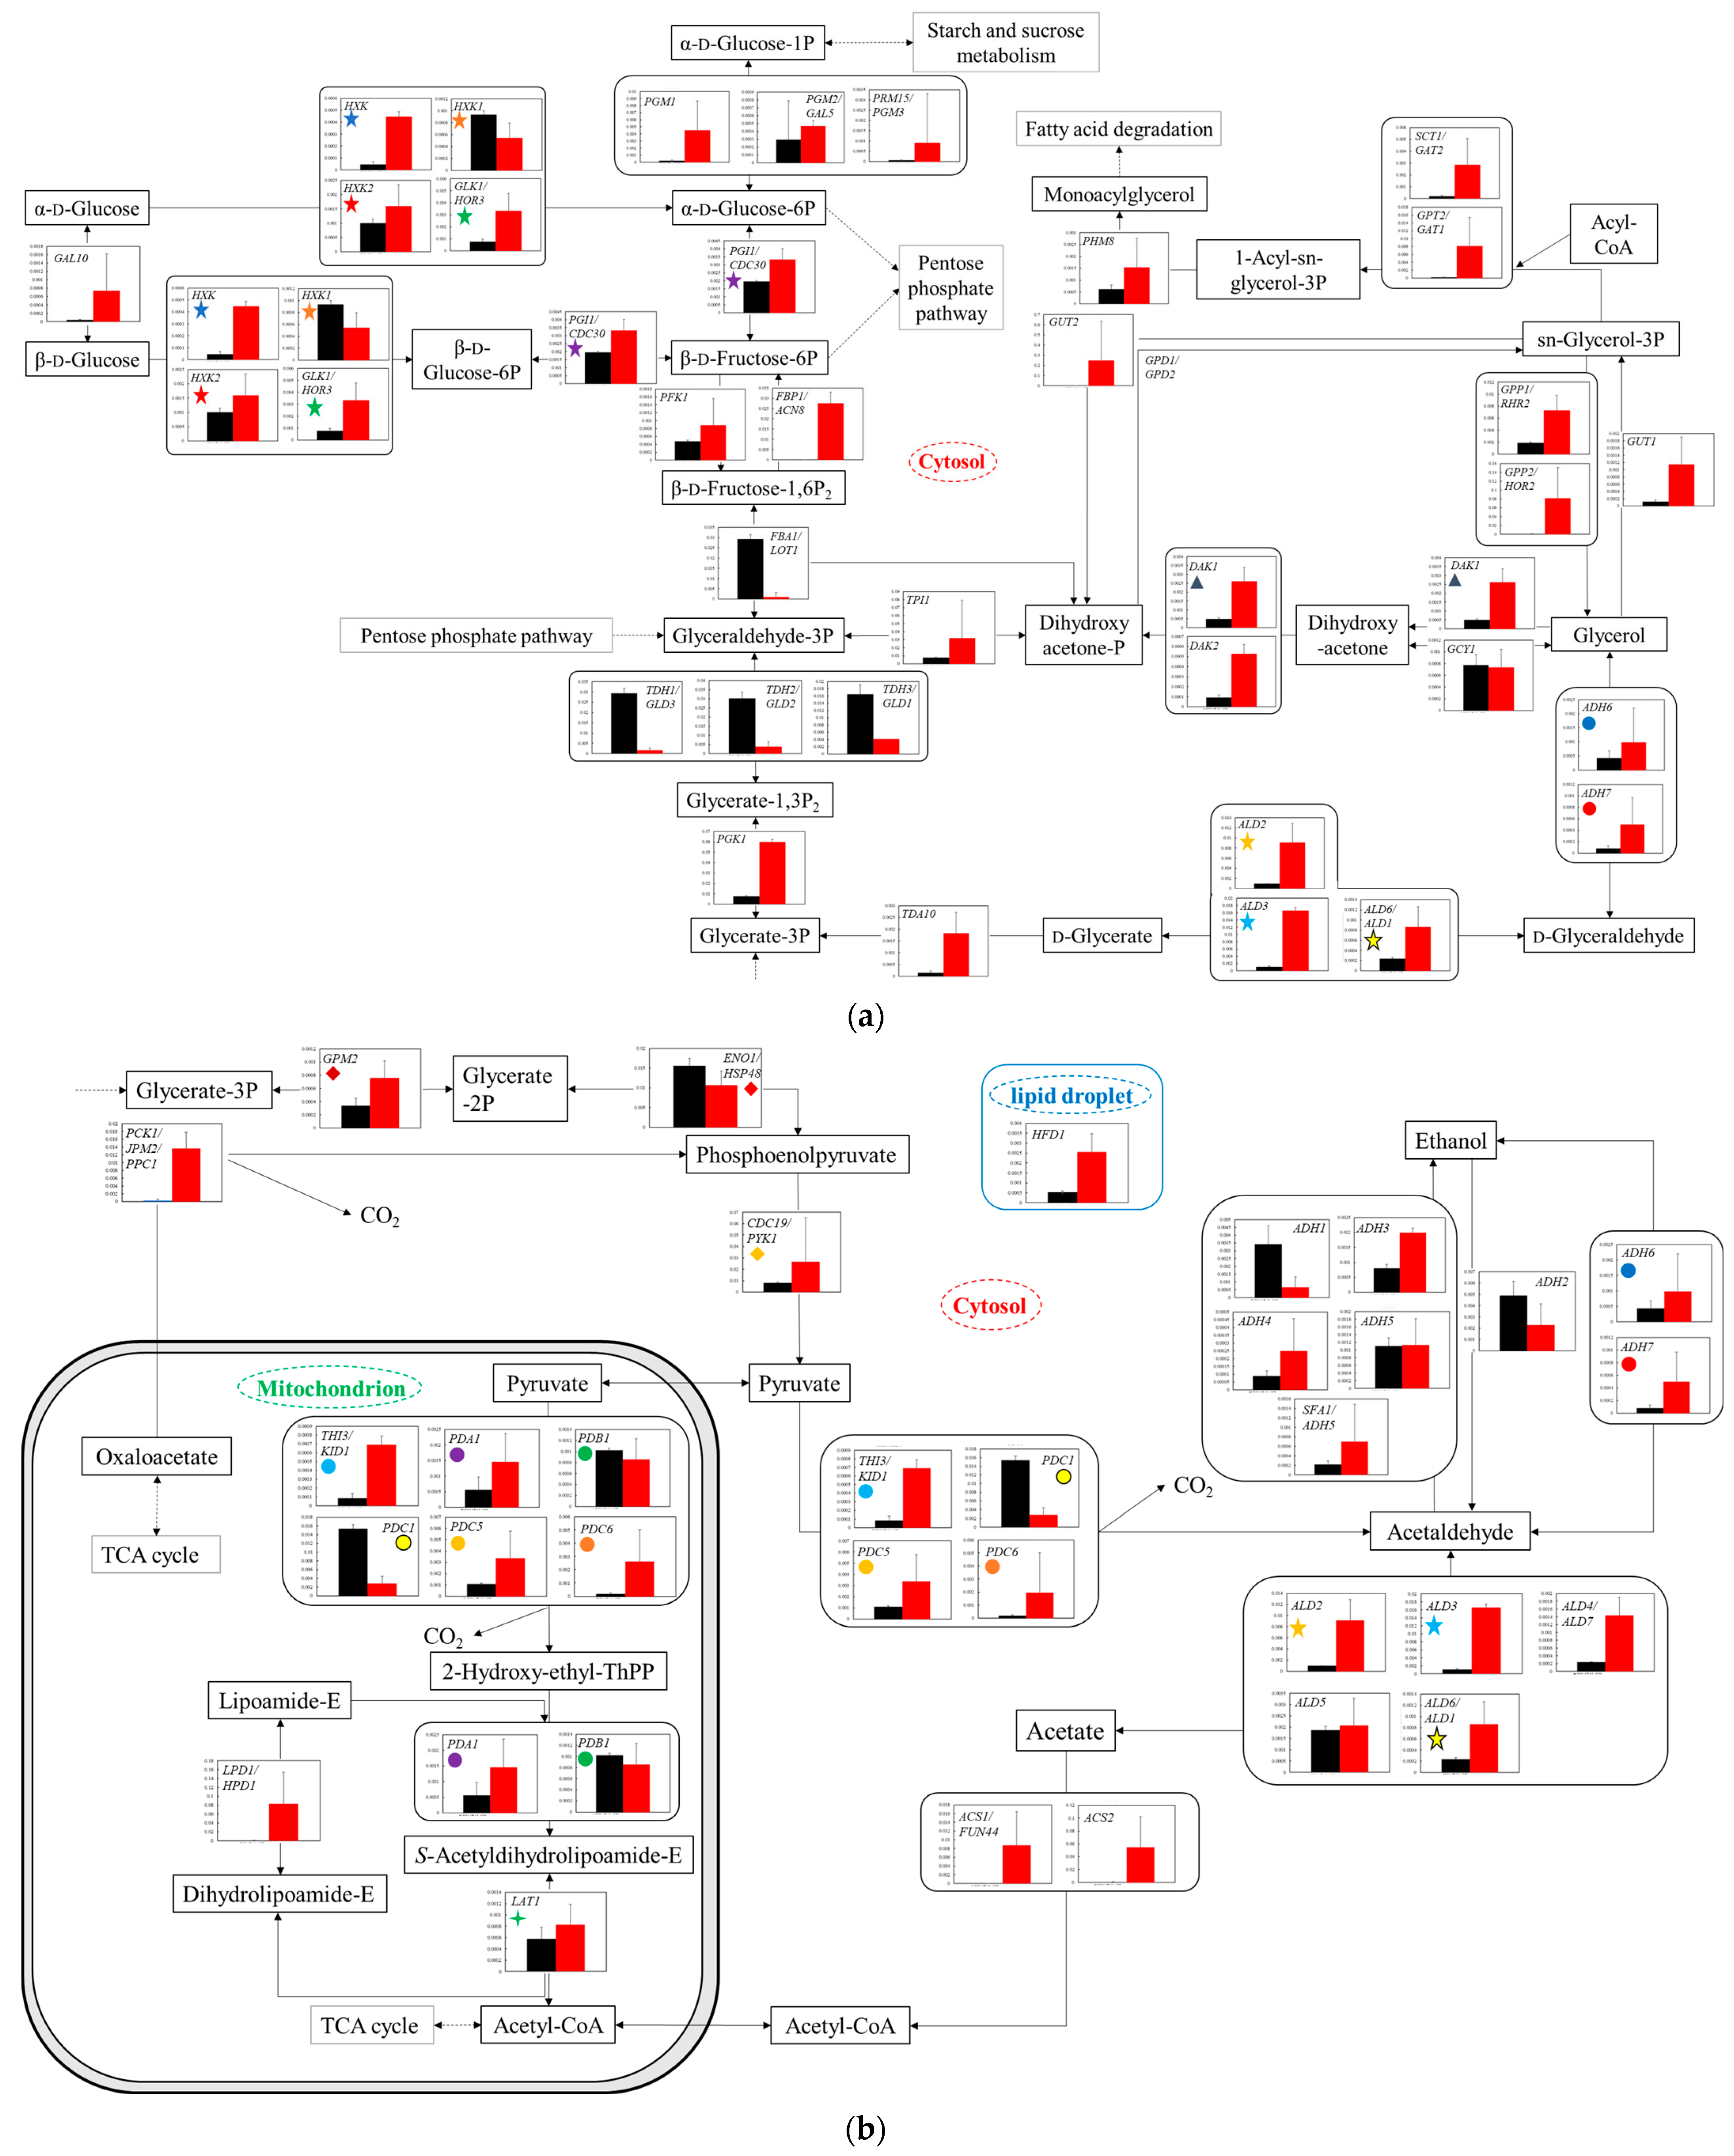
Comparison of gene transcription levels in YG+HLMU medium and WG+HLMU medium in glycolysis. Data are shown as relative mRNA transcription levels normalized by the level of RDN18 as a housekeeping gene. Relative transcription levels in YG+HLMU medium and WG+HLMU medium at 15–20 h of main fermentation are shown in black and red, respectively. Error bars indicate SD of 3~8-time replicates experiments. Gene abbreviations in (a): ADH6: NADP-dependent alcohol dehydrogenase 6, ADH7: NADP-dependent alcohol dehydrogenase 7, ALD2: aldehyde dehydrogenase (NAD+) 2, ALD3: aldehyde dehydrogenase (NAD+) 3, ALD6/ADL1: aldehyde dehydrogenase (NADP+)/aldehyde dehydrogenase (NAD+) 6, DAK1: dihydroxyacetone kinase/FAD-AMP lyase 1, DAK2: dihydroxyacetone kinase/FAD-AMP lyase 2, FBA1/LOT1: fructose-bisphosphate aldolase, FBP1/ACN8: fructose 1,6-bisphosphate 1-phosphatase, GAL10: UDP-glucose 4-epimerase aldose 1-epimerase, GCY1: glycerol 2-dehydrogenase (NADP+), GLK1/HOR3: hexokinase, GPP1/RHR2: glycerol-1-phosphatase 1, GPP2/HOR2: glycerol-1-phosphatase 2, GPT2/GAT1: glycerol-3-phosphate O-acyltransferase/dihydroxyacetone phosphate acyltransferase, GUT1: glycerol kinase1, GUT2: glycerol kinase 2, HXK: hexokinase, HXK1: hexokinase 1, HXK2: hexokinase 2, PFK1: fructose-bisphosphate aldolase, PGK1: phosphoglycerate kinase, PGI1/CDC30: glucose-6-phosphate isomerase, PGM1: UDP-glucose 4-epimerase aldose 1-epimerase, PGM2/GAL5: phosphoglucomutase 2, PHM8: 2-lysophosphatidate phosphatase, PRM15/PGM3: phosphoribomutase 3. SCT1/GAT2: glycerol-3-phosphate O-acyltransferase/dihydroxyacetone phosphate acyltransferase 2, TDA10: putative ATP-dependent kinase/d-glycerate 3-kinase, TDH1/GLD3: glyceraldehyde-3-phosphate dehydrogenase 1, TDH2/GLD2: glyceraldehyde-3-phosphate dehydrogenase 2, TDH3/GLD1: glyceraldehyde-3-phosphate dehydrogenase 3, TPI1: triose-phosphate isomerase 1. In (b): ACS1/FUN44: acetyl-CoA synthetase 1, ACS2: acetyl-CoA synthetase 2, ADH1: alcohol dehydrogenase 1, ADH2: alcohol dehydrogenase 2, ADH3: alcohol dehydrogenase 3, ADH4: alcohol dehydrogenase 4, ADH5: alcohol dehydrogenase 5, ALD4/ADL7: aldehyde dehydrogenase (NADP+), ALD5: aldehyde dehydrogenase (NAD(P)+) 5, CDC19/PYK1: pyruvate kinase, ENO1/HSP48: phosphopyruvate hydratase, GPM2: phosphoglycerate mutase, HFD1: hexadecenal dehydrogenase/aldehyde dehydrogenase (NAD+), LAT1: pyruvate dehydrogenase E2 component, LPD1/HPD1: dihydrolipoyl dehydrogenase, PCK1/JPM2/PPC1: phosphoenolpyruvate carboxykinase, PDA1: pyruvate dehydrogenase E1 component subunit alpha, PDB1: pyruvate dehydrogenase E1 component subunit beta, PDC1: pyruvate decarboxylase 1, PDC5: pyruvate decarboxylase 5, PDC6: pyruvate decarboxylase 6, SFA1/ADH5: s-(hydroxymethyl)glutathione dehydrogenase/alcohol dehydrogenase, THI3/KID1: pyruvate decarboxylase. Similarly colored and shaped marks in figures mean transcription levels of the same enzyme genes. (a) Comparison of gene transcription levels in YG+HLMU medium and WG+HLMU medium on upstream of glycolysis. (b) Comparison of gene transcription levels in YG+HLMU medium and WG+HLMU medium on downstream of glycolysis and partial reactions in mitochondrion.
Figure 4.
Comparison of gene transcription levels in YG+HLMU medium and WG+HLMU medium in glycolysis. Data are shown as relative mRNA transcription levels normalized by the level of RDN18 as a housekeeping gene. Relative transcription levels in YG+HLMU medium and WG+HLMU medium at 15–20 h of main fermentation are shown in black and red, respectively. Error bars indicate SD of 3~8-time replicates experiments. Gene abbreviations in (a): ADH6: NADP-dependent alcohol dehydrogenase 6, ADH7: NADP-dependent alcohol dehydrogenase 7, ALD2: aldehyde dehydrogenase (NAD+) 2, ALD3: aldehyde dehydrogenase (NAD+) 3, ALD6/ADL1: aldehyde dehydrogenase (NADP+)/aldehyde dehydrogenase (NAD+) 6, DAK1: dihydroxyacetone kinase/FAD-AMP lyase 1, DAK2: dihydroxyacetone kinase/FAD-AMP lyase 2, FBA1/LOT1: fructose-bisphosphate aldolase, FBP1/ACN8: fructose 1,6-bisphosphate 1-phosphatase, GAL10: UDP-glucose 4-epimerase aldose 1-epimerase, GCY1: glycerol 2-dehydrogenase (NADP+), GLK1/HOR3: hexokinase, GPP1/RHR2: glycerol-1-phosphatase 1, GPP2/HOR2: glycerol-1-phosphatase 2, GPT2/GAT1: glycerol-3-phosphate O-acyltransferase/dihydroxyacetone phosphate acyltransferase, GUT1: glycerol kinase1, GUT2: glycerol kinase 2, HXK: hexokinase, HXK1: hexokinase 1, HXK2: hexokinase 2, PFK1: fructose-bisphosphate aldolase, PGK1: phosphoglycerate kinase, PGI1/CDC30: glucose-6-phosphate isomerase, PGM1: UDP-glucose 4-epimerase aldose 1-epimerase, PGM2/GAL5: phosphoglucomutase 2, PHM8: 2-lysophosphatidate phosphatase, PRM15/PGM3: phosphoribomutase 3. SCT1/GAT2: glycerol-3-phosphate O-acyltransferase/dihydroxyacetone phosphate acyltransferase 2, TDA10: putative ATP-dependent kinase/d-glycerate 3-kinase, TDH1/GLD3: glyceraldehyde-3-phosphate dehydrogenase 1, TDH2/GLD2: glyceraldehyde-3-phosphate dehydrogenase 2, TDH3/GLD1: glyceraldehyde-3-phosphate dehydrogenase 3, TPI1: triose-phosphate isomerase 1. In (b): ACS1/FUN44: acetyl-CoA synthetase 1, ACS2: acetyl-CoA synthetase 2, ADH1: alcohol dehydrogenase 1, ADH2: alcohol dehydrogenase 2, ADH3: alcohol dehydrogenase 3, ADH4: alcohol dehydrogenase 4, ADH5: alcohol dehydrogenase 5, ALD4/ADL7: aldehyde dehydrogenase (NADP+), ALD5: aldehyde dehydrogenase (NAD(P)+) 5, CDC19/PYK1: pyruvate kinase, ENO1/HSP48: phosphopyruvate hydratase, GPM2: phosphoglycerate mutase, HFD1: hexadecenal dehydrogenase/aldehyde dehydrogenase (NAD+), LAT1: pyruvate dehydrogenase E2 component, LPD1/HPD1: dihydrolipoyl dehydrogenase, PCK1/JPM2/PPC1: phosphoenolpyruvate carboxykinase, PDA1: pyruvate dehydrogenase E1 component subunit alpha, PDB1: pyruvate dehydrogenase E1 component subunit beta, PDC1: pyruvate decarboxylase 1, PDC5: pyruvate decarboxylase 5, PDC6: pyruvate decarboxylase 6, SFA1/ADH5: s-(hydroxymethyl)glutathione dehydrogenase/alcohol dehydrogenase, THI3/KID1: pyruvate decarboxylase. Similarly colored and shaped marks in figures mean transcription levels of the same enzyme genes. (a) Comparison of gene transcription levels in YG+HLMU medium and WG+HLMU medium on upstream of glycolysis. (b) Comparison of gene transcription levels in YG+HLMU medium and WG+HLMU medium on downstream of glycolysis and partial reactions in mitochondrion.
![Microorganisms 11 02674 g004]()
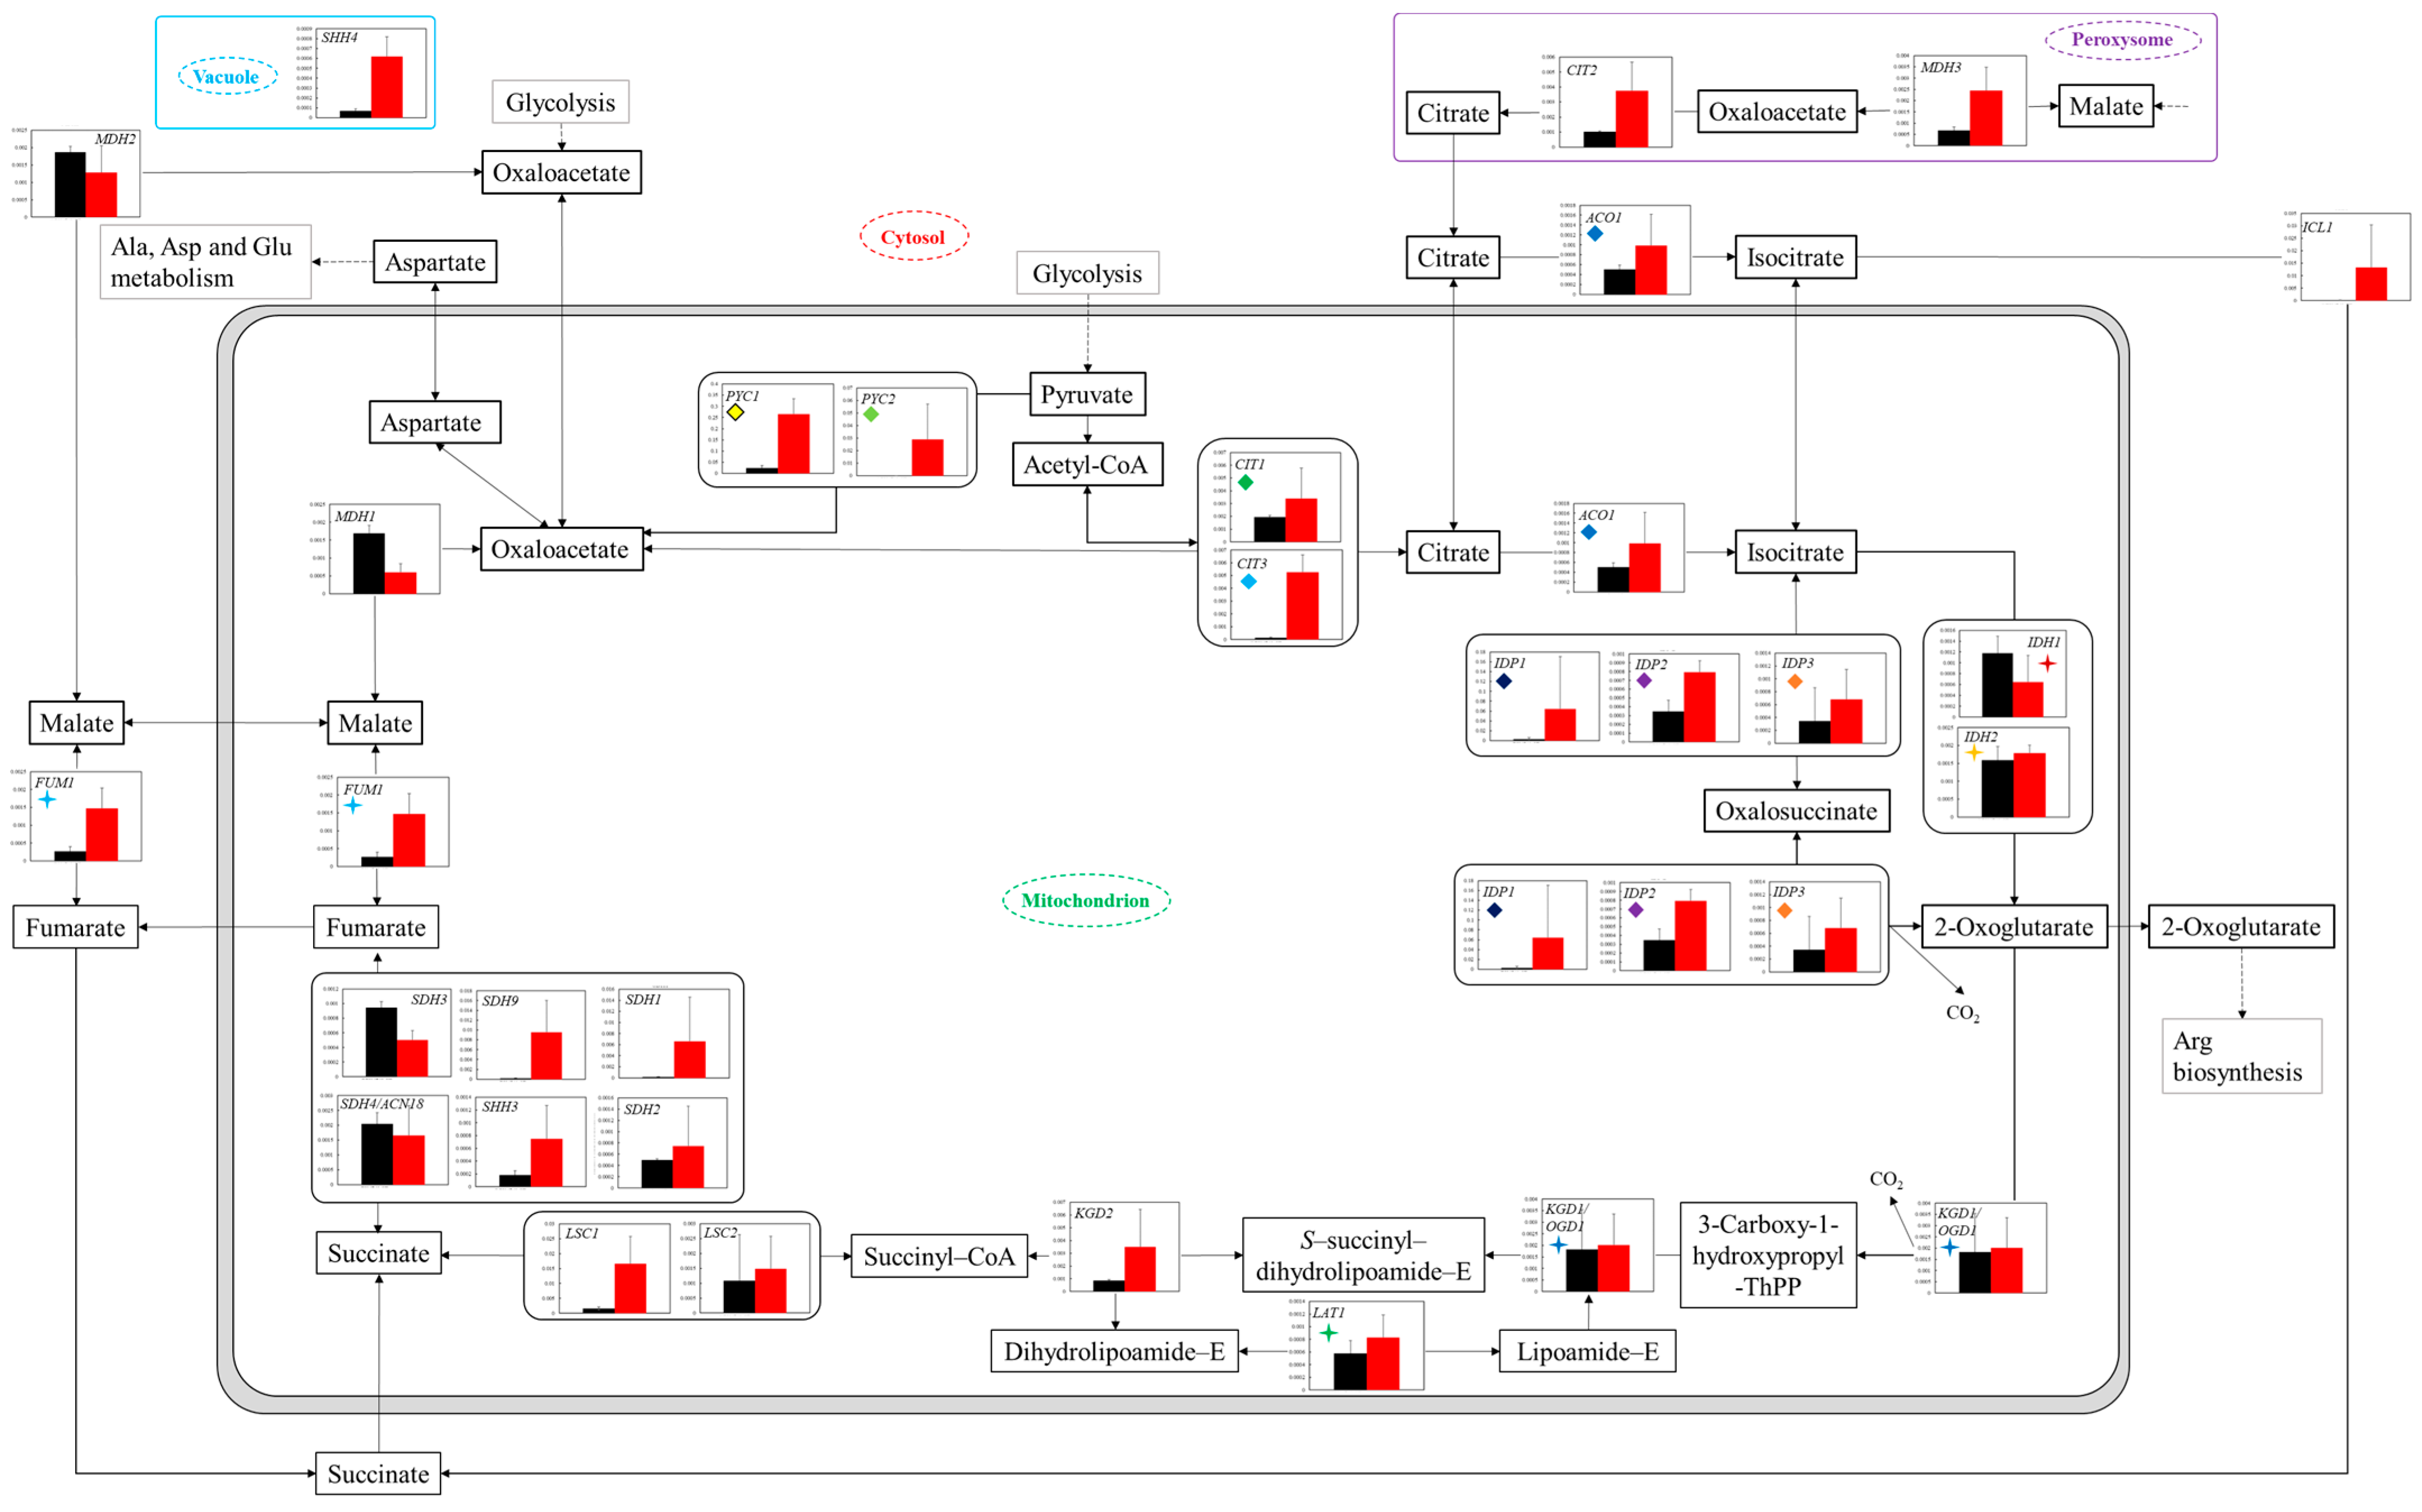
Figure 5.
Comparison of gene transcription levels in YG+HLMU medium and WG+HLMU medium on TCA cycle and relating reactions. Data are shown as relative mRNA transcription levels normalized by the level of
RDN18 as a housekeeping gene. Relative transcription levels in YG+HLMU medium and WG+HLMU medium at 15–20 h of main fermentation are shown in black and red, respectively. Error bars indicate SD of 3~8-time replicates experiments. Gene abbreviations in
Figure 5:
ACO1:
aconitate hydratase,
CIT1:
citrate synthase 1,
CIT2:
citrate synthase 2,
CIT3:
citrate synthase 3,
FUM1:
fumarate hydratase,
class II,
IDH1:
isocitrate dehydrogenase (NAD+) 1,
IDH2:
isocitrate dehydrogenase (NAD+) 2,
IDP1:
isocitrate dehydrogenase 1,
IDP2:
isocitrate dehydrogenase 2,
IDP3:
isocitrate dehydrogenase 3,
KGD1/OGD1:
2-oxoglutarate dehydrogenase E1 component,
KGD2:
2-oxoglutarate dehydrogenase E2 component (dihydrolipoamide succinyltransferase),
LSC1:
succinyl-CoA synthetase alpha subunit,
LSC2:
succinyl-CoA synthetase beta subunit,
MDH1:
malate dehydrogenase 1,
MDH2:
malate dehydrogenase 2,
MDH3:
malate dehydrogenase 3,
PYC1:
pyruvate carboxylase 1,
PYC2:
pyruvate carboxylase 2,
SDH1:
succinate dehydrogenase (ubiquinone) flavoprotein subunit,
SDH2:
succinate dehydrogenase (ubiquinone) iron-sulfur subunit,
SDH3:
succinate dehydrogenase (ubiquinone) cytochrome b560 subunit,
SDH4/ACN18:
succinate dehydrogenase (ubiquinone) membrane anchor subunit,
SDH9:
succinate dehydrogenase (ubiquinone) flavoprotein subunit,
SHH3:
succinate dehydrogenase (ubiquinone) cytochrome b560 subunit,
SHH4:
succinate dehydrogenase (ubiquinone) membrane anchor subunit. Similarly colored and shaped marks in figures mean transcription levels of the same enzyme genes.
![Microorganisms 11 02674 g005]()
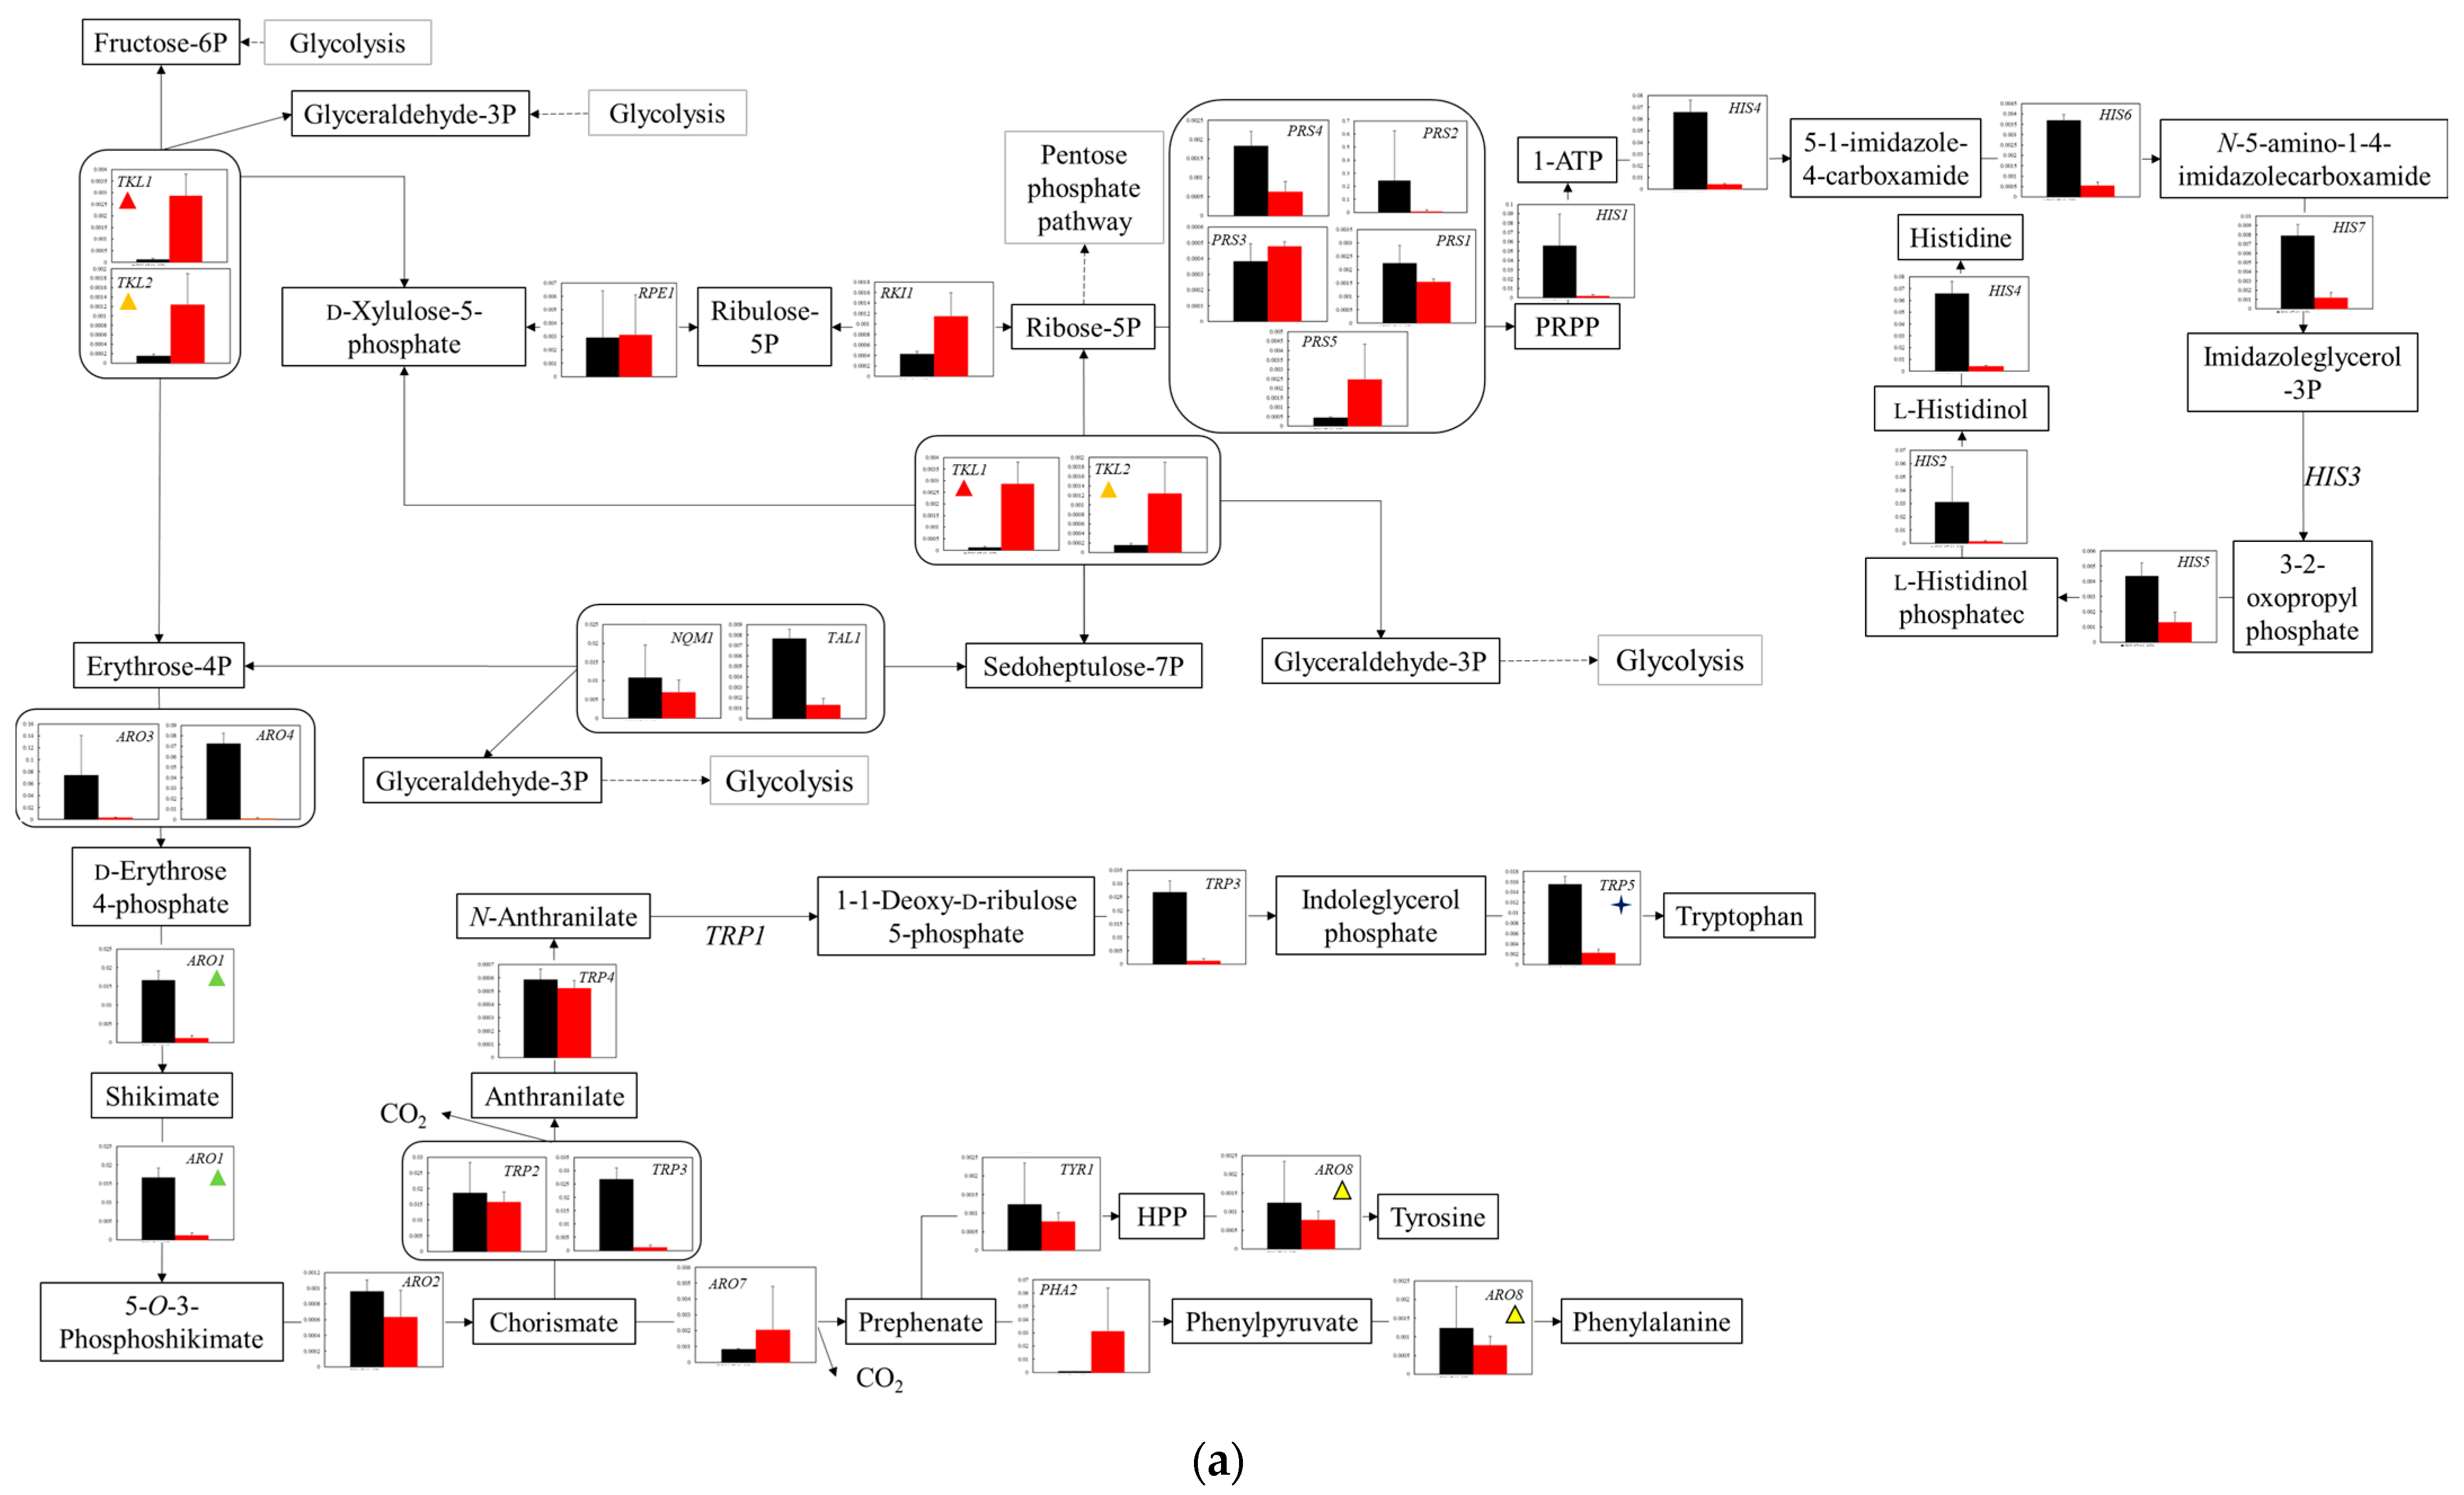
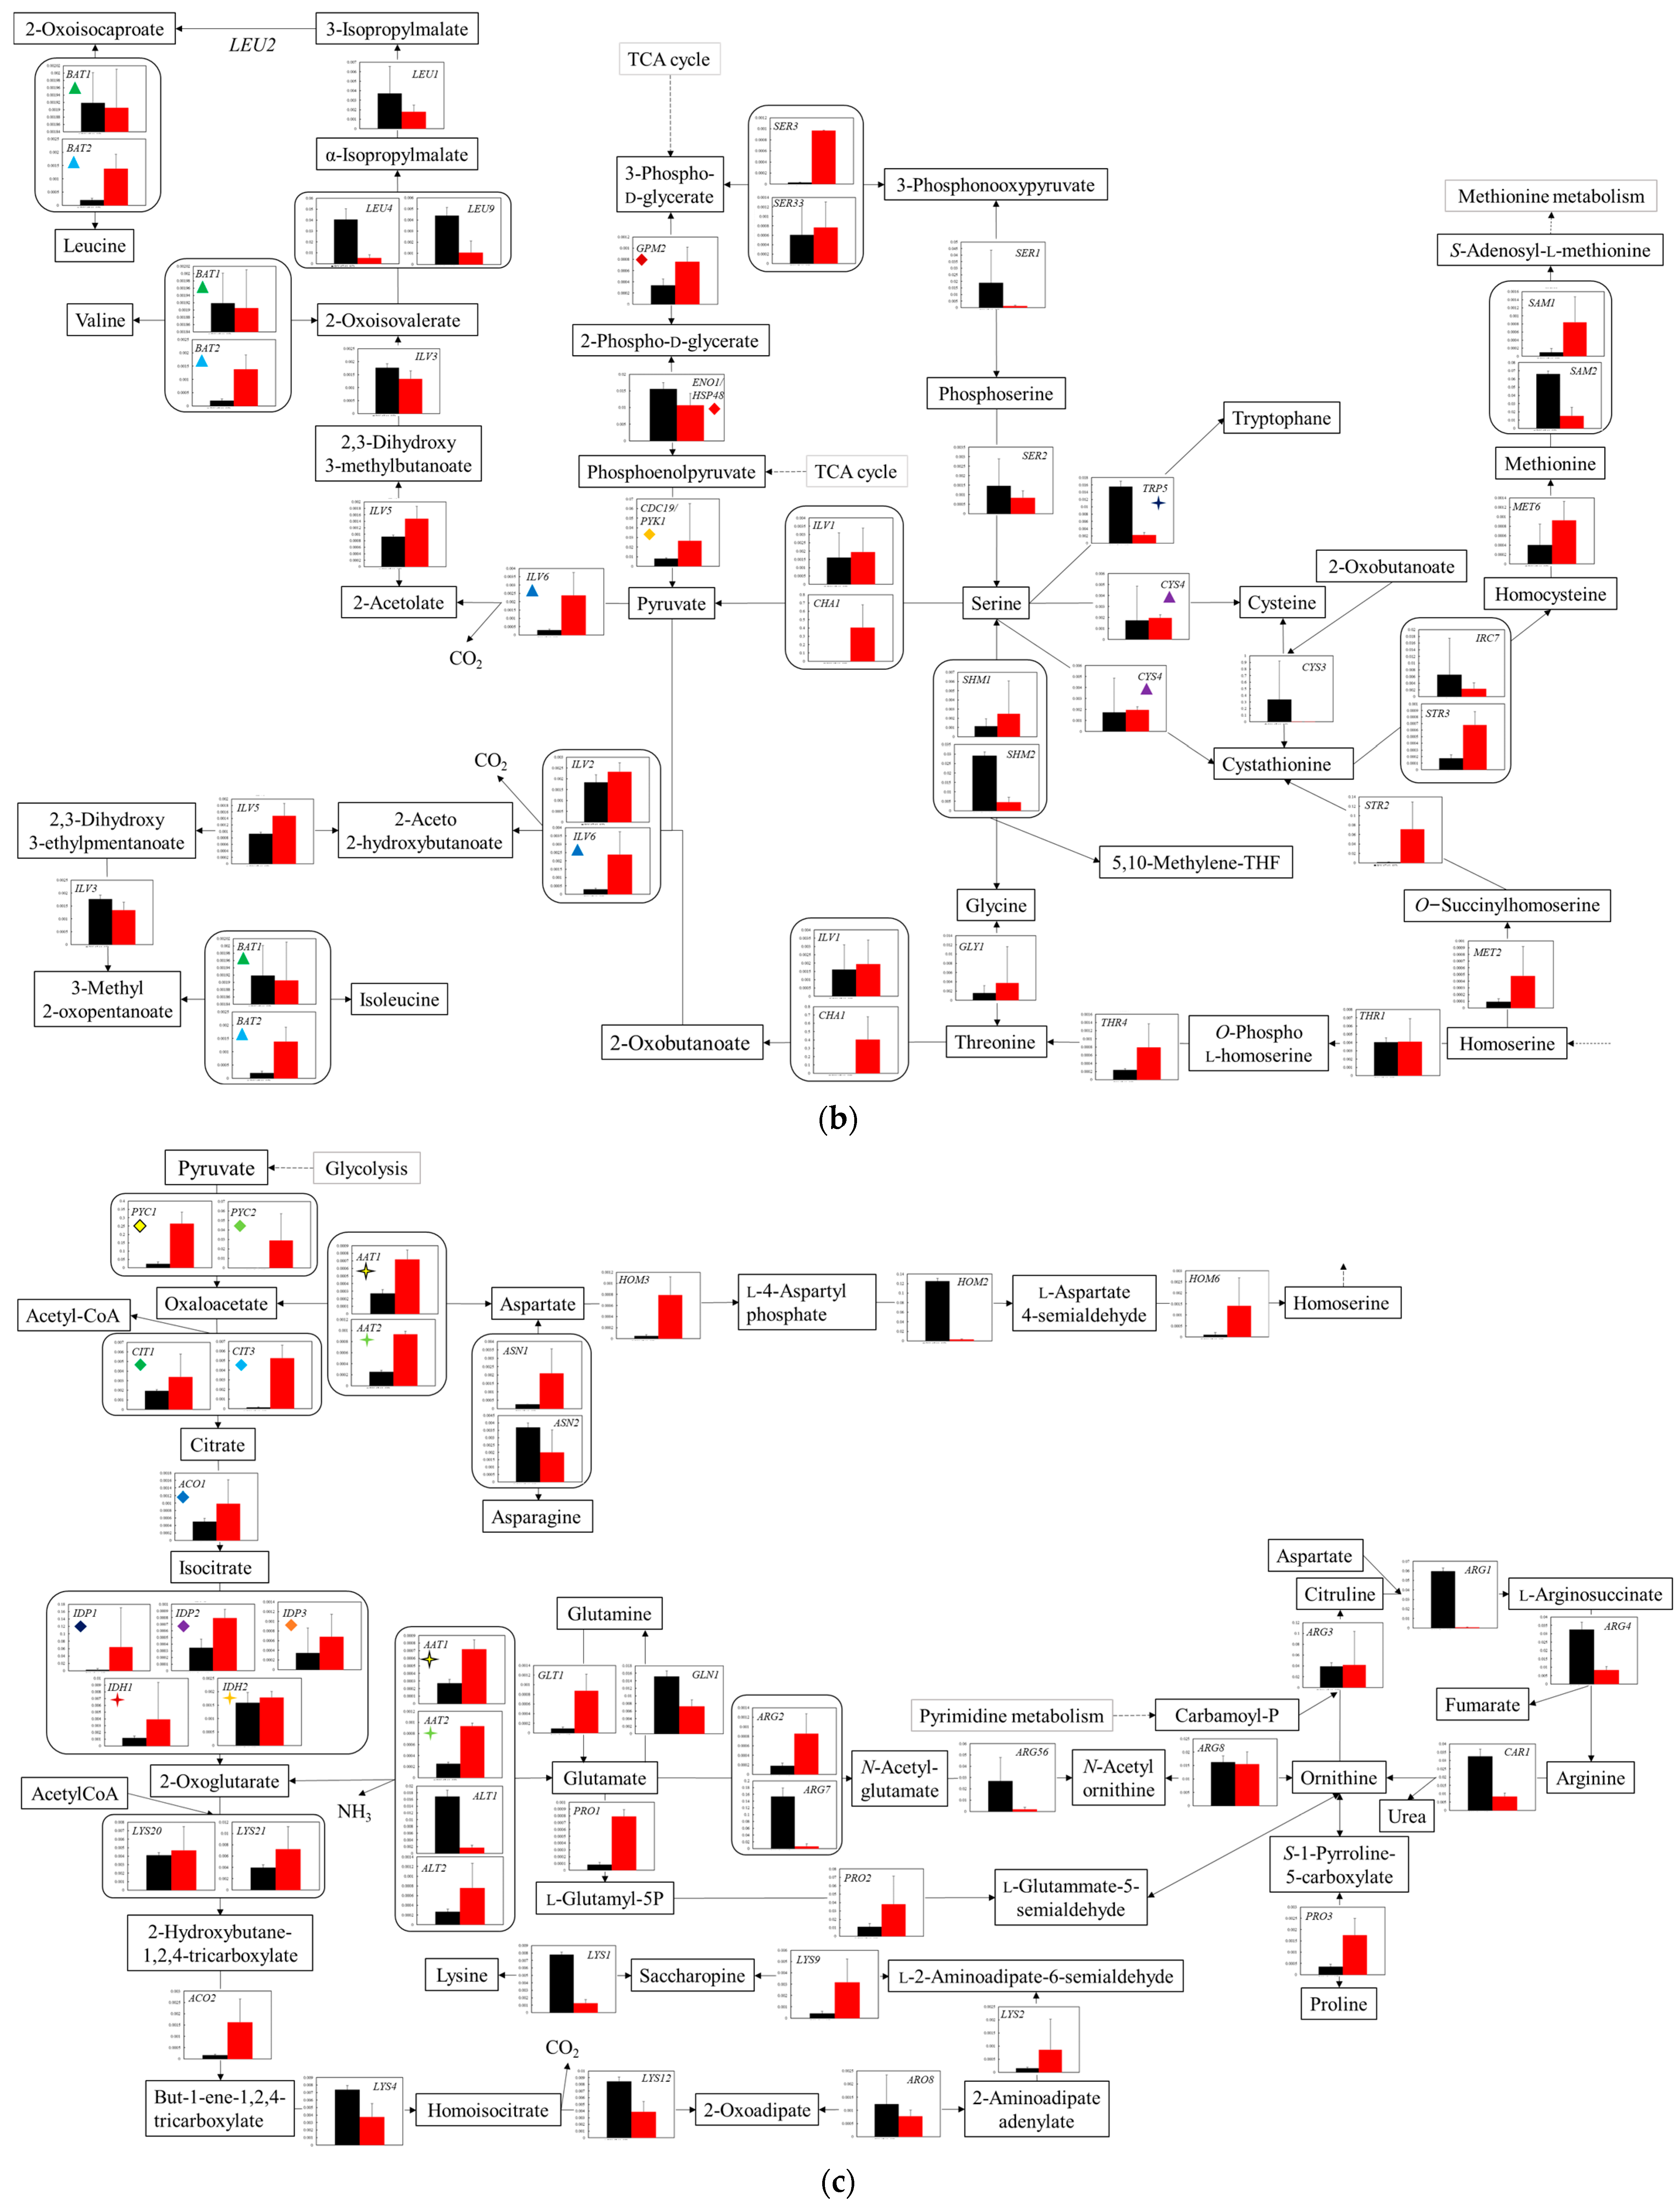
Figure 6.
Comparison of gene transcription levels in YG+HLMU medium and WG+HLMU medium on biosynthesis of amino acids. Data are shown as relative mRNA transcription levels normalized by the level of RDN18 as a housekeeping gene. Relative transcription levels in YG+HLMU medium and WG+HLMU medium at 15–20 h of main fermentation are shown in black and red, respectively. Error bars indicate SD of 3~8-time replicates experiments. Gene abbreviations in (a): ARO1: 3-phosphoshikimate 1-carboxyvinyltransferase, ARO2: chorismite synthase, ARO3: 3-deoxy-7-phosphoheptulonate synthase 3, ARO4: 3-deoxy-7-phosphoheptulonate synthase 4, ARO7: chorismite mutase, ARO8: aromatic amino acid aminotransferase, HIS1: ATP phosphoribosyltransferase, HIS2: histidinol-phosphatase, HIS4: phosphoribosyl-ATP pyrophosphohydrolase, HIS5: histidinol-phosphate aminotransferase, HIS6: phosphoribosylformimino-5-aminoimidazole carboxamide ribotide isomerase, HIS7: imidazole glycerol-phosphate synthase, NQM1: transaldolase, PHA2: prephenate dehydratase, PRS1: ribose 5-phosphate isomerase, PRS2: ribose-phosphate pyrophosphokinase 2, PRS3: ribose-phosphate pyrophosphokinase 3, PRS4: ribose-phosphate pyrophosphokinase 4, PRS5: ribose-phosphate pyrophosphokinase 5, RKI1: ribose 5-phosphate isomerase, RPE1: ribulose-phosphate 3-epimerase, TAL1: transaldolase, TKL1: transketolase 1, TKL2: transketolase 2, TRP2: anthranilate synthase, TRP3: anthranilate synthase/indole-3-glycerol-phosphate synthase, TRP4: anthranilate phosphoribosyltransferase, TRP5: tryptophan synthase, TYR1: prephenate dehydrogenase. In (b): BAT1: branched-chain amino acid aminotransferase 1, BAT2: branched-chain amino acid aminotransferase 2, CHA1: l-serine/l-threonine ammonia-lyase, CYS3: cystathionine gamma-lyase, CYS4: cysteine synthase, GLY1: threonine aldolase, ILV1: l-serine/l-threonine ammonia-lyase, ILV2: acetolactate synthase catalytic subunit 2, ILV3: dihydroxy-acid dehydratase, ILV5: ketol-acid reductoisomerase, ILV6: acetolactate synthase, IRC7: cysteine-S-conjugate beta-lyase, LEU1: 3-isopropylmalate dehydratase, LEU4: 2-isopropylmalate synthase 4, LEU9: 2-isopropylmalate synthase 9, MET2: homoserine O-acetyltransferase, MET6: 5-methyltetrahydropteroytriglutamate-homocysteine methyltransferase, SAM1: s-adenosylmethionine synthetase1, SAM2: s-adenosylmethionine synthetase2, SER1: phosphoserine aminotransferase, SER2: phosphoserine phosphatase, SER3: d-3-phosphoglycerate dehydrogenase 3, SER33: d-3-phosphoglycerate dehydrogenase 33, SHM1: glycine hydroxymethltransferase1, SHM2: glycine hydroxymethltransferase2, STR2: cystathionine gamma-synthase, STR3: cysteine-S-conjugate beta-lyase, THR1: homoserine kinase, THR4: threonine synthase. In (c): AAT1: alanine transaminase, AAT1: aspartate aminotransferase, AAT2: alanine transaminase, AAT2: aspartate aminotransferase, ACO2: homoaconitase, ALT1: alanine transaminase 1, ALT2: alanine transaminase 2, ARG1: argininosuccinate synthase, ARG2: amino-acid N-acetyltransferase, ARG3: ornithine carbamoyltransferase, ARG4: argininosuccinate lyase, ARG7: amino-acid N-acetyltransferase, ARG8: glutamate N-acetyltransferase, ARG56: N-acetyl-gamma-glutamyl-phosphate reductase, ASN1: asparagine synthase 1, ASN2: asparagine synthase 2, CAR1: arginase, GLT1: glutamate synthase, GLN1: glutamine synthetase, HOM2: aspartate-semialdehyde dehydrogenase, HOM3: aspartate kinase, HOM6: homoserine dehydrogenase, LYS1: saccharopine dehydrogenase 1, LYS2: l-2-aminoadipate reductase, LYS4: homoaconitate hydratase, LYS9: saccharopine dehydrogenase 9, LYS12: homoisocitrate dehydrogenase, LYS20: homocitrate synthase 20, LYS21: homocitrate synthase 21, PRO1: glutamate 5-kinase, PRO2: glutamate-5-semialdehyde dehydrogenase, PRO3: pyrroline-5-carboxylate reductase. The similarly colored and shaped marks in figures mean transcription levels of the same enzyme genes. (a) Comparison of gene transcription levels in YG+HLMU medium and WG+HLMU medium for biosynthesis of amino acids relating to pentose phosphate pathway. (b) Comparison of gene transcription levels in YG+HLMU medium and WG+HLMU medium for biosynthesis of amino acids from pyruvate. (c) Comparison of gene transcription levels in YG+HLMU medium and WG+HLMU medium for biosynthesis of amino acids relating to pyruvate and TCA cycle.
![Microorganisms 11 02674 g006a]()
![Microorganisms 11 02674 g006b]()
4. Discussion
The assimilation activities of
S. cerevisiae were evaluated through analysis of its growth in media containing wheat bran as the nutrient component (
Figure 1 and
Table 2). In order to discuss the values relating to growth, the values in this study should be evaluated relative to the data in previous reports. According to a previous report, the
µmax value was generally 0.34 ± 0.01 in 250-mL flasks containing 50 mL of YG+HLMU medium at 30 °C [
38]. In this study, the
µmax value in 200 µL of YG+HLMU medium at 23 °C was 0.407 ± 0.035; however, the culturing conditions of volume and temperature were different from the previous report [
38]. These conditions should be the same to evaluate the growth property, such that BY4741 was cultivated in 50 mL of YG+HLMU medium at 30 °C, resulting in obtaining the
µmax. The
µmax value at 30 °C was increased compared to previously reported data [
38] and BY4741 in this study showed the same growth property as BY4741 in another laboratory. The specific growth rate of yeast could be normally depressed 0.6~0.7 times with a decrease in the temperature to 23~24 °C from 30 °C [
39]; conversely, it could be enhanced by scaling down culturing volumes, with the result that the balanced
µmax in 200 µL at 23 °C in this study was slightly increased compared to that in 50 mL at 30 °C in this study. To evaluate the use of wheat bran as the nutrient, both the values of
µmax and OD
600 of BY4741 in WG+HLMU medium and YG+HLMU medium were evaluated, showing significant differences, and we can therefore reject the null hypothesis. Thus, although BY4741 could use wheat bran instead of YNB as the nutrient for its growth, the strain grew more vigorously in YG+HLMU medium rather than in WG+HLMU medium. Additionally, the fact that the cell density at 24 h in WG+HLMU medium shown by the OD
600 was 0.83 times lower than that in YG+HLMU medium could reinforce the conclusion that YNB is a better nutrient than the wheat bran for its growth. As per the composition of the wheat bran shown in
Table 3, the protein concentration was an adequate supply of nitrogen source for its growth. The ions of Na, Fe, Ca, Cu, and Zn, which are essential metals for growth [
32,
33,
34,
35,
36], showed as N.D. in the elemental analysis results; however, the growth of BY4741 was not significantly depressed, meaning that these ions were present at concentrations below the detection limit. On the other hand, although the maximum cell density in W+HLMU medium was 0.43 times lower than that in WG+HLMU medium, growth in W+HLMU medium was shown, strongly suggesting that the wheat bran contained a carbohydrate source.
In the case of BY4741 culturing in WG-group media without one of histidine, methionine, or uracil as the essential nutrients, there were no significant differences in cell growth rates (
Figure 2a). Compared to WG+HLMU medium, the growth rates in WG-group medium without one of histidine, methionine, or uracil as the essential nutrients were lower than those in WG+HLMU medium; growth was observed in WG-group medium without one of methionine, histidine, or uracil. Therefore, although the essential nutrient forms in the wheat bran were not convenient, the wheat bran contained enough methionine, histidine, and uracil to allow BY4741 to grow. On the other hand, in the case of BY4741 culturing in WG+HMU medium, even on an agarose plate of WG+HMU medium, no cell proliferation was observed. This indicated that the wheat bran did not contain enough leucine to grow. In addition, the result in
Figure 2b was that BY4741 and BY4741/pATP425 could be controlled in WG+HMU medium as a selective medium. It was of great significance industrially that the wheat bran, which is significantly cheaper than YNB, could be used as a restricted medium.
The assimilation activity of BY4741 in WG+HLMU medium was evaluated through glucose consumption (
Figure 3;
Table 4). According to the above analyses, BY4741 cultured in WG+HLMU medium consumed glucose only at a level 60.6% of that in YG+HLMU medium in 24 h, revealing that the efficiency of glucose consumption by BY4741 was decreased in WG+HLMU medium compared to YG+HLMU medium. It is well known that the glucose consumption rate of BY4741 differs depending on the nutritional source [
40], and it was shown that wheat bran was no better than the optimized YNB in terms of glucose. However, there was no significant difference in the conversion ratio (theoretical yield) of ethanol from glucose by BY4741 between 63.0 ± 7.2% in WG+HLMU medium and 62.5 ± 8.2% in YG+HLMU medium, and there was no significant difference in ethanol production, even though the efficiency of ethanol production remained the same, meaning that there were no major changes in the metabolic response. There was a change in the efficiency of the cell production from glucose, indicating that the cell response was significant. According to Vieira et al., 47 wt% of the cell weight of the
S. cerevisiae is carbon [
30]. Thus, in this study, in WG+HLMU medium, 47 wt% of 0.600 ± 0.003 g∙L
−1 of the cell was 0.28 g∙L
−1 of the carbon as the component of the cells, and 0.705 g∙L
−1 of glucose was used for cell production, meaning that 7.37 ± 0.04 wt% of glucose was assessed for use in cell production. On the other hand, in YG+HLMU medium, 47 wt% of 0.659 ± 0.021 g∙L
−1 of the cell was 0.31 g∙L
−1 of the carbon as the component of the cells, and 0.774 g∙L
−1 of glucose was used for cell production, meaning that 4.90 ± 0.04 wt% of glucose was assessed for use in cell production. Therefore, the fact that there was a significant difference in cell production strongly suggests that intracellular metabolism, including glucose intaking, could change dramatically. In order to produce substances from the wheat bran resource as a raw material by the use of the intracellular metabolic flow of the BY strain, the evaluation of the intracellular response to the raw material was highly important. Therefore, the attempt was made to analyze and evaluate how BY4741 responded to the use of wheat bran.
The transcriptomic analyses were performed to evaluate the detailed cell responses (
Figure 4,
Figure 5 and
Figure 6). In the case of using wheat bran instead of YNB, the metabolic activities in the upstream glycolysis were possibly enhanced because overall the gene transcription levels were increased (
Figure 4a). On the other hand, the transcription levels of
FBA1/
LOT1,
TDH1/
GLD3,
TDH2/
GLD2, and
TDH3/
GLD1 at the borderline of preparatory and pay-off in glycolysis were depressed in WG+HLMU medium, strongly indicating that BY4741 could activate other metabolic pathways instead of the Embden-Meyerhof glycolysis pathway. Ralser et al. explained that eucaryotic cells could inactive TDH functions as a metabolic switch for rerouting the carbohydrate flux to counteract environmental changes [
41], suggesting that
S. cerevisiae cells tried to shift metabolic flow from glucose to the pentose phosphate pathway via β-
d-fructose-6P by replacing YNB with wheat bran. Therefore, a detailed evaluation of the transcription levels in the pentose phosphate pathway was profoundly desired.
When wheat bran was used instead of YNB, the gene transcription levels of
PCK1/
JPM2/
PPC1 were enhanced, suggesting that carbon flow could be introduced from the TCA cycle to phosphoenolpyruvate-mediated glycolysis (
Figure 4b). Rintze et al. indicated that PCK1/JPM2/PPC1 could perform as a decarboxylase controlling the reactions related to gluconeogenesis, and the transcription of these genes could also be induced by gluconeogenic substrates [
42]. The strain might also induce gluconeogenesis when bran was used. Under the medium-condition using wheat bran instead of YNB,
S. cerevisiae could be about to begin carbon source starvation at the evaluation timing. Thus, the strain can improve growth and production by increasing the concentration of glucose to avoid carbon source starvation. In addition, the increase in the transcription levels of the isoenzymes
ACS1/FUN44 and
ACS2 indicated the influx into the TCA cycle via acetate. This may indicate that the cells were trying to take in the previously produced ethanol as a carbon source. In fact, in 24 h fermentation, the concentration of ethanol in WG+HLMU medium was 69.5 wt% compared to that in YG+HLMU medium. To date, there have been many reports that BY4741 utilizes the ethanol produced by itself as a carbon source [
43], and this acetic acid-mediated metabolic flow from ethanol could be likewise enhanced in the case of using wheat bran. In addition, since BY4741 is also able to regenerate NADH from NAD
+ in the metabolic pathway from acetaldehyde to acetic acid [
44], the strain could use this alternative pathway instead of the pathway regulated by the repressed gene transcriptions of
TDH1/
GLD3,
TDH2/
GLD2, and
TDH3/
GLD1, which similarly control NADH production. Regarding ethanol production, the
ADH1 transcription level decreased significantly. Although no significant difference in ethanol production efficiency was confirmed in this study, the significant difference between the
ADH transcription levels in WG+HLMU medium and YG+HLMU medium could affect metabolism because of ADH1′s activity of regenerating NADH from NAD
+ [
45,
46].
In the case of using wheat bran instead of YNB as the medium component, the gene transcription levels of
PYC1 and
PYC2 were high, with significant differences (
Figure 5). Similarly, the transcription levels of
CIT1 and
CIT3 remained high, suggesting that carbon flow via pyruvate into the TCA cycle was induced. In particular, significantly high transcription levels of
PYC1 and
PYC2 possibly indicate that the cells wanted to introduce a carbon source not only into the TCA cycle but also into the amino acid synthesis pathway via aspartate. In terms of the amino acid synthesis pathway, by using wheat bran instead of YNB, the transcription levels around 2-oxoglutarate tended to be activated as a whole, indicating the possibility that amino acid synthesis such as glutamic acid was activated. To clarify the above, evaluation of the transcription levels of these pathways would be highly desirable.
In the case of using wheat bran as an alternative nutrient to YNB, the gene transcription levels of isozyme genes
TKL were increased (
Figure 6a). The result showed the possibility that the metabolic activity from fructose-6 phosphate to glycelaldehyde-3 phosphate was enhanced. The enhancement of the pentose phosphate pathway via ribose 5-phosphate was possibly reinforced to produce NADPH, which was consumed in the biosynthetic pathways of branched-chain amino acids such as glutamate and proline. So far, the cells are known to enhance the pentose phosphate pathway to produce NADPH [
47], possibly indicating that culturing in wheat bran media promoted the synthesis of these amino acids using the pentose phosphate pathway. In particular, as shown in
Figure 4a, in WG+HLMU medium towards in YG+HLMU medium, the transcription levels of
FBA1/
LOT1,
TDH1/
GLD3,
TDH2/
GLD2, and
TDH3/
GLD1 corresponding to the enzymes around glyceraldehyde in glycolysis were depressed; the transcription levels between glyceraldehyde-3 phosphate and glycerol were increased/maintained; the levels of all genes between glycerol and 3-phospho-
d-glycerate were, conversely, enhanced. Those results indicated the possibility that glucose could flow to 3-phospho-
d-glycerate via the pentose phosphate pathway and glycerol producing pathway rather than via fructose-6 phosphate. Regarding the production of tyrosine and phenylalanine, the transcription levels of
ARO3,
ARO4, and
ARO1 should be considered to be controlling factors on the metabolic pathway. ARO3 and ARO4 are generally known to be feedback-inhibited by tyrosine and phenylalanine. Therefore, as Braus suggested that the transcription levels of these genes were regulated by the presence of substrates [
17,
48], the transcription levels of
ARO3 and
ARO4 could also be sensitively affected by the presence of tyrosine and phenylalanine in the medium. Additionally, the depressed transcription level of ARO1, an enzyme which controls the unique pathway between
d-erythrose 4-phosphate and 5-O-3-phosphoshikimate via shikimate, could also be related to the decrease in activity for the production of tyrosine and phenylalanine.
In the case of the use of wheat bran as an alternative to YNB, regarding the synthesis from 3-phospho-
d-glycerate to serine, the depressed transcription levels of
SER1 and
SER2 and the enhanced levels of
ILV1 and
CHA1 could indicate the reinforcement of the synthesis via pyruvate (
Figure 6b). Pyruvate serves as a starting point for synthesizing multiple amino acids, so that the cells might have prioritized the metabolic flow to pyruvate. Serine biosynthesized from pyruvate is an important intermediate metabolite. In WG+HLMU medium, with the regard to the synthesis from serine to threonine, the synthesis was mainly performed in the pathway via cystathionine and homoserine with the repression of the transcription levels of
TRP5 and
SAM2 in tryptophane synthesis. The fact that the transcription level of
TRP5, which is a gene of an enzyme controlling the pathway from serine to tryptophane, was depressed could have the effect of decreasing runoff of intermediate metabolites on the pathway to cystathionine and homoserine. Similarly, SAM2, which does not receive negative feedback control depended on the methionine quantity unlike SAM1, controls methionine metabolism [
49] so that the transcription level of this could also have the effect of decreasing runoff on the pathway. Homoserine is an important intermediate metabolite for producing threonine and methionine in the cell [
50], meaning that BY4741 might be satisfied by taking the roundabout route. In addition, with regard to leucine biosynthesis from 2-oxoisovalerate, in WG+HLMU medium, the cells decreased the transcription activities of
LEU4 and
LEU9 as the unique genes in the pathway. As with the biosynthesis of methionine and tryptophan, the cells might control leucine synthesis.
In the case of the use of wheat bran instead of YNB, the enhanced gene transcription level of
PYC possibly indicated a reinforcement of the metabolic flow to oxalacetate as described with respect to
Figure 5. Oxaloacetate is not only an intermediate metabolite in the TCA cycle, but also deeply related to the synthesis of the various amino acids via 2-oxoglutarate [
51]. From the viewpoint of oxaloacetate as the starting point, the transcription levels of
AAT1 and
AAT2 were greatly enhanced, while that of
HOM2 was significantly decreased, indicating the promotion to synthesize asparagine and aspartic acid; the transcription levels in the metabolic pathway toward 2-oxoglutarate showed a tendency to be improved, suggesting the possibility that amino acid synthesis originating from 2-oxoglutarate was also promoted (
Figure 6c). Between 2-oxoglutarate and glutamate, the cells tended to maintain metabolic flow even though the transcription levels of the isoenzyme gene were switched. In addition, glutamate is an important intermediate metabolite leading to arginine and proline [
51]; the level of
GLN1 related to the flow from glutamate to glutamine decreased, and the level of
GLT1 related to the flow from glutamine to glutamate increased. Thus, BY4741 tended to maintain glutamate as the intermediate metabolite in the use of wheat bran. Furthermore, due to the decrease in the levels of
ARG1 and
CAR1 and the increase in that of
PRO3, ornithine possibly flowed not to arginine but to proline. In addition, lysine synthesis from 2-oxoglutarate might also be regulated, since the transcription level of
ARO8 was decreased although those of
LYS2 and
LYS9 were increased.
The evaluation of the gene transcription levels could not directly indicate the effects on the metabolic flows since the gene translation activity and enzyme activity after the gene transcription were influenced by circumstance situation; however, the activity evaluation allowed us to evaluate how cells wanted to respond. Then, the cell responses in the medium containing wheat bran instead of YNB were shown by evaluating the changes of the gene transcription levels. The aim of this study was the evaluation of the cell responses when wheat bran was used in place of YNB; our study reached the goal of revealing how cells attempt to respond from the viewpoint of transcriptome analysis. The results reported in this study are beneficial in the academic aspect because they could be useful to detect which points should be overexpressed by genetic engineering when the mutants are to be prepared to produce value-added substances in wheat bran medium.


 ,
, 


