Article

Development of a Real-Time qPCR Method for the Clinical Sample Detection of Capripox Virus

1
Key Laboratory of Biotechnology and Bioresources Utilization of Ministry of Education, Dalian Minzu University, Dalian 116600, China
2
Liaoning Center for Animal Disease Control and Prevention, Shenyang 110164, China
3
School of Mechanical Engineering, Faculty of Mechanical Engineering, Materials and Energy, Dalian University of Technology, Dalian 116024, China
4
China Animal Disease Prevention Control Center, Beijing 100125, China
*
Authors to whom correspondence should be addressed.
These authors contributed equally to this work.
Microorganisms 2023, 11(10), 2476; https://doi.org/10.3390/microorganisms11102476
Submission received: 29 August 2023 / Revised: 26 September 2023 / Accepted: 27 September 2023 / Published: 2 October 2023
(This article belongs to the Section Veterinary Microbiology)

Abstract

:
Capripox viruses (CaPVs), including sheep pox virus (SPV), goat pox virus (GPV), and lumpy skin disease virus (LSDV), are the cause of sheep pox (SPP), goat pox (GTP), and lumpy skin disease (LSD) in cattle. These diseases are of great economic significance to farmers, as they are endemic on farms and are a major constraint to international trade in livestock and their products. Capripoxvirus (CaPV) infections produce similar symptoms in sheep and goats, and the three viruses cannot be distinguished serologically. In this study, we developed a real-time quantitative polymerase chain reaction (qPCR) method for identifying CaPV in goats, sheep, and cattle. Clinical samples were tested and verified. The developed assay was highly specific for target viruses, including GPVSPV and LSDV, which had no cross-reaction with other viruses causing similar clinical symptoms. An artificially synthesized positive control plasmid using the CaPV 32 gene inserted into the vector pMD19-T was used as a template, and the correlation coefficient of the linear regression curve (R2) was 0.9916, the estimated amplification efficiency (E) was 96.06%, and the sensitivity (limit of detection, LOD) was 3.80 copies per reaction. Using the clinical samples as a template, the limit of detection (LOD) was 4.91 × 10⁻⁵ ng per reaction (1.60 × 10⁻⁵–2.13 × 10⁻³ ng, 95% confidence interval (CI)), which means that this method was one of the most sensitive detection assays for CaPVs. A total of 85 clinical samples from CaPV-infected animals (goats, sheep, and cattle) and 50 clinical samples from healthy animals were used to test and compare the diagnostic results using the Synergy Brands (SYBR) Green-based PCR method recommended by the World Organization of Animal Health (WOAH). Both diagnostic sensitivity (DSe) (95.8–100%, 95% CI) and diagnostic specificity (DSp) (92.9–100%, 95% CI) results of the real-time quantitative PCR (qPCR) and SYBR Green PCR were 100%, and the kappa value (κ) was 1.0 (1-1, 95% CI). In summary, the assay established based on TaqMan probes was advantageous in high specificity, sensitivity, and general applicability and could be a competitive candidate tool for the diagnosis of CaPV in clinically suspected animals.

1. Introduction

Goat pox virus (GPV), sheep pox virus (SPV), and lumpy skin disease virus (LSDV) are three genetically similar pathogens of genus Capripoxvirus (CaPV) in the subfamily Chordopoxvirinae, family Poxviridae [1]. These viruses are the etiological agents of goat pox (GTP), sheep pox (SPP), and lumpy skin disease (LSD), respectively, which are acute viral infectious diseases of goats, sheep, and cattle [2]. Capripox (CaP) is endemic in many parts of the world, including China. It was initially found in Africa in 2012 and has since traveled through European countries and gradually spread to Asia; the epidemic is currently severe and is causing substantial economic losses in some countries in northern Africa, the Middle East, and Asia (Source: FAO, https://wahis.woah.org accessed on 24 September 2023) [3]. The outbreak of LSD was first confirmed in Xinjiang, China, in August 2019 [4]. At present, 24 cases of LSD have been reported in Fujian, Jiangxi, and other places in China [5]. There have also been 140 epidemic cases of GTP and SPP reported in Shanxi, Inner Mongolia, and other places in China, causing significant economic losses [6]. CaP affects the healthy development of the global ruminant breeding industry and the international trade in livestock products. It is also an important pathogen harming the ruminant breeding industry in China; accordingly, it is categorized as a notifiable disease by the World Organization for Animal Health (WOAH) [7].
LSD can infect cattle of all ages, both sexes, and all breeds. Its clinical symptoms include fever, depression, reduced milk yield, and skin lesions (nodules, papules, and spots) [8], with an incidence of 5–45% and a fatality rate of 10% [9]. The main clinical symptoms of goats and sheep infected with GTP and SPP are fever, erythema, papules, herpes, and blisters on the skin or mucosa of the hairless or lower parts [10,11], with an incidence of 50~80%; the mortality of adult sheep can reach 40%, and lamb mortality can reach 100% [12]. CaP is mainly transmitted via mechanical contact with blood-sucking arthropods such as mosquitoes, flies, and ticks [13]. Due to the diversity and non-controllability of mechanical transmissions of pests in the field, CaP has a significant influence on long-distance trans-regional diffusion. During detection, the disease can be preliminarily diagnosed through clinical symptoms such as fever, nodular changes in the skin, and lymph node enlargement, but its diagnosis depends on laboratory detection, especially when the disease is in the incubation period or prodromal stage [14]. Furthermore, the symptoms of skin damage in sick goats, sheep and cattle are easily confused with skin ringworm and insect bites. During the onset period, the infected nodules may present mucosal necrosis, rupture and other symptoms, which need to be differentiated from foot-and-mouth disease, peste des petits ruminants disease, bovine viral diarrhea, etc. [7,14,15]. In addition to judging by obvious clinical symptoms, GPV, SPV, and LSDV can also be diagnosed through virus isolation and culture [16], electron microscopy [17], animal experiments [18], and laboratory detection technology [19]. However, there may be mixed infections of multiple pathogens during the inoculation of disease materials, so it is necessary to combine molecular or serological detection methods with higher specificity to comprehensively determine whether the isolated pathogen is CaPV [20]. Moreover, silent infections without clinical symptoms also need to be confirmed by laboratory testing [21]. Laboratory diagnosis mainly relies on molecular biology and immunological detection methods [22]. As a highly contagious infectious disease, CaP has sporadic prevalence in China and neighboring countries and regions, and there is a risk of pandemic [1,23]. However, the ELISA method relies on antibodies, which have the limitations of popularization and application, and there is no commercial kit. At present, conventional PCR and SYBR Green PCR are the only molecular detection methods recommended by the WOAH which have the disadvantages of complicated operation. Therefore, the development of a rapid, accurate and simple CaPV-specific real-time qPCR detection method is a beneficial supplement to the recommended method of the WOAH, and also the key to the prevention and control of this disease.
In this study, a real-time qPCR method was established for the detection of CaPV, including GPV, SPV, and LSDV. The performance of the newly developed detection method was verified and compared with the SYBR Green-based PCR method recommended by the WOAH [24] in clinical samples to evaluate its degree of consistency.

2. Materials and Methods

2.1. Viruses, Bacteria and Specimens

All viruses and bacteria used for specificity analyses in this study were clinical samples or cultures, and they are listed in Table 1. Three members of the CaPVs genus (CaPV) (GPV, SPV and LSDV) were used. Other viruses and bacteria included foot-and-mouth disease virus (FMDV), peste des petits ruminants virus (PPRV), bovine viral diarrhea virus diarrhea virus (BVDV), Brucella, Mycobacterium tuberculosis, Bacillus anthracis. The clinical samples used in the study were from animal infection clinical samples. These samples were confirmed and stored by the Chinese Center for Animal Disease Control and Prevention (Beijing, China). Eighty-five clinical samples (skin tissue, whole blood, and lymph nodes) of CaPV infection were taken from goats (n = 26), sheep (n = 29), and cattle (n = 30), all showing mild to severe clinical symptoms (fever and skin lesions). The 50 negative control samples included samples from goats (n = 16), sheep (n = 15), and cattle (n = 19) and were collected from healthy animals. All clinical samples were confirmed using real-time SYBR Green PCR [8] as recommended by the WOAH in the Chinese Center for Animal Disease Control and Prevention. All clinical samples or cultures infected with viruses and bacteria were stored and used at the Chinese Center for Animal Disease Control and Prevention (Beijing, China).

2.2. Virus and Bacteria DNA/RNA Extraction

Clinical samples were used for method validation. For each tissue sample (skin tissue, lymph node), about 1.0 g was weighed from three different locations, cut and ground in the grinder, with 1.0 mL normal saline (0.9% sodium chloride solution) added before continuing grinding, and then homogenized and transferred to a sterile centrifuge tube, centrifuged in a high-speed refrigerated centrifuge at 10,000× g rpm for 2 min, and absorbed by using 100 µL supernatant in a 1.5 mL sterile centrifuge tube. The whole blood was centrifuged at 10,000× g rpm for 5 min, and 100 µL of supernatant was absorbed into a 1.5 mL sterile centrifuge tube. The supernatant, as described above, was stored at −80 °C for DNA extraction.
Viral and bacterial DNA (CaPV, Brucella, Mycobacterium tuberculosis, Bacillus anthracis) were extracted from clinical samples using the DNA extraction kit with the magnetic beads (Code DP438-T2K, Tiangen Biochemical Technology Co., Ltd., Beijing, China) according to the manufacturer’s instructions. Viral RNA (foot-and-mouth disease virus, peste des petits ruminants disease virus, bovine viral diarrhea virus) was extracted from clinical samples using the RNA extraction kit with the magnetic beads (Code DP452, Tiangen Biochemical Technology Co., Ltd., Beijing, China), according to the manufacturer’s instructions.

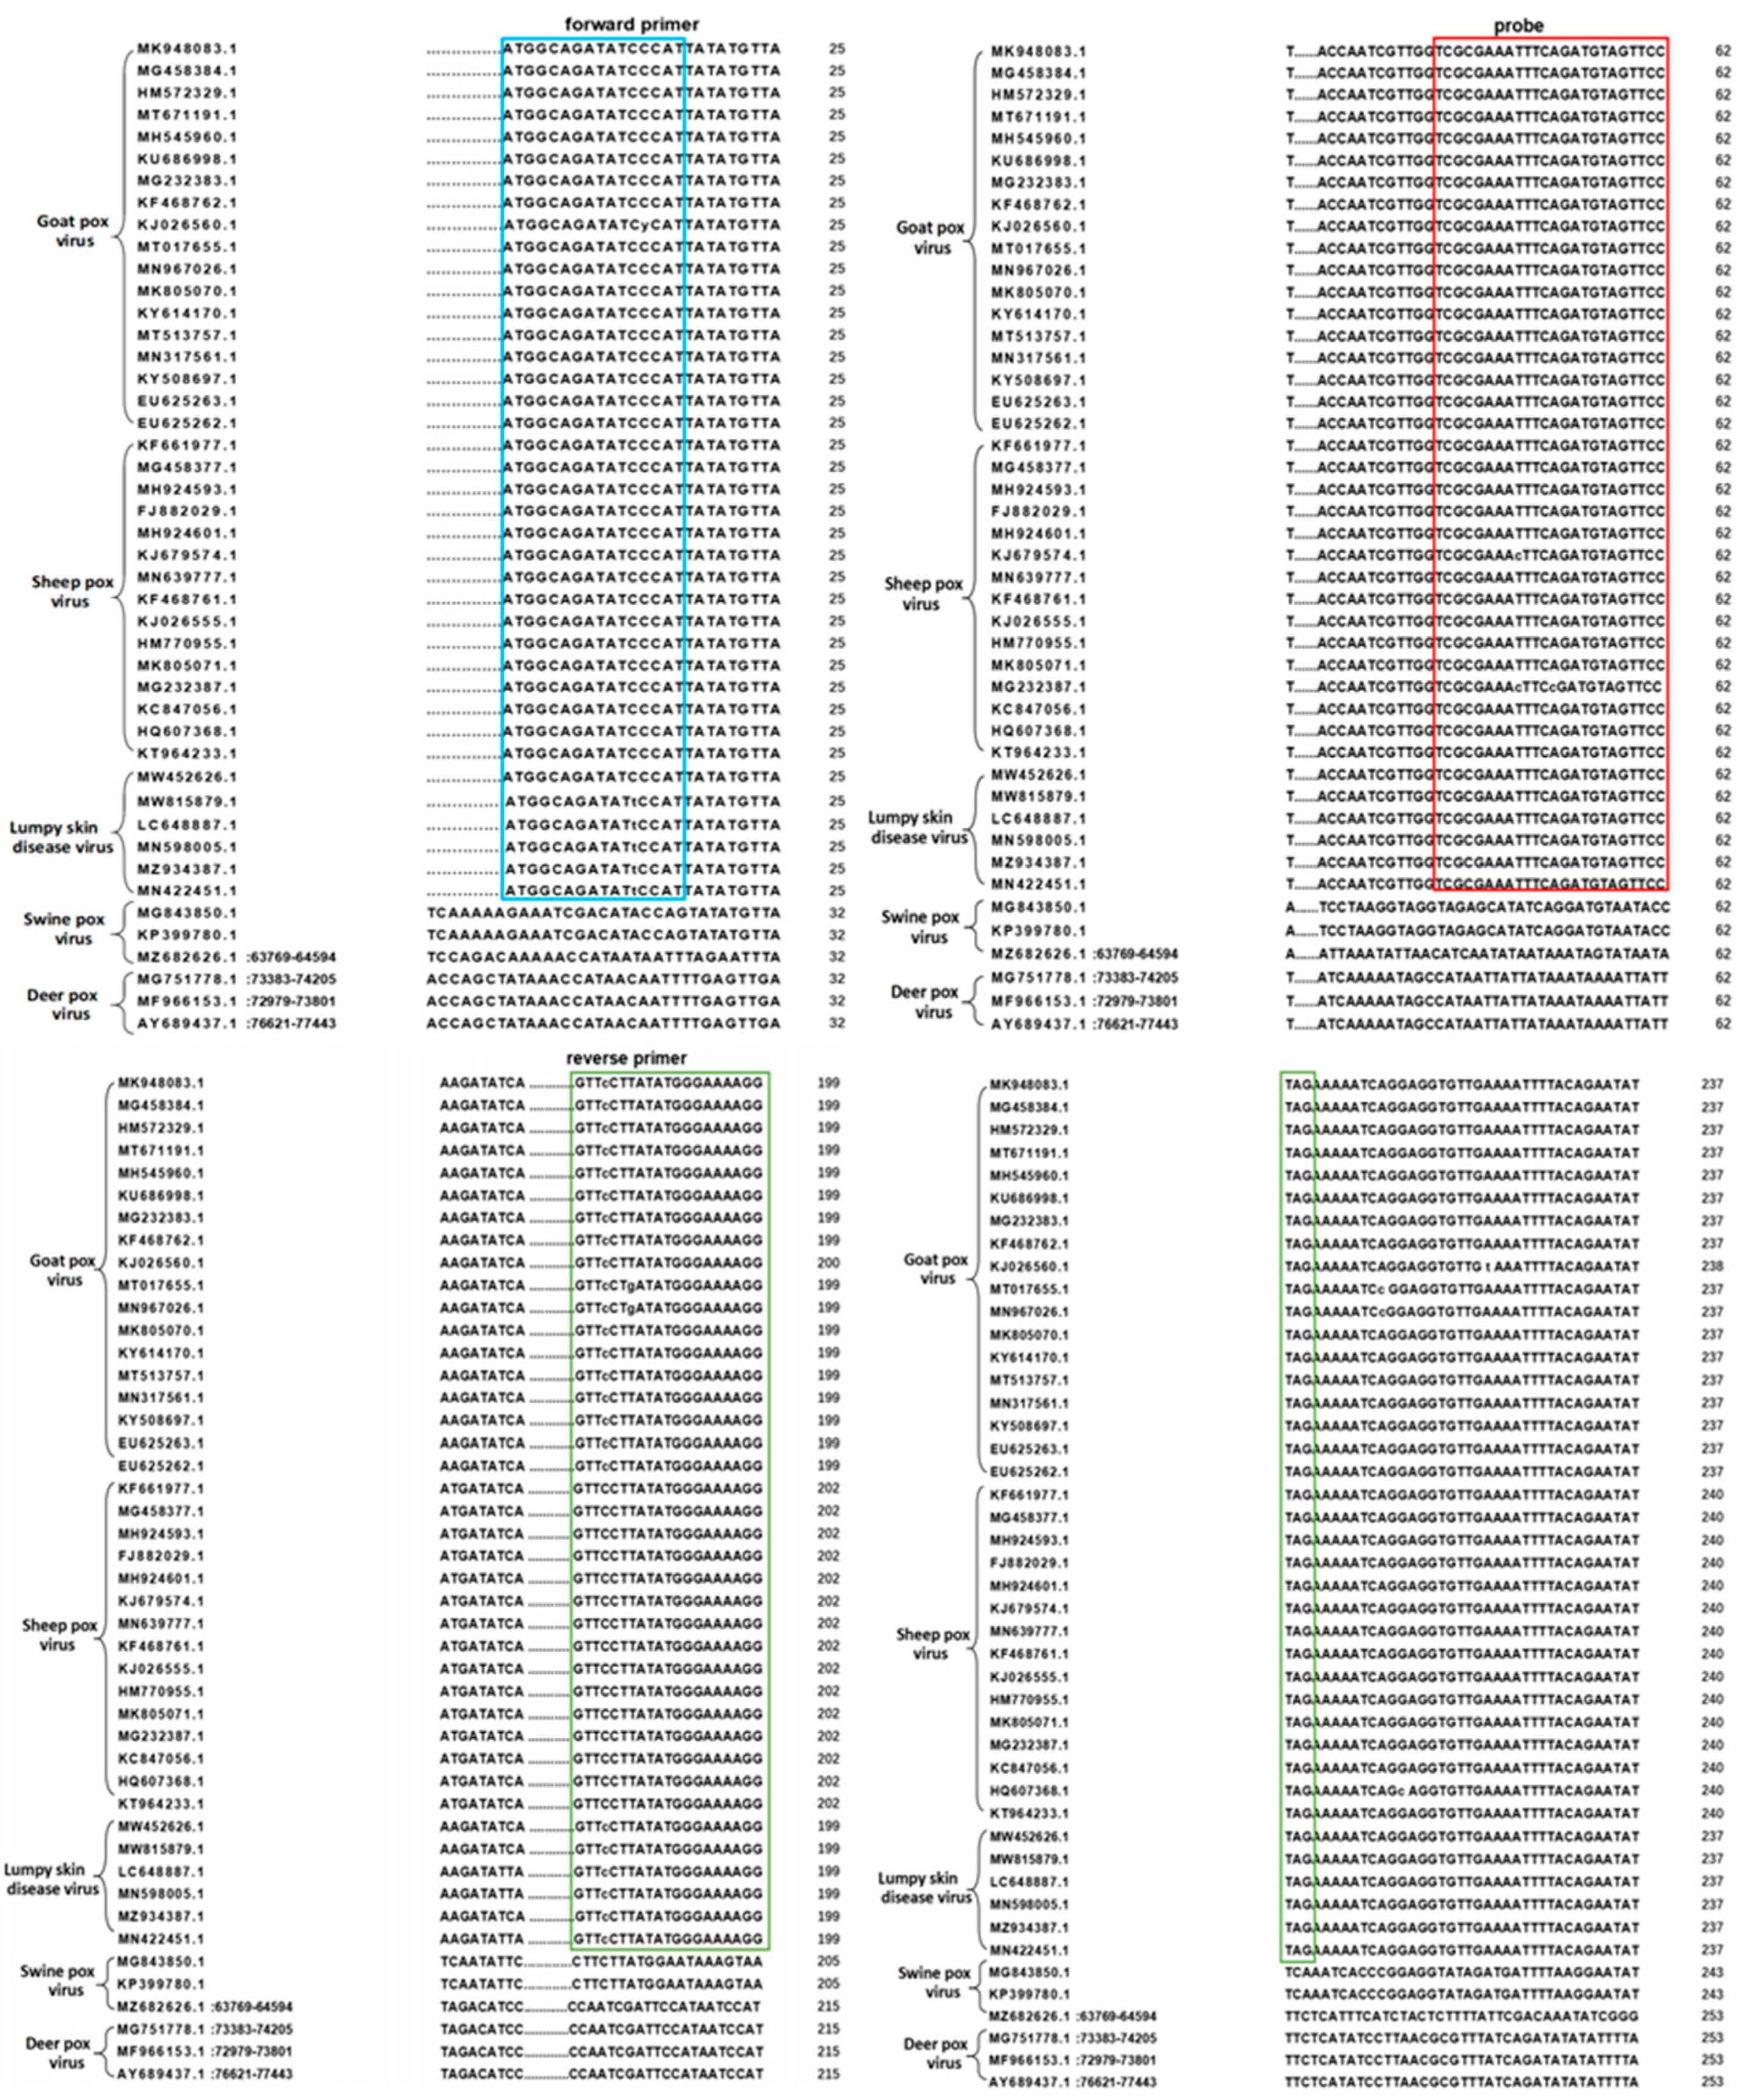
2.3. Homology Analysis

The gene sequences of GPV, SPV, and LSDV were retrieved from the National Center for Biotechnology Information (NCBI) nucleotide database (www.NCBI.nlm.nih.gov/nucleoties accessed on 24 September 2023). A total of 155 accession numbers (including 21 accession number LSDV isolates, 69 accession number SPV isolates, and 65 accession number GPV isolates) were searched based on the CaPV P32 gene sequence in NCBI. From 155 accession numbers, 39 representative isolates of 3 CaPV members (including different isolation times, locations, and hosts) were selected (Table 2). The CaPV P32 gene sequence was used to analyze the homology of the CaPV members (including GPV, SPV, and LSDV). The P32 gene sequence was used as a template in the blast search [25]. From the blast output, the results with the highest scores were selected in method development. In addition, gene sequences of other viruses and bacteria used for exclusivity tests were retrieved. MEGA 4.0 was used to compare gene sequences [26]. The 39 accession numbers of the P32 gene sequence of CaPV used in this study are shown in Table 2.

2.4. Primers and TaqMan Probes Design

The P32 gene sequence of CaPV and the gene sequences of closely related viruses and bacteria (including foot-and-mouth disease virus, peste des petits ruminants disease virus, bovine viral diarrhea virus, Brucella, Mycobacterium tuberculosis, and Bacillus anthracis) were subjected to multiple alignments, and the most volatile fragments were screened out. The 3’ end of the primer is placed at a location where the target virus displays different nucleotides from closely related viruses and bacteria, ensuring target virus specificity. Primers and probes were designed using Primer Express software 5.0 [27] (Applied Biosystems, Foster City, CA, USA), and secondary structures and the presence of possible primer dimers were evaluated. The nucleotide sequences used to design primer selection were introduced into the “Oligocalc” program [28], and the length was optimized according to the resulting “salt-adjusted” annealing temperature. The annealing temperature calculated by the “salt-adjusted” algorithm was used as the starting value for qPCR. The specific qPCR method for detecting the Capripox virus uses a TaqMan probe. The fluorescence group (Reporter) 6-carboxyfluorescein (6-FAM) was labeled at the 5’ end of the probe, and the Quencher group (Quencher) Black Hole Quencher 1(BHQ1) was labeled at the 3’ end of the probe. In addition, primers for the real-time SYBR Green PCR test (Fw3/Rev3) were derived from the WOAH Manual of Diagnostic Tests and Vaccines for Terrestrial Animals Chapter 3.8.12 on the diagnostic methods of Capripox [7]. Table 3 lists the sequence of all primers and probes used in this study. The primers and probes were synthesized by Takara Biomedical Technology (Dalian) Co., Ltd. (Dalian, China).

2.5. qPCR Reaction System

qPCR and SYBR Green PCR analyses were performed on an ABI Q7 Rapid thermal cycling apparatus (Thermo Fisher Scientific). Probe qPCR Mix (Code391A, TaKaRa Co., Ltd., Dalian, China) was used for the qPCR analysis. One-step PrimeScript III RT-qPCR Mix (RR600A, TaKaRa Co., Ltd., Dalian, China) was used for the RT-qPCR analysis. The composition of the PCR master mixture consisted of a 1 × kit supplement buffer (master mix) and 2 µL template (viral DNA or RNA), plus balanced nuclease-free water, resulting in a final volume of 25 µL. The final concentrations of primers and probes used in the PCR main mixture are as follows: 0.2 pmol/µL forward primer, 0.2 pmol/µL reverse primer, and 0.2 pmol/µL probe. The optimal thermal cycle conditions of qPCR (CaPV, Brucella, Mycobacterium tuberculosis, Bacillus anthracis) included 95 °C for 30 s followed by 1 cycle; 95 °C for 5 s, 60 °C for 30 s and 45 cycles. The optimized thermal cycle conditions of RT-qPCR (foot-and-mouth disease virus, peste des petits ruminants disease virus, bovine viral diarrhea virus) included 52 °C for 5 min (Reverse Transcript step), then 95 °C for 10 s, 95 °C for 5 s, 60 °C for 30 s and 45 cycles.
Real-time SYBR Green PCR, recommended by the WOAH, was used for the comparison, verification, and detection of the Capripoxvirus [29]. SYBR Green PCR analysis was performed using TB Green® Premix Ex Taq™ II (Tli RNaseH Plus) (Code RR820A, TaKaRa Co., Ltd., Dalian, China). The optimal thermal cycle conditions of SYBR Green PCR (CaPV) included 95 °C for 15 min and 1 cycle, 95 °C for 15 s, 60 °C for 30 s, and 72 °C for 30 s and 45 cycles.

2.6. Artificial CaPV Templates Used as Positive Amplification Control (PAC)

The 550 bp sequence of the CaPV P32 gene (Accession no. MG458377.1) was inserted into the commercial vector pMD19-T to construct the plasmid, which was digested by Sac I and used as a linearized plasmid for positive amplification control (PAC). The synthesis of the PAC plasmid was completed by Sangon Biotech Co., Ltd. (Shanghai, China). The purified PAC plasmid was quantitatively determined using a NanoDrop 2000C spectrophotometer (Thermo Fisher Scientific) with a concentration of 34.45 ng/µL. The Avogadro number (6.022 × 10²³ molecules/mole) was used to calculate the copy number, and the formula was as follows: copies/µL = [mass (g) × 6.022 × 10²³(copies/mol)]/[length (bp) × 109 × 650 (g/mol)]. The calculated copy number was 5.8 × 10¹⁰ copies/µL. PAC with copy number concentration was used as a template for detection limit (LOD) studies.

2.7. Amplification Efficiency (AE)

To calculate the amplification efficiency of the qPCR, seven series of dilution levels were prepared using the CaPV artificial positive amplification control (PAC) plasmid as a template, including 5.8 × 10⁶, 5.8 × 10⁵, 5.8 × 10⁴, 5.8 × 10³, 5.8 × 10², 5.8 × 101, 5.8 copies/µL (in copies). Each dilution level was analyzed 6 times and run under the condition of repeatability 4 times; the dilution series needed to be prepared again before each run. Each dilution level was measured 6 times, with 24 data points for each dilution point. The average Ct value obtained at each dilution level was plotted with PAC plasmid concentration, and linear regression analysis was performed using GraphPad Prism [21] (8.4.0, PRISM, Graphpad Software Inc., San Diego, CA, USA). Using the slope of the regression line, the formula AE = 100 (10−1/slope − 1) was used to calculate the qPCR efficiency and was expressed as a percentage. For each target, the slope of the regression curve should be between −3.9 and −2.9, and the corresponding qPCR efficiency should range from 80% to 120%. Meanwhile, the correlation coefficient R2 of the linear curve was an index to measure the linearity of the qPCR reaction. The R2 of each target should be ≥0.98 [30].

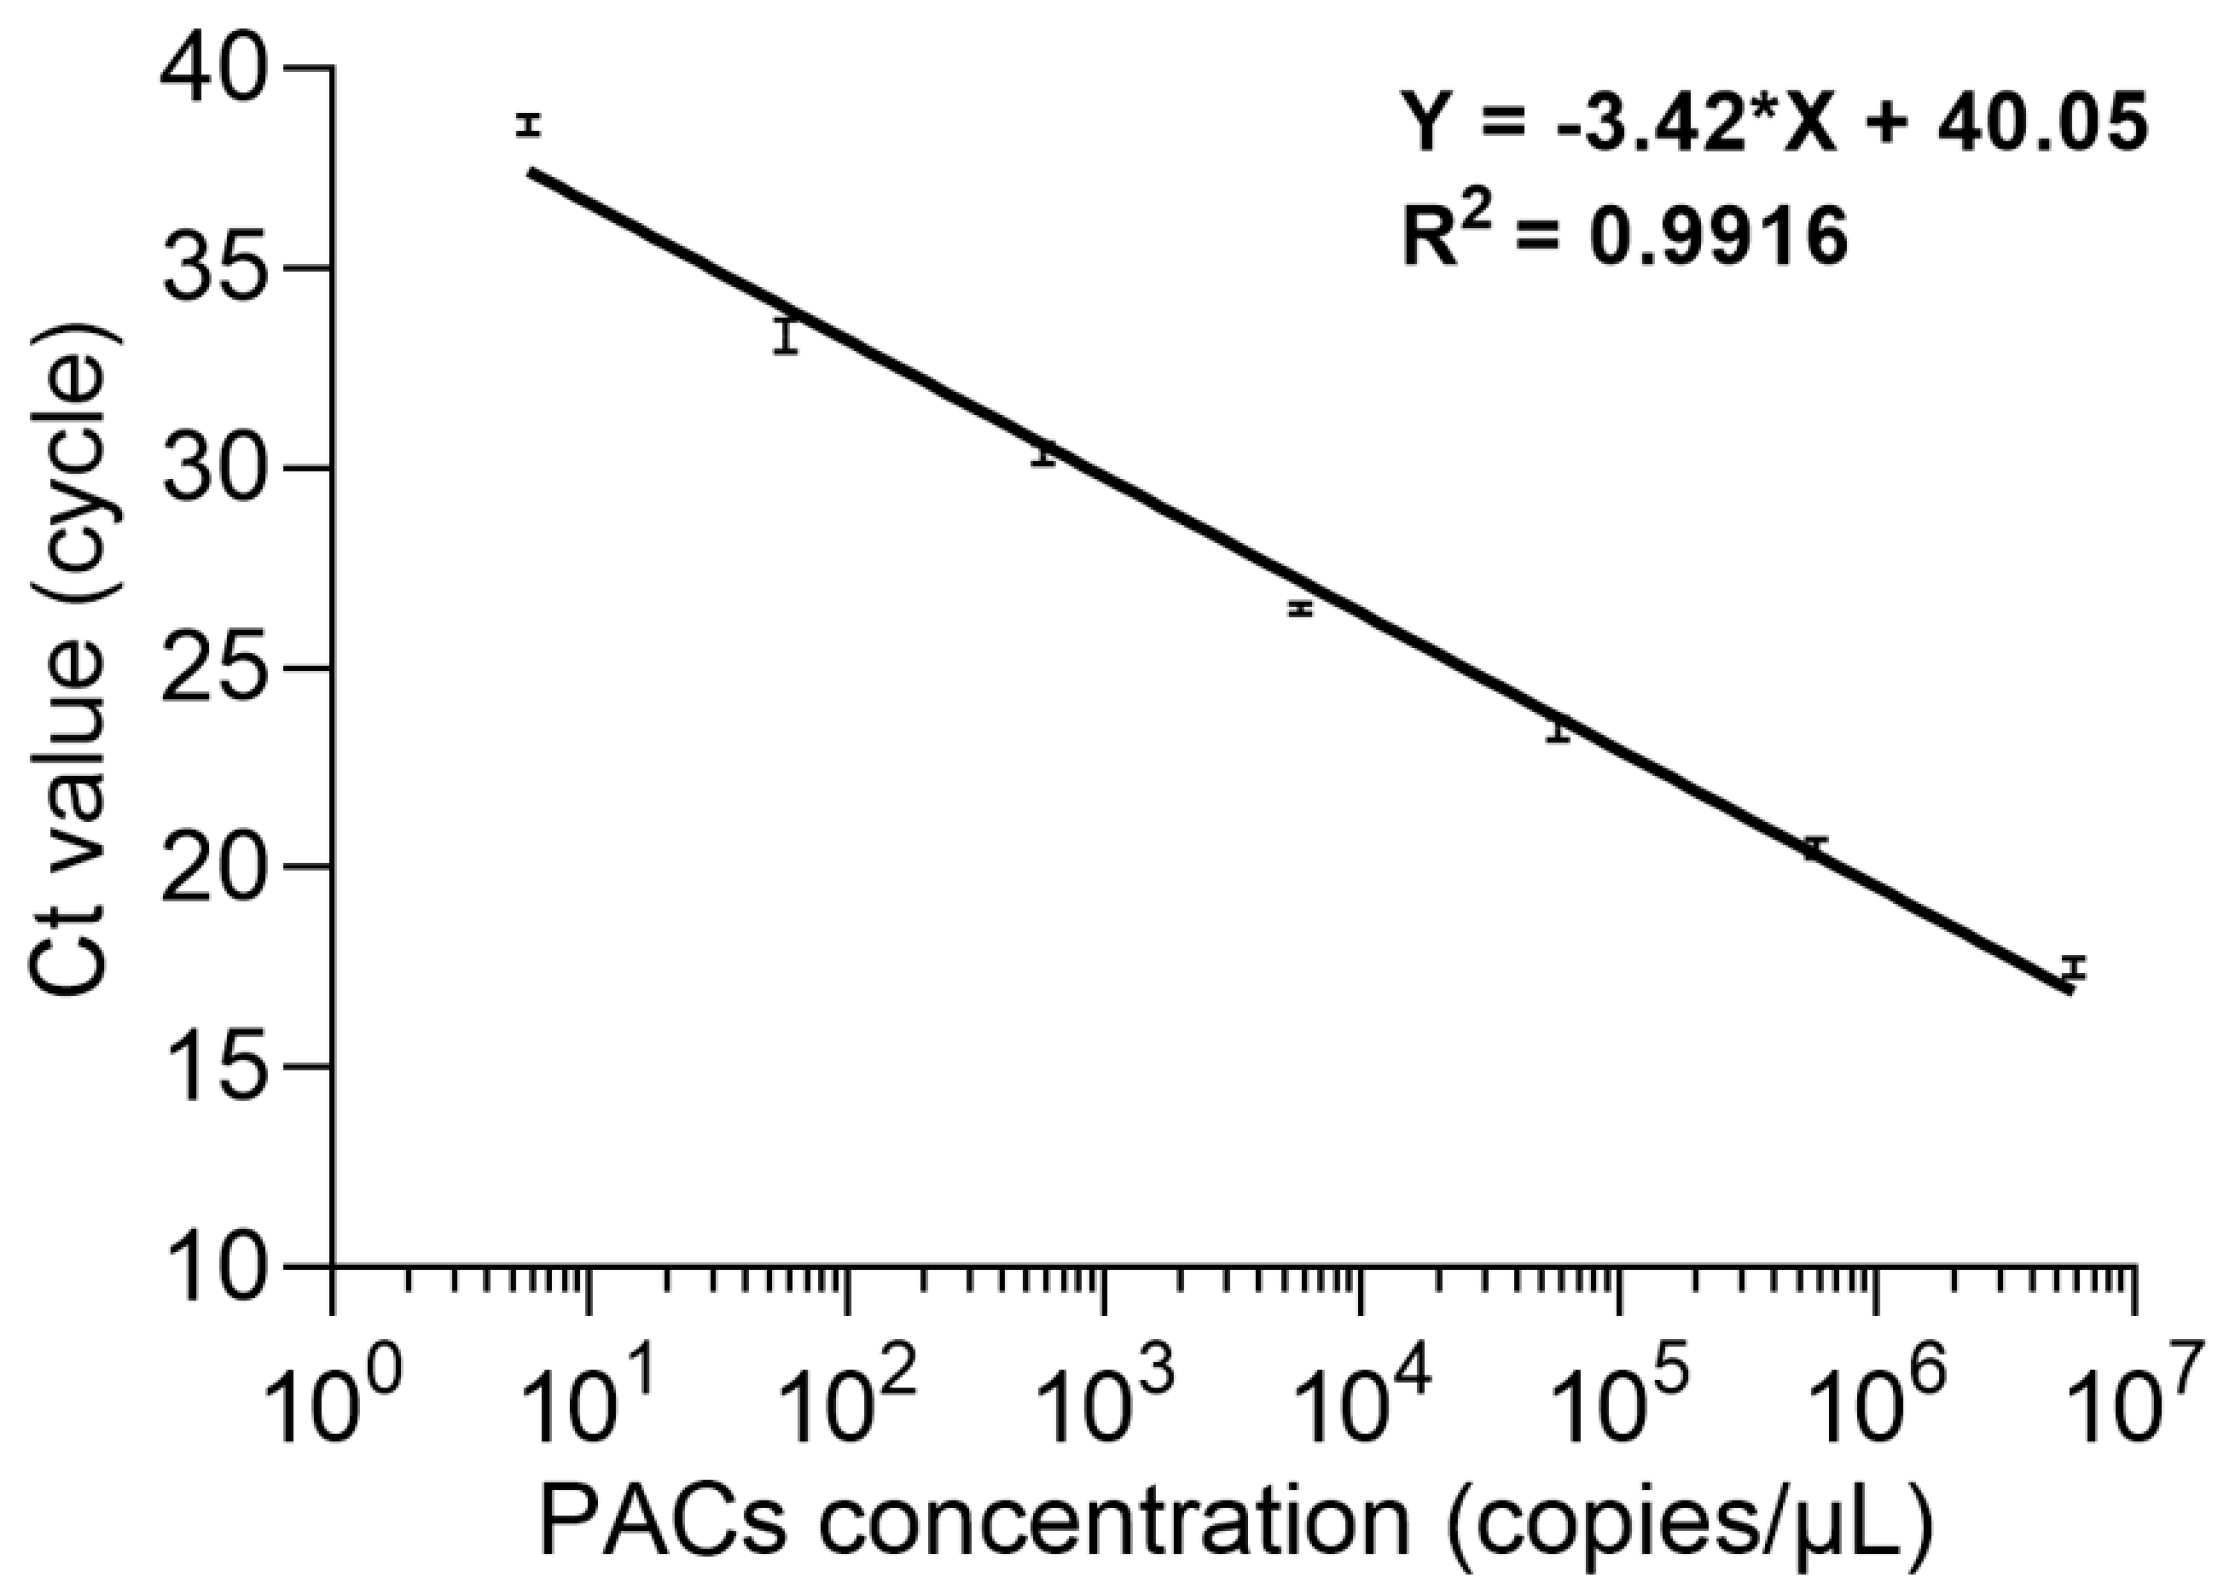
2.8. Analytical Sensitivity

The analytical sensitivity of the qPCR method, which was presented by LOD95%, was determined by the experiment. The statistical significance LOD95% was calculated using semi-logarithmic regression analysis (PRISM, Graphpad Software Inc., San Diego, CA, United States), with inputs of the corresponding number of sample materials, the number of repetitions, and the number of positive results in qPCR detection. In this study, the LOD95% of two types of plasmid PACs (in copies of the genome) and the GPV clinical sample DNA template (in units of DNA concentration (ng/µL) were identified.
To determine the LOD95% of CaPV using a qPCR-assay-based TaqMan probe, 8 series of dilution levels were prepared, including 5.8 × 10⁴, 5.8 × 10³, 5.8 × 10², 5.8 × 101, 5.8, 2.9, 0.58, 0.058 copies/µL, and the test was repeated at each dilution level not less than 8 times. The minimum number of copies per analysis was determined. In addition, the GPV clinical sample DNA was continuously diluted using healthy animal tissue DNA to prepare 9 series dilution levels as the template, including stock solution (10 ng/µL), 101 × dilution (1 ng/µL), 102 × dilution (10−1 ng/µL), 103 × dilution (10−2 ng/µL), 104 × dilution (10−3 ng/µL), 105 × dilution (10−4 ng/µL), 106 × dilution (10−5 ng/µL), 107 × dilution (10−6 ng/µL), and 108 × dilution (10−7 ng/µL). There were at least eight replicates per concentration. The maximum dilutive level for each clinical sample tested was determined.

2.9. Specificity and Cross-Reactivity Test

The specificity and cross-reactivity of the CaPV test assay were evaluated using qPCR. Undiluted sample material DNA/RNA was obtained using 9 closely related viruses and bacteria, including clinical samples or culture materials of differential viruses and bacteria of goat pox virus, sheep pox virus, lumpy skin disease virus, foot-and-mouth disease virus, peste des petits ruminants disease virus, bovine viral diarrhea virus, Brucella, Mycobacterium tuberculosis, and Bacillus anthracis, were tested using a CaPV exclusion assay based on the P32 gene. DNA/RNA analysis was repeated no less than 3 times for each sample material.

2.10. Diagnostic Sensitivity (DSe) and Diagnostic Specificity (DSp) Analysis

The diagnostic sensitivity (DSe) and specificity (DSp) of the qPCR assay were evaluated using clinical samples from naturally CaPV-infected animals (goats, sheep, cattle) and healthy animals. The diagnostic performance was compared with the SYBR Green qPCR method recommended by the WOAH [22], and the diagnostic performance of the qPCR analytical method developed in this study in clinical samples was discussed. By calculating the kappa value, the consistency of the validation of clinical samples was analyzed. Eighty-five clinical samples taken from CaPV-infected animals (goats, sheep, cattle) were used, including 20 skin tissue samples, 46 whole blood samples, and 19 lymph node samples. A total of 50 clinical samples were taken from healthy animals (goats, sheep, cattle), including 9 skin tissue samples, 33 whole blood samples, and 8 lymph node samples. Probabilistic regression analysis was performed using MedCalc Software bvba (Ostend, Belgium) [31] to calculate the degree of consistency of this test against clinical samples at the 95% probability level.

3. Results

3.1. Development of the Specific qPCR Method for CaPV

We selected the P32 gene of CaPV as the target developed using the real-time qPCR method for CaPV detection. Three member isolates of CaPV (including GPV, SPV, and LSDV) with thirty-nine representative entry numbers were selected (Table 2) to analyze the P32 gene homology of these isolates. For the P32 gene sequence, MEGA 4.0 was used to conduct the homology alignment of the primer and probe sequences (Figure 1). The sheep pox virus (CaPV) specific primer-probe designed in this study basically matched the sheep pox virus (CaPV) gene sequence of 39 entry numbers and could simultaneously detect the three serotypes of CaPV, including GPV, SPV, and LSDV. In addition, six closely related and different viruses and bacteria (including foot-and-mouth disease virus, peste des petits ruminants virus, bovine viral diarrhea virus, Brucella, Mycobacterium tuberculosis, and Bacillus anthracis) were retrieved in NCBI, and gene sequences were compared using MEGA 4.0. The sequences of the forward primers, TaqMan probes, and reverse primers of CaPV basically did not match those of different viruses and bacteria. Theoretically, CaPV can be specifically detected, and other closely related different viruses and bacteria can be excluded (Figure 1).

3.2. Amplification Efficiency (AE)

To evaluate the qPCR efficiency of this method, seven series of dilution levels were prepared using the CaPV artificial positive amplification control (PAC) plasmid as a template, including 5.8 × 10⁶, 5.8 × 10⁵, 5.8 × 10⁴, 5.8 × 10³, 5.8 × 10², 5.8 × 101, and 5.8 copies/µL, and they were analyzed using TaqMan probe qPCR. A linear regression curve was plotted between the threshold cycle value (Ct value) and PAC plasmid concentration (in copy number). According to the equation E = 100 (10−1/slope − 1), the analysis efficiency was determined as the slope of the regression line, showing a good linear relationship between the Ct value and PAC plasmid concentration (Figure 2). The correlation coefficient R2 of the real-time qPCR method for CaPV detection was 0.9916, the slope of the regression curve was −3.42, and the efficiency was 96.06%. These results meet the requirements specified in the general qPCR validation guidelines, i.e., correlation coefficient R2 ≥ 0.98, regression curve slope from −3.9 to −2.9, and efficiency of 80–120%.

3.3. Analytical Sensitivity Using PACs as a Template

The LOD95% of PACs were expressed as the copy number per analysis, where each copy represents one genome copy of the virus particle. Eight series of dilution levels were prepared using the CaPV artificial positive amplification control (PAC) plasmid as a template, including 5.8 × 10⁴, 5.8 × 10³, 5.8 × 10², 5.8 × 101, 5.8, 2.9, 0.58, and 0.058 copies/µL (eight replicates for per concentration), to evaluate the LOD95% of CaPV using a real-time qPCR assay. The expansion of PACs was linear. The results of probabilistic regression analysis showed that the LOD95% of CaPV using the qPCR assay was 3.80 copies/response, with a 95% confidence interval of 1.88–38.19 copies/response (Figure 3a).

3.4. Analytical Sensitivity Using Clinical Sample DNA as a Template

Using clinical sample DNA as a template, the LOD95% was expressed as the highest dilutive level for each test. Using the 10 × dilution GPV DNA samples of healthy goat skin tissue samples as the template, we prepared 10 series of dilution levels, including stock solution (10 ng/µL), 101 × dilution (1 ng/µL), 102 × dilution (10−1 ng/µL), 103 × dilution (10−2 ng/µL), 104 × dilution (10−3 ng/µL), 105 × dilution (10−4 ng/µL), 106 × dilution (10−5 ng/µL), 107 × dilution (10−6 ng/µL), 108 × dilution (10−7 ng/µL), and 109 × dilution (10−8 ng/µL), as templates (eight replicates per concentration) to evaluate the LOD95% of CaPV using the qPCR assay—the amplification using the clinical sample DNA as the template was linear. The results of the probabilistic regression analysis show that the LOD95% of CaPV determined using the qPCR assay was 4.91 × 10⁻⁵ ng/µL (i.e., the highest dilution level of each test was the 106 × dilution level). The 95% confidence interval was 1.60 × 10⁻⁵–2.13 × 10⁻³ ng (Figure 3b).

3.5. Specificity and Cross-Reactivity

To determine the specificity of the method, clinical samples of infection from three members of CaPV (GPV, SPV, and LSDV) and samples from six non-targeted, undifferentiated viruses and bacteria (including foot-and-mouth disease virus, peste des petits ruminants disease virus, bovine viral diarrhea virus, Brucella, Mycobacterium tuberculosis, and Bacillus anthracis) were used. The specificity of the real-time qPCR assay for CaPV was evaluated (Table 4 and Figure 4). Exclusion test results based on real-time qPCR showed that the specificity for three members of CaPV (GPV, SPV, and LSDV) was 100%, and there was no cross-reaction against six different non-targeted viruses and bacteria. These results confirmed the accuracy and specificity of the detection method.

3.6. Diagnostic Sensitivity (DSe) and Diagnostic Specificity (DSp) of Clinical Validation

The diagnostic sensitivity (DSe) and diagnostic specificity (DSp) of the real-time qPCR method for the diagnosis of CaPV were calculated using probability regression analysis. Samples from 85 CaPV-infected animals (goats, sheep, and cattle) and 50 healthy animals (goats, sheep, and cattle) were used for clinical verification. These clinical samples were confirmed using the SYBR Green qPCR method recommended by the WOAH.
Using the real-time qPCR method and the SYBR Green qPCR method recommended by the WOAH, 26 GPV-infected goats (with samples including six skin tissues, fourteen whole blood, and six lymph nodes), 29 SPV-infected sheep (with samples including six skin tissues, sixteen whole blood, and seven lymph nodes) and 30 LSDV-infected cattle (with samples including eight skin tissues, sixteen whole blood and six lymph nodes) were clinically validated, and all tests were positive (Table 5). We have arranged and summarized the Ct values of these CaPV-infected samples from small to large based on qPCR-based detection in Table 5. By comparing the Ct values, it was found that the qPCR Ct values of the 26 GPV-infected goats ranged from 15.36 ± 0.16 to 27.41 ± 0.09, and the qPCR Ct values of SYBR Green ranged from 14.29 ± 0.09 to 27.65 ± 0.04 (Figure 5A). The Ct values of 29 SPV-infected sheep ranged from 13.34 ± 0.00 to 28.36 ± 0.01 and 10.18 ± 0.09 to 22.69 ± 0.06 (Figure 5B). The Ct values of 30 LSDV-infected cattle ranged from 12.44 ± 0.14 to 27.34 ± 0.04 and 10.07 ± 0.07 to 32.69 ± 0.06 (Figure 5C). These two methods showed a good correlation of the Ct values. It was observed that the real-time qPCR method showed better detection sensitivity from a sample of mildly infected CaPV (LG30), and we need to collect more samples of mildly infected CaPV to confirm this finding.
In total, 50 samples of healthy animal materials (including 16 healthy goats, 15 healthy sheep, and 19 healthy cattle) were clinically verified, and all tests were negative (Table 5). At the same time, the SYBR Green PCR method recommended by the WOAH was used to compare the specificity and accuracy of the methods. The diagnostic sensitivity (DSe) and specificity (DSp) of the real-time qPCR method for CaPV clinical samples were 100% (95.8~100%, 95% CI) and 100% (92.9~100%, 95% CI), respectively. Kappa values were 1.0 (1-1, 95% CI) (Table 6).

4. Discussion

In this study, a real-time qPCR assay was developed to detect GPV, SPV, and LSDV simultaneously and to exclude multiple other pathogens from samples containing multiple pathogens.
At the beginning of development, we considered the coverage of CaPV isolates worldwide in terms of sequence retrieval and the design of primer probes. Since the P32 protein of CaPV has high sequence homology among GPV, SPV, and LSDV, it is a common structural protein with high specificity and strong immunogenicity in CaPV isolates [32,33]. Therefore, 155 accession numbers of the CaPV P32 protein gene were searched inNCBI, and 39 representative isolates of three CaPV members (GPV, SPV, LSDV) were selected from them, including different isolation times, different isolation sites, and different hosts to analyze the homology of the P32 protein gene for designing primers and probes. In addition, we also investigated the amplification efficiency of the qPCR method, which was 96.06%. Others also reported the development of detection methods for three CaPV members [10,34,35]. These methods were not used to analyze the isolation time, location, and host conditions of CaPV isolates at the time of development and were used to investigate the amplification efficiency. Ruminants and their products are circulated worldwide, which increases the risk of the CaP spreading across borders. It is beneficial to ensure the accuracy of CaPV detection to develop the qPCR method and evaluate the amplification efficiency based on sufficient isolation time, isolation location, and the analysis of CaPV isolates in the host.
In terms of sensitivity (LOD), this study used continuous diluents of DNA from clinical samples of CaPV and plasmid PACs as templates to investigate the LOD95% of two types, respectively. Probabilistic regression analysis shows that for the assay of qPCR, the LOD95% was 3.80 copies per response (1.88–38.19 copies per response, 95% CI), 4.91 × 10⁻⁵ ng per response (1.60 × 10⁻⁵–2.13 × 10⁻³ ng, 95% CI). The maximum dilution level of DNA detected in clinical samples was a 106 × dilution level. Others also reported that the LOD of the CaPV detection method reached 10 copies [22,32,35]. The highest dilution level of the DNA template in clinical samples was examined, and it was more similar to the situation of mild CaPV infection in animals.
The CaPV exclusion test showed 100% specificity for all serotypes/thesolates of the target viruses tested (GPV, SPV, and LSDV) and did not cross-react with clinical samples or culture materials of other viruses and bacteria. The dSe evaluation of 135 clinical samples showed 100% (95.8% to 100%, 95% CI) dSe and 100% (92.9% to 100%, 95% CI) dSe and DSp compared to the SYBR Green PCR recommended by the WOAH. The Kappa value of 1.0 (1-1, 95% CI) indicated that the two methods are comparable.
Capripox (CaP) is a major infectious disease affecting the healthy development of the ruminant breeding industry in China [11]. Currently, there is no effective drug treatment, and comprehensive prevention and control measures such as vaccine immunization, pathogen and antibody monitoring, and population purification are the main responses. According to the standard of the WOAH Manual of Diagnostic Tests and Vaccines for Terrestrial Animals, Chapter 3.8.12, on the diagnostic methods of Capripox [29], these include virus isolation, electron microscope examination, inclusion body examination, neutralization tests, PCR method, etc. These methods have complex operations, long test cycles, and low sensitivity. The real-time qPCR method developed in this study can be a good supplement for the early detection of CaP disease in ruminants.

5. Conclusions

The study describes a real-time quantitative PCR method based on a TaqMan probe for identifying CaPV in goats, sheep, and cattle and its validation in clinical samples. The amplification efficiency (E) of the method was 96.06%. The LOD95% of serial dilutions of DNA from plasmid PACs and CaPV clinical samples were 3.80 copies per reaction (1.88–38.19 copies per reaction, 95% CI) and 4.91 × 10⁻⁵ ng per reaction (1.60 × 10⁻⁵–2.13 × 10⁻³ ng, 95% CI). The highest dilution level for detecting DNA in clinical samples was the 106 × dilution level. Non-targeted differential viruses and bacteria were not detected using this method. Compared with the SYBR Green PCR recommended by the WOAH, the diagnostic sensitivity and specificity were both 100% (95.8–100%, 95%CI; 92.9–100%, 95%CI). The κ value was 1.0 (1-1, 95% CI).
In summary, the established qPCR method is highly sensitive, specific, and reproducible and can be used as an effective tool for detecting CaP disease in ruminants early.

Author Contributions

Conceptualization, J.W. and X.Y.; Methodology and Software, X.Z., D.L. and J.L.; Validation, X.Y., J.W. and X.Z.; Formal Analysis, J.C. and Y.S.; Resources and Data Curation, Y.S. and X.S.; Writing—Original Draft Preparation, J.W. and X.Y.; Writing—Review and Editing, J.C.; Supervision, Y.S.; Project Administration and Funding Acquisition, J.C. and X.S. All authors have read and agreed to the published version of the manuscript.

Funding

This research was funded by Dalian high-level Talents Innovation Support Plan, Dalian, China (Grant No. 2019CT09), and the National Mutton Sheep Industry Technology System—Common Diseases Research and Diagnosis and Treatment, Beijing, China (Grant No. CARS39).

Data Availability Statement

All datasets generated for this study are included in the article.

Acknowledgments

All claims expressed in this article are solely those of the authors and should not be interpreted as representing any decision or policy of the Ministry of Agriculture of the People’s Republic of China or the State Council of the People’s Republic of China.

Conflicts of Interest

The authors declare no conflict of interest.

Abbreviation

Capripox/Capripox viruses/CapripoxvirusCaP/CaPVs/CaPV
Sheep pox/Sheep pox virusSPP/SPV
Goatpox/Goatpox virusGTP/GPV
Lumpy skin disease/Lumpy skin disease virusLSD/LSDV
World Organization of Animal HealthWOAH
National Center for Biotechnology InformationNCBI
Foot-and-mouth disease virusFMDV
Peste des petits ruminants virusPPRV
Bovine viral diarrhea virus/diarrhea virusBVDV
Real-time quantitative polymerase chain reactionqPCR
6-carboxyfluorescein6-FAM
Black Hole Quencher 1BHQ1
Confidence intervalCI
Diagnostic sensitivity DSe
Diagnostic specificity DSp
Synergy BrandsSYBR
Limit of detectionLOD
Kappa value κ
Amplification efficiency E
Linear regression curve R2

References

  1. Tuppurainen, E.S.M.; Venter, E.H.; Shisler, J.L.; Gari, G.; Mekonnen, G.A.; Juleff, N.; Lyons, N.A.; De Clercq, K.; Upton, C.; Bowden, T.R.; et al. Review: Capripoxvirus Diseases: Current Status and Opportunities for Control. Transbound. Emerg. Dis. 2015, 64, 729–745. [Google Scholar] [CrossRef] [PubMed]
  2. Lafar, S.; Zro, K.; Ennaji, M.M. Chapter 28—Capripoxvirus Diseases: Current Updates and Developed Strategies for Control, in Emerging and Reemerging Viral Pathogens; Ennaji, M.M., Ed.; Academic Press: Cambridge, MA, USA, 2020; pp. 635–655. [Google Scholar]
  3. Azeem, S.; Sharma, B.; Shabir, S.; Akbar, H.; Venter, E. Lumpy skin disease is expanding its geographic range: A challenge for Asian livestock management and food security. Vet. J. 2022, 279, 105785. [Google Scholar] [CrossRef] [PubMed]
  4. Wang, Y. Analysis of vaccine-like lumpy skin disease virus from flies near the western border of China. Transbound. Emerg. Dis. 2021, 2021, 1813–1823. [Google Scholar] [CrossRef] [PubMed]
  5. Ministry of Agriculture and Rural Affairs of People’s Republic of China. Issues 1–12. Official Veterinary Bulletin; Ministry of Agriculture and Rural Affairs of People’s Republic of China: Beijing, China, 2020.
  6. Gu, S.-P.; Shi, X.-T.; Liu, X.-G.; Wang, Z.-B.; Zheng, M.-X.; Li, Y.; Huo, N.-R.; Tang, F.; Bai, R.; Shi, Z.-Y.; et al. Identification and phylogenetic analysis of the sheep pox virus Shanxi isolate. Biomed. Res. 2018, 29. [Google Scholar] [CrossRef]
  7. OIE. Manual of Diagnostic Tests and Vaccines for Terrestrial Animals 2019: Chapter 3.7.12. Sheeppox and Goatpox [EB/OL]; OIE: Paris, France, 2018.
  8. Babiuk, S.; Bowden, T.R.; Boyle, D.B.; Wallace, D.B.; Kitching, R.P. Capripoxviruses: An Emerging Worldwide Threat to Sheep, Goats and Cattle. Transbound. Emerg. Dis. 2008, 55, 263–272. [Google Scholar] [CrossRef]
  9. Sprygin, A.; Pestova, Y.; Wallace, D.B.; Tuppurainen, E.; Kononov, A.V. Transmission of Lumpy Skin Disease Virus: A Short Review. Virus Res. 2019, 269, 197637. [Google Scholar] [CrossRef]
  10. Nie, F.P. Establishment of a multiplex TaqMan MGB fluorescent quantitative PCR method for detection of Capripox virus. Chin. J. Prev. Vet. Med. 2018, 40, 1031–1036. [Google Scholar]
  11. Fan, H.J. Epidemic characteristics and prevention of goat pox. Vet. Clin. Sci. 2020, 23, 80–81. [Google Scholar]
  12. Meng, G. Clinical diagnosis and control measures of sheep pox. Vet. Clin. Diagn. 2021, 1, 120. [Google Scholar]
  13. Tuppurainen, E. Review: Lumpy Skin Disease: An Emerging Threat to Europe, the Middle East and Asia. Transbound. Emerg. Dis. 2012, 59, 40–48. [Google Scholar] [CrossRef]
  14. Tuppurainen, E.S.M. Lumpy Skin Disease Field Manual: A Manual for Veterinarians; FAO Animal Production and Health Manual No.20; FAO: Rome, Italy, 2017. [Google Scholar]
  15. WOAH. Manual of Diagnostic Tests and Vaccines for Terrestrial Animals 2023: Chapter3.4.12 Lumpy Skin Disease [EB/OL]; WOAH: Paris, France, 2023.
  16. Zewdie, G. Isolation, Molecular Characterisation and Vaccine Effectiveness Study of Lumpy Skin Disease Virus in Selected Diary Farms of Central Ethiopia. J. Biol. Agric. Healthc. 2019, 9, 764–775. [Google Scholar]
  17. Parma. Scientific Opinion on lumpy skin disease. EFSA J. 2015, 13, 3986. [Google Scholar] [CrossRef]
  18. Tuppurainen, E. The detection of lumpy skin disease virus in samples of experimentally infected cattle using different diagnostic techniques. Onderstepoort J. Vet. Res. 2005, 72, 153–164. [Google Scholar] [CrossRef]
  19. Ochwo, S. Molecular detection and phylogenetic analysis of lumpy skin disease virus from outbreaks in Uganda 2017–2018. BMC Vet. Res. 2020, 16, 66. [Google Scholar] [CrossRef] [PubMed]
  20. Jiang, C.-W.; Tao, D.-G.; Geng, Y.-C.; Yang, H.; Xu, B.-R.; Chen, Y.-Y.; Hu, C.-M.; Chen, H.-C.; Xie, S.-S.; Guo, A.-Z. Sensitive and Specific Detection of Lumpy Skin Disease Virus in Cattle by CRISPR-Cas12a Fluorescent Assay Coupled with Recombinase Polymerase Amplification. Genes 2022, 13, 734. [Google Scholar] [CrossRef] [PubMed]
  21. Suwankitwat, N.; Songkasupa, T.; Boonpornprasert, P.; Sripipattanakul, P.; Theerawatanasirikul, S.; Deemagarn, T.; Suwannaboon, M.; Arjkumpa, O.; Buamithup, N.; Hongsawat, A.; et al. Rapid Spread and Genetic Characterisation of a Recently Emerged Recombinant Lumpy Skin Disease Virus in Thailand. Vet. Sci. 2022, 9, 542. [Google Scholar] [CrossRef] [PubMed]
  22. Haegeman. Overview of Diagnostic Tools for Capripoxvirus Infections. Prev. Vet. Med. 2020, 181, 104704. [Google Scholar] [CrossRef] [PubMed]
  23. Li, J.M. Technical specification for prevention and treatment of bovine nodular dermatosis. Vet. Orientat. 2020, 11, 4–5. [Google Scholar]
  24. Balinsky, C.A.; Delhon, G.; Smoliga, G.; Prarat, M.; French, R.A.; Geary, S.J.; Rock, D.L.; Rodriguez, L.L. Rapid preclinical detection of sheeppox virus by a real-time PCR assay. J. Clin. Microbiol. 2008, 46, 438–442. [Google Scholar] [CrossRef]
  25. Ma, W.M. Cloning and sequence analysis of P32 gene of goat pox virus. J. Gansu Agric. Univ. 2006, 41, 27–30. [Google Scholar]
  26. Kumar, S. MEGA7: Molecular Evolutionary Genetics Analysis version 7.0 for bigger datasets. MBE Adv. Access 2016, 33, 1870–1874. [Google Scholar] [CrossRef] [PubMed]
  27. Singh, A.; Pandey, G.K. Primer Design Using Primer Express ® for SYBR Green- Based Quantitative PCR. Methods Mol. Biol. 2015, 1275, 153–164. [Google Scholar] [PubMed]
  28. Kibbe, W.A. OligoCalc: An online oligonucleotide properties calculator. Nucleic Acids Res. 2007, 35, 43–46. [Google Scholar] [CrossRef] [PubMed]
  29. OIE. Manual of Diagnostic Tests and Vaccines for Terrestrial Animals 2018: Chapter 3.8.12. Sheeppox and Goatpox [EB/OL]; OIE: Paris, France, 2018.
  30. Saussoy, P.; Vaerman, J.L.; Straetmans, N.; Deneys, V.; Cornu, G.; Ferrant, A.; Latinne, D. Differentiation of acute myeloid leukemia from B- and T-lineage acute lymphoid leukemias by real-time quantitative reverse transcription-PCR of lineage marker mRNAs. Clin. Chem. 2004, 50, 1165–1173. [Google Scholar] [CrossRef]
  31. Schoonjans, F. Medale: A new computer program for medical statistics. Comput. Methods Programs Biomed. 1995, 48, 257–262. [Google Scholar] [CrossRef]
  32. Gelaye, E.; Lamien, C.E.; Silber, R.; Tuppurainen, E.S.M.; Grabherr, R.; Diallo, A. Development of a cost-effective method for capripoxvirus genotyping using snapback primer and dsDNA intercalating dye. PLoS ONE 2013, 8, e75971. [Google Scholar] [CrossRef]
  33. Picasso-Risso, C.; Grau, A.; Bakker, D.; Nacar, J.; Mínguez, O.; Perez, A.; Alvarez, J. Association between results of diagnostic tests for bovine tuberculosis and Johne’s disease in cattle. Vet. Rec. 2019, 185, 1136. [Google Scholar] [CrossRef]
  34. Nan, W.-L.; Gong, M.-X.; Lu, Y.; Li, J.-M.; Wang, Y.-J.; Ha, D.; Wu, F.-X.; Li, L.; Wang, Y.-L.; Chen, Y.-P.; et al. Development of a Cycleave PCR for Detecting Capripoxvirus. China Anim. Health Insp. 2022, 39, 107–111. [Google Scholar]
  35. Bowden, T.R.; Babiuk, S.L.; Parkyn, G.R.; Copps, J.S.; Boyle, D.B. Capripoxvirus tissue tropism and shedding: A quantitative study in experimentally infected sheep and goats. Virology 2008, 371, 380–393. [Google Scholar] [CrossRef]
Figure 1. A sequence of P32 gene regions of different species developed for CaPV-specific qPCR analysis. The positions of forward primers, reverse primers, and probes are indicated by blue, green, and red boxes, respectively.
Microorganisms 11 02476 g001
Figure 2. Standard curves of the PCAs analyses of seven dilution levels for the real-time qPCR for CaPV. E = 96.06%; slope = −3.42; and R2 = 0.9916.
Microorganisms 11 02476 g002
Figure 3. Sensitivity analysis results. (a) The LOD95% of sensitivity for PACs as a template. Probit regression analysis using MedCalc software was performed on data from 8 replicates from serial dilutions using the qPCR for CaPV; (b) the LOD95% of sensitivity for clinical sample DNA as a template. Probit regression analysis using MedCalc software was performed on data from 8 replicates from ten serial dilutions using the qPCR for CaPV.
Microorganisms 11 02476 g003
Figure 4. Specificity and cross-reactivity of the TaqMan probe qPCR assay.
Microorganisms 11 02476 g004
Figure 5. Real-time qPCR and SYBR Green qPCR were used to verify 85 CaPV-infected animals. Samples from 26 GPV-infected goats (A), 29 SPV-infected sheep (B), and 30 LSDV-infected cattle (C).
Microorganisms 11 02476 g005
Table 1. List of clinical samples used for method development specificity analysis and their sources.
Viruses, Bacteria, and SpecimensGenotypeSample Infection TypeIsolation Times/LocationsNumber of Specimens
CapripoxvirusGPVClinical samples of goat infection (natural hosts)2023/Xinjiang2023/3/CaPV-G
SPVClinical samples of sheep infection (natural hosts)2023/Xinjiang2023/3/CaPV-S
LSDVClinical samples of cattle infection (natural hosts)2023/Xinjiang2023/3/CaPV-L
Foot-and-mouth disease virus Clinical samples of cattle infection (natural hosts)2023/Xilingol League, Inner Mongolia2023/3/FMDV
Peste des petits ruminants virus Inactivated vaccine
(natural hosts)
2023/Purchase from HUAPAI BIOLOGICAL GROUP2023/3/PPRV
Bovine viral diarrhea virus Clinical samples of cattle infection (natural hosts)2023/Baragaer Gol township, Xiwuqi, 2023/3/BVDV
Brucella Inactivated vaccine
(natural hosts)
2023/Purchase from AOLONG BIOLOGICAL GROUP2023/3/Bru
Mycobacterium tuberculosis Clinical samples of cattle infection (natural hosts)2023/Xilingol League, Inner Mongolia2023/3/M.tube
Bacillus anthracis Inactivated vaccine
(natural hosts)
2023/Purchase from HAYAO BIOLOGICAL GROUP2023/3/Bac.
Table 2. The 39 accession numbers of the P32 gene of Capripox virus (CaPV) used for real-time qPCR assays from NCBI.
SpeciesIsolatesAccession No.Isolation Times/LocationsHost
GPVGorganMK948083.12019/IranGoat
GPVShanX-YAMG458384.12019/ChinaGoat
GPVGPV/ChongQHM572329.12011/ChinaGoat
GPVP32/Menasagere/MandyaMT671191.12021/IndiaGoat
GPVAPET/KPM/TN/16MH545960.12019/IndiaGoat
GPVGPV4/WB/10KU686998.12016/IndiaGoat
GPVGTPV/SA2MG232383.12018/Saudi ArabiaGoat
GPVMaha/goat/19KF468762.12015/IndiaGoat
GPVZl/GsKJ026560.12014/ChinaGoat
GPVDomestic goat/Tawang(AR)MT017655.12020/IndiaDomestic goat
GPVGoral/AR/2018MN967026.12020/IndiaNaemorhedus goral
GPVPuducherry-216/NIVEDIMK805070.12019/IndiaGoat
GPVGTPV12/WB/10KY614170.12018/IndiaGoat
GPVNIVEDI/Kandhnahalli/ChellakereMT513757.12021/IndiaGoat
GPVVNUAGTP1MN317561.12020/VietnamGoat
GPVGPV 28/TN/15KY508697.12017/IndiaGoat
GPVVietnam (Ninh Thuan/2005) IMVEU625263.12008/VietnamGoat
GPVYemen (Sana’a/1983) IMVEU625262.12008/YemenGoat
SPVGanSuHN/12KF661977.12013/ChinaSheep
SPVQinH-HDMG458377.12019/ChinaSheep
SPV36/16MH924593.12018/TunisiaSheep
SPVPune-08FJ882029.12009/IndiaSheep
SPV1517/12MMH924601.12018/TunisiaSheep
SPVRFKJ679574.12016/IndiaSheep
SPVKanakapura-NI/NIVEDI MN639777.12020/IndiaSheep
SPVMaha/sheep/22KF468761.12015/IndiaSheep
SPVLx/GsKJ026555.12014/ChinaSheep
SPVShanxiHM770955.12010/ChinaSheep
SPVJK-221/NIVEDIMK805071.12019/IndiaSheep
SPVSPPV/SA6/2016MG232387.12018/Saudi ArabiaSheep
SPVZabaikalskKC847056.12014/RussiaSheep
SPVAV40HQ607368.12011/ChinaSheep
SPVEnvelope proteinKT964233.12016/TunisiaSheep
LSDVIND/WB/JS10-LTMW452626.12021/IndiaCattle
LSDVRIVER/VMC/LSDV/01/PuducherryMW815879.12022/IndiaCattle
LSDVLSVN/2020LC648887.12021/VietnamBos taurus
LSDVXinjiang/2019MN598005.12020/ChinaCattle
LSDVKM/Taiwan/2020MZ934387.12022/China TaiwanCattle
LSDVKSA6/2017MN422451.12020/Saudi ArabiaCattle
Table 3. Sequence information of primers and probes used for PCR analysis in this study.
VirusesPrimerSequence (5′–3′)Genbank No.PositionSize (bp)Reference
CapripoxvirusFw1ATGGCAGATATC(t)CCATTAMG458377.11–18209This work
Rev1CTACCTTTTCCCATATA(c)AGT(c)AAC187–209
ProbeFAM-TCGCGAAATTTCAGATGTAGTTCCA-BHQ148–73
CapripoxvirusFw3TGGGAAAAGGTAGAAAAATCAGGAGGMG458377.1197–221141[29]
Rev3ATCCGCATCGGCATACGATT318–337
Table 4. Specificity analysis results from the TaqMan probe qPCR assay.
Virus and bacteriaSample TypeAverage Ct Value
GPVClinical samples of goat infection22.71 ± 0.38
SPVClinical samples of sheep infection22.99 ± 0.47
LSDVClinical samples of cattle infection22.61 ± 0.24
Foot-and-mouth disease virusClinical samples of cattle infectionNegative
Peste des petits ruminants virusInactivated vaccineNegative
Bovine viral diarrhea virusClinical samples of cattle infectionNegative
BrucellaInactivated vaccineNegative
Mycobacterium tuberculosisClinical samples of cattle infectionNegative
Bacillus anthracisInactivated vaccineNegative
Table 5. Validation of 135 clinical samples using real-time PCR and SYBR-Green-based PCR.
SamplesTypeTaqMan Probe qPCRWOAH SYBR Green PCR
Ct ValueCt Value
GG1GPV skin tissue17.39 ± 0.0615.18 ± 0.09
GG2GPV skin tissue20.44 ± 0.1317.43 ± 0.11
GG3GPV skin tissue22.14 ± 0.1322.69 ± 0.06
GG4GPV skin tissue22.25 ± 0.0220.45 ± 0.16
GG5GPV skin tissue24.28 ± 0.0616.66 ± 0.28
GG6GPV skin tissue27.41 ± 0.0916.29 ± 0.08
GG7GPV whole blood15.36 ± 0.1614.56 ± 0.04
GG8GPV whole blood15.50 ± 0.0714.65 ± 0.41
GG9GPV whole blood15.52 ± 0.1815.36 ± 0.16
GG10GPV whole blood15.63 ± 0.0814.44 ± 0.25
GG11GPV whole blood16.17 ± 0.0715.52 ± 0.06
GG12GPV whole blood16.57 ± 0.1714.29 ± 0.09
GG13GPV whole blood17.65 ± 0.0115.07 ± 0.07
GG14GPV whole blood17.74 ± 0.0115.54 ± 0.15
GG15GPV whole blood18.71 ± 0.0517.33 ± 0.14
GG16GPV whole blood19.46 ± 0.0218.83 ± 0.14
GG17GPV whole blood21.29 ± 0.0626.25 ± 0.01
GG18GPV whole blood23.68 ± 0.0122.21 ± 0.06
GG19GPV whole blood24.24 ± 0.0122.40 ± 0.07
GG20GPV whole blood26.45 ± 0.1427.65 ± 0.04
GG21GPV lymph node16.50 ± 0.1017.17 ± 0.06
GG22GPV lymph node17.71 ± 0.0918.22 ± 0.04
GG23GPV lymph node18.60 ± 0.2315.81 ± 0.14
GG24GPV lymph node20.44 ± 0.1321.43 ± 0.11
GG25GPV lymph node22.24 ± 0.0120.45 ± 0.16
GG26GPV lymph node27.40 ± 0.0826.29 ± 0.08
SG1SPV skin tissue13.34 ± 0.0011.43 ± 0.14
SG2SPV skin tissue15.46 ± 0.0111.29 ± 0.08
SG3SPV skin tissue15.75 ± 0.1112.68 ± 0.20
SG4SPV skin tissue17.38 ± 0.0510.18 ± 0.09
SG5SPV skin tissue23.29 ± 0.0516.66 ± 0.28
SG6SPV skin tissue27.45 ± 0.1320.58 ± 0.21
SG7SPV whole blood15.73 ± 0.1111.36 ± 0.16
SG8SPV whole blood15.85 ± 0.1613.54 ± 0.15
SG9SPV whole blood16.12 ± 0.0012.52 ± 0.06
SG10SPV whole blood16.51 ± 0.0813.65 ± 0.41
SG11SPV whole blood17.58 ± 0.1815.84 ± 0.14
SG22SPV whole blood17.67 ± 0.0415.07 ± 0.07
SG13SPV whole blood18.17 ± 0.0815.60 ± 0.06
SG14SPV whole blood18.71 ± 0.0616.33 ± 0.14
SG15SPV whole blood18.79 ± 0.1315.29 ± 0.09
SG16SPV whole blood19.45 ± 0.0417.83 ± 0.14
SG17SPV whole blood21.24 ± 0.0117.72 ± 0.21
SG18SPV whole blood21.55 ± 0.1319.72 ± 0.10
SG19SPV whole blood23.39 ± 0.2222.69 ± 0.06
SG20SPV whole blood23.49 ± 0.2320.56 ± 0.05
SG21SPV whole blood25.82 ± 0.2119.21 ± 0.06
SG22SPV whole blood28.36 ± 0.0121.39 ± 0.09
SG23SPV lymph node13.60 ± 0.0411.44 ± 0.25
SG24SPV lymph node17.35 ± 0.1515.65 ± 0.04
SG25SPV lymph node17.79 ± 0.2016.22 ± 0.04
SG26SPV lymph node19.60 ± 0.2314.81 ± 0.14
SG27SPV lymph node21.19 ± 0.0718.25 ± 0.01
SG28SPV lymph node24.29 ± 0.0820.65 ± 0.04
SG29SPV lymph node26.24 ± 0.0121.40 ± 0.07
LG1LSDV skin tissue12.44 ± 0.1410.44 ± 0.13
LG2LSDV skin tissue14.45 ± 0.0112.09 ± 0.07
LG3LSDV skin tissue14.77 ± 0.1412.57 ± 0.07
LG4LSDV skin tissue17.43 ± 0.1113.18 ± 0.07
LG5LSDV skin tissue20.26 ± 0.0411.72 ± 0.21
LG6LSDV skin tissue20.57 ± 0.1718.72 ± 0.10
LG7LSDV skin tissue24.34 ± 0.0117.56 ± 0.05
LG8LSDV skin tissue27.34 ± 0.0411.37 ± 0.02
LG9LSDV whole blood14.62 ± 0.0710.44 ± 0.25
LG10LSDV whole blood14.77 ± 0.1712.36 ± 0.16
LG11LSDV whole blood15.30 ± 0.0717.65 ± 0.04
LG12LSDV whole blood16.33 ± 0.1211.56 ± 0.04
LG13LSDV whole blood16.60 ± 0.2114.84 ± 0.14
LG14LSDV whole blood16.66 ± 0.0310.07 ± 0.07
LG15LSDV whole blood16.83 ± 0.1412.54 ± 0.15
LG16LSDV whole blood17.07 ± 0.0713.52 ± 0.06
LG17LSDV whole blood17.07 ± 0.0616.60 ± 0.06
LG18LSDV whole blood17.49 ± 0.0510.65 ± 0.41
LG19LSDV whole blood17.73 ± 0.0810.33 ± 0.14
LG20LSDV whole blood18.45 ± 0.0312.83 ± 0.14
LG21LSDV whole blood19.77 ± 0.1114.29 ± 0.09
LG22LSDV whole blood23.14 ± 0.1332.69 ± 0.06
LG23LSDV whole blood24.83 ± 0.2316.21 ± 0.06
LG24LSDV whole blood25.23 ± 0.0111.40 ± 0.07
LG25LSDV lymph node16.82 ± 0.2310.22 ± 0.04
LG26LSDV lymph node18.39 ± 0.0716.29 ± 0.08
LG27LSDV lymph node19.59 ± 0.2114.81 ± 0.14
LG28LSDV lymph node21.26 ± 0.0420.45 ± 0.16
LG29LSDV lymph node21.46 ± 0.1017.43 ± 0.11
LG30LSDV lymph node22.19 ± 0.0816.25 ± 0.01
N1Goat skin tissueNoneNone
N2Goat skin tissueNoneNone
N3Goat skin tissueNoneNone
N4Goat whole bloodNoneNone
N5Goat whole bloodNoneNone
N6Goat whole bloodNoneNone
N7Goat whole bloodNoneNone
N8Goat whole bloodNoneNone
N9Goat whole bloodNoneNone
N10Goat whole bloodNoneNone
N11Goat whole bloodNoneNone
N12Goat whole bloodNoneNone
N13Goat lymph nodeNoneNone
N14Goat lymph nodeNoneNone
N15Goat lymph nodeNoneNone
N16Goat lymph nodeNoneNone
N17Sheep skin tissueNoneNone
N18Sheep skin tissueNoneNone
N19Sheep whole bloodNoneNone
N20Sheep whole bloodNoneNone
N21Sheep whole bloodNoneNone
N22Sheep whole bloodNoneNone
N23Sheep whole bloodNoneNone
N24Sheep whole bloodNoneNone
N25Sheep whole bloodNoneNone
N26Sheep whole bloodNoneNone
N27Sheep whole bloodNoneNone
N28Sheep whole bloodNoneNone
N29Sheep whole bloodNoneNone
N30Sheep lymph nodeNoneNone
N31Sheep lymph nodeNoneNone
N32Cattle skin tissueNoneNone
N33Cattle skin tissueNoneNone
N34Cattle skin tissueNoneNone
N35Cattle skin tissueNoneNone
N36Cattle whole bloodNoneNone
N37Cattle whole bloodNoneNone
N38Cattle whole bloodNoneNone
N39Cattle whole bloodNoneNone
N40Cattle whole bloodNoneNone
N41Cattle whole bloodNoneNone
N42Cattle whole bloodNoneNone
N43Cattle whole bloodNoneNone
N44Cattle whole bloodNoneNone
N45Cattle whole bloodNoneNone
N46Cattle whole bloodNoneNone
N47Cattle whole bloodNoneNone
N48Cattle whole bloodNoneNone
N49Cattle lymph nodeNoneNone
N50Cattle lymph nodeNoneNone
Table 6. Diagnostic performance comparison between real-time qPCR and WOAH SYBR Green PCR.
AssaysResultWOAH SYBR Green PCRPerformance Characteristics (%)Agreement Kappa Value
PositiveNegativeTotalSensitivitySpecificity
Real-time qPCRPositive85085100% (95.8–100%, 95% CI)100% (92.9–100%, 95% CI)1.0 (1-1, 95% CI)
Negative05050
Total8550135
Disclaimer/Publisher’s Note: The statements, opinions and data contained in all publications are solely those of the individual author(s) and contributor(s) and not of MDPI and/or the editor(s). MDPI and/or the editor(s) disclaim responsibility for any injury to people or property resulting from any ideas, methods, instructions or products referred to in the content.

