Article

Effects of Cold-Surge-Induced Nearshore Seawater Icing on the Eukaryotic Microalgal Community in Aoshan Bay, Qingdao

Institute of Marine Science and Technology, Shandong University, Qingdao 266237, China
*
Author to whom correspondence should be addressed.
Microorganisms 2023, 11(1), 108; https://doi.org/10.3390/microorganisms11010108
Submission received: 16 December 2022 / Revised: 26 December 2022 / Accepted: 27 December 2022 / Published: 31 December 2022
(This article belongs to the Special Issue Low Temperature Microbiology Meets the Global Challenges of Our Time)

Abstract

:
Climate change has led to frequent cold surges in mid-latitudes, resulting in sudden temperature drops and icing of nearshore seawater, which may be affecting the eukaryotic microalgal community. In this paper, we investigated the differences between a eukaryotic microalgal community in sea ice and in seawater during the seawater freezing, due to the cold surge in Aoshan Bay, Qingdao, China, in January 2021. The results showed that the eukaryotic microalgal community in the sea ice and in the seawater was similar in composition at the phylum and genus levels, but that its relative abundances differed. In the seawater, the eukaryotic microalgal genera were dominated by Chaetoceros, while its relative abundance was significantly lower in the sea ice, probably because the cold-surge-induced seawater icing existed only for a short period of time, and Chaetoceros had not yet adapted to the rapid environmental changes in the sea ice. The relative abundance of Bathycoccus in the sea ice was higher, and showed a significant positive correlation with nitrite and silicate, while the relative abundance of Micromonas in the sea ice was also significantly higher than in the seawater, which may be related to the elevated CO2 concentration in the sea ice. This study demonstrates that although the seawater icing due to the cold surge was short, it may have affected the seawater eukaryotic microalgal community, to a certain extent.

1. Introduction

Since the industrial revolution, human activities have emitted large amounts of carbon dioxide (CO2) into the atmosphere, causing a dramatic increase in atmospheric CO2 concentrations. This increase in atmospheric CO2 has in turn led to global temperature rise and climate change [1,2]. There has been a significant increase in the occurrence of cold surges in Eurasia over the past 20 years, which is closely related to the decrease in Arctic sea ice due to rising temperatures [3,4,5,6]. Cold surge outbreaks are accompanied by extreme weather events such as abnormally low temperatures, freezing rain, and blizzards [7,8]. In addition, a sudden drop in temperature also creates conditions for seawater icing in the mid-latitudes, resulting in microorganisms having to adapt to the rapid environmental changes and the shift of their metabolism [9,10]. During the process of seawater icing, some salts will be enriched in the sea ice, forming brines with high salt concentrations [11,12]. Thus, the high-salinity brine in sea ice provides a unique environment for the establishment of microorganisms, including bacteria and algae from seawater, and other communities [13,14]. The activity of microbial eukaryotic microalgae in sea ice is influenced by environmental variables, such as temperature, salinity, nutrient concentrations and partial pressure of carbon dioxide (pCO2), all of which differ significantly from the seawater situation [15,16]. Eukaryotic microalgae in high-latitude waters may have adapted to the low temperature and sea ice environment [17], and some of them exhibit high biological activity in sea ice [18]. In contrast, a eukaryotic microalgal community in mid-latitude nearshore waters may not have developed effective coping strategies for sea ice formation, especially when sea ice formation and melting occur within a short period of time. Therefore, it is important to investigate how eukaryotic microalgal communities in mid-latitude waters respond to sea ice formation caused by cold surges.
Eukaryotic microalgae, as microscopic organisms prevalent in the global ocean, play an irreplaceable role in carbon cycling and in mitigating global warming [19,20,21]. In the context of global warming and climate change, it is unclear how a eukaryotic microalgal community in seawater changes during sudden cooling and icing caused by cold surges in mid-latitudes, where sea ice formation has rarely been observed in the past; therefore, it is important to study the effects of mid-latitude nearshore sea ice formation on a eukaryotic microalgal community. In this study, we investigated the differences in a eukaryotic microalgal community, between sea ice and seawater, in the coastal waters of Qingdao, China, after the cold surge outbreak in January 2021, in order to understand the effects of seawater icing on eukaryotic microalgal communities in mid-latitude coastal waters.

2. Materials and Methods

2.1. Station and Sample Collection

The study was performed in Aoshan Bay, a semi-enclosed bay in Qingdao, China. Due to its geographical location and climatic conditions, the minimum temperature in Aoshan Bay in winter is usually above −5 °C [22], and seawater seldom freezes; however, in January 2021, a cold surge lasting for 3 days in East Asia caused the minimum temperature in the bay to reach −14 °C, which resulted in extensive ice formation in the nearshore seawater of the bay, and the sea ice lasting for 7 days before melting. During this period, sea ice and seawater samples were collected, to investigate changes in the eukaryotic microalgal community. Samples were taken from three locations, two of which (S1 and S2) were located in the inner bay, while one was in the mouth of the bay (S3) (Figure 1). The sea ice thickness was around 30~50 mm, and the sea ice temperature was measured in situ by inserting a needle temperature probe (TP101, Tejiate, Shenzhen, China), with an accuracy of ±0.1 °C. In addition, the sea ice samples were obtained by a stainless steel saw, and were collected in polypropylene bags, from which air was extracted using a vacuum pump (H1, Reelanx, Shenzhen, China) [23]. The seawater samples beneath the ice were collected using 1L-HDPE bottles.

2.2. Sample Processing and Analysis

The sea ice samples were brought to the laboratory, melted in the dark at room temperature, and processed immediately after complete melting. The salinity of the melted sea ice and seawater was measured with a salinometer (Orion star A212, Thermo Scientific, Waltham, MA, USA). The 150 mL of melted sea ice and seawater were filtered through 0.45-μm-pore-size membrane filters (Millipore, Burlington, MA, USA), and dispensed in 40-mL-high borosilicate brown glass bottles and 125 mL high-density polyethylene (HDPE) bottles (Nalgene, Waltham, MA, USA) for pH, dissolved inorganic carbon (DIC) and total alkalinity (TA) analyses, respectively, where pH and DIC samples were adequately overflowed, and a 0.2‰ saturated mercury chloride (HgCl2) solution was added, to inhibit biological activities.
The pH was measured by a bench-top pH meter (Star A211, Thermo Fisher Scientific, Waltham, MA, USA) in a constant temperature water bath at 25 ± 0.05 °C. The Orion glass electrode (8157BNUMD, Thermo Fisher Scientific, Waltham, MA, USA) was calibrated with pH NBS buffers (pH = 4.010, 6.865, 9.183 @ 25 °C Mettler Toledo, Zurich, Switzerland), with a precision of better than ±0.01. The measured pH was converted to the in situ condition, according to the temperature. TA was titrated with hydrochloric acid via an automatic potentiometric titrator (T960E, Hanon, Jinan, China), with the concentration of hydrochloric acid being calibrated against certified reference material (CRM, Batch 178, Dickson lab, South Gate, CA, USA); the water sample was acidified to a pH below 3, and titration data in the pH range of 3 to 3.5 were obtained and processed by means of the Gran method. The measurement precision in TA was within ±2 µmol·kg−1. DIC was measured by a non-dispersive infrared detector (AS-C5, Apollo SciTech, Newark, NJ, USA). Using high-purity nitrogen (99.999%) as a carrier gas, the CO2 generated by acidification of a 1 mL seawater sample was blown into the drying system (magnesium perchlorate powder). Certified reference material (CRM, Batch 178, Dickson lab, South Gate, CA, USA) was used for quality control, with a precision of ±2 µmol·kg−1. pCO2 was calculated using temperature, salinity, TA and DIC data by CO2SYS (v 2.1) software [25]. For calculation, the equilibrium constants of the carbonate system were from Mehrbach et al. (1973) [26], revised by Dickson and Millero (1987) [27]; The dissociation constant of bisulfate (HSO4) and [B]T were adopted from Dickson (1990) [28] and Uppström (1974) [29], respectively.
Next, 30 mL of melted sea ice and 30 mL of seawater were each filtered with a 0.45-μm-pore-size membrane filter (Millipore, Burlington, MA, USA), and the filtrate was stored at −20 °C for nutrient analysis. Nutrient concentrations—including nitrite, ammonium, silicate and phosphate—were measured, using a continuous-flow analyzer (AA3, SEAL analysis Ltd., Norderstedt, Germany), according to the classical colorimetric method [30]. The detection limit for all channels was 0.1 µmol·kg−1. DNA samples were collected by filtering melted sea ice through a 0.2-µm-pore-size polycarbonate membrane (Millipore, USA), and doing likewise for seawater, after which, the polycarbonate membranes were stored in cryotubes at −80 °C until DNA extraction.
Brine salinity (Sbrine) was calculated from the ice temperature, by the formula: Sbrine = 1000/[1 − (54.11/T)] [31]. The sea ice pH, TA, DIC and nutrient data were normalized to brine concentration, to correct for dilution during melting, and normalized salinity (Cbrine) was calculated according to the equation (Cbrine) = Cbulk (Sbrine/Sbulk), where Cbulk was the measured concentration of bulk sea ice, Sbrine was the brine salinity, and Sbulk was the measured salinity of the melted ice [31].

2.3. DNA Extraction, Amplification and Sequencing

DNA was extracted from 0.2-µm-pore-size polycarbonate filter membranes (Millipore) using DNeasy PowerSoil Kit (Qiagen, Hilden, Germany) [32]. Eukaryotic microalgae 18S rRNA sequences were amplified using primers 528F (5’-GCGGTAATTCCAGCTCCAA-3’) and 706R (5’-AATCCRAGAATTTCACCTCT-3’). The V4 region of the eukaryotic microalgae sequences was sequenced, using an Illumina Hiseq 2500 platform (Novogene, Tianjin, China).

2.4. Bioinformatics and Statistical Analysis

The raw sequences were demultiplexed and quality-filtered by the bioinformatics analysis software QIIME2 [33], where amplicon sequencing variants (ASVs) were generated using DADA2, and were classified according to the SILVA 138 database [34]. In order to better analyze the diversity and community structure of eukaryotic microalgae, this study removed non-algal ASVs, including Ascomycota, Arthropoda, Centrohelida, Mucoromycota and Vertebrata, as well as unclassified data. The number of sequences per sample ranged from 21,217–39,822, and were uniformly normalized to 21,217 sequences, to avoid potential bias due to sequencing depth. A total of 348 ASVs were obtained for downstream analysis. The α-diversity, including Shannon–Weiner (Diversity) and the Pielou (Evenness) index [35], was calculated for each sample, using the vegan R package [36]. Differences between the eukaryotic microalgal community in seawater and sea ice were analyzed by t-test, prior to which the data were tested for normality and homogeneity of variance in GraphPad Prism (v 8.4.3). The compositions of the eukaryotic microalgal community in the seawater and in the sea ice at the genus level were calculated, and presented using the vegan and pheatmap packages in R [37]. Differences in the eukaryotic microalgal community in the sea ice and in the seawater were explored, using principal coordinate analysis (PCoA analysis) based on Bray–Curtis distances. The variability of the eukaryotic microalgal community in the sea ice and in the seawater at the genus level was examined using STAMP [38]. The 12 most abundant genera were analyzed for correlation with environmental factors using Spearman correlation, and significant differences between the dominant genera of the eukaryotic microalgal community and environmental factors were demonstrated, using the ggplot2, pheatmap and Hmisc packages in R [37,39,40].

3. Results

3.1. Environment Parameters

As shown in Table 1, the salinity of the sea ice brine varied from 35.6 to 55.8, with a mean of 43.5, and the salinity of the seawater varied from 32.2 to 40.4, with a mean of 35.2. The temperature in the seawater was about −1.1 °C, while the temperature in the sea ice varied from −3.2 to −2.0 °C. The salinity and pCO2 of the seawater at S1 were higher than those in the corresponding sea ice, while the pH and nutrient data were lower than those in the sea ice. The reason that the salinity and pCO2 at S1 were higher than those at the other two stations was probably due to the shallow water depth at this station, and the expulsion of salt during the sea ice formation leading to an increase in the salinity of the seawater under the ice, which in turn led to an increase in pCO2. Salinity, pH, pCO2 and nutrient data at S2 and S3 were all lower than those in the corresponding sea ice.

3.2. Eukaryotic Microalgal Diversity and Community Composition

The Shannon–Weiner Index of the eukaryotic microalgal community was 2.08, 1.41 and 1.31 in the seawater, and 3.22, 3.09 and 3.42 in the sea ice at S1, S2 and S3, respectively (Figure 2A). The Pielou Index was 0.42, 0.31 and 0.31 in the seawater, and 0.65, 0.61 and 0.67 at S1, S2 and S3 in the sea ice, respectively (Figure 2B). The diversity and evenness of the eukaryotic microalgal community in the sea ice were significantly higher than in the seawater (Figure 2C,D) (p < 0.05).
A total of six eukaryotic microalgal clades were identified, and the eukaryotic microalgal community in the sea ice and in the seawater was similar in composition at the phylum level (Figure 3A); only Diatomea was more dominant in the seawater samples than in the sea ice samples (p < 0.05), with a relative abundance accounting for 66–82% of the entire eukaryotic microalgal community in the seawater samples, while it only accounted for 33–42% in the sea ice samples, although the relative abundance was still high. The relative abundances of Dinoflagellata and Chlorophyta were higher in the sea ice samples, accounting for 14–24% and 26–43%, respectively, while the relative abundances in the seawater samples were lower, accounting for 4–14% and 11–18%, respectively. In addition, Prymnesiophyceae, Ochrophyta, and Cryptophyceae were also detected in the seawater and sea ice samples, and were more dominant in the sea ice samples, but their relative abundances were lower, accounting for 0.4–1.4%, 4.1–8.2% and 2.4–3.3%, respectively. The relative abundances of Chlorophyta, Ochrophyta and Cryptophyceae in the sea ice samples were significantly higher than those in the seawater (p < 0.05), while no significant difference was seen for Dinoflagellata and Prymnesiophyceae (p > 0.05).
At the genus level (Figure 3B), the eukaryotic microalgal community in the sea ice and in the seawater was similar in composition, but the dominant algal genus in the seawater was Chaetoceros, and the relative abundance of Chaetoceros in the seawater samples was significantly higher than that in the sea ice samples (p < 0.05). The relative abundance of Chaetoceros was highest at S2, at 78%, and decreased sequentially at S1 and S3, at 72% and 67%, respectively. The relative abundance of Chaetoceros in the sea ice decreased compared to that in the seawater, but it was still the most abundant algal genus at S1, at 37%, and lower at S2 and S3, at 20% and 16%, respectively. The relative abundance of Bathycoccus was only lower than Chaetoceros in the sea ice at S1, at 20%, and was highest at S2 and S3, at 35% and 30%, respectively; in the seawater, its relative abundance was significantly lower (p < 0.05), at 11%, 9% and 9% at S1, S2 and S3, respectively. The relative abundance of Micromonas was significantly higher in the sea ice than in the seawater (p < 0.05), at 6%, 10% and 11% in the sea ice at S1, S2 and S3, respectively, and 5%, 2% and 2% in the seawater, respectively.

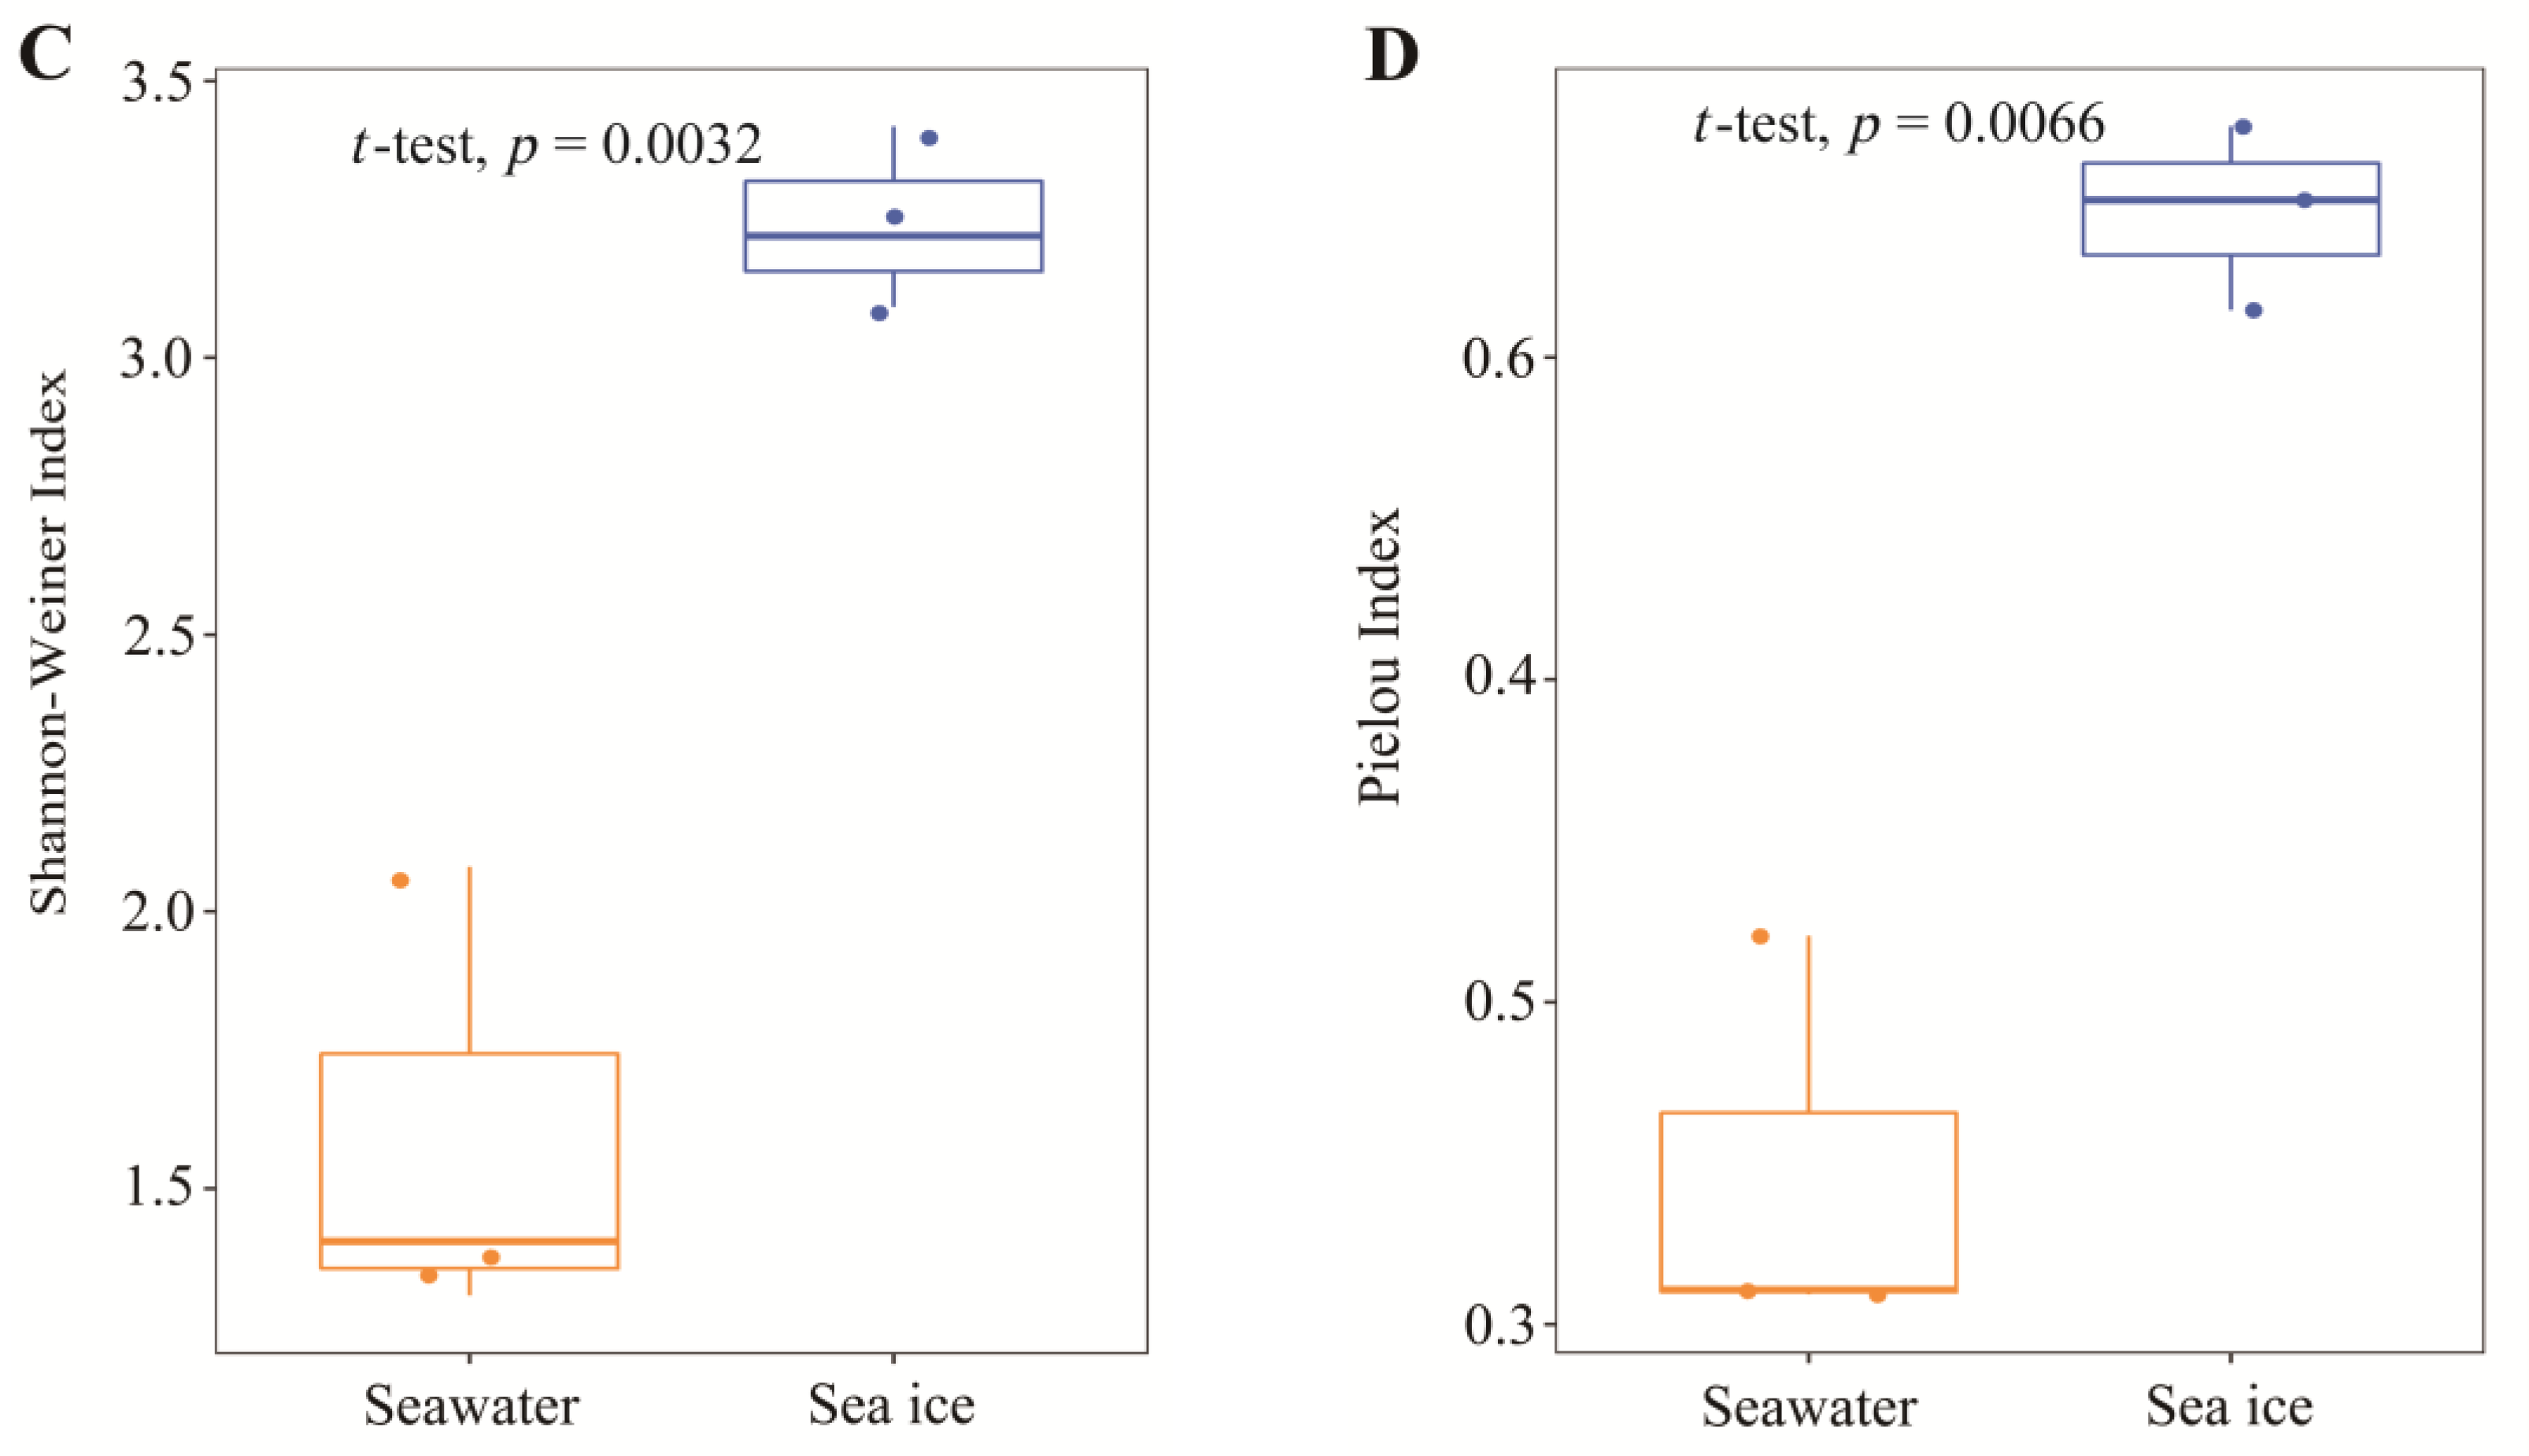
3.3. Differences of Eukaryotic Microalgal Community in Seawater and Sea Ice

Based on the Bray–Curtis distance analysis, PCoA was used to evaluate the overall differences between the sea ice and the seawater eukaryotic microalgal community (Figure 4). PCo1 and Pco2 explained 84.44% and 8.8%, respectively, of the differences among the six samples. The seawater samples were located in the negative half-axis of PCo1, while the sea ice samples were located in the positive half-axis of PCo1, indicating that the eukaryotic microalgal community was significantly clustered, due to the phase transition of the seawater icing.
The results of STAMP analysis showed that at the genus level, Chaetoceros was relatively more abundant in the seawater, while Prasinophytae, Teleaulax, Subclade_A, Trebouxiophyceae, Bolidomonas, Haptolina, Thalassiosira, Micromonas, Karlodinium, Leptocylindrus, Bathycoccus were more abundant in the sea ice. The most significant differences in dominant genera between the seawater and the sea ice samples were Chaetoceros, Bathycoccus and Micromonas (p < 0.05) (Figure 5).

3.4. Correlation of Eukaryotic Microalgae Genera with Environmental Parameters

Among the 12 genera with the highest abundance screened for correlations with environmental parameters, the analysis revealed that Chaetocerps showed a significant positive correlation with temperature (p < 0.05); Bathycoccus showed a significant positive correlation with NO2 and SiO32− (p < 0.05), and a highly significant negative correlation with temperature (p < 0.01); Prasinophytae was significantly positively correlated with NH4+ and NO2 (p < 0.05), and highly significantly negatively correlated with temperature (p < 0.01); Subclade_A and Trebouxiophyceae were both negatively correlated with temperature (p < 0.05) (Figure 6).

4. Discussion

Cold surges cause nearshore seawater to freeze, and the phase change process of seawater icing can affect the metabolic activities of the eukaryotic microalgae, forcing them to adapt to a new lifestyle in sea ice. In this study, the similarity of eukaryotic microalgal community in the sea ice and in the seawater was higher than the effects arising from the spatial distance of the samples, and the difference in living environments due to the sea ice formation was an important factor in altering the eukaryotic microalgal community. In addition, this study found that the composition differences between the eukaryotic microalgal community in seawater and in sea ice at the phylum and genus levels were not significant, possibly due to the short existence of the sea ice, and because the microalgal cells in the sea ice may have still maintained their metabolic activities in the open water [10,42]. The differences in the eukaryotic microalgal community were mainly reflected in the relative abundance, e.g., in the seawater, the eukaryotic microalgal community had the greatest relative abundance of diatoms at the phylum level, while in the sea ice, the relative abundance of diatoms significantly decreased (p < 0.05). The relative abundance of Chaetoceros was greatest in the seawater at the genus level, but decreased significantly in the sea ice (p < 0.05).
Chaetoceros has been found to be a central algal genus in both seawater and sea ice in the Arctic, and the sea ice environment is also favorable for the growth of the sea ice diatom Chaetoceros [43,44]. In this study, Chaetoceros was also the most abundant algal genus in the surveyed area, but the relative abundance of Chaetoceros in the sea ice was significantly lower than in the seawater, which was different from the findings of the polar sea ice study. This difference may have been because our sampling site was located in mid-latitude, where the seawater does not normally freeze, and the diatoms may not have adapted to the dramatic environmental changes in a short period of time, due to the sudden cold surge that caused the freezing of the seawater. Bathycoccus was the dominant genus in the sea ice, and is also the main eukaryotic microalgae in polar regions [45,46]: it possesses two ecotypes, one of which adapts to environments with high nutrient concentrations in coastal waters, while the other adapts to environments with low nutrient concentrations in the open ocean [47,48]. Nutrient enrichment in sea ice brines due to seawater icing may stimulate the growth of Bathycoccus in sea ice, as evidenced by a positive correlation between Bathycoccus and nutrient salt concentrations, especially a significant correlation with nutrient NO2 and SiO32− [49]. In addition to being the dominant genus, the relative abundance of Micromonas was significantly higher in the sea ice than in the seawater (p < 0.05), and it is also widely distributed in polar sea ice [50]. CO2 concentration has been shown to affect the development of the eukaryotic community [51]. In particular, the abundance of Micromonas will significantly increase at high CO2 concentrations [52]. As pCO2 in the sea ice was higher than in the seawater (except at S1), Micromonas exhibited a higher relative abundance in the sea ice at high CO2 concentrations.

5. Conclusions

Against the background of global climate change, nearshore seawater icing in mid-latitude waters is likely to become the new normal. In this study, we investigated the differences between a eukaryotic microalgal community in seawater and in sea ice in Aoshan Bay, Qingdao, after a cold surge. The compositions of the eukaryotic microalgal community in seawater at the phylum and genus levels were similar to those in the sea ice, but their relative abundances were significantly different, which may be related to the environmental differences caused by the phase change pressure of seawater icing. The eukaryotic microalgal community in the seawater was dominated by the diatom Chaetoceros; and the results of the reduced relative abundance of Chaetoceros in the sea ice differed from those in the Arctic study, probably because the sampling site of this study was in the mid-latitude coastal waters, where the existing time of seawater icing was short, and Chaetoceros may have not yet adapted to the rapid environmental changes. The eukaryotic microalgal community in the sea ice was dominated by Bathycoccus and Micromonas, which had more opportunities to grow in the sea ice with, respectively, higher nutrient and CO2 concentrations. Due to the limited investigation in this study, it is unknown how a eukaryotic microalgal community evolves during the formation and melting of sea ice induced by cold surges. Therefore, we suggest that future studies may consider conducting time series surveys, to understand the effects of cold surges on eukaryotic microalgal communities in mid-latitude waters more comprehensively.

Author Contributions

Conceptualization, Y.H.; methodology, Y.H.; software, H.B.; validation, H.B., X.G. and Y.X.; formal analysis, H.B.; investigation, Y.H.; resources, Y.H.; data curation, H.B.; writing—original draft preparation, H.B.; writing—review and editing, Y.H., X.G., Y.X.; supervision, Y.H.; project administration, Y.H.; funding acquisition, Y.H. All authors have read and agreed to the published version of the manuscript.

Funding

This research was funded by the Key Research and Development Program of Shandong Province (2020ZLYS04), the National Key Research and Development Program of China (2020YFA0608304), the Joint Funds of the National Natural Science Foundation of China (U1906216), the National Natural Science Foundation of China (41806094), and the Young Scholars Program of Shandong University (2018WLJH43).

Data Availability Statement

Illumina sequences are available in the Sequence Read Archive (SRA) of the National Center for Biotechnology Information (NCBI), under BioProject accession number PRJNA908654.

Acknowledgments

We would like to thank Hongwei Ren, Liang Mou, Chao Li and Zhe Zhang for their assistance in the fieldwork, and are grateful to Xianzhe Gong for the internal review of this manuscript.

Conflicts of Interest

The authors declare no conflict of interest.

References

  1. Gillett, N.P.; Stone, D.A.; Stott, P.A.; Nozawa, T.; Karpechko, A.Y.; Hegerl, G.C.; Wehner, M.F.; Jones, P.D. Attribution of polar warming to human influence. Nat. Geosci. 2008, 1, 750–754. [Google Scholar] [CrossRef] [Green Version]
  2. Najafi, M.R.; Zwiers, F.W.; Gillett, N.P. Attribution of Arctic temperature change to greenhouse-gas and aerosol influences. Nat. Clim. Chang. 2015, 5, 246–249. [Google Scholar] [CrossRef]
  3. Dai, G.K.; Li, C.X.; Han, Z.; Luo, D.H.; Yao, Y. The nature and predictability of the East Asian extreme cold events of 2020/21. Adv. Atmos. Sci. 2022, 39, 566–575. [Google Scholar] [CrossRef]
  4. Yao, Y.; Zhang, W.Q.; Luo, D.H.; Zhong, L.H.; Pei, L. Seasonal cumulative effect of Ural Blocking Episodes on the frequent cold events in China during the early winter of 2020/21. Adv. Atmos. Sci. 2022, 39, 609–624. [Google Scholar] [CrossRef]
  5. Wu, B.Y.; Su, J.Z.; Zhang, R.H. Effects of autumn-winter Arctic sea ice on winter Siberian High. Chin. Sci. Bull. 2011, 56, 3220–3228. [Google Scholar] [CrossRef] [Green Version]
  6. Mori, M.; Watanabe, M.; Shiogama, H.; Inoue, J.; Kimoto, M. Robust Arctic sea-ice influence on the frequent Eurasian cold winters in past decades. Nat. Geosci. 2014, 7, 869–873. [Google Scholar] [CrossRef]
  7. Liu, J.P.; Curry, J.A.; Wang, H.J.; Song, M.R.; Horton, R.M. Impact of declining Arctic sea ice on winter snowfall. Proc. Natl. Acad. Sci. USA 2012, 109, 4074–4079. [Google Scholar] [CrossRef] [Green Version]
  8. Kurczyn, J.A.; Appendini, C.M.; Beier, E.; Sosa-Lopez, A.; Lopez-Gonzalez, J.; Posada-Vanegas, G. Oceanic and atmospheric impact of central American cold surges (Nortes) in the Gulf of Mexico. Int. J. Climatol. 2021, 41, E1450–E1468. [Google Scholar] [CrossRef]
  9. Xie, X.; Zhou, R.; Deng, Z. Overcompensation and competitive effects of Microcystis aeruginosa and Scenedesmus obliquus after low temperature and light stresses. Acta Ecol. Sin. 2014, 34, 1224–1234. [Google Scholar]
  10. Grossmann, S.; Gleitz, M. Microbial response to experimental sea-ice formation: Implications for the establishment of Antarctic sea-ice communities. J. Exp. Mar. Biol. Ecol. 1993, 173, 273–289. [Google Scholar] [CrossRef]
  11. Worster, M.G.; Jones, D.W.R. Sea-ice thermodynamics and brine drainage. Philos. Trans. R. Soc. A-Math. Phys. Eng. Sci. 2015, 373, 20140166. [Google Scholar] [CrossRef]
  12. Niedrauer, T.M.; Martin, S. An experimental study of brine drainage and convection in young sea ice. J. Geophys. Res.-Ocean. 1979, 84, 1176–1186. [Google Scholar] [CrossRef]
  13. Campbell, K.; Mundy, C.J.; Belzile, C.; Delaforge, A.; Rysgaard, S. Seasonal dynamics of algal and bacterial communities in Arctic sea ice under variable snow cover. Polar Biol. 2018, 41, 41–58. [Google Scholar] [CrossRef]
  14. Lund-Hansen, L.; Sgaard, D.; Sorrell, B.; Gradinger, R.; Meiners, K. Arctic Sea Ice Ecology: Seasonal Dynamics in Algal and Bacterial Productivity; Springer: Cham, Switzerland, 2020. [Google Scholar] [CrossRef]
  15. Piontek, J.; Galgani, L.; Nothig, E.M.; Peeken, I.; Engel, A. Organic matter composition and heterotrophic bacterial activity at declining summer sea ice in the central Arctic Ocean. Limnol. Oceanogr. 2021, 66, S343–S362. [Google Scholar] [CrossRef]
  16. Delille, B.; Vancoppenolle, M.; Geilfus, N.X.; Tilbrook, B.; Lannuzel, D.; Schoemann, V.; Becquevort, S.; Carnat, G.; Delille, D.; Lancelot, C.; et al. Southern Ocean CO2 sink: The contribution of the sea ice. J. Geophys. Res.-Ocean. 2014, 119, 6340–6355. [Google Scholar] [CrossRef] [Green Version]
  17. Ligowski, R.; Jordan, R.W.; Assmy, P. Morphological adaptation of a planktonic diatom to growth in Antarctic sea ice. Mar. Biol. 2012, 159, 817–827. [Google Scholar] [CrossRef] [PubMed] [Green Version]
  18. Kovaleva, G.V.; Povazhnyy, V.V.; Zolotareva, A.E.; Makarevich, P.R.; Matishov, D.G. Temporary ice microalgae community in Taganrog Bay of the Azov Sea. Oceanology 2014, 54, 618–623. [Google Scholar] [CrossRef]
  19. Freyria, N.J.; Kuo, A.; Chovatia, M.; Johnson, J.; Lipzen, A.; Barry, K.W.; Grigoriev, I.V.; Lovejoy, C. Salinity tolerance mechanisms of an Arctic Pelagophyte using comparative transcriptomic and gene expression analysis. Commun. Biol. 2022, 5, 13. [Google Scholar] [CrossRef]
  20. Molazadeh, M.; Ahmadzadeh, H.; Pourianfar, H.R.; Lyon, S.; Rampelotto, P.H. The use of microalgae for coupling wastewater treatment with CO2 biofixation. Front. Bioeng. Biotechnol. 2019, 7, 42. [Google Scholar] [CrossRef] [Green Version]
  21. Singh, U.B.; Ahluwalia, A.S. Microalgae: A promising tool for carbon sequestration. Mitig. Adapt. Strateg. Glob. Chang. 2013, 18, 73–95. [Google Scholar] [CrossRef]
  22. Guo, Y.L.; Xiong, X.J.; Chen, C.; Yu, L.; Guo, Y.Q. Hydrometeorological interpretation and cause analysis on Qingdao’s warmer winter. Coast. Eng. 2014, 33, 1–11. (In Chinese) [Google Scholar]
  23. Hu, Y.B.; Wang, F.Y.; Boone, W.; Barber, D.; Rysgaard, S. Assessment and improvement of the sea ice processing for dissolved inorganic carbon analysis. Limnol. Oceanogr.-Methods 2018, 16, 83–91. [Google Scholar] [CrossRef] [Green Version]
  24. Schlitzer, R. Ocean Data View. Software. 2021. Available online: https://odv.awi.de (accessed on 15 September 2022).
  25. Pierrot, D.; Lewis, E.; Wallace, R.; Wallace, D.; Wallace, W.; Wallace, D.W.R. MS Excel Program Developed for CO2 System Calculations; ORNL/CDIAC-105a; Carbon Dioxide Information Analysis Center, Oak Ridge National Laboratory, U.S. Department of Energy: Oak Ridge, TN, USA, 2006. [Google Scholar] [CrossRef]
  26. Mehrbach, C.; Culberson, C.H.; Hawley, J.E.; Pytkowicz, R.M. Measurement of the apparent dissociation constants of carbonic acid in seawater at atmospheric pressure. Limnol. Oceanogr. 1973, 18, 897–907. [Google Scholar] [CrossRef]
  27. Dickson, A.G.; Millero, F.J. A comparison of the equilibrium constants for the dissociation of carbonic acid in seawater media. Deep-Sea Res. 1987, 34, 1733–1743. [Google Scholar] [CrossRef]
  28. Dickson, A.G. Standard potential of the reaction: AgCl (s) + 1/2H2 (g) = Ag (s)+HCl (aq), and the standard acidity constant of the ion HSO4 in synthetic sea water from 273.15 to 318.15 K. J. Chem. Thermodyn. 1990, 22, 113–127. [Google Scholar] [CrossRef]
  29. Uppström, L.R. The Boron/chlorinity ratio of deep-sea water from Pacific Ocean. Deep-Sea Res. 1974, 21, 161–162. [Google Scholar] [CrossRef]
  30. Grasshoff, K.; Kremling, K.; Ehrhardt, M. Methods of Seawater Analysis; Wiley-VCH: Weinheim, Germany, 1999; 600p. [Google Scholar]
  31. Cox, G.F.N.; Weeks, W.F. Equations for determining the gas and brine volumes in sea-ice samples. J. Glaciol. 1983, 29, 306–316. [Google Scholar] [CrossRef] [Green Version]
  32. Zhao, D.; Gao, P.; Xu, L.; Qu, L.Y.; Han, Y.J.; Zheng, L.W.; Gong, X.Z. Disproportionate responses between free-living and particle-attached bacteria during the transition to oxygen-deficient zones in the Bohai Seawater. Sci. Total Environ. 2021, 791, 148097. [Google Scholar] [CrossRef]
  33. Bolyen, E.; Rideout, J.R.; Dillon, M.R.; Bokulich, N.; Abnet, C.C.; Al-Ghalith, G.A.; Alexander, H.; Alm, E.J.; Arumugam, M.; Asnicar, F.; et al. Reproducible, interactive, scalable and extensible microbiome data science using QIIME 2. Nat. Biotechnol. 2019, 37, 852–857. [Google Scholar] [CrossRef]
  34. Robeson, M.S.; O’Rourke, D.R.; Kaehler, B.D.; Ziemski, M.; Dillon, M.R.; Foster, J.T.; Bokulich, N.A. RESCRIPt: Reproducible sequence taxonomy reference database management for the masses. bioRxiv 2020. [Google Scholar] [CrossRef]
  35. Shannon, C.E. A mathematical theory of communication. Bell Syst. Tech. J. 1948, 27, 379–423. [Google Scholar] [CrossRef] [Green Version]
  36. Dixon, P. VEGAN, a package of R functions for community ecology. J. Veg. Sci. 2003, 14, 927–930. [Google Scholar] [CrossRef]
  37. Hu, K. Become competent in generating RNA-Seq Heat Maps in one day for novices without prior R experience. In Nuclear Reprogramming: Methods and Protocols; Hu, K., Ed.; Methods in Molecular Biology; Humana: New York, NY, USA, 2021; Volume 2239, pp. 269–303. [Google Scholar] [CrossRef]
  38. Parks, D.H.; Tyson, G.W.; Hugenholtz, P.; Beiko, R.G. STAMP: Statistical analysis of taxonomic and functional profiles. Bioinformatics 2014, 30, 3123–3124. [Google Scholar] [CrossRef] [Green Version]
  39. Villanueva, R.A.M.; Chen, Z.J. ggplot2: Elegant graphics for data analysis, 2nd edition. Meas.-Interdiscip. Res. Perspect. 2019, 17, 160–167. [Google Scholar] [CrossRef]
  40. Yadav, M.L.; Roychoudhury, B. Handling missing values: A study of popular imputation packages in R. Knowl.-Based Syst. 2018, 160, 104–118. [Google Scholar] [CrossRef]
  41. Ren, H.W.; Liu, J.H.; Li, G.; Hu, Y.B. Bacterial community in cold surge-caused sea ice differs from seawater in mid-latitude region: A case study in Aoshan Bay, Southern Yellow Sea. Front. Mar. Sci. 2022, 9, 856110. [Google Scholar] [CrossRef]
  42. Rozanska, M.; Poulin, M.; Gosselin, M. Protist entrapment in newly formed sea ice in the Coastal Arctic Ocean. J. Mar. Syst. 2008, 74, 887–901. [Google Scholar] [CrossRef]
  43. De Villiërs Louw, S.; Walker, D.R.; Fawcett, S.E. Factors influencing sea-ice algae abundance, community composition, and distribution in the marginal ice zone of the Southern Ocean during winter. Deep-Sea Res. Part I-Oceanogr. Res. Pap. 2022, 185, 103805. [Google Scholar] [CrossRef]
  44. Moro, I.; Paccagnella, R.; Barbante, C.; Andreoli, C. Microalgal communities of the sea ice, ice-covered and ice-free waters of Wood Bay (Ross Sea, Antarctica) during the austral summer 1993-94. Mar. Ecol.-Pubbl. Della Stn. Zool. Napoli I 2000, 21, 233–245. [Google Scholar] [CrossRef]
  45. Joli, N.; Monier, A.; Logares, R.; Lovejoy, C. Seasonal patterns in Arctic prasinophytes and inferred ecology of Bathycoccus unveiled in an Arctic winter metagenome. ISME J. 2017, 11, 1372–1385. [Google Scholar] [CrossRef] [Green Version]
  46. Trombetta, T.; Bouget, F.Y.; Felix, C.; Mostajir, B.; Vidussi, F. Microbial diversity in a North Western Mediterranean Sea Shallow Coastal Lagoon under contrasting Water temperature conditions. Front. Mar. Sci. 2022, 9, 858744. [Google Scholar] [CrossRef]
  47. Vaulot, D.; Lepere, C.; Toulza, E.; De la Iglesia, R.; Poulain, J.; Gaboyer, F.; Moreau, H.; Vandepoele, K.; Ulloa, O.; Gavory, F.; et al. Metagenomes of the Picoalga Bathycoccus from the Chile Coastal Upwelling. PLoS ONE 2012, 7, e39648. [Google Scholar] [CrossRef]
  48. Monier, A.; Sudek, S.; Fast, N.M.; Worden, A.Z. Gene invasion in distant eukaryotic lineages: Discovery of mutually exclusive genetic elements reveals marine biodiversity. ISME J. 2013, 7, 1764–1774. [Google Scholar] [CrossRef] [PubMed] [Green Version]
  49. Hernandez-Ruiz, M.; Prieto, A.; Barber-Lluch, E.; Teira, E. Amino acid utilization by eukaryotic picophytoplankton in a coastal upwelling system. Mar. Ecol. Prog. Ser. 2018, 588, 43–57. [Google Scholar] [CrossRef]
  50. Belevich, T.A.; Ilyash, L.V.; Milyutina, I.A.; Logacheva, M.D.; Goryunov, D.V.; Troitsky, A.V. Photosynthetic Picoeukaryotes in the Land-Fast Ice of the White Sea, Russia. Microb. Ecol. 2018, 75, 582–597. [Google Scholar] [CrossRef] [PubMed]
  51. Engel, A.; Schulz, K.G.; Riebesell, U.; Bellerby, R.; Delille, B.; Schartau, M. Effects of CO2 on particle size distribution and phytoplankton abundance during a mesocosm bloom experiment (PeECE II). Biogeosciences 2008, 5, 509–521. [Google Scholar] [CrossRef] [Green Version]
  52. Meakin, N.G.; Wyman, M. Rapid shifts in picoeukaryote community structure in response to ocean acidification. ISME J. 2011, 5, 1397–1405. [Google Scholar] [CrossRef]
Figure 1. Map of the sampling location in Aoshan Bay, Qingdao. Black square indicates the sampling stations. Figure was generated using Ocean Date View (v 5.5.2) [24].
Microorganisms 11 00108 g001
Figure 2. α-diversity of the eukaryotic microalgal community in the seawater and in the sea ice: Shannon’s index (A) and evenness (B); significance test of Shannon’s index (C) and evenness (D).
Microorganisms 11 00108 g002aMicroorganisms 11 00108 g002b
Figure 3. Relative abundance of the eukaryotic microalgal community in the seawater and in the sea ice at the phylum level (A) and genus level (B).
Microorganisms 11 00108 g003
Figure 4. Principal coordinates analysis (PCoA) of Bray–Curtis distance for the eukaryotic microalgal community in the seawater and in the sea ice. Different letters (a and b) denote significant differences (p < 0.05).
Microorganisms 11 00108 g004
Figure 5. Comparison of genus-level differences between the seawater and the sea ice eukaryotic microalgal community (t-test in STAMP). Color: Eukaryotic microalgae in the seawater (orange) and in the sea ice (blue).
Microorganisms 11 00108 g005
Figure 6. Spearman correlation matrix of eukaryotic microalgae algae genera and environmental parameters. Colors indicate correlation coefficients, with red indicating a positive correlation, and blue indicating a negative correlation. “*” represents significant correlation (p < 0.05) and “**” represents highly significant correlation (p < 0.01).
Microorganisms 11 00108 g006
Table 1. Salinity (S), temperature (T), pH, pCO2 (μatm) and nutrient concentrations (µmol·kg−1) in the seawater and in the sea ice brine.
SampleST (°C)pHpCO2NO2NO3NH4+SiO32−PO43−
S1sw40.4−1.08.163460.53.82.85.10.1
S2sw33.1−1.28.202770.216.41.45.80.1
S3sw32.2−1.08.242390.212.10.64.80.0
S1ice39.1−2.28.262790.84.716.75.70.2
S2ice55.8−3.28.293742.915.033.220.40.9
S3ice35.6−2.08.282521.2-6.511.80.2
S1, S2 and S3 denote station names, and the subscript “sw” and “ice” denote data in the seawater and in the sea ice, respectively (some data are cited from Ren et al. [41]).
Disclaimer/Publisher’s Note: The statements, opinions and data contained in all publications are solely those of the individual author(s) and contributor(s) and not of MDPI and/or the editor(s). MDPI and/or the editor(s) disclaim responsibility for any injury to people or property resulting from any ideas, methods, instructions or products referred to in the content.

