
Zam Is a Redox-Regulated Member of the RNB-Family Required for Optimal Photosynthesis in Cyanobacteria

 , and
, and 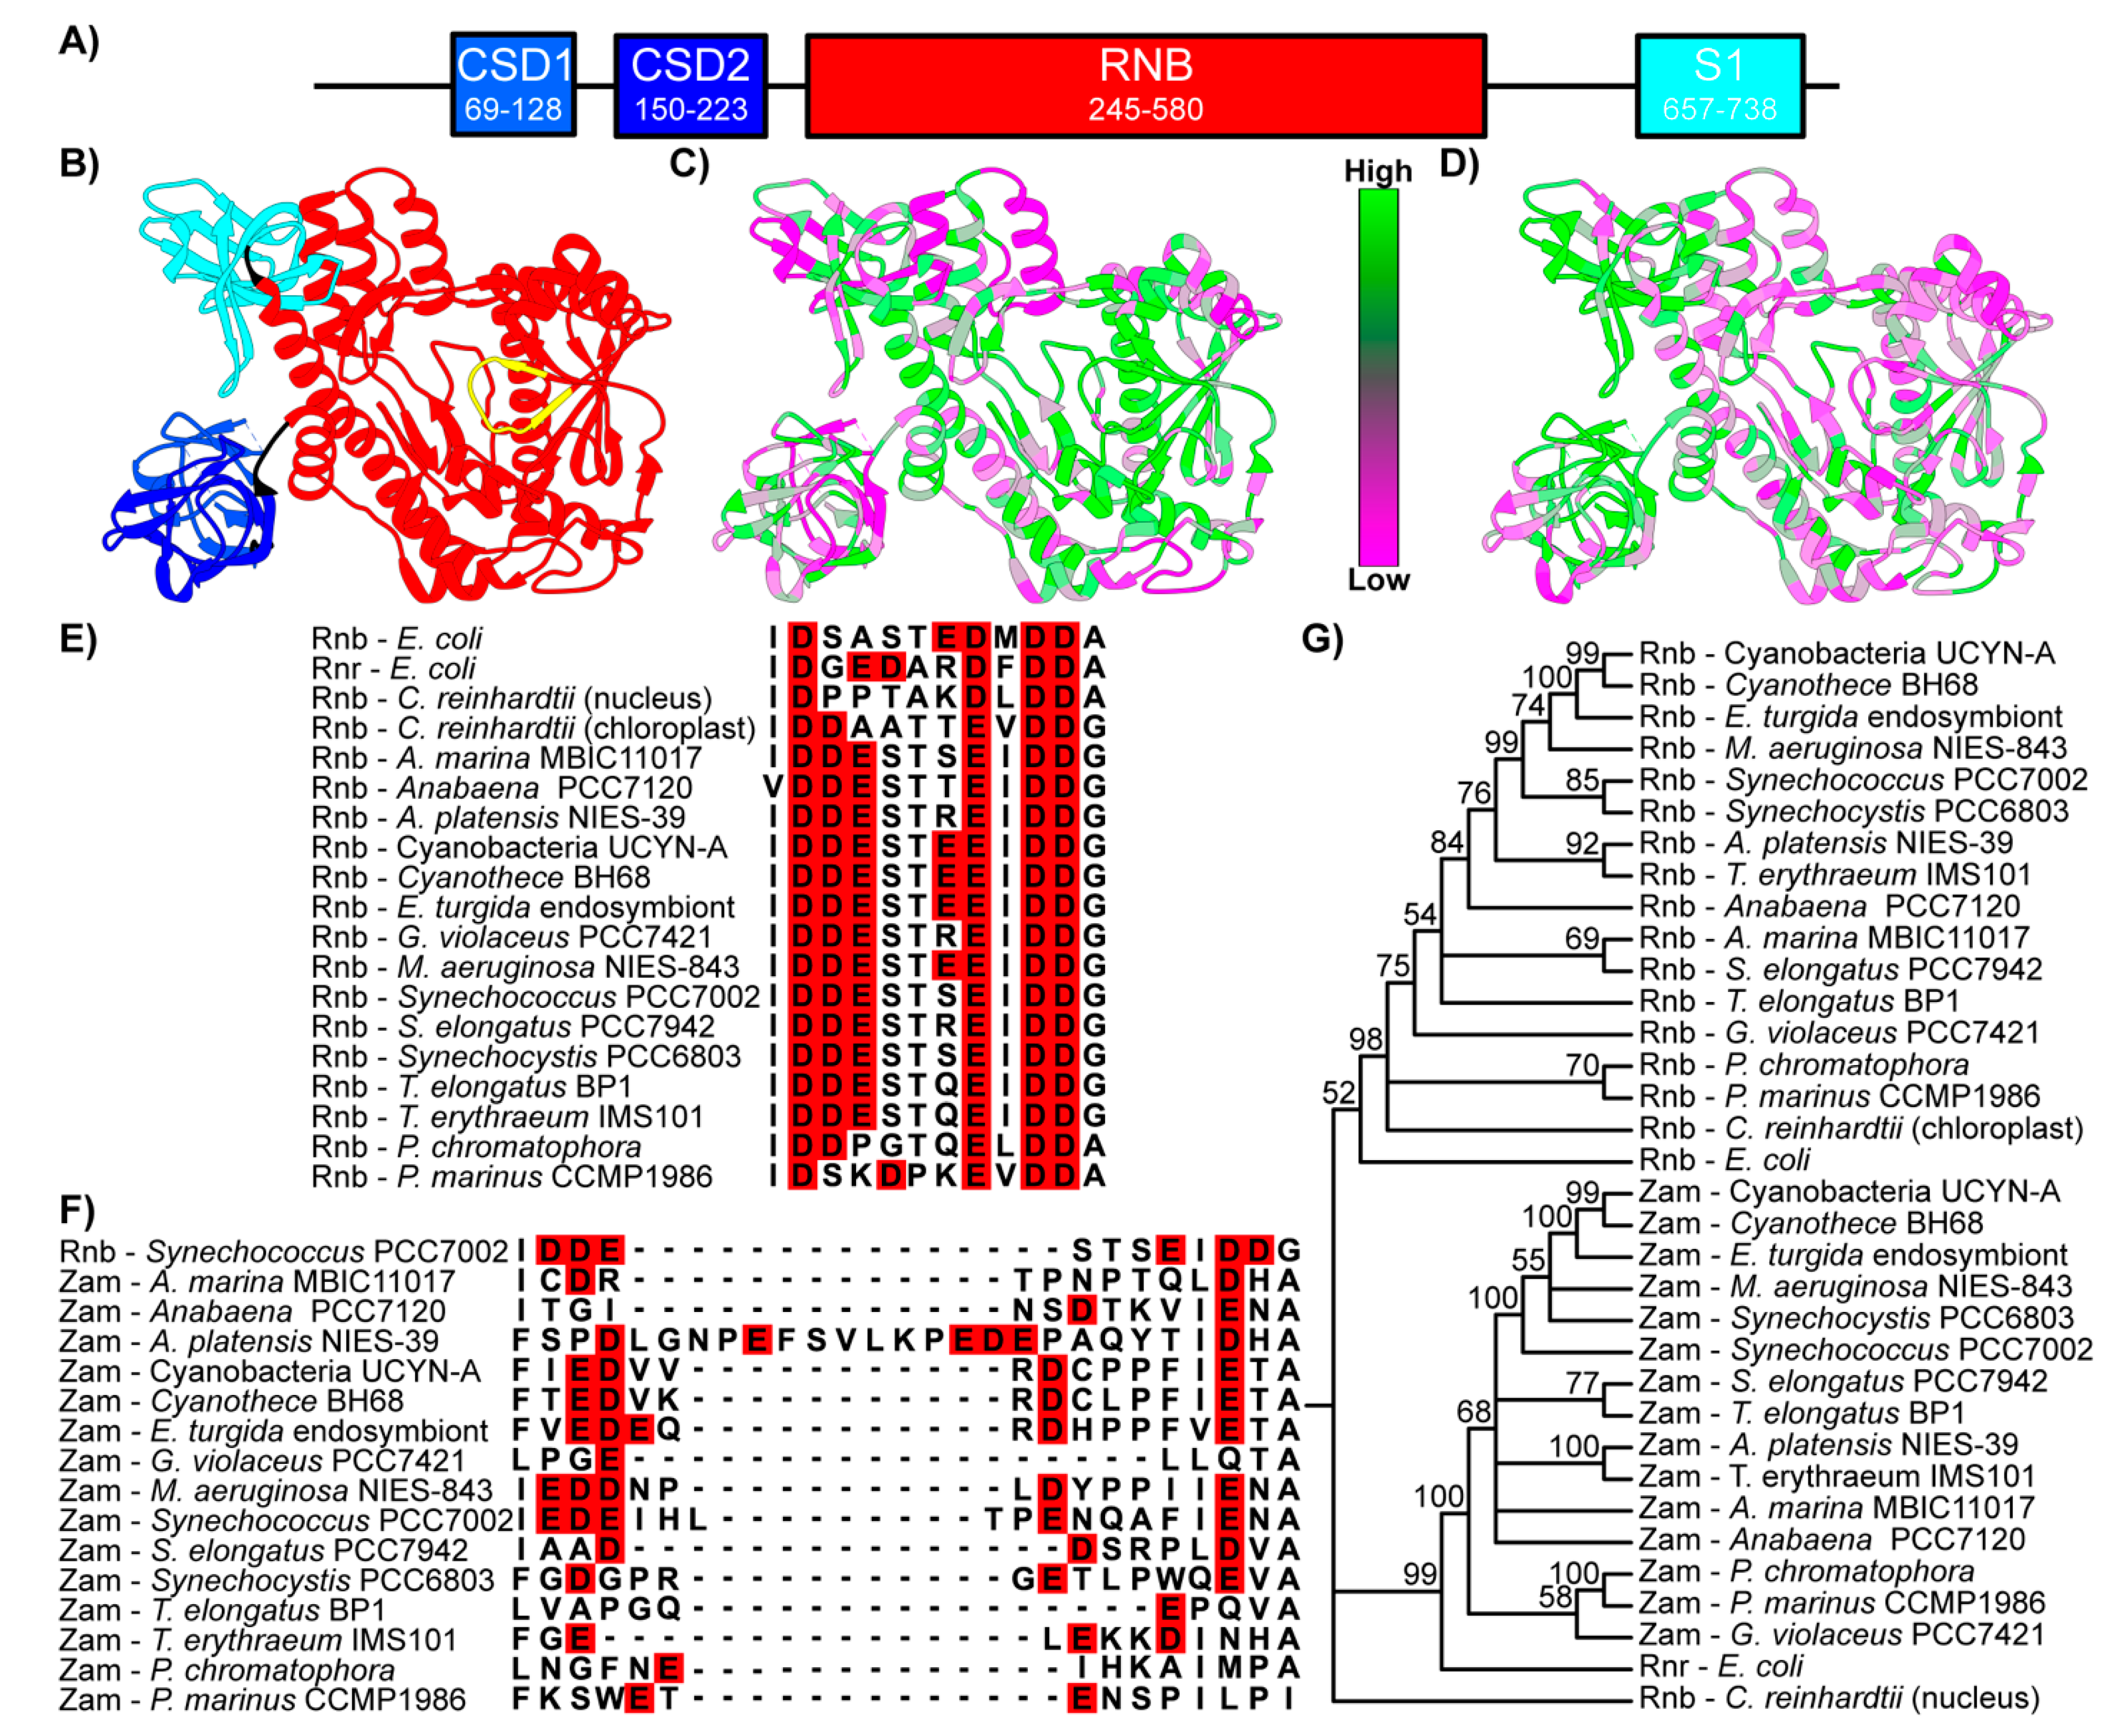
Abstract
1. Introduction
2. Materials and Methods
2.1. Reciprocal Best Hit, Multiple Alignment, and Phylogenetics
2.2. Domain Identification
2.3. Homology Mapping and Visualization
2.4. Computation Modeling
2.5. Cell Growth and Maintenance
2.6. Plasmid and Strain Construction
2.7. Spot Plates
2.8. Nitrogen Starvation and Repletion
2.9. 77 K Fluorescence Spectroscopy
2.10. Quantitative Long-Term Time-Lapse Fluorescence Microscopy
2.11. Protein Expression and Purification
2.12. Analysis of CSD1 RNA Binging Potential
3. Results
3.1. Domain Architecture and Conservation of Zam in Cyanobacteria
3.2. Zam and Rnb Phylogeny
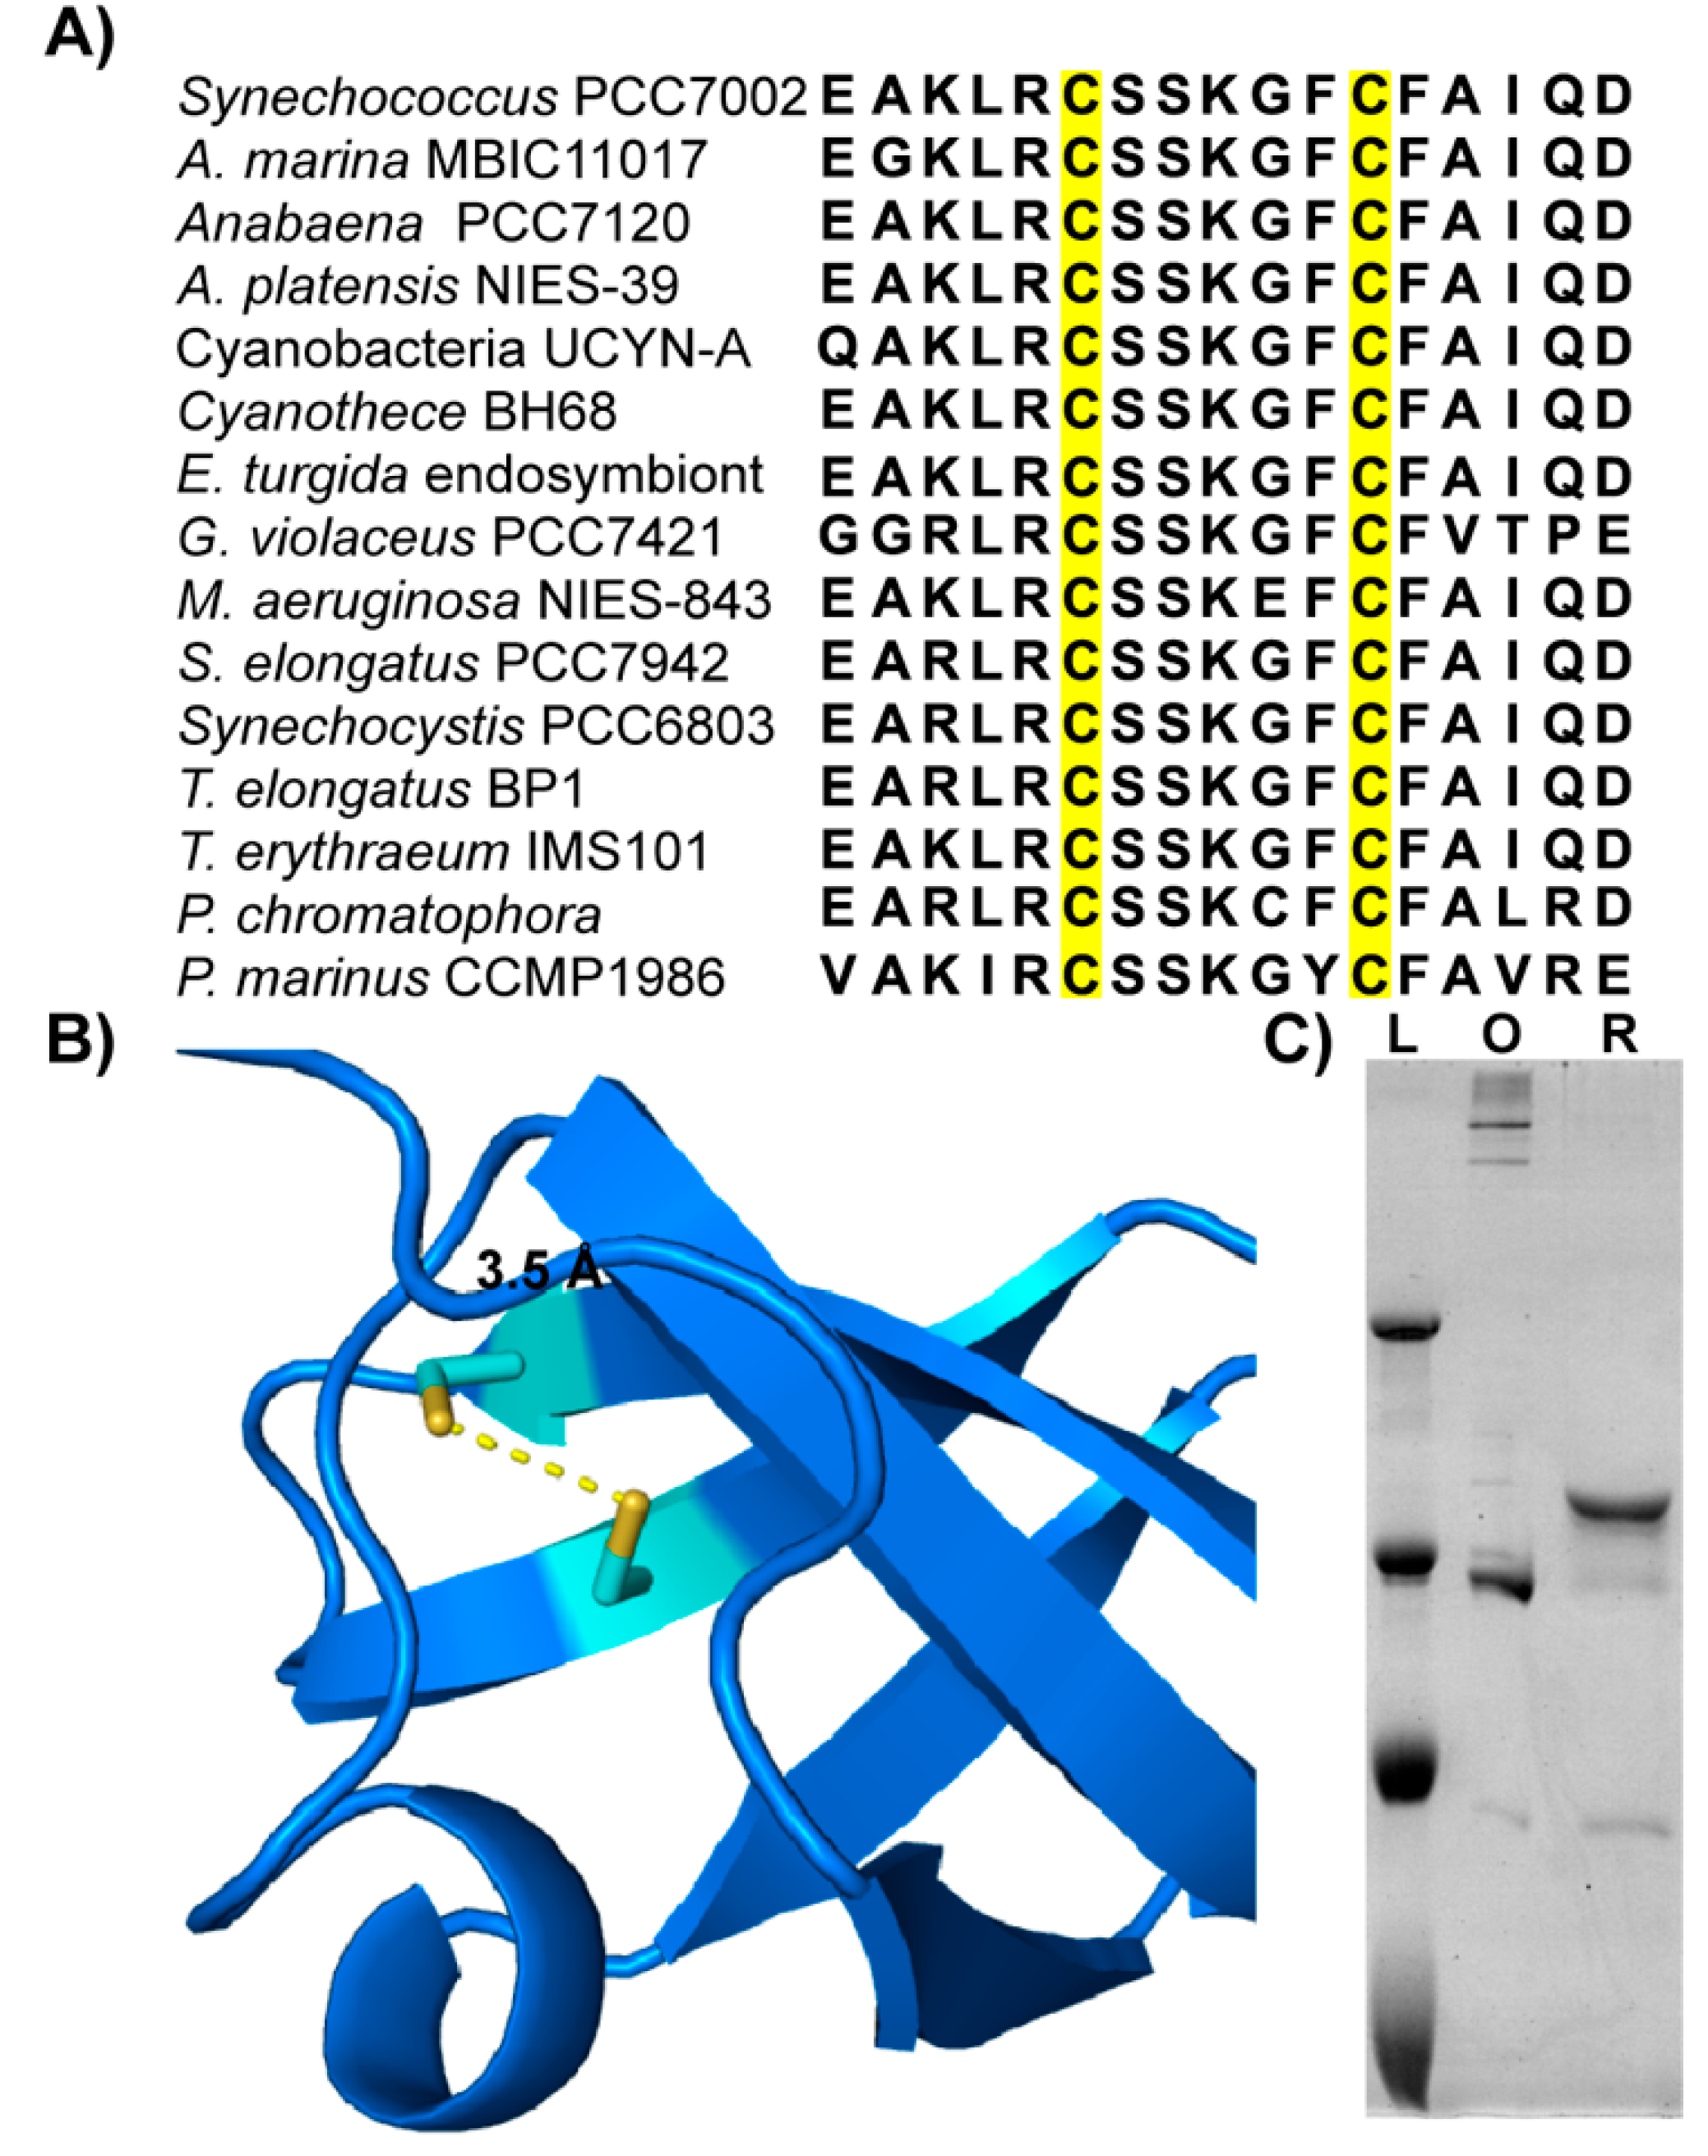
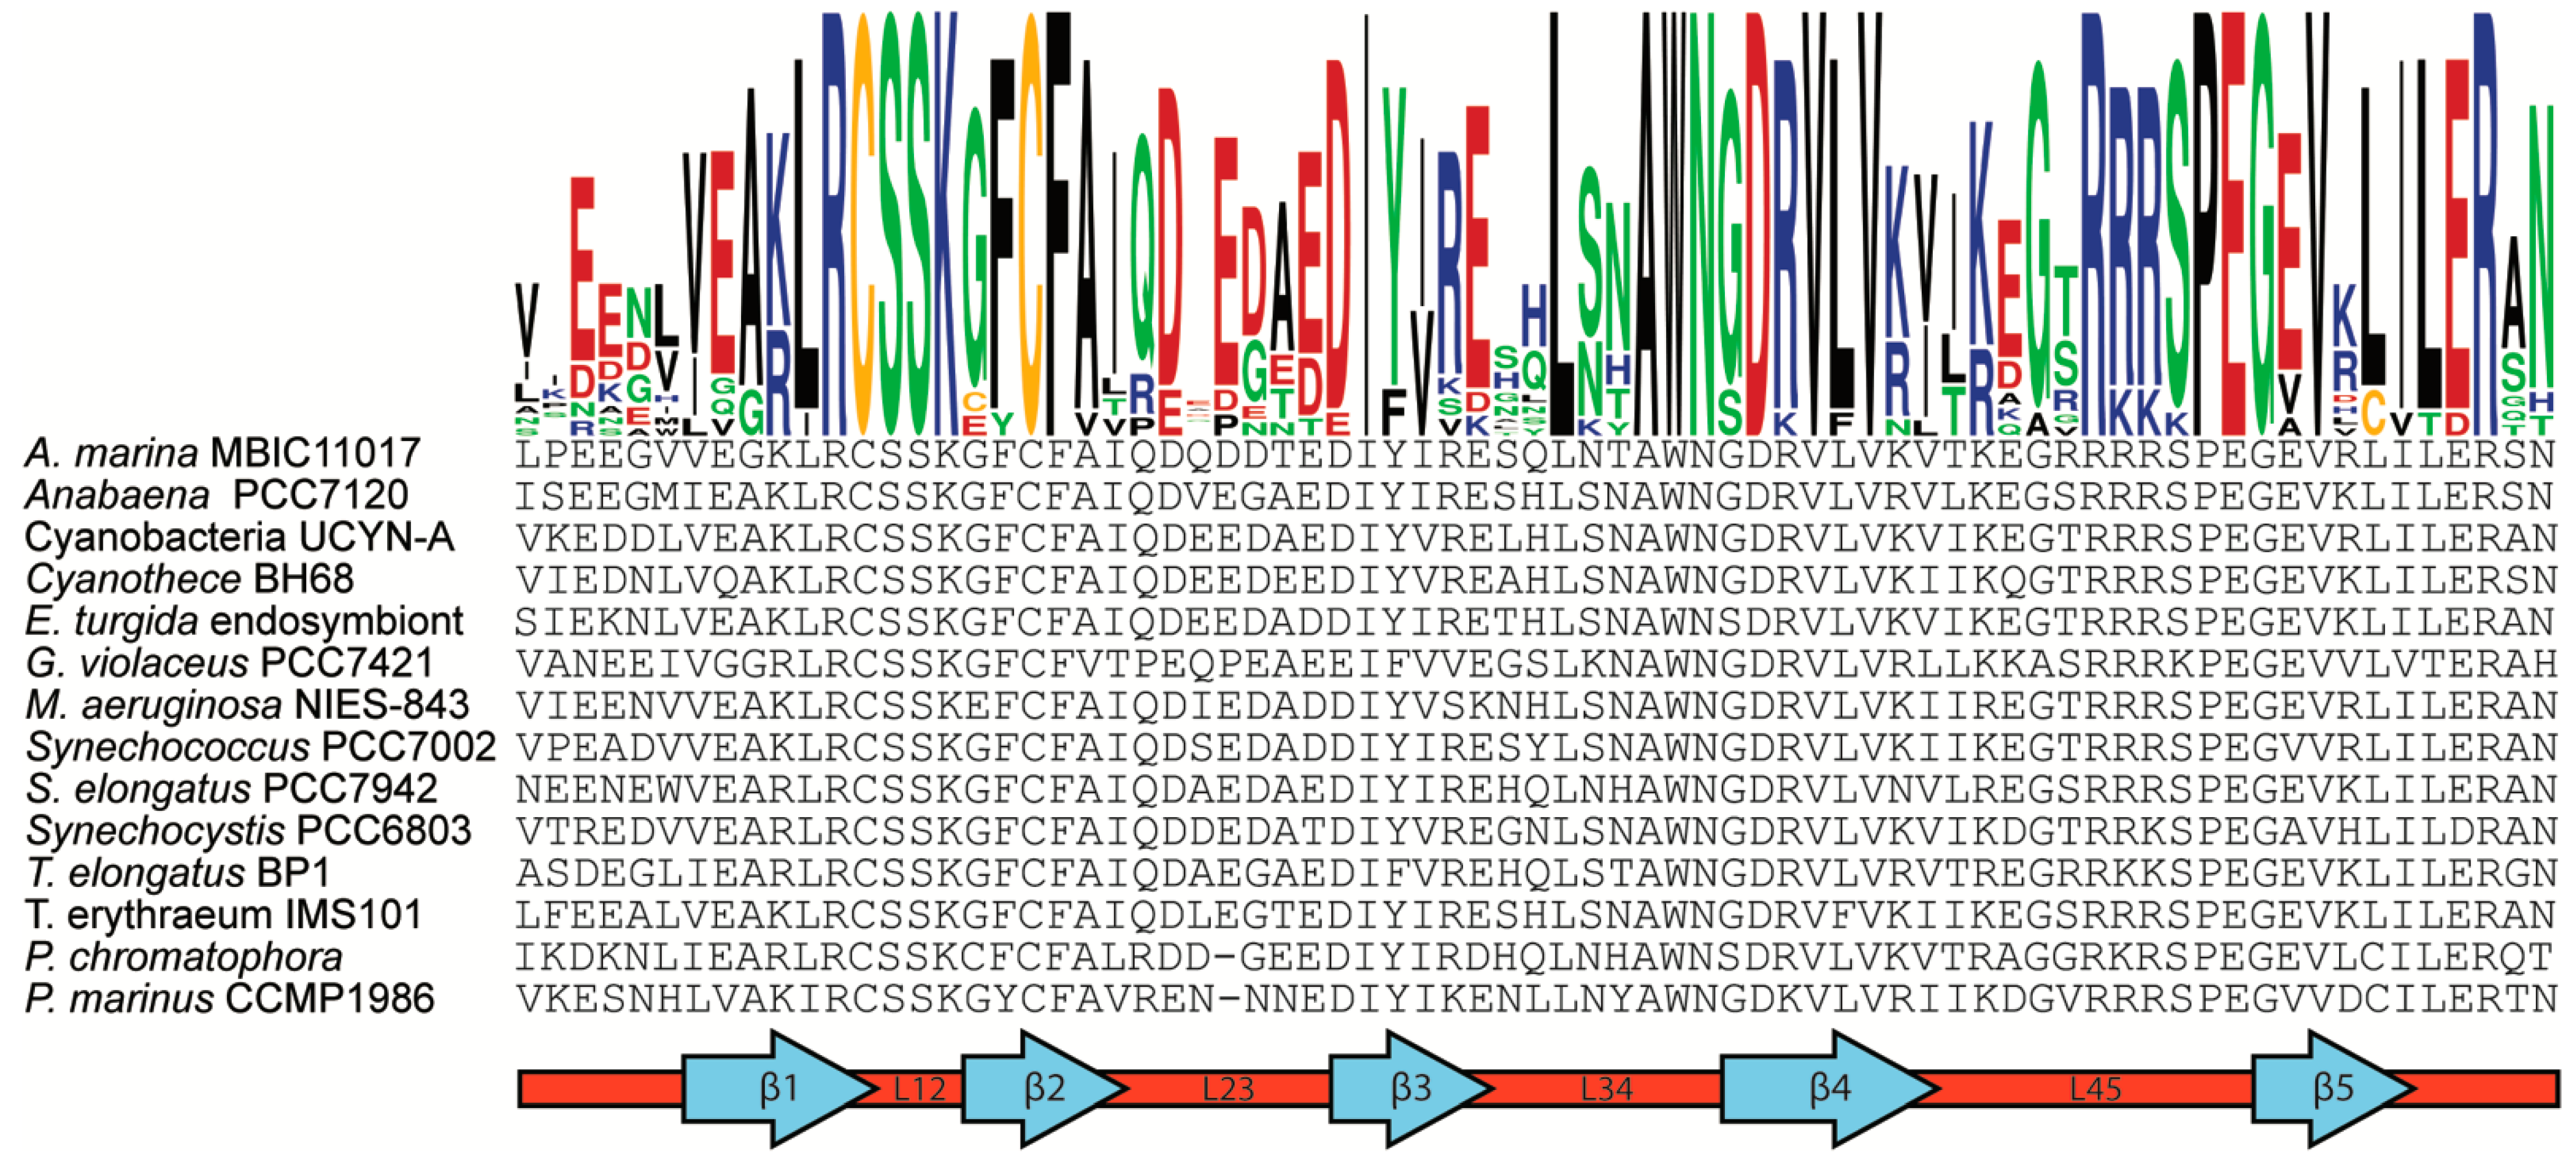
3.3. Zam Proteins Possess Conserved, Redox-Active Cysteines in CSD1
3.4. Analysis of CSD1 RNA Binding Potential
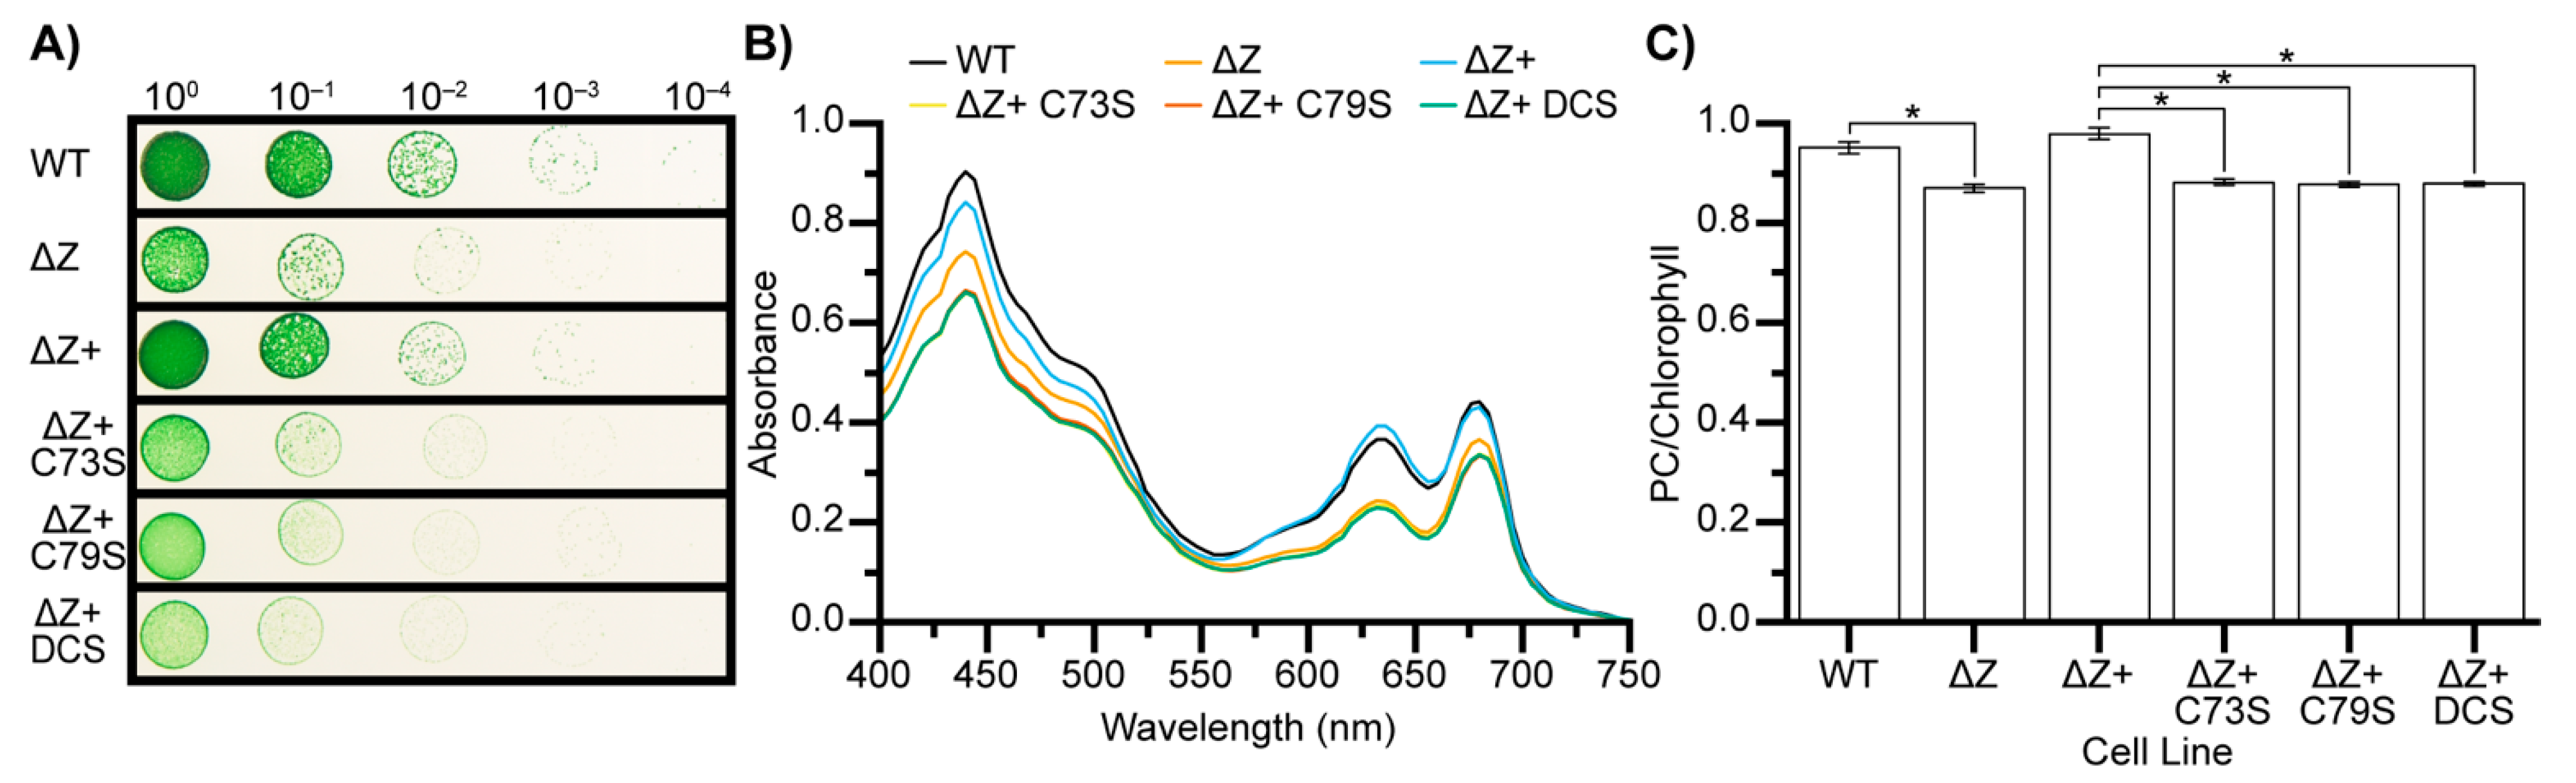
3.5. CSD1 Cysteine to Serine Mutants Phenocopy Zam Deletion
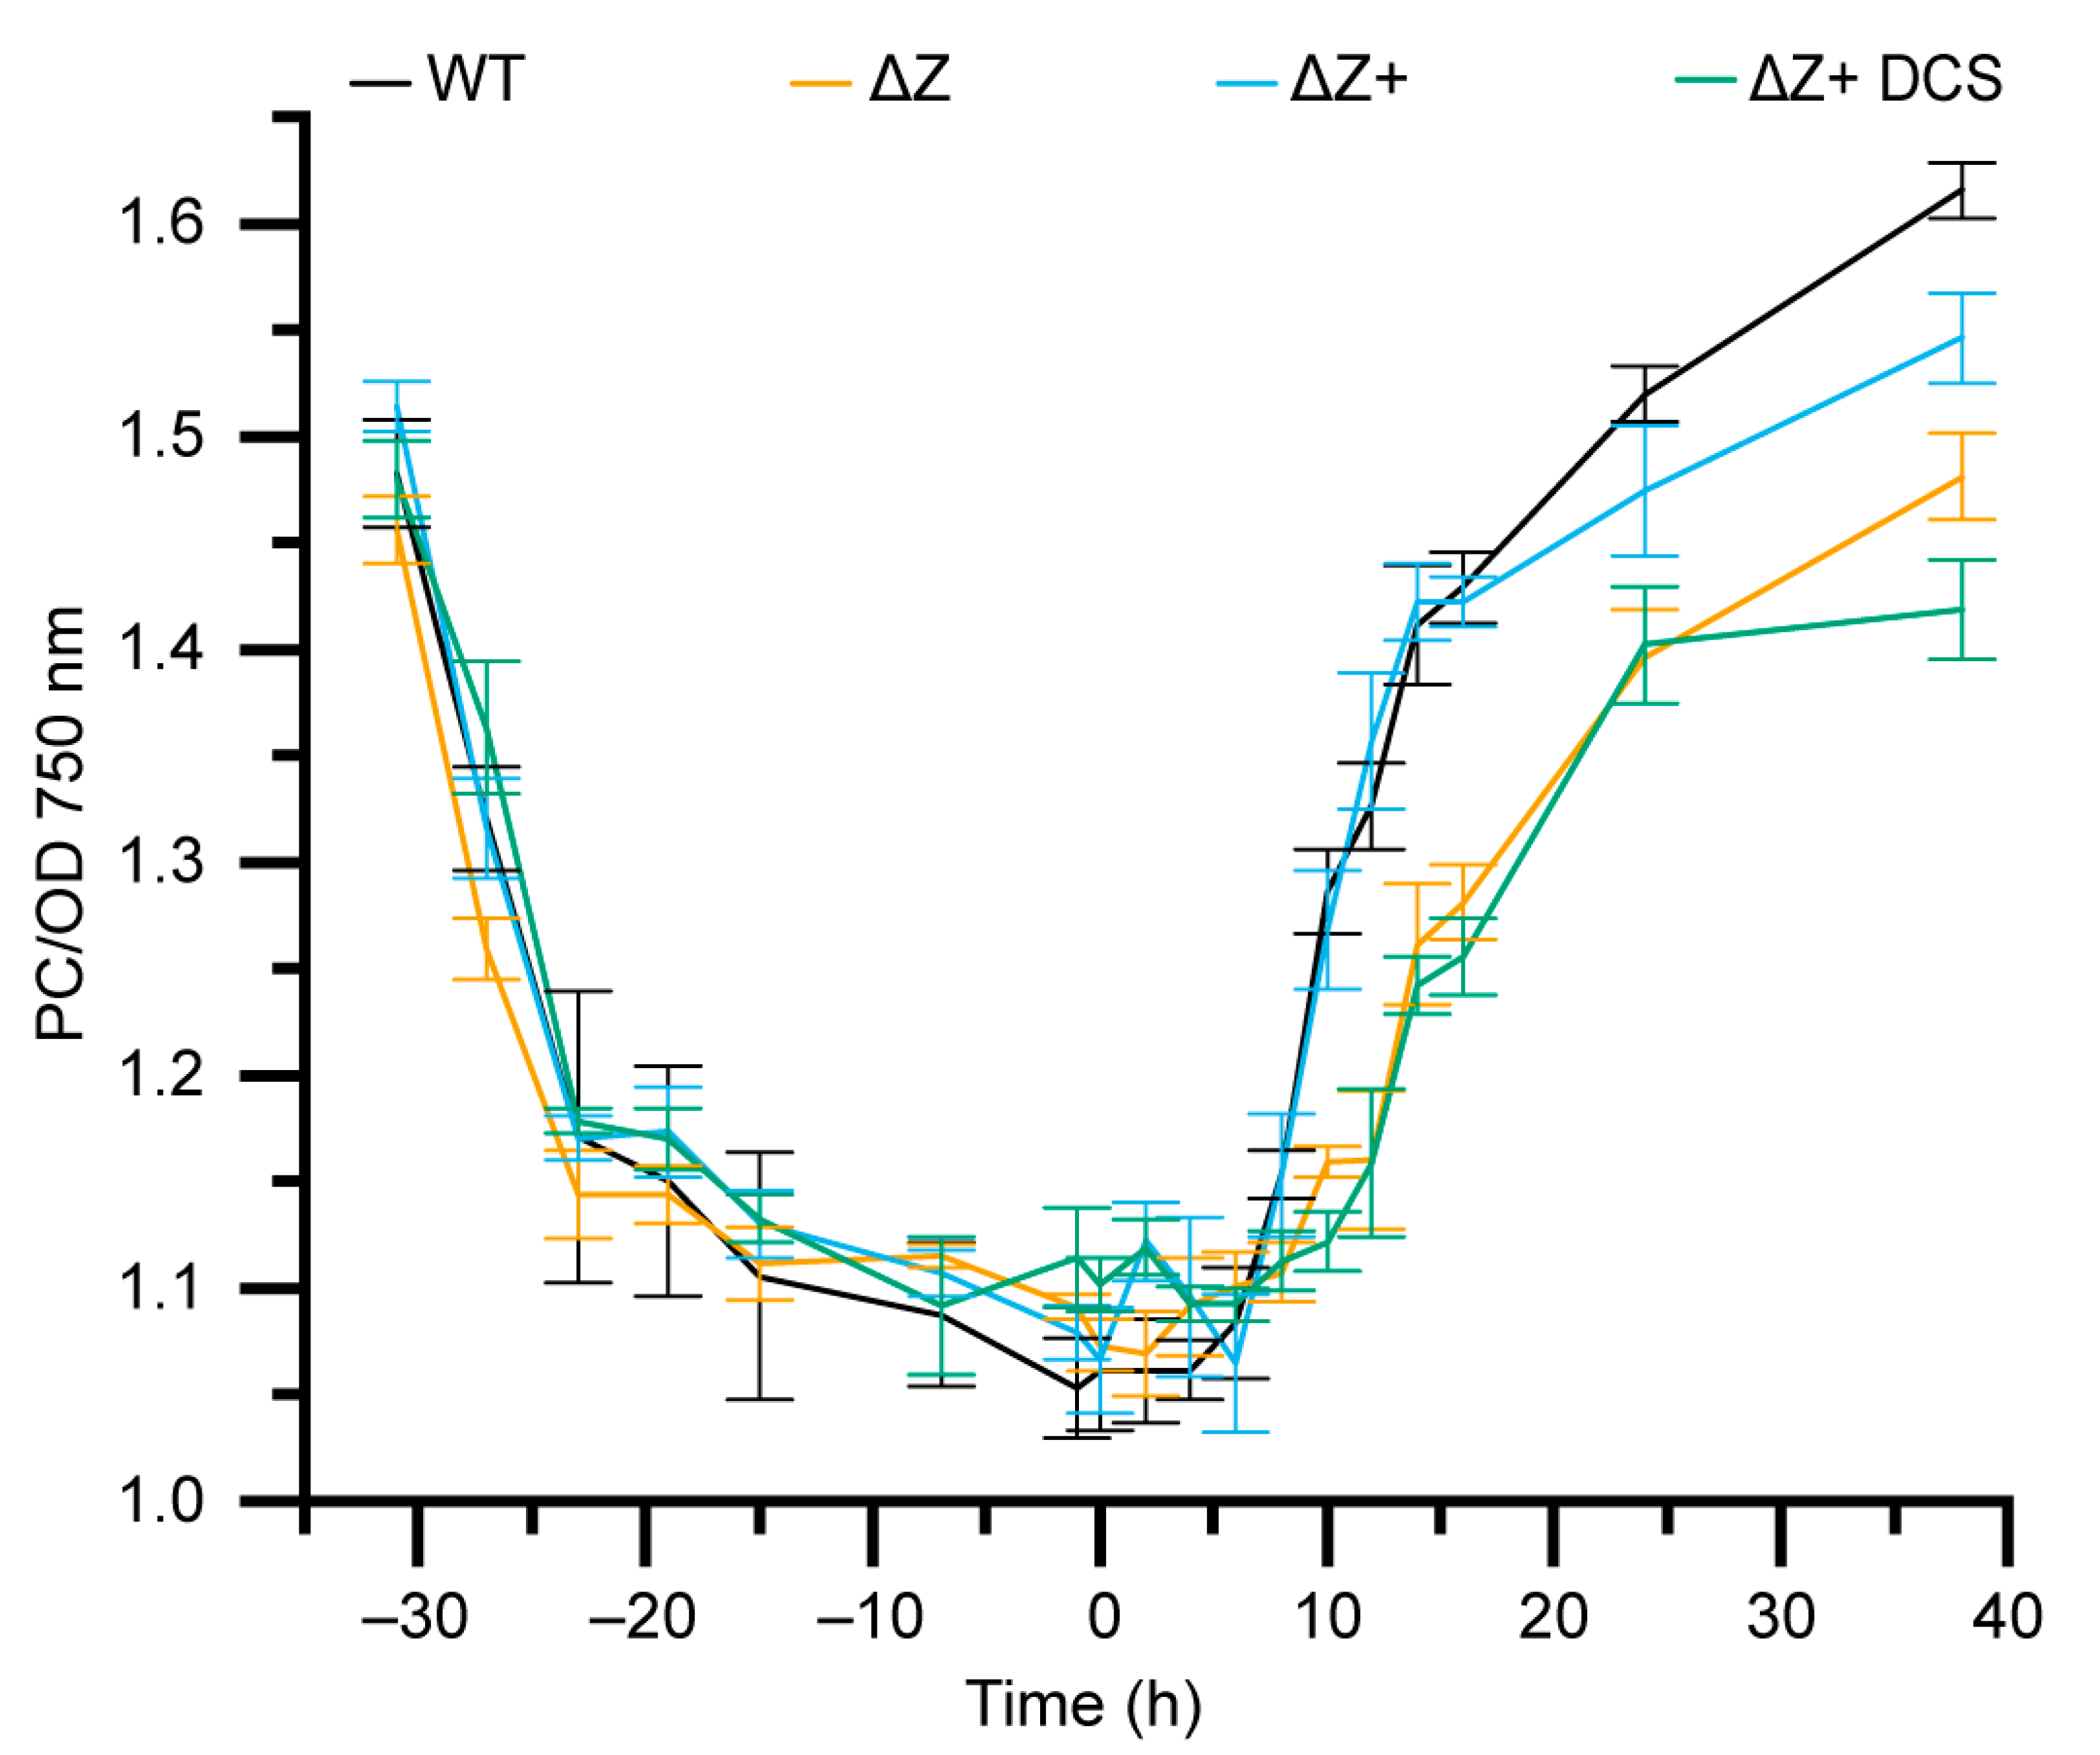
3.6. ΔZ and ΔZ+ DCS Exhibit Decreased Synthesis of Phycocyanin
3.7. ΔZ and Cysteine Mutants Exhibit Altered Photosynthetic Energy Transfer
3.8. Comparison of WT and ∆Z Growth and Fluorescence at Single-Cell Resolution
4. Discussion
Supplementary Materials
Author Contributions
Funding
Data Availability Statement
Acknowledgments
Conflicts of Interest
References
- Moisander, P.H.; Beinart, R.A.; Hewson, I.; White, A.E.; Johnson, K.S.; Carlson, C.A.; Montoya, J.P.; Zehr, J.P. Unicellular Cyanobacterial Distributions Broaden the Oceanic N2 Fixation Domain. Science 2010, 327, 1512–1514. [Google Scholar] [CrossRef] [PubMed]
- Hitchcock, A.; Hunter, C.N.; Canniffe, D.P. Progress and challenges in engineering cyanobacteria as chassis for light-driven biotechnology. Microb. Biotechnol. 2019, 13, 363–367. [Google Scholar] [CrossRef] [PubMed]
- Bédu, S.; Peltier, G.; Sarrey, F.; Joset, F. Properties of a Mutant from Synechocystis PCC6803 Resistant to Acetazolamide, an Inhibitor of Carbonic Anhydrase. Plant Physiol. 1990, 93, 1312–1315. [Google Scholar] [CrossRef] [PubMed]
- Beuf, L.; Bédu, S.; Cami, B.; Joset, F. A protein is involved in accessibility of the inhibitor acetazolamide to the carbonic anhydrase(s) in the cyanobacterium Synechocystis PCC 6803. Plant Mol. Biol. 1995, 27, 779–788. [Google Scholar] [CrossRef]
- Ansong, C.; Sadler, N.C.; Hill, E.A.; Lewis, M.P.; Zink, E.M.; Smith, R.D.; Beliaev, A.S.; Konopka, A.E.; Wright, A.T. Characterization of protein redox dynamics induced during light-to-dark transitions and nutrient limitation in cyanobacteria. Front. Microbiol. 2014, 5, 325. [Google Scholar] [CrossRef] [PubMed]
- Guo, J.; Nguyen, A.Y.; Dai, Z.; Su, D.; Gaffrey, M.J.; Moore, R.J.; Jacobs, J.M.; Monroe, M.E.; Smith, R.D.; Koppenaal, D.W.; et al. Proteome-wide Light/Dark Modulation of Thiol Oxidation in Cyanobacteria Revealed by Quantitative Site-specific Redox Proteomics. Mol. Cell. Proteom. 2014, 13, 3270–3285. [Google Scholar] [CrossRef]
- Cameron, J.C.; Gordon, G.C.; Pfleger, B.F. Genetic and genomic analysis of RNases in model cyanobacteria. Photosynth. Res. 2015, 126, 171–183. [Google Scholar] [CrossRef]
- Kujat, S.L.; Owttrim, G.W. Redox-Regulated RNA Helicase Expression. Plant Physiol. 2000, 124, 703–714. [Google Scholar] [CrossRef]
- Migur, A.; Heyl, F.; Fuss, J.; Srikumar, A.; Huettel, B.; Steglich, C.; Prakash, J.S.S.; Reinhardt, R.; Backofen, R.; Owttrim, G.W.; et al. The temperature-regulated DEAD-box RNA helicase CrhR interactome: Autoregulation and photosynthesis-related transcripts. J. Exp. Bot. 2021, 72, 7564–7579. [Google Scholar] [CrossRef]
- Rosana, A.R.R.; Ventakesh, M.; Chamot, D.; Patterson-Fortin, L.M.; Tarassova, O.; Espie, G.S.; Owttrim, G.W. Inactivation of a Low Temperature-Induced RNA Helicase in Synechocystis sp. PCC 6803: Physiological and Morphological Consequences. Plant Cell Physiol. 2012, 53, 646–658. [Google Scholar] [CrossRef]
- Georg, J.; Rosana, A.R.R.; Chamot, D.; Migur, A.; Hess, W.R.; Owttrim, G.W. Inactivation of the RNA helicase CrhR impacts a specific subset of the transcriptome in the cyanobacterium Synechocystis sp. PCC 6803. RNA Biol. 2019, 16, 1205–1214. [Google Scholar] [CrossRef] [PubMed]
- Arraiano, C.M.; Andrade, J.M.; Domingues, S.; Guinote, I.B.; Malecki, M.; Matos, R.G.; Moreira, R.N.; Pobre, V.; Reis, F.P.; Saramago, M.; et al. The critical role of RNA processing and degradation in the control of gene expression. FEMS Microbiol. Rev. 2010, 34, 883–923. [Google Scholar] [CrossRef] [PubMed]
- Uesono, Y.; Toh-e, A.; Kikuchi, Y. Ssd1p of Saccharomyces cerevisiae Associates with RNA. J. Biol. Chem. 1997, 272, 16103–16109. [Google Scholar] [CrossRef]
- Py, B.; Causton, H.; Mudd, E.A.; Higgins, C.F. A protein complex mediating mRNA degradation in Escherichia coli. Mol. Microbiol. 1994, 14, 717–729. [Google Scholar] [CrossRef] [PubMed]
- Purusharth, R.I.; Klein, F.; Sulthana, S.; Jäger, S.; Jagannadham, M.V.; Evguenieva-Hackenberg, E.; Ray, M.K.; Klug, G. Exoribonuclease R Interacts with Endoribonuclease E and an RNA Helicase in the Psychrotrophic Bacterium Pseudomonas syringae Lz4W. J. Biol. Chem. 2005, 280, 14572–14578. [Google Scholar] [CrossRef]
- Lu, F.; Taghbalout, A. The Escherichia coli major exoribonuclease RNase II is a component of the RNA degradosome. Biosci. Rep. 2014, 34, e00166. [Google Scholar] [CrossRef]
- Mian, I.S. Comparative sequence analysis of ribonucleases HII, III, II PH and D. Nucleic Acids Res. 1997, 25, 3187–3195. [Google Scholar] [CrossRef]
- Portnoy, V.; Schuster, G. RNA polyadenylation and degradation in different Archaea; roles of the exosome and RNase R. Nucleic Acids Res. 2006, 34, 5923–5931. [Google Scholar] [CrossRef]
- Zuo, Y.; Deutscher, M.P. Exoribonuclease superfamilies: Structural analysis and phylogenetic distribution. Nucleic Acids Res. 2001, 29, 1017–1026. [Google Scholar] [CrossRef]
- Cheng, Z.-F.; Deutscher, M.P. An Important Role for RNase R in mRNA Decay. Mol. Cell 2005, 17, 313–318. [Google Scholar] [CrossRef]
- Chu, L.-Y.; Hsieh, T.-J.; Golzarroshan, B.; Chen, Y.-P.; Agrawal, S.; Yuan, H.S. Structural insights into RNA unwinding and degradation by RNase R. Nucleic Acids Res. 2017, 45, 12015–12024. [Google Scholar] [CrossRef] [PubMed]
- Matos, R.G.; Fialho, A.M.; Giloh, M.; Schuster, G.; Arraiano, C.M. The rnb Gene of Synechocystis PCC6803 Encodes a RNA Hydrolase Displaying RNase II and Not RNase R Enzymatic Properties. PLoS ONE 2012, 7, e32690. [Google Scholar] [CrossRef] [PubMed]
- Altschul, S.F.; Gish, W.; Miller, W.; Myers, E.W.; Lipman, D.J. Basic local alignment search tool. J. Mol. Biol. 1990, 215, 403–410. [Google Scholar] [CrossRef]
- Pettersen, E.F.; Goddard, T.D.; Huang, C.C.; Couch, G.S.; Greenblatt, D.M.; Meng, E.C.; Ferrin, T.E. UCSF Chimera—A visualization system for exploratory research and analysis. J. Comput. Chem. 2004, 25, 1605–1612. [Google Scholar] [CrossRef]
- Roy, A.; Kucukural, A.; Zhang, Y. I-TASSER: A unified platform for automated protein structure and function prediction. Nat. Protoc. 2010, 5, 725–738. [Google Scholar] [CrossRef]
- Stevens, S.E.; Patterson, C.O.P.; Myers, J. The Production of Hydrogen Peroxide by Blue-Green Algae: A Survey. J. Phycol. 1973, 9, 427–430. [Google Scholar] [CrossRef]
- Gibson, D.G.; Young, L.; Chuang, R.-Y.; Venter, J.C.; Hutchison, C.A., III; Smith, H.O. Enzymatic assembly of DNA molecules up to several hundred kilobases. Nat. Methods 2009, 6, 343–345. [Google Scholar] [CrossRef]
- Moore, K.A.; Altus, S.; Tay, J.W.; Meehl, J.B.; Johnson, E.B.; Bortz, D.M.; Cameron, J.C. Mechanical regulation of photosynthesis in cyanobacteria. Nat. Microbiol. 2020, 5, 757–767. [Google Scholar] [CrossRef]
- Crooks, G.E. WebLogo: A Sequence Logo Generator. Genome Res. 2004, 14, 1188–1190. [Google Scholar] [CrossRef]
- Theobald, D.L.; Mitton-Fry, R.M.; Wuttke, D.S. Nucleic Acid Recognition by OB-Fold Proteins. Annu. Rev. Biophys. Biomol. Struct. 2003, 32, 115–133. [Google Scholar] [CrossRef]
- Amblar, M.; Arraiano, C.M. A single mutation in Escherichia coli ribonuclease II inactivates the enzyme without affecting RNA binding. FEBS J. 2004, 272, 363–374. [Google Scholar] [CrossRef] [PubMed]
- Frazao, C.; McVey, C.; Amblar, M.; Barbas, A.; Vonrhein, C.; Arraiano, C.; Carrondo, M.A. Unravelling the dynamics of RNA degradation by ribonuclease II and its RNA-bound complex. Nature 2006, 443, 110–114. [Google Scholar] [CrossRef] [PubMed]
- Nowack, E.C.; Melkonian, M.; Glöckner, G. Chromatophore Genome Sequence of Paulinella Sheds Light on Acquisition of Photosynthesis by Eukaryotes. Curr. Biol. 2008, 18, 410–418. [Google Scholar] [CrossRef] [PubMed]
- Nakayama, T.; Kamikawa, R.; Tanifuji, G.; Kashiyama, Y.; Ohkouchi, N.; Archibald, J.M.; Inagaki, Y. Complete genome of a nonphotosynthetic cyanobacterium in a diatom reveals recent adaptations to an intracellular lifestyle. Proc. Natl. Acad. Sci. USA 2014, 111, 11407–11412. [Google Scholar] [CrossRef] [PubMed]
- Buchanan, B.B.; Balmer, Y. Redox Regulation: A Broadening Horizon. Annu. Rev. Plant Biol. 2005, 56, 187–220. [Google Scholar] [CrossRef]
- Lane, L.C. A simple method for stabilizing protein-sulfhydryl groups during SDS-gel electrophoresis. Anal. Biochem. 1978, 86, 655–664. [Google Scholar] [CrossRef]
- Jumper, J.; Evans, R.; Pritzel, A.; Green, T.; Figurnov, M.; Ronneberger, O.; Tunyasuvunakool, K.; Bates, R.; Žídek, A.; Potapenko, A. Highly accurate protein structure prediction with AlphaFold. Nature 2021, 596, 583–589. [Google Scholar] [CrossRef]
- Varadi, M.; Anyango, S.; Deshpande, M.; Nair, S.; Natassia, C.; Yordanova, G.; Yuan, D.; Stroe, O.; Wood, G.; Laydon, A.; et al. AlphaFold Protein Structure Database: Massively expanding the structural coverage of protein-sequence space with high-accuracy models. Nucleic Acids Res. 2022, 50, D439–D444. [Google Scholar] [CrossRef]
- Amblar, M.; Barbas, A.; Fialho, A.; Arraiano, C.M. Characterization of the Functional Domains of Escherichia coli RNase II. J. Mol. Biol. 2006, 360, 921–933. [Google Scholar] [CrossRef]
- Lorentzen, E.; Basquin, J.; Tomecki, R.; Dziembowski, A.; Conti, E. Structure of the Active Subunit of the Yeast Exosome Core, Rrp44: Diverse Modes of Substrate Recruitment in the RNase II Nuclease Family. Mol. Cell 2008, 29, 717–728. [Google Scholar] [CrossRef]
- Allen, M.M.; Smith, A.J. Nitrogen chlorosis in blue-green algae. Arch. Mikrobiol. 1969, 69, 114–120. [Google Scholar] [CrossRef] [PubMed]
- Stevens, S.E.; Balkwill, D.L.; Paone, D.A.M. The Effects of Nitrogen Limitation on the Ultrastructure of the Cyanobacterium Agmeneilum quadruplicatum. Arch. Microbiol. 1981, 130, 204–212. [Google Scholar] [CrossRef]
- Hill, N.C.; Tay, J.W.; Altus, S.; Bortz, D.M.; Cameron, J.C. Life cycle of a cyanobacterial carboxysome. Sci. Adv. 2020, 6, eaba1269. [Google Scholar] [CrossRef] [PubMed]
- Donovan, W.P.; Kushner, S.R. Polynucleotide phosphorylase and ribonuclease II are required for cell viability and mRNA turnover in Escherichia coli K-12. Proc. Natl. Acad. Sci. USA 1986, 83, 120–124. [Google Scholar] [CrossRef] [PubMed]
- Cheng, Z.-F.; Zuo, Y.; Li, Z.; Rudd, K.E.; Deutscher, M.P. The vacB Gene Required for Virulence in Shigella flexneri and Escherichia coli Encodes the Exoribonuclease RNase R. J. Biol. Chem. 1998, 273, 14077–14080. [Google Scholar] [CrossRef]
- Cheng, Z.-F.; Deutscher, M.P. Quality control of ribosomal RNA mediated by polynucleotide phosphorylase and RNase R. Proc. Natl. Acad. Sci. USA 2003, 100, 6388–6393. [Google Scholar] [CrossRef]
- Zhou, C.; Zhang, J.; Hu, X.; Li, C.; Wang, L.; Huang, Q.; Chen, W. RNase II binds to RNase E and modulates its endoribonucleolytic activity in the cyanobacterium Anabaena PCC 7120. Nucleic Acids Res. 2020, 48, 3922–3934. [Google Scholar] [CrossRef]


Publisher’s Note: MDPI stays neutral with regard to jurisdictional claims in published maps and institutional affiliations. |
© 2022 by the authors. Licensee MDPI, Basel, Switzerland. This article is an open access article distributed under the terms and conditions of the Creative Commons Attribution (CC BY) license (https://creativecommons.org/licenses/by/4.0/).
Share and Cite
Thomas, P.E.; Gates, C.; Campodonico-Burnett, W.; Cameron, J.C. Zam Is a Redox-Regulated Member of the RNB-Family Required for Optimal Photosynthesis in Cyanobacteria. Microorganisms 2022, 10, 1055. https://doi.org/10.3390/microorganisms10051055
Thomas PE, Gates C, Campodonico-Burnett W, Cameron JC. Zam Is a Redox-Regulated Member of the RNB-Family Required for Optimal Photosynthesis in Cyanobacteria. Microorganisms. 2022; 10(5):1055. https://doi.org/10.3390/microorganisms10051055
Chicago/Turabian StyleThomas, Patrick E., Colin Gates, William Campodonico-Burnett, and Jeffrey C. Cameron. 2022. "Zam Is a Redox-Regulated Member of the RNB-Family Required for Optimal Photosynthesis in Cyanobacteria" Microorganisms 10, no. 5: 1055. https://doi.org/10.3390/microorganisms10051055
APA StyleThomas, P. E., Gates, C., Campodonico-Burnett, W., & Cameron, J. C. (2022). Zam Is a Redox-Regulated Member of the RNB-Family Required for Optimal Photosynthesis in Cyanobacteria. Microorganisms, 10(5), 1055. https://doi.org/10.3390/microorganisms10051055