Article

Modeling and Compensation of a Bimorph Type Piezoelectric Actuator Exhibiting Odd-Harmonic Oscillation and Frequency-Dependent, Interleaved Hysteresis

Department of Mechanical Engineering, Yamaguchi University, 2-16-1, Tokiwadai, Ube City 755-8611, Yamaguchi, Japan
*
Author to whom correspondence should be addressed.
These authors contributed equally to this work.
This author primarily contributed to the experimental part of the work.
Actuators 2020, 9(2), 36; https://doi.org/10.3390/act9020036
Submission received: 27 March 2020 / Revised: 28 April 2020 / Accepted: 30 April 2020 / Published: 5 May 2020

Abstract

:
This paper proposes an improved version of the play model for capturing the frequency-dependent hysteresis of a bimorph piezoelectric actuator that includes odd harmonic oscillation and interleaved hysteresis. The proposed model used a single mathematical structure to capture the changes in the actuator response observed with the increase in the input signal frequency. The refinements on the structure of the original play model for capturing the peculiar behavior of the bimorph piezoelectric actuator have been addressed in detail. The parameter identification has been conducted extensively for a range of 1 Hz to 110 Hz, which exceeds the resonance frequency specified by the manufacturer of the actuator. Improved modeling accuracy was confirmed as compared with our previous enhanced Bouc–Wen model based on the calculation of the fitness index. We also attempted to synthesize a hysteresis compensator based on direct inverse multiplication; the results of the experimental validation of the proposed control system are disclosed.

1. Introduction

Piezoelectric actuators are one of the new-generation actuators that function on the principle referred to as the inverse piezoelectric effect. They have been attracting great attention both from researchers and the practitioners for decades owing to their attractive features, such as high positioning resolution and rapid response. A comparative example of the new-generation actuator is the magnetostrictive actuator [1]. Magnetostrictive actuator utilizes a material which exhibits magnetostriction-physical phenomenon of certain material that shows elastic deformation under magnetic field. Both piezoelectric and magnetostrictive materials exhibit inverse phenomenon, and they can be used not only as actuators but also as sensors. Piezoelectric actuators tend to be used in small size applications whereas the magnetostrictive actuators can be applied to large scale target in which kW order output is necessary. Both exhibit similar mechanical characteristics if their sizes are similar. Piezoelectric actuator is basically a source of linear vibration whereas magnetostrictive actuators can also be used as a power source of planar motion. Recent literature revealed that piezoelectricity was found in organic biomaterials [2] that were successfully applied to several biomedical devices.
Many applications of the piezoelectric actuators can be found in recent literature. Stefanski et al. [3] used the piezo stack ring actuator to control hydraulic valves. Liu and Guo [4] applied a stack type piezoelectric actuator for the position control of laser focusing equipment. Piezo bimorph actuators were successfully implemented in the field of micro-manipulation. El-Sayed et al. [5] developed a micro-gripper using a piezo bimorph actuator and evaluated its characteristics both theoretically and experimentally. Jain et al. [6] developed a mobile micro-manipulation system for peg-in-hole assembly in which a compliant piezoelectric actuator was used. They demonstrated that the developed gripper could perform the assigned task. However, they also pointed out that the transient motion paths of the actuator for obtaining the desired strain for manipulation differed depending on the driving voltage history determined by the PD feedback control law. The observed phenomenon was caused by the hysteresis nonlinearity of the piezoelectric actuator. The tracking accuracy would severely deteriorate unless the hysteresis was properly compensated.
Significant efforts have been devoted to the mathematical modeling and hysteresis compensation for piezoelectric actuators. Historically, hysteresis nonlinearity has been treated as an uncertainty of a nominal linear element, and several robust control techniques have been applied. Tsai and Chen [7] applied the H control to compensate for the uncertainty. Alternative and intensively studied approaches in the literature include the usage of phenomenological hysteresis models [8]. Examples include the Prandtl–Ishlinskii (PI) model [9], the Preisach model [10], the play and stop models [11,12], the Bouc–Wen model [13], and the Duhem model [14]. These phenomenological models are able to capture hysteretic behaviors accurately. The use of these models for the compensation of hysteresis generally requires the calculation of their inverse hysteresis models, and the results are used as feed-forward controllers for the actuator.
Real-world piezoelectric actuators exhibit rate/frequency-dependent hysteresis. The inverse hysteresis model solution for the compensation of hysteresis nonlinearity requires the development of rate/frequency-dependent hysteresis models. Al Janaideh et al. [15] introduced a rate-dependent threshold in the play operator in their PI model to capture the increased dominance of the hysteretic behavior on the increase of driving velocity or frequency. Yang et al. [9,16] introduced the envelope function to the play operator of the PI model to capture the increasing amplitude of the hysteresis loop, as the frequency of the driving signal increases. Xiao and Li [10] proposed the modified inverse Preisach model that uses the weighted sum of the distribution functions, each of which is identified by a pure sinusoidal input for compensating frequency-dependent hysteresis.
We have been working for several years on the modeling and compensation of frequency-dependent hysteresis of the bimorph piezoelectric actuator (PZBA-00030, FDK Co., Tokyo, Japan) shown in Figure 1. Its bandwidth is comparably lower than that of stack type piezoelectric actuators. However, it exhibits very complex frequency-dependent hysteresis in its response, which captivated our interest. There are several driving frequencies whose responses include large odd harmonic oscillation. It even shows the interleaved hysteresis in which both clockwise and counterclockwise loops are included in a single period of response at some driving frequency.
Li et al. [17] stated that the odd harmonic oscillation of a piezoelectric actuator is caused by the hysteresis nonlinearity. They regarded the odd harmonic component of the response as a disturbance and synthesized a repetitive controller for its attenuation. We previously proposed an enhanced Bouc–Wen model for capturing odd harmonic oscillation induced by a pure sinusoidal input at some driving frequency and proposed a corresponding compensator [13] based on the direct inverse multiplication proposed by Rakotondrabe [18].
Regarding the interleaved hysteresis, Alatawneh and Pillay [19] recently showed that interleaved hysteresis could be captured by the Preisach model by relaxing certain constraints in its distribution function. To the best of our knowledge, only a few results exist on the modeling of interleaved hysteresis, but no result disclosing its compensation methods can be found in the literature.
We recently reported a phenomenological model of hysteresis for the bimorph actuator that covers (a) hysteretic behavior including odd harmonic oscillation at a lower frequency range, (b) interleaved hysteresis over its mechanical resonance, and (c) highly asymmetric large hysteresis loop at much higher frequencies with a single mathematical structure [20]. However, we have not evaluated the use of the proposed model for hysteresis compensation. This fact motivates our current research, which attempts to synthesize a hysteresis compensator using the modified version of our model in [20].
The present article proposes a phenomenological hysteresis model for the bimorph piezoelectric actuator based on the modified play model; its use in the compensation of hysteresis that can be observed over the available bandwidth (1–110 Hz) of the actuator. The modified play model which captures frequency-dependent hysteresis is proposed in Section 2. The development of the model for the refined treatment of the interleaved hysteresis, and odd harmonic oscillation is continued in Section 3. The compensator design based on the developed model is explained in Section 4. The results of the experiments for evaluating the modeling accuracy and hysteresis compensation performance is reported in Section 5. The summarizing conclusion, along with some future work implications, is given in Section 6.

2. Hysteresis Modeling with the Play Model

2.1. Play Model

The classical play model is a form of phenomenological model of hysteresis. It defines a hysteretic relation between the input and the output signal sequences by using the superposition of the shape function f ( p r p [ u ( t ) ] , r p ) . The output of the model is defined by
P [ u ( t ) ] = 0 u m a x f ( p r p [ u ( t ) ] , r p ) d r p ,
where u ( t ) is the input sequence. r p [ 0 , u m a x ] is the parameter that limits the width of the play operator p r p . The output of p r p is defined by
p r p [ u ( t ) ] = max { min { q , u ( t ) + r p } , u ( t ) r p } ( t k < t < t k + 1 , k = 0 , 1 , ) ,
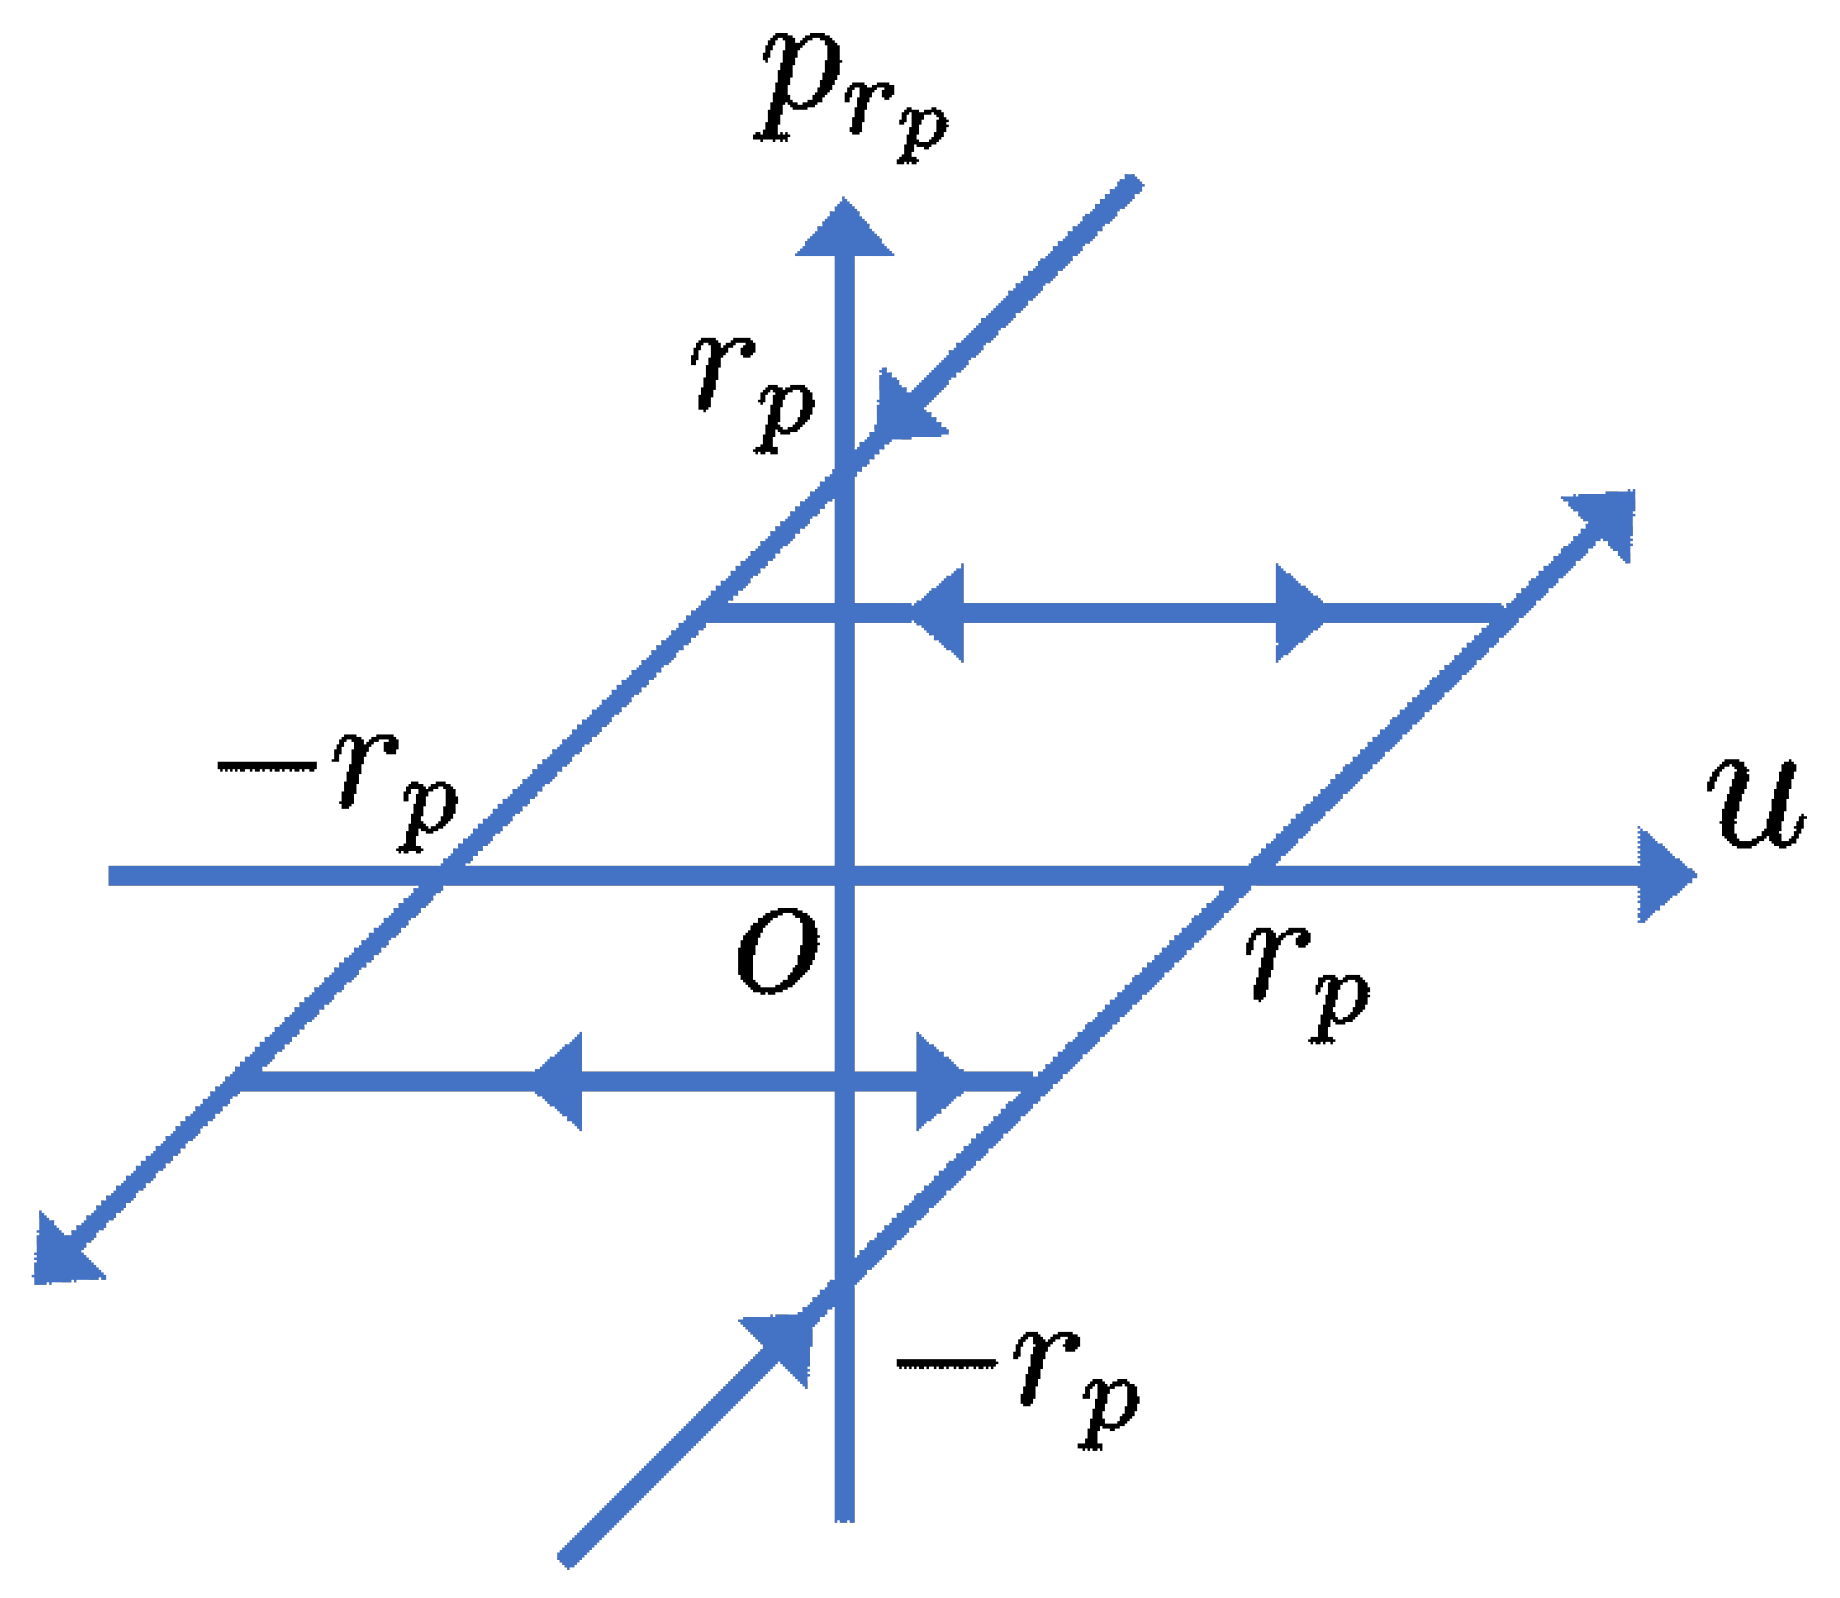
where q = p r p [ u ( t k ) ] is the output of the play operator to the input u ( t k ) . The behavior of the play operator is illustrated in Figure 2. The shape function f ( p r p [ u ( t ) ] , r p ) in Equation (1) is defined by
f ( p r p [ u ( t ) ] , r p ) = u m a x + r p u m a x r p σ ( p , r p ) x p ( p r p [ u ( t ) ] , p , r p ) d p ,
where σ ( p , r p ) is a distribution function, and x p ( p r p [ u ( t ) ] , p , r p ) is defined by [21]
x p ( p r p [ u ( t ) ] , p , r p ) = p r p [ u ( t ) ] p u m a x r p .
If we assume σ ( p , r p ) > 0 for all possible p and r p , the play model produces a counterclockwise hysteresis loop. Alatawneh and Pillay recently proposed a PI model and a Preisach model that can capture the interleaved hysteresis by removing the sign assumption on the distribution function. We followed their approach and removed the assumption σ ( p , r p ) > 0 ( p , r p ) from our model in the calculation.

2.2. Modification of the Play Model for Frequency Dependent Hysteresis

The hysteresis loop of piezoelectric actuators tends to be large and round, as the frequency of the driving signal increases. This phenomenon is referred to as the frequency-dependent hysteresis [22]. For introducing frequency dependence to the play model, we modified the play operator defined by Equation (2) by
p r p [ u ( t ) ] = max { min { q , h r ( u ( t ) , u ˙ ( t ) ) + r p } , h l ( u ( t ) , u ˙ ( t ) ) r p } ,
where h r ( u ( t ) , u ˙ ( t ) ) , and h l ( u ( t ) , u ˙ ( t ) ) are the envelope function defined by [16]
h r ( u ( t ) , u ˙ ( t ) ) = u ( t ) + β | u ˙ ( t ) |
h l ( u ( t ) , u ˙ ( t ) ) = u ( t ) α | u ˙ ( t ) | .
α and β are the positive constants to be identified. When the input is increasing(decreasing), h l ( h r ) is used for calculation. These envelope functions attenuate the change of the output of the play operator when the rate | u ˙ | is large. Therefore, they contribute to the increase in the hysteresis nonlinearity. The asymmetricity of a hysteresis loop about the origin of the input/output plane could be introduced to the model if we set α β . We used this modified play operator for the remaining development of the model and the controller.

2.3. Discretization of the Play Model

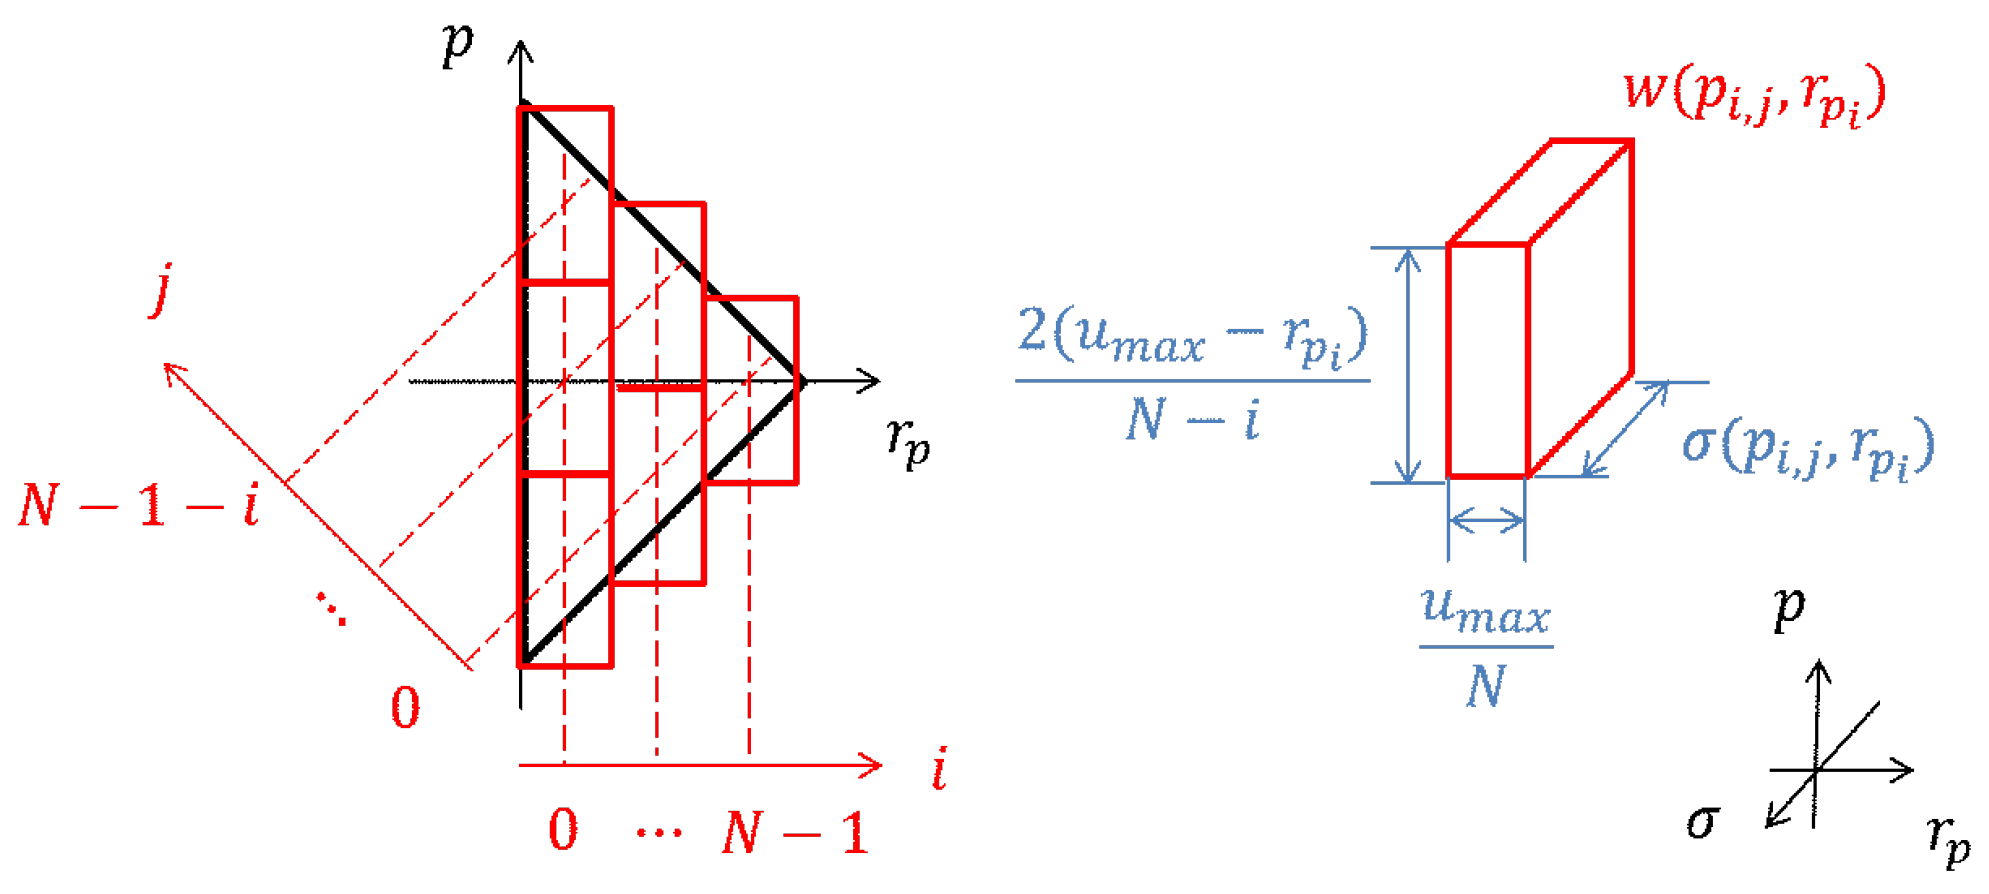
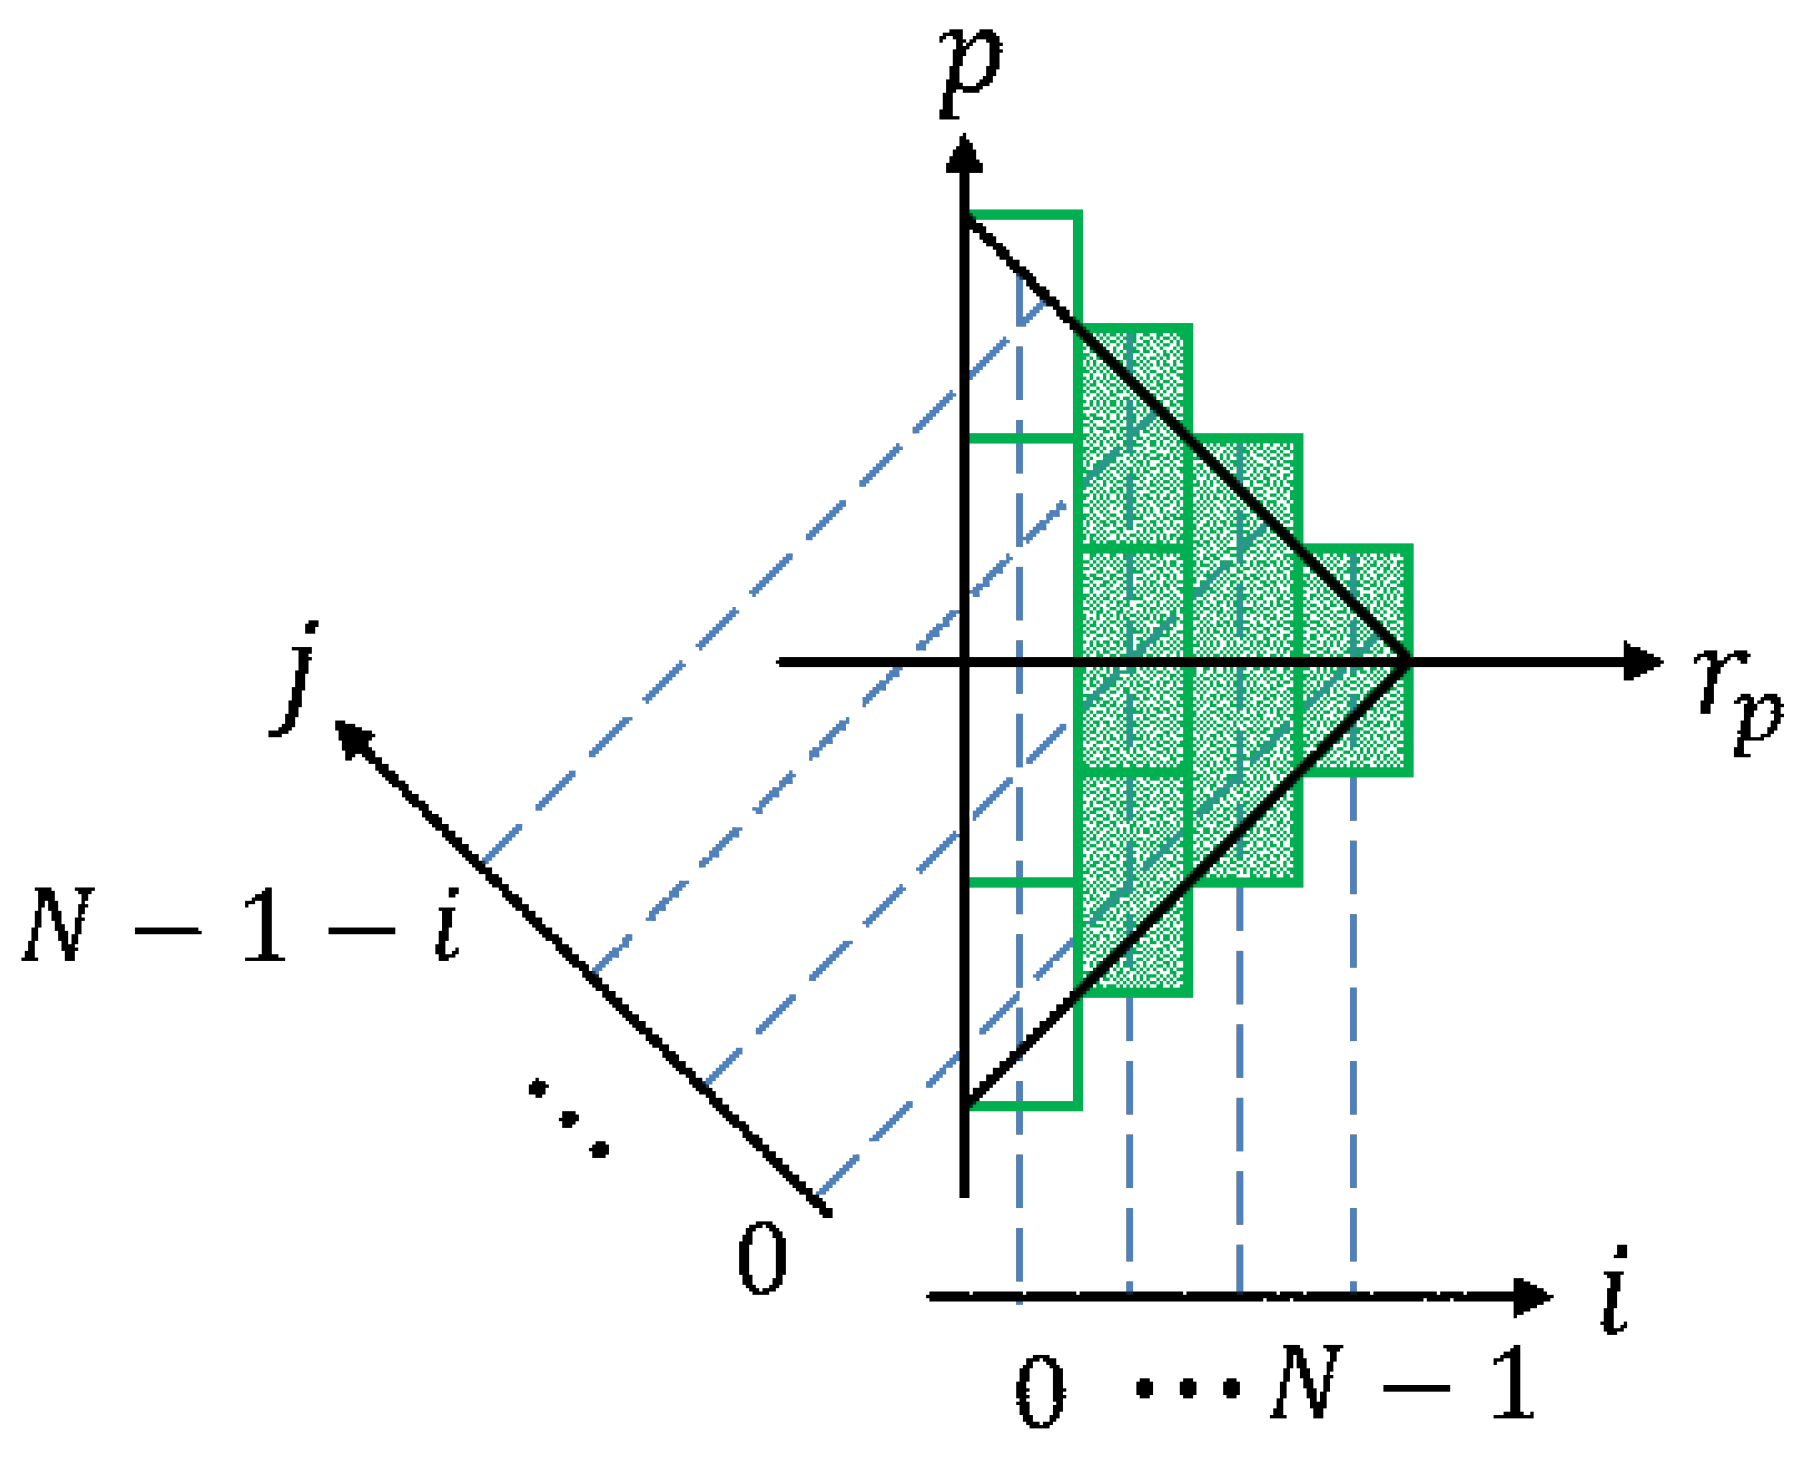
The play model is discretized for facilitating digital computer implementation. Let d t denote the sampling interval and let k be the discrete time step index indicating the current time t = k d t . The current input u ( t ) is denoted by u [ k ] in the discrete time representation. The discretized p r p plane is shown in Figure 3. Two principle axes variables p and r p are discretized by
r p i = i · u m a x N ( i = 0 , 1 , , N 1 ) p i , j = ( 2 j N + 1 + i ) u m a x r p i N i ( j = 0 , , N 1 i ) ,
where i and j are the indices shown in the figure and N is the number of divisions of these variables. We used N = 10 throughout the study. Let x p a vector defined by
x p = [ x p ( p r p 0 [ u [ k ] ] , p 0 , 0 , r p 0 ) , , x p ( p r p 0 [ u [ k ] ] , p 0 , N 1 , r p 0 ) i = 0 , , x p ( p r p i [ u [ k ] ] , p i , 0 , r p i ) , , x p ( p r p i [ u [ k ] ] , p i , N 1 i , r p i ) i , , x p ( p r p N 1 [ u [ k ] ] , p N 1 , 0 , r p N 1 ) i = N 1 ] T
which amounts to x p ( p r p 0 [ u [ k ] ] , p 0 , 0 , r p 0 ) in Equation (3), and let ω ( p i , j , r p i ) be the new distribution function for the discretized play model defined by
ω ( p i , j , r p i ) = σ ( p i , j , r p i ) · 2 ( u m a x r p i ) N i · u m a x N = ω i , j .
The output of the classical play model can be calculated accordingly by
P [ u [ k ] ] = i = 0 N 1 j = 0 N 1 i ω i , j · x p ( p r p i [ u [ k ] ] , p i , j , r p i ) = ω T x p ,
where ω represents an array of ω ( p i , j , r p i ) arranged in a suitable order.
Subsequently, we discretized the modified play model which incorporates frequency dependence. We began from the case when the input u decreases over the threshold and so does the output of the play operator. The play operator defined by Equation (5) takes the value p r p = h r ( u , u ˙ ) + r p i in this case. Introducing Equation (5) to Equation (4), we have
x p ( p r p [ u [ k ] ] , p i , j , r p i ) = u [ k ] + r p i p i , j u m a x r p i + β | u [ k + 1 ] u [ k ] | d t ( u m a x r p i ) ,
if we calculate u ˙ [ t ] by ( u [ k + 1 ] u [ k ] ) / d t . The output of the modified play model can be formulated by
P [ u [ k ] ] = i = 0 N 1 j = 0 N 1 i ω i , j u [ k ] + r p i p i , j u m a x r p i + β | u [ k + 1 ] u [ k ] | d t ( u m a x r p i ) ω ¯ T x ¯ p ,
where ω ¯ , and x ¯ p are defined by
x ¯ p = x p T , i = 0 N 1 j = 0 N 1 i ω i , j | t = ( k 1 ) d t | u [ k + 1 ] u [ k ] | d t ( u m a x r p i ) T
and
ω ¯ = [ ω T , β ] T ,
respectively. We noted that the final expression of Equation (11) is not strictly identical to its previous expression. This can be attributed to the bilinear term ω i , j β in the first expression of Equation (11). We used the previous time step values of ω i , j in Equation (12) to have a linearly parameterized form of P [ u [ k ] ] , which is suitable for parameter identification. The case where u increases over the threshold can be treated in a similar manner as done in the calculation for the decreasing input. The rate/frequency-dependent play model is finally formulated as
P [ u [ k ] ] = X T θ ,
where X and θ are defined to be
X = [ x p T , x α , x β ] T
and
θ = [ ω T , α , β ] T ,
respectively. x α and x β in Equation (15) are given by
x α = i , j ω i , j | t = ( k 1 ) d t | u [ k + 1 ] u [ k ] | d t ( u m a x r p i ) ,
and
x β = i ˜ , j ω i ˜ , j | t = ( k 1 ) d t | u [ k + 1 ] u [ k ] | d t ( u m a x r p i ˜ ) ( i i ˜ ) ,
respectively.

3. Modification of the Play Model to Capture Frequency Dependent Hysteresis

3.1. Modification of the Model Structure to Capture Structural Behavior

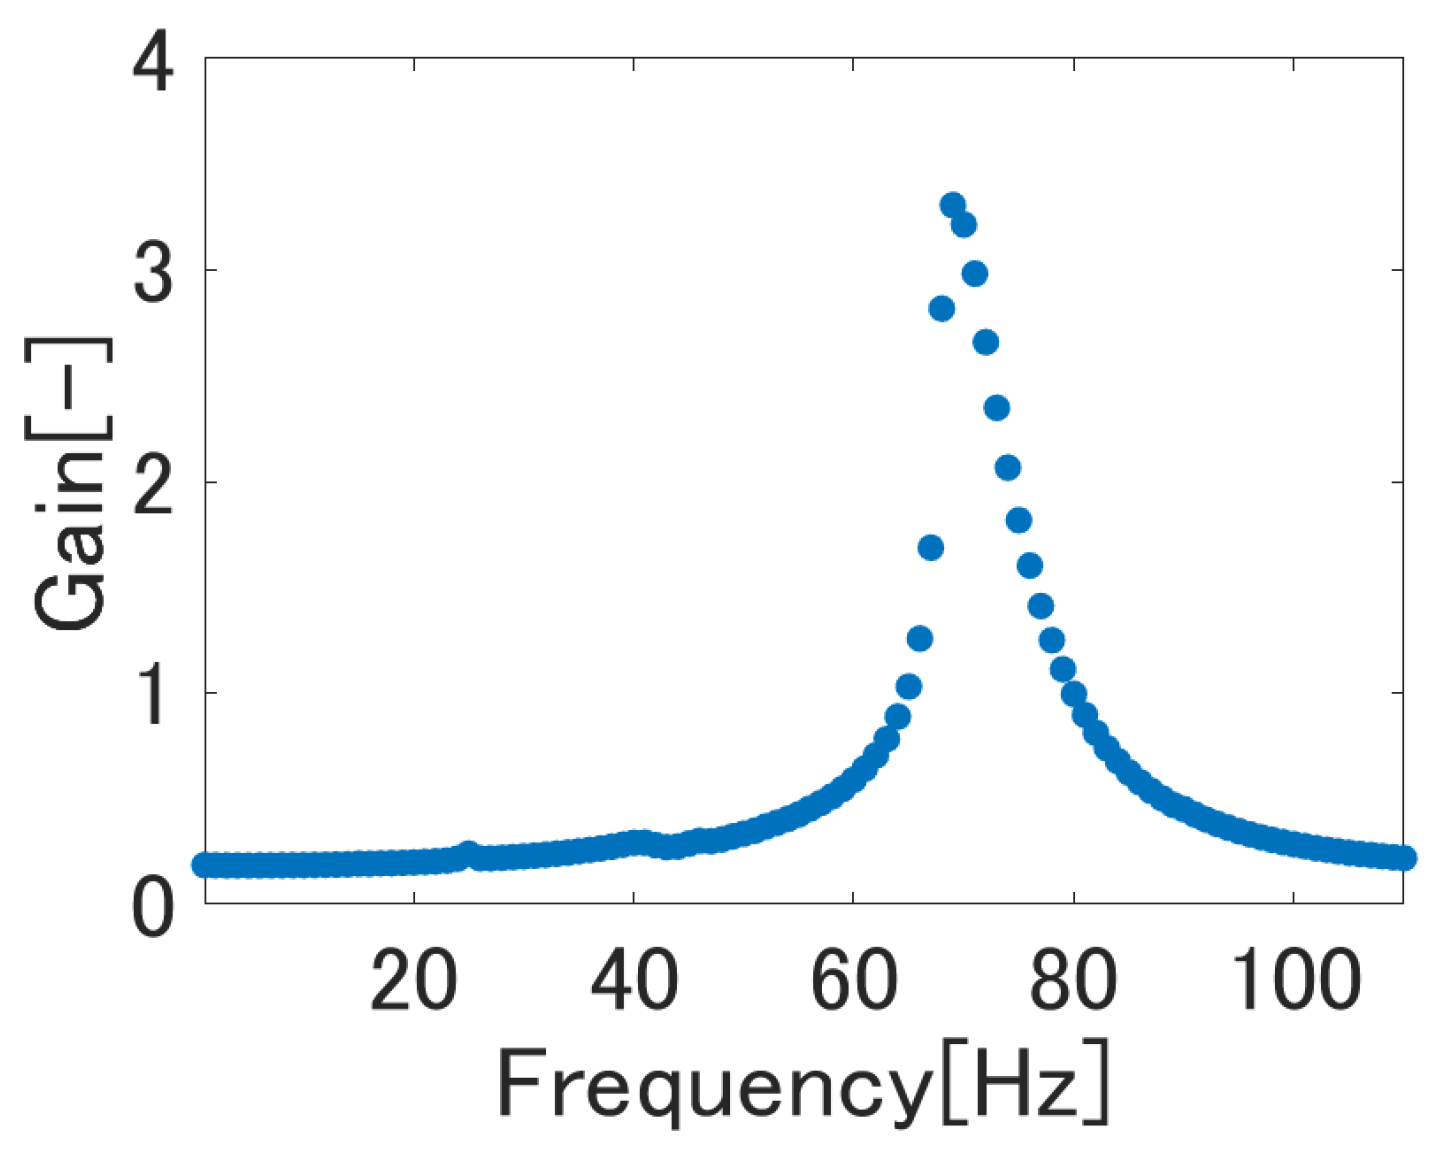
The measured results of the gain-frequency characteristics of the target bimorph actuator PZBA-00030 illustrated in Figure 1 are summarized in Figure 4. The gain in this plot is defined by y / u , where u denotes the pure sinusoidal input and y represents its corresponding output sequence.
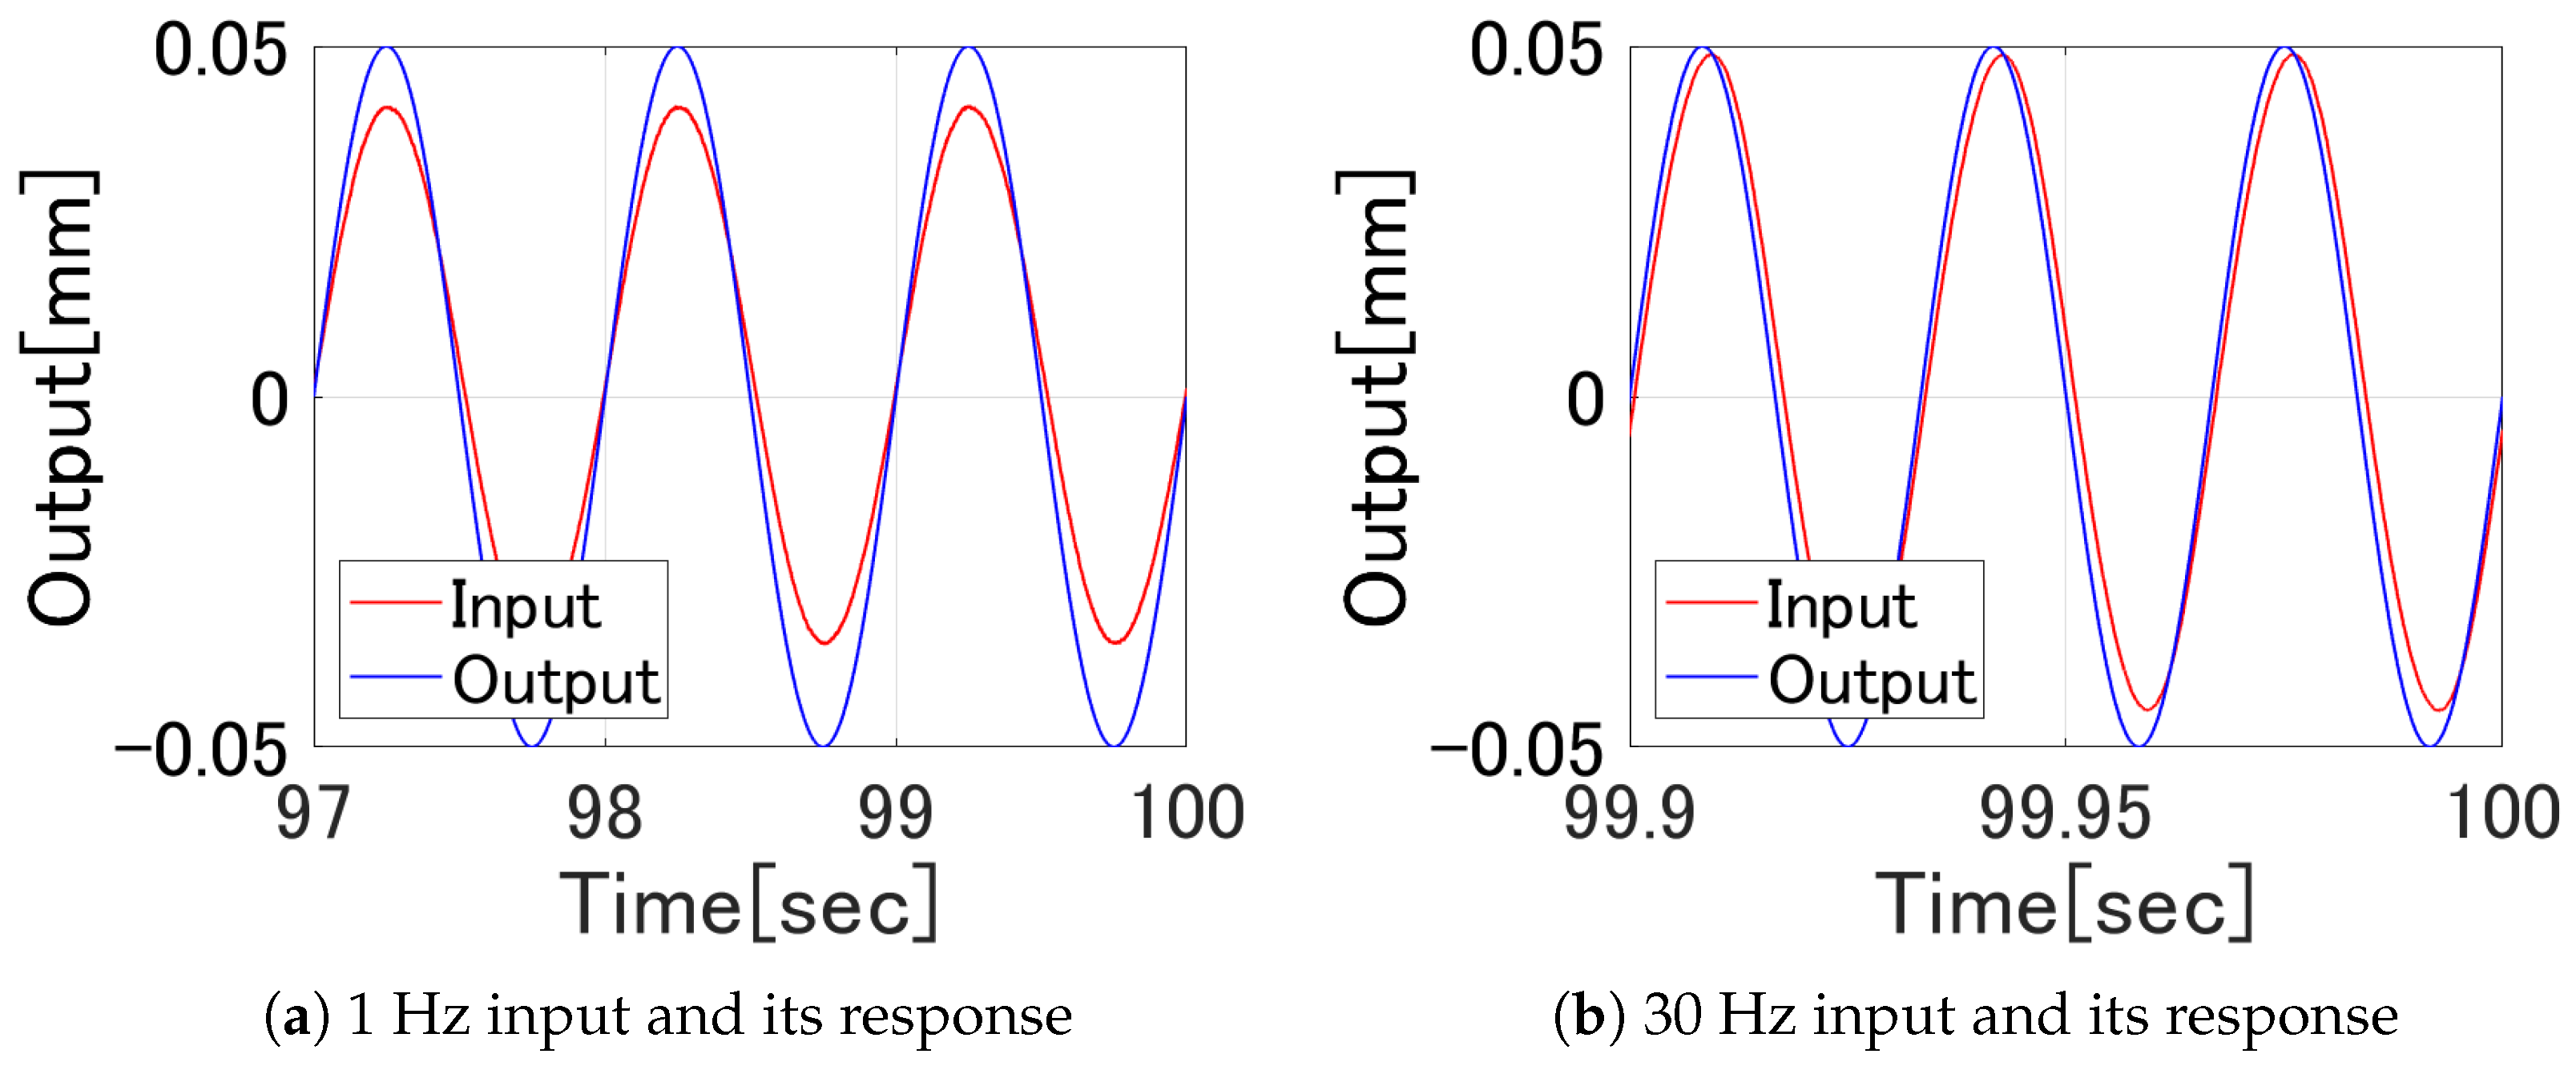
It is natural to infer that the bimorph piezoelectric actuator exhibits structural oscillation property, as its mechanical structure can be regarded as a thin cantilever. The mechanical resonance of the target actuator exists at around 70 Hz, as shown in Figure 4. We can also observe the difference in the amplitude of the actuator responses to 1 and 30 Hz inputs in Figure 5. It shows that the 30 Hz output exhibits phase lag to the input, whereas the 1 Hz output does not. Additional observations of the frequency responses of the actuator motivates the introduction of the infinite impulse response (IIR) filter structure between the input and the output that results in the algebraic structure of the model determined by
y ^ [ k ] = P [ u [ k ] ] + c 1 y ^ [ k 1 ] + c 2 y ^ [ k 2 ] + c 3 y ^ [ k 3 ] ,
where c i ( i = 1 , 2 , 3 ) are the filter coefficients that are to be identified. We choose the 3rd order IIR structure, as the observed phase lag exceeds 180° at high frequencies.
However, four hysteresis loops around the resonance frequency, as shown in Figure 6 reveal that Equation (17) is not sufficient to capture the behavior. Four hysteresis loops shown in the figure are all counterclockwise. A drastic change in the phase characteristics of the actuator output is observed only over a 3 Hz increment of the input frequency. We introduced an additional term A 1 u [ k ] proposed by Song et al. [23] with their Preisach model to capture the change of characteristics observed in Figure 6. The output of our model at its current phase is described by
y ^ [ k ] = P [ u [ k ] ] + A 1 u [ k ] + c 1 y ^ [ k 1 ] + c 2 y ^ [ k 2 ] + c 3 y ^ [ k 3 ] ,
where A 1 is also a model parameter to be identified.

3.2. Further Change of the Model Structure to Capture Odd Harmonic Oscillation

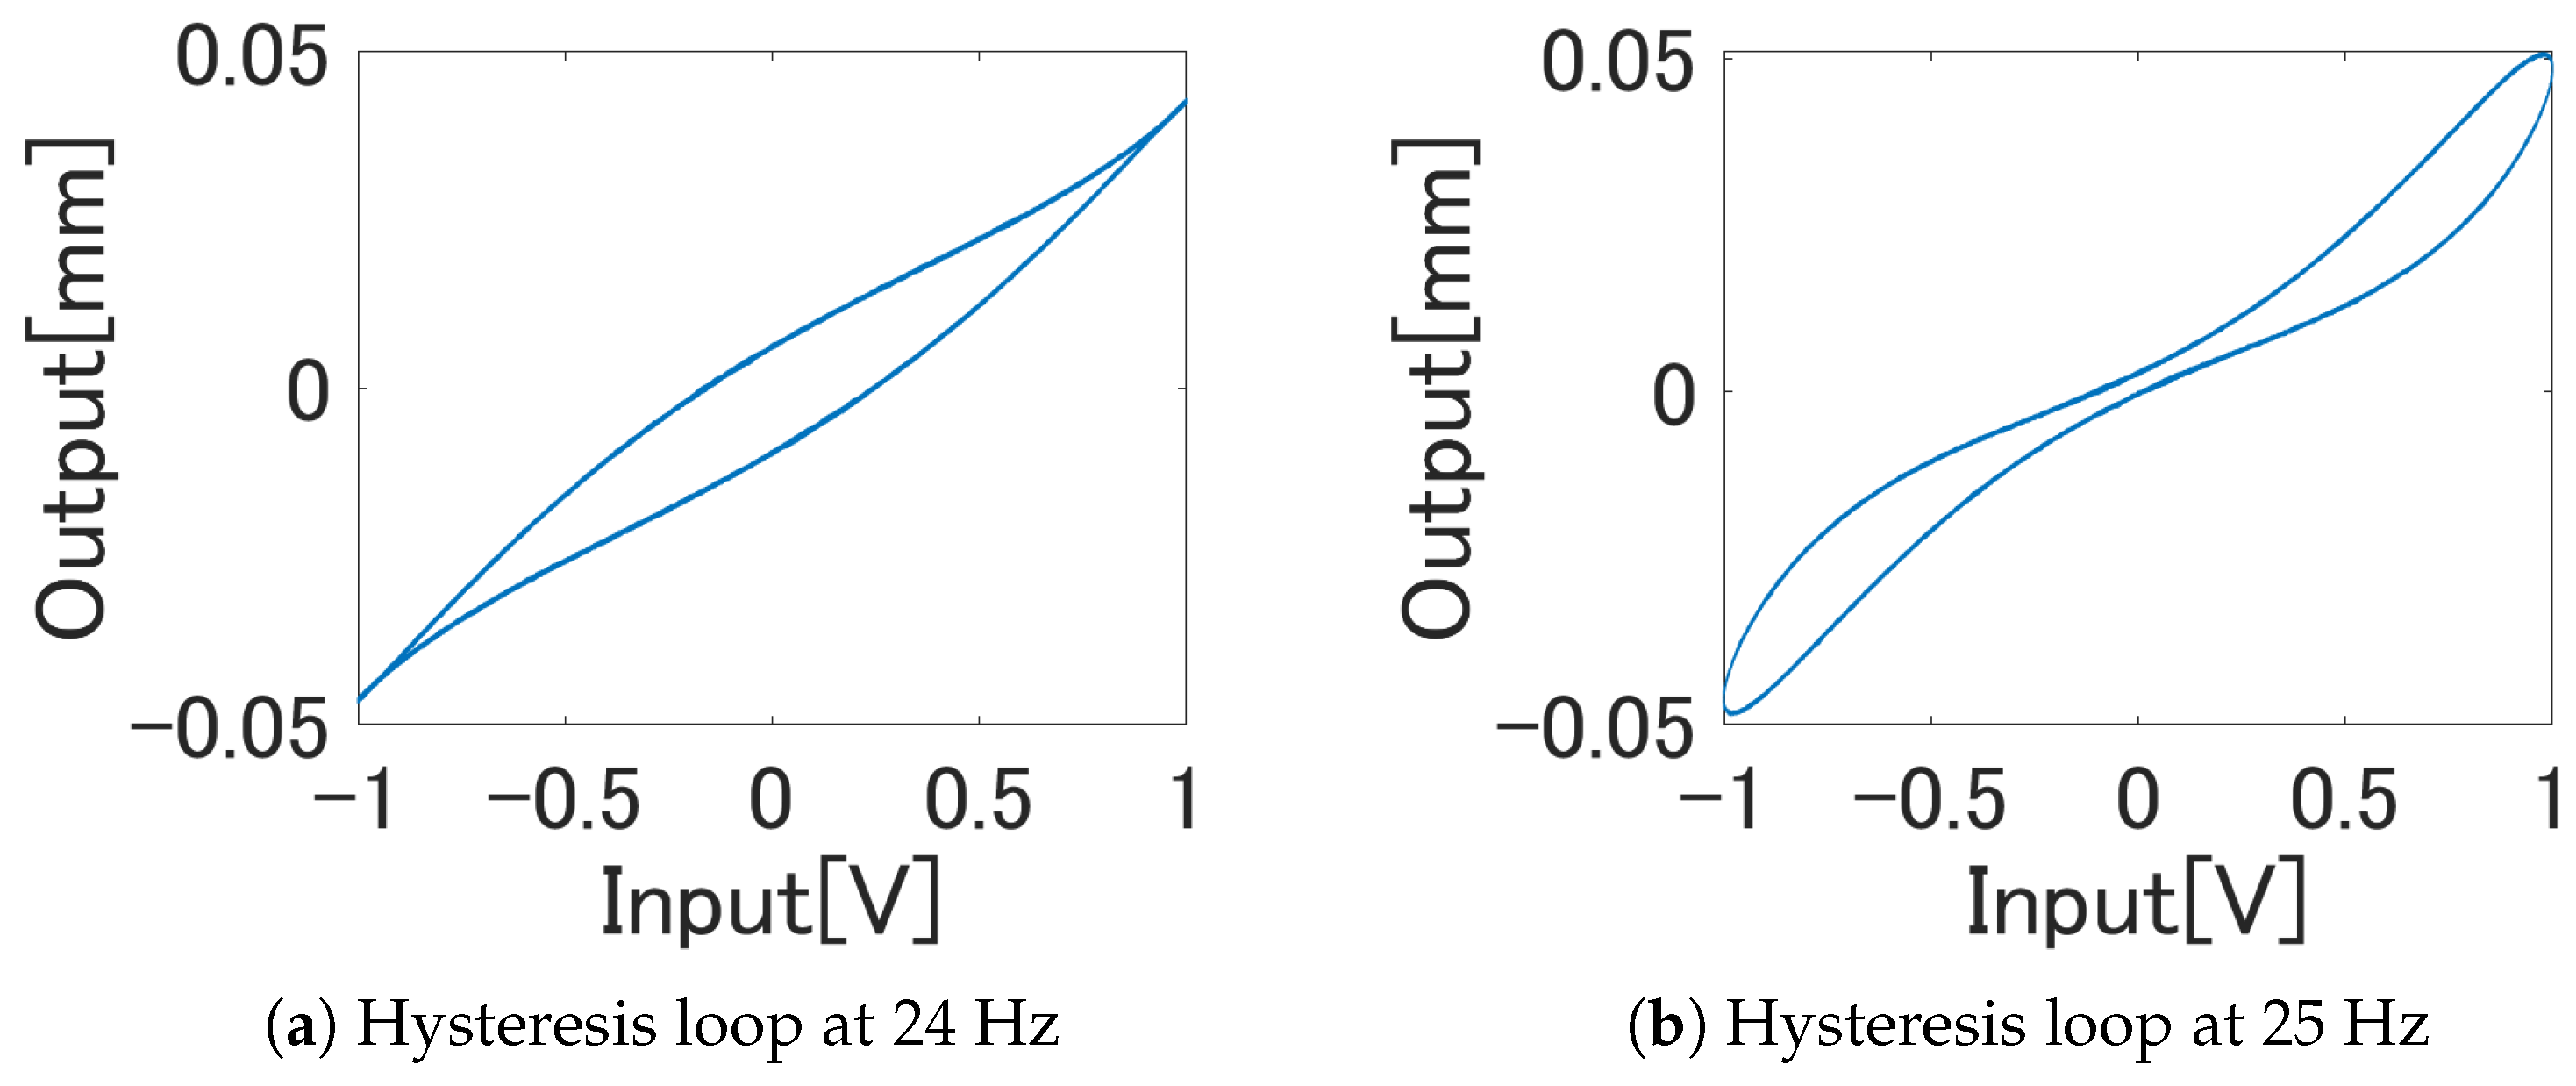
Previously, we have reported the existence of odd-harmonic responses in our bimorph actuator at some specific input frequencies [13]. The examples of hysteresis loops distorted by the odd harmonic oscillation are shown in Figure 7.
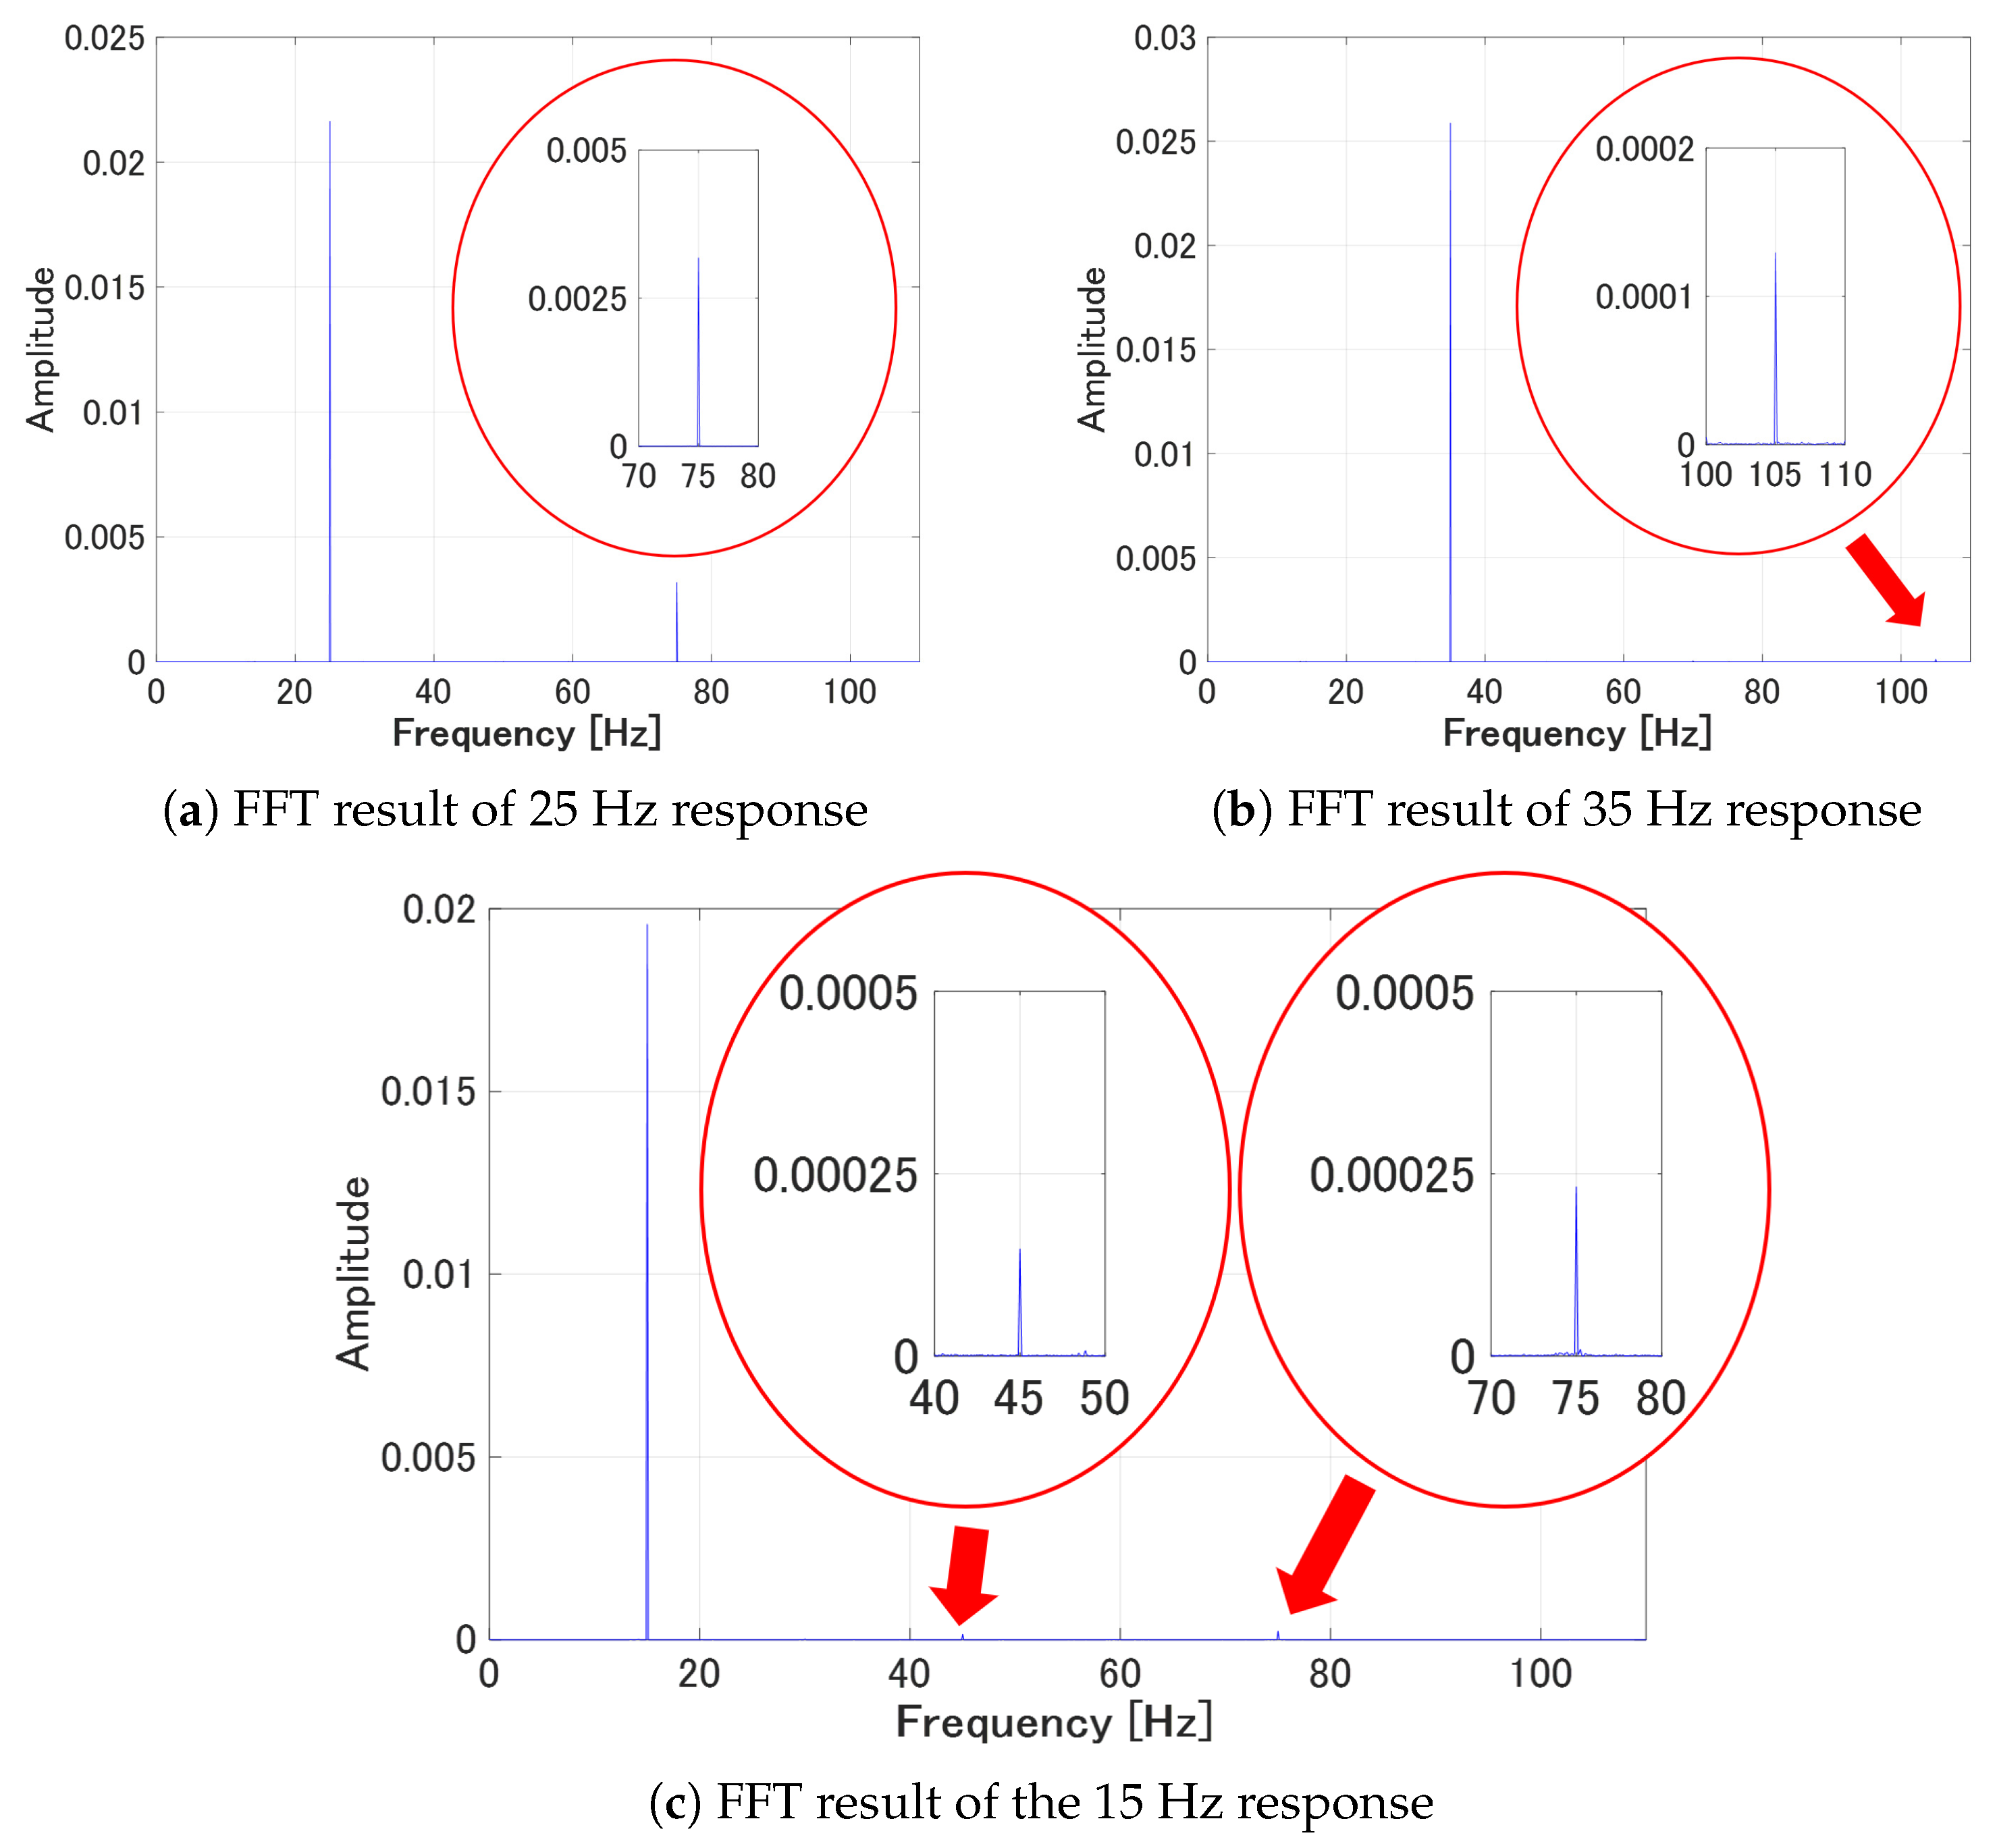
We empirically understand that the odd harmonic response will be large enough to distort the hysteresis loop when the odd multiple of the input frequency matches the mechanical resonance of the actuator; the results of frequency analysis of actuator responses summarized in Figure 8 supported our thoughts. It is true that the odd harmonic responses might be observed in all excitation frequencies, as illustrated in Figure 8b. Whether the odd harmonic component could be large enough to affect the output, depends on the matching between the odd multiple of the input frequency and the resonance frequency.
The third harmonic component of the response to the 25 Hz input has a large power, which is approximately 1/8 as large as the main 25 Hz spectrum. The third harmonic response to the 35 Hz input, on the other hand, has less than 1/100 amplitude as compared to the 35 Hz component. The existence of both the third and the fifth harmonic components in the response to 15 Hz input is shown in Figure 8c. However, the fifth harmonic component is almost twice as large as the third one, as the fifth harmonic closely matches the resonance frequency.
We further altered the structure of the model to capture odd harmonic response of the actuator. Its current form is described by
y ^ [ k ] = P [ u [ k ] ] + A 1 u [ k ] + c 1 y ^ [ k 1 ] + c 2 y ^ [ k 2 ] + c 3 y ^ [ k 3 ] + ( A 11 u [ k 1 ] + A 31 u 3 [ k 1 ] + A 51 u 5 [ k 1 ] ) sin ( 2 π f ( k 1 ) d t ) + ( A 12 u [ k 1 ] + A 32 u 3 [ k 1 ] + A 52 u 5 [ k 1 ] ) cos ( 2 π f ( k 1 ) d t ) ,
where A i 1 and A i 2 ( i = 1 , 3 , 5 ) are the model parameters to be identified. The third and the fifth power of u [ k 1 ] are motivated to introduce the third and the fifth harmonic of the input. The coefficients A 31 , A 32 , A 51 , and A 52 limit the magnitude of the odd harmonic components.

3.3. Structural Modification of the Model to Capture Interleaved Hysteresis

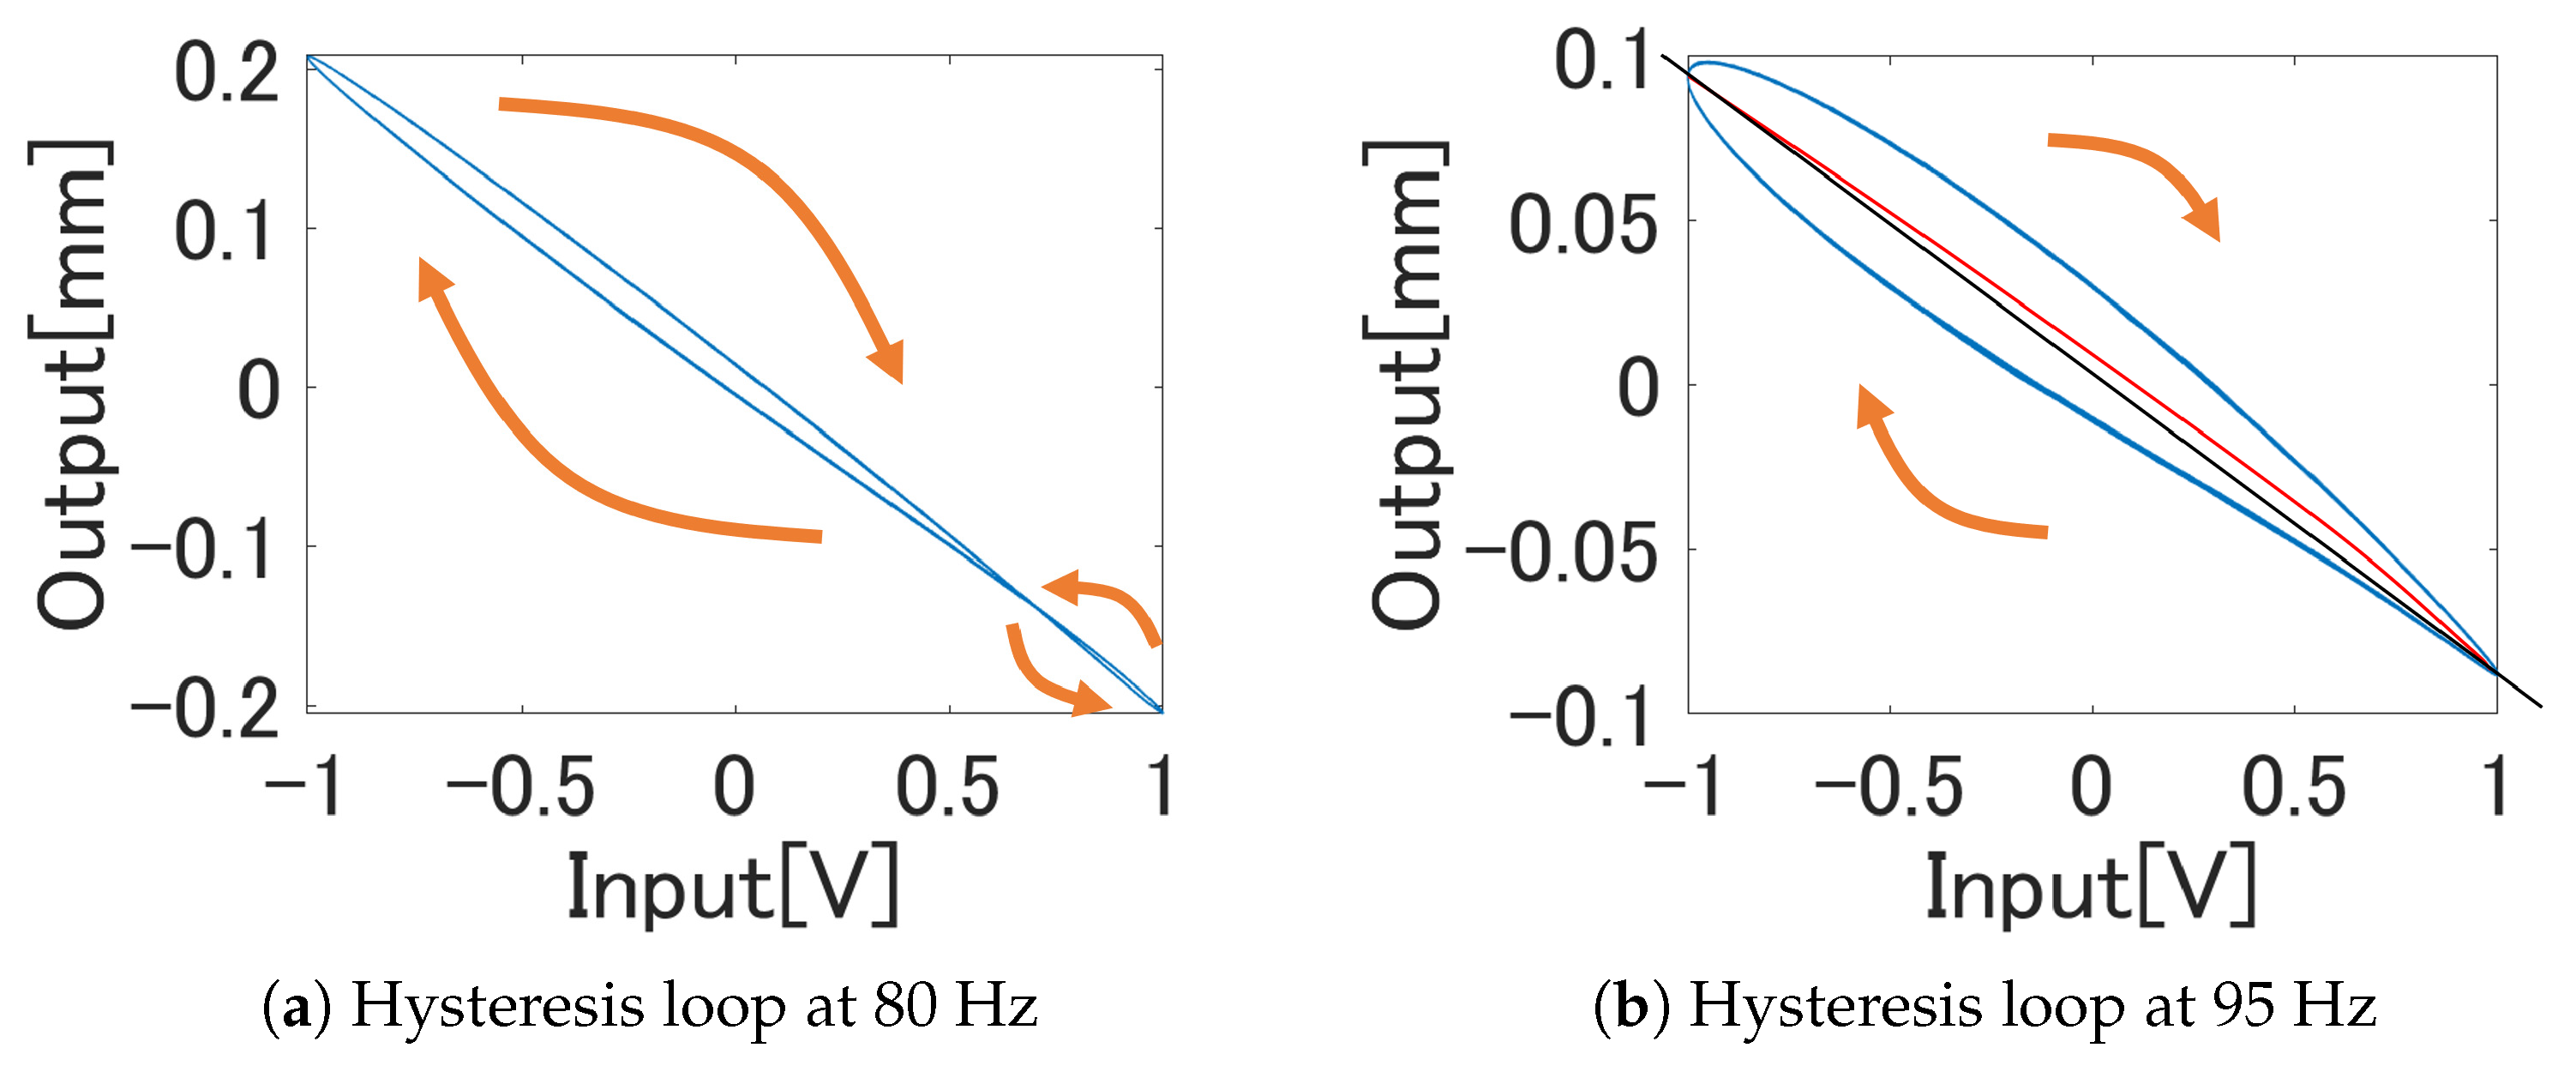
This section explains the structural modification of the proposed frequency-dependent play model for capturing behaviors, which are observed at frequencies higher than the resonance frequency. It is motivated by the hysteresis loops illustrated in Figure 9 corresponding to the 80 and 95 Hz input frequencies.
The hysteresis loop shown in Figure 9a is referred to as the interleaved hysteresis in which both clockwise and counterclockwise loops co-exist in a single hysteresis loop. The hysteresis loops observed at frequencies higher than the one which incurs the interleaved hysteresis typically look like the one shown in Figure 9b. It is a clockwise loop, which is highly asymmetric about the origin of the input/output plane. The black line in the plot connects the outputs corresponding to the positive and the negative peaks of the input, whereas the orange curve goes through the middle points of the actuator outputs corresponding to the same input value.
The fact that the black line and orange curve do not match indicates that the term A 1 u [ k ] initially introduced in Equation (18) is no longer valid. We heuristically modified the term A 1 u [ k ] to ( A 1 + g y ^ [ k 1 ] ) u [ k ] to capture the behaviors shown in Figure 9. The proposed frequency-dependent play model that captures both the odd harmonic oscillation and the interleaved hysteresis is now determined. Its final form is given by
y ^ [ k ] = P [ u [ k ] ] + ( g y ^ [ k 1 ] ) u [ k ] + c 1 y ^ [ k 1 ] + c 2 y ^ [ k 2 ] + c 3 y ^ [ k 3 ] + ( A 11 u [ k ] + A 31 u 3 [ k ] + A 51 u 5 [ k ] ) sin ( 2 π f ( k 1 ) d t ) + ( A 12 u [ k ] + A 32 u 3 [ k ] + A 52 u 5 [ k ] ) cos ( 2 π f ( k 1 ) d t ) .

4. Controller Design for Hysteresis Compensation

4.1. Synthesis of Control Input

We applied the direct inverse multiplication algorithm proposed by Rakotondrabe [18] to derive the controller using the proposed play model. We started from the synthesis of the control input for hysteresis compensation based on the Preisach model [24]
F [ u ( t ) ] = 0 u m a x u m a x + r p u m a x r p σ ( p , r p ) γ p + r p , p r p [ u ( t ) ] d p d r p .
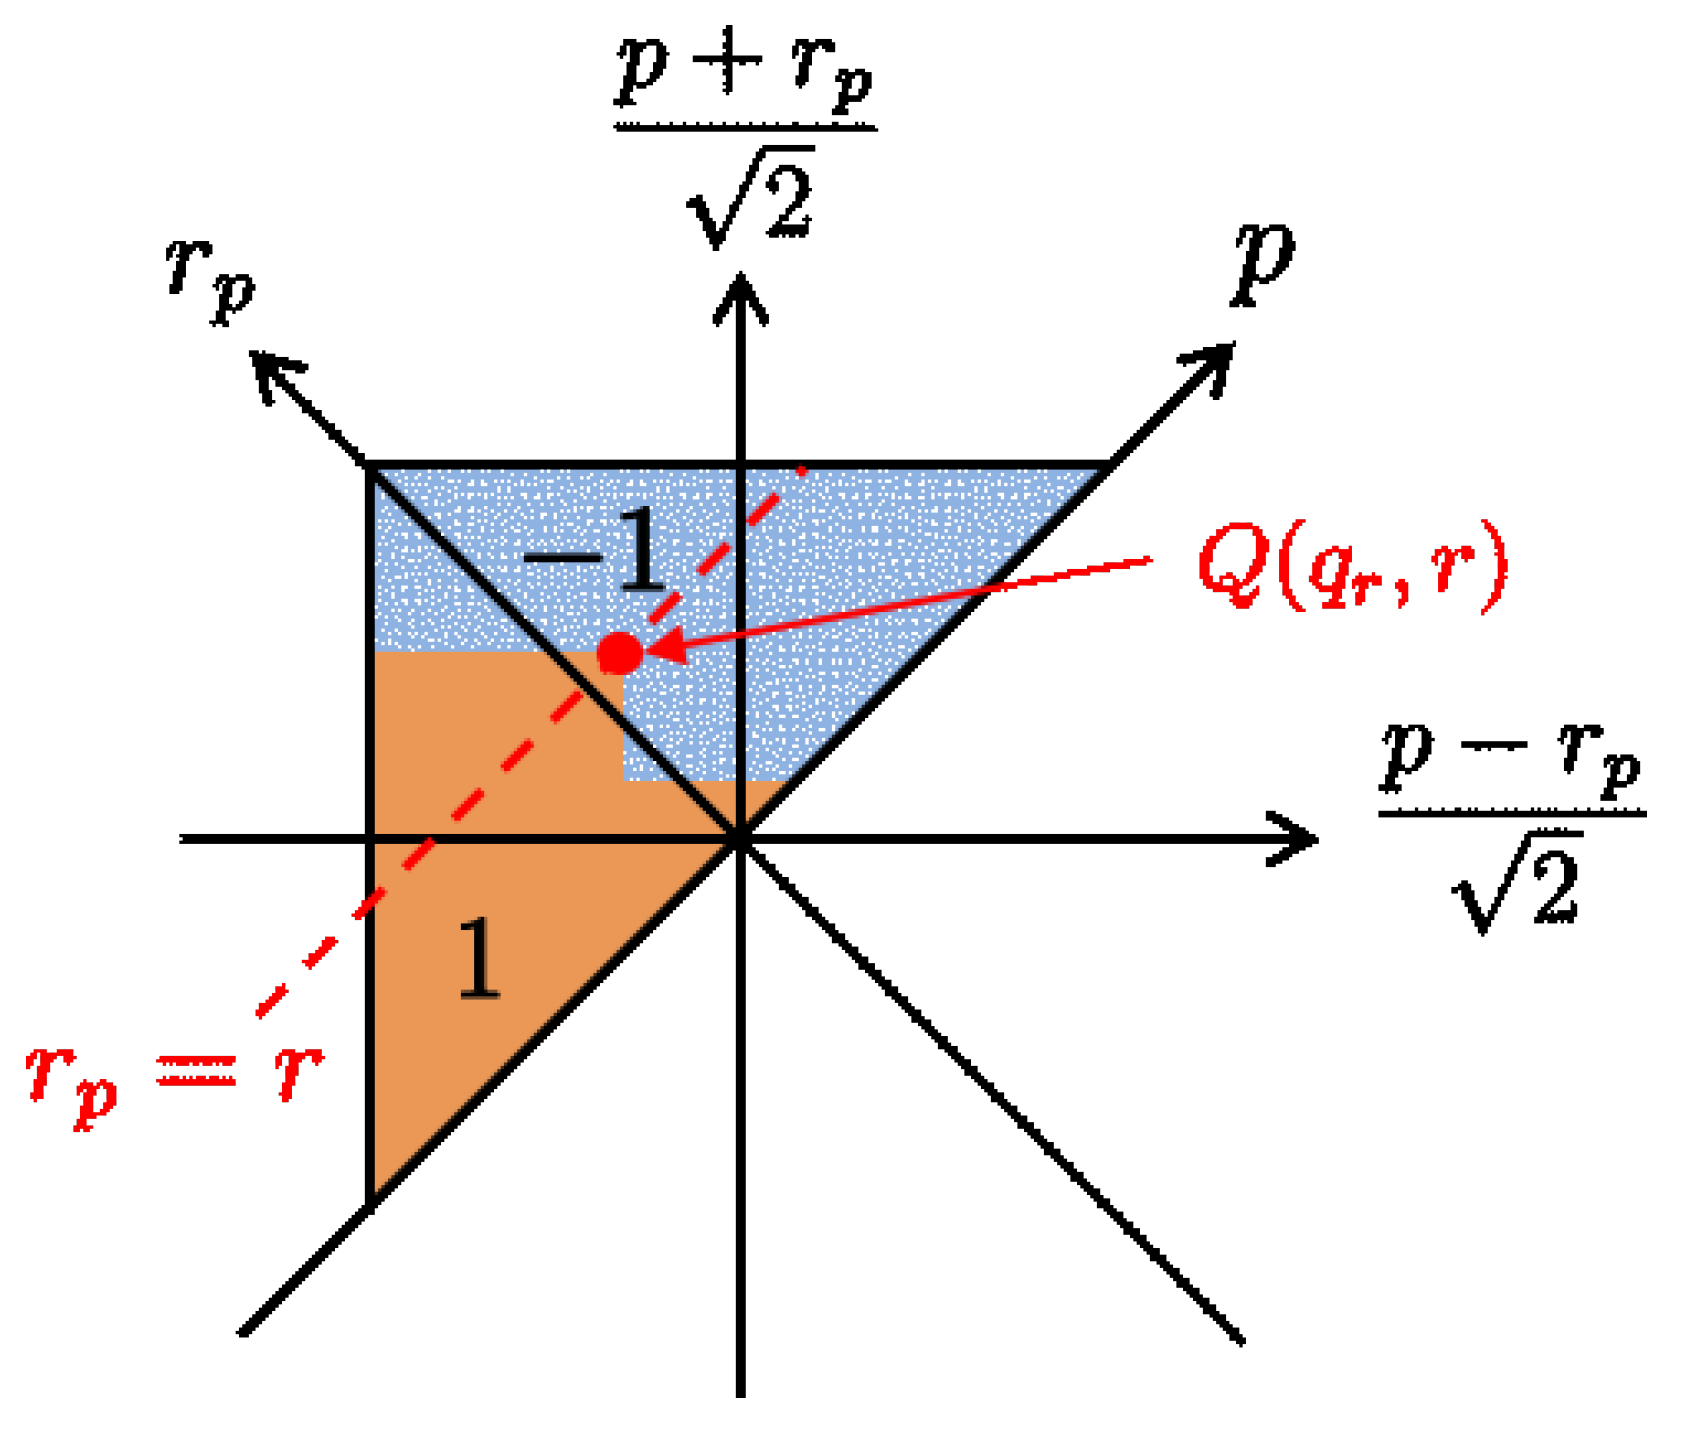
Let a point Q depicted in Figure 10 be the positive-negative boundary of the magnetization along with a line r p = r in ( p , r p ) plane. Then the relay operator takes the distributed values, as specified by
γ p + r p , p r p [ u ( t ) ] = 1 , u m a x + r p q r 1 , q r p u m a x r .
A special case occurs when r = 0 and no hysteretic behavior is observed on the change of the input u [ k ] . The calculation of Equation (21) can be divided into
F [ u ( t ) ] = Γ r = 0 + Γ r > 0 ,
where Γ r = 0 corresponds to the portion of the output, which is immediately affected by the change in input, and Γ r > 0 describes the remaining portion in which the input will affect the output after going through the hysteron.
If we assume the existence of an invertible function defined by λ = σ ( p , 0 ) d p , Γ r = 0 can be calculated by
Γ r = 0 = u m a x u ( t ) σ ( p , 0 ) d p u ( t ) u m a x σ ( p , 0 ) d p = 2 λ ( u ( t ) ) ( λ ( u m a x ) + λ ( u m a x ) ) ,
taking the value distribution specified by Equation (22) into consideration.
From Equation (23), the output of the Preisach model is determined by
F [ u ( t ) ] = 2 λ ( u ( t ) ) + G
G = Γ r > 0 δ , δ = λ ( u m a x ) + λ ( u m a x ) .
Assumption on the invertibility of λ allows us to calculate the control input which cancels out the hysteretic behavior by
u c o m p ( t ) = λ 1 y d G 2 ,
where y d ( t ) denotes the reference output trajectory.

4.2. DIM Controller Synthesis Based on the Proposed Play Model

The same logical development for deriving the mathematical expression of F [ u ( t ) ] in Equation (23) is applicable for the play model, provided that the parameters of the play model are appropriately identified so that P [ u ( t ) ] = F [ u ( t ) ] holds for a given input sequence u ( t ) . We have
P [ u ( t ) ] = 0 u m a x u m a x + r p u m a x r p σ ( p , r p ) x p ( p r p [ u ( t ) ] , p , r p ) d p d r p = Γ r = 0 + Γ r > 0 ,
where Γ r = 0 denotes the portion of the output of the play model immediately affected by the input. It is known that the relation
p r p [ u ( t ) ] = 1 2 u m a x + r p u m a x r p γ p + r p , p r p [ u ( t ) ] d p
holds between the relay operator γ p + r p , p r p and the play operator p r p [ u ( t ) ] [21]. Upon evaluating the integral of the right-hand side of Equation (29) along the line depicted in Figure 10, we have
p r p [ u ( t ) ] = 1 2 u m a x + r p u m a x r p γ p + r p , p r p [ u ( t ) ] d p = 1 2 u m a x + r p q r d p q r u m a x r p d p = q r .
We can evaluate the output of the play operator q r further when r = r p = 0 , to have the equation
q r = p r p [ u ( t ) ] | r p = 0 = u ( t ) ,
where the final equality comes from the definition Equation (2). Therefore, the Γ r = 0 portion of the output can be calculated in a similar manner as applicable to the derivation of Equation (24). If we assume that σ ( p , 0 ) = a is a constant, we have
λ ( u ( t ) ) = a u ( t ) , and λ 1 ( u ( t ) ) = u ( t ) a .
The entire amount of the output of the play model defined in Equation (28) can be calculated accordingly to be
P [ u ( t ) ] = 2 λ ( u ( t ) ) + Γ r > 0 δ = 2 a u ( t ) + Γ r > 0 ,
as δ = λ ( u m a x ) + λ ( u m a x ) = 0 holds in this case. The remaining Γ r > 0 is calculated by
Γ r > 0 = 0 u m a x u m a x + r p u m a x r p σ ( p , r p ) x p ( p r p [ u ( t ) ] , p , r p ) d p d r p | r p > 0 = P [ u ( t ) ] | r p > 0 .
The calculation of Equation (32) amounts to the weighted summation of the distribution function over the region painted in pale green in Figure 11 in the discretized implementation of the play model. The same algebraic expression as the one given in Equation (10) can be used to determine the output while excluding the case i = 0 .
Let H [ u [ k ] ] denote the value defined by
H [ u [ k ] ] = P [ u [ k ] ] | r p i > 0 = i = 1 N 1 j = 0 N 1 i ω ( p i , j , r p i ) x p ( p r p [ u [ k ] ] , p i , j , r p i ) ,
then the output of the play model is given by
P [ u [ k ] ] = 2 a u [ k ] + H [ u [ k ] ] .
Here we must include the number of modifications we have made in the previous section to capture the behavior of the bimorph actuator in the previous expression of the output (33). The final form of the proposed model which determines the output displacement of the actuator is given by
y ^ [ k ] = 2 a u [ k ] + H [ u [ k ] ] + A 1 u [ k ] + g y ^ [ k 1 ] u [ k 1 ] + c 1 y ^ [ k 1 ] + c 2 y ^ [ k 2 ] + c 3 y ^ [ k 3 ] + ( A 11 u [ k 1 ] + A 31 u 3 [ k 1 ] + A 51 u 5 [ k 1 ] ) sin ( 2 π f ( k 1 ) d t ) + ( A 12 u [ k 1 ] + A 32 u 3 [ k 1 ] + A 52 u 5 [ k 1 ] ) cos ( 2 π f ( k 1 ) d t ) , = 2 A u [ k ] + H ^ [ u [ k ] ] ,
where H ^ [ u [ k ] ] and A represent
H ^ [ u [ k ] ] = H [ u [ k ] ] + g y ^ [ k 1 ] u [ k 1 ] + ( A 11 u [ k 1 ] + A 31 u 3 [ k 1 ] + A 51 u 5 [ k 1 ] ) sin ( 2 π f ( k 1 ) d t ) + ( A 12 u [ k 1 ] + A 32 u 3 [ k 1 ] + A 52 u 5 [ k 1 ] ) cos ( 2 π f ( k 1 ) d t ) ,
and
2 A = 2 a + A 1 ,
respectively. We intentionally altered the term g y ^ [ k 1 ] u [ k ] , included in the proposed model in Equation (20), to g y ^ [ k 1 ] u [ k 1 ] , to increase numerical stability of the calculation of u [ k ] to compensate the hysteresis. The control input signal u c o m p [ k ] is synthesized to be
u c o m p [ k ] = λ 1 y d [ k ] H ^ [ u c o m p [ · ] ] 2 = y d [ k ] H ^ [ u c o m p [ · ] ] 2 A .
We note that the calculation of the term H ^ [ u c o m p [ · ] ] requires the past sequence of the compensating inputs u c o m p [ ] without using the current u c o m p [ k ] .

5. Experiments

5.1. Experimental Apparatus

The experimental apparatus used in this study is shown in Figure 12. The piezoelectric actuator is controlled in real-time by a digital signal processor system with embedded peripherals (sBOX II, MIS Co., Tokyo, Japan). The piezo driver (As-904-150B, NF Co., Yokohama, Japan) receives the analog command voltage signal from sBOX which varies within ± 5 V and amplifies it to maximally ± 75 V to drive the actuator. One end of the actuator was clamped firmly as shown in Figure 12. When a sinusoidal input signal was fed to the piezo driver, the actuator bends left and right to exhibit swing oscillation. The displacement of the tip of the actuator is measured by the capacitance type displacement sensor (M-2213, MESS-TEK Co., Saitama, Japan) with the sensor probe (TRA2025-2K-V1, MESS-TEK Co., Saitama, Japan). The measurement resolution of this probe is specified to be 20 nm by the manufacturer. We have measured the tip displacement because the largest displacement can be expected at the tip in our driving frequency range and high signal to noise measurement during the experiment can be expected.

5.2. Identification Experiment

We have conducted the parameter identification experiment of the proposed model and evaluated the fitness of the model using the determined parameters. The input to the actuator was a pure sinusoid
u [ k ] = sin ( 2 π f ( k 1 ) d t ) ,
where f Hz was the frequency of the signal, d t = 0.2 ms was a sampling interval of the measurement, and k denoted the sampling number. We altered f from 1 to 110 Hz with 1 Hz increments. We measured the response of the actuator for 100 s for a single frequency, and calculated the parameters of the proposed model in Equation (34)
θ = [ A ω T | r i > 0 g c 1 c 2 c 3 A 11 A 12 A 31 A 32 A 51 A 52 ]
with the recursive least square algorithm. We have calculated the root mean squared error (RMSE) between the actuator displacement and the model output defined by
R M S E = k = 0 m 1 ( y ^ [ k ] y [ k ] ) 2 m
to evaluate the fitting accuracy of the proposed model. We have also identified the enhanced Bouc–Wen model that we previously proposed [13] and the truncated version of our proposed model in Equation (34) in which the term g y ^ [ k 1 ] u [ k 1 ] is removed for comparison.
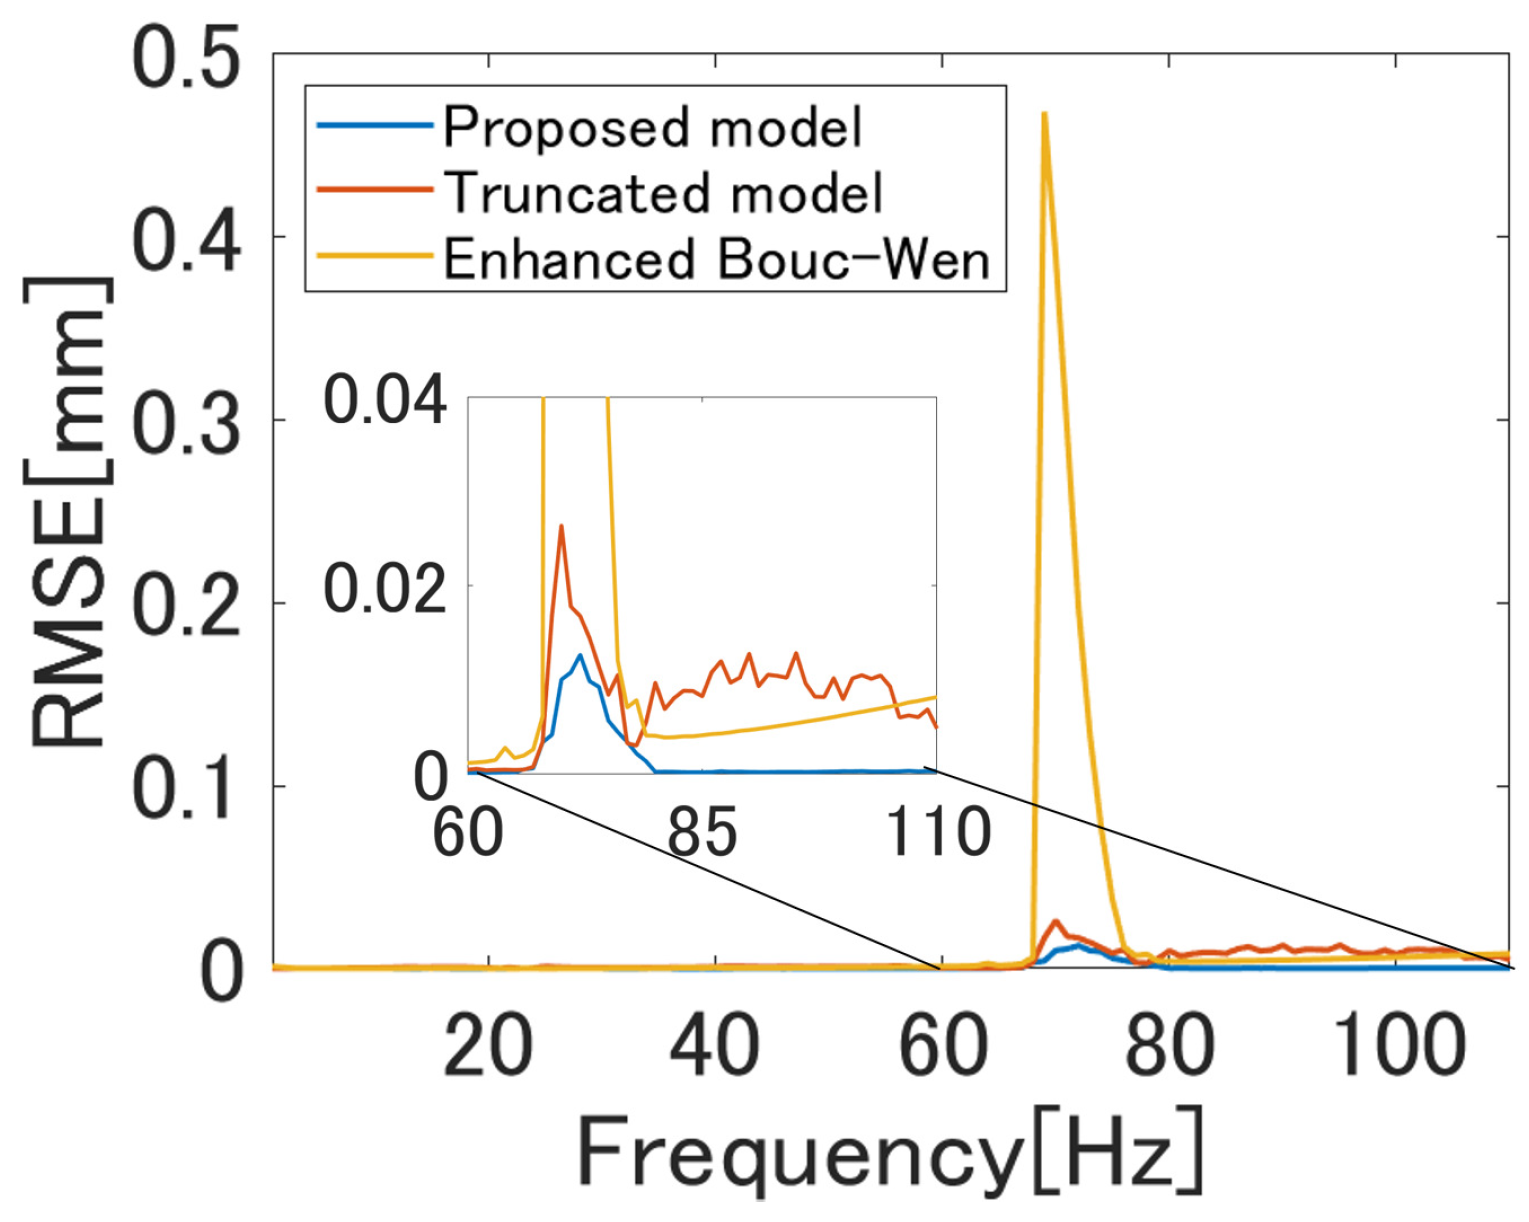
The RMSE metrics of the three models for the tested frequencies are summarized in Figure 13. It can be seen from the figure that the proposed model exhibited the smallest RMSEs for all 110 frequencies tested. Its advantage is relevant at frequencies higher or equal to the mechanical resonance frequencies, where remarkable changes on the actuator responses are observed. However, the RMSE indices of the proposed model increased significantly between 70 and 80 Hz, as the magnitude of the responses at these frequencies were comparably larger than the others.
We calculated the fitting rate for evaluating the accuracy of the model without being affected by the magnitude of the response. It was defined by
F i t t i n g = 1 k = 0 m 1 ( y ^ [ k ] y [ k ] ) 2 k = 0 m 1 ( y ^ [ k ] y ¯ ) 2 × 100 [ % ] ,
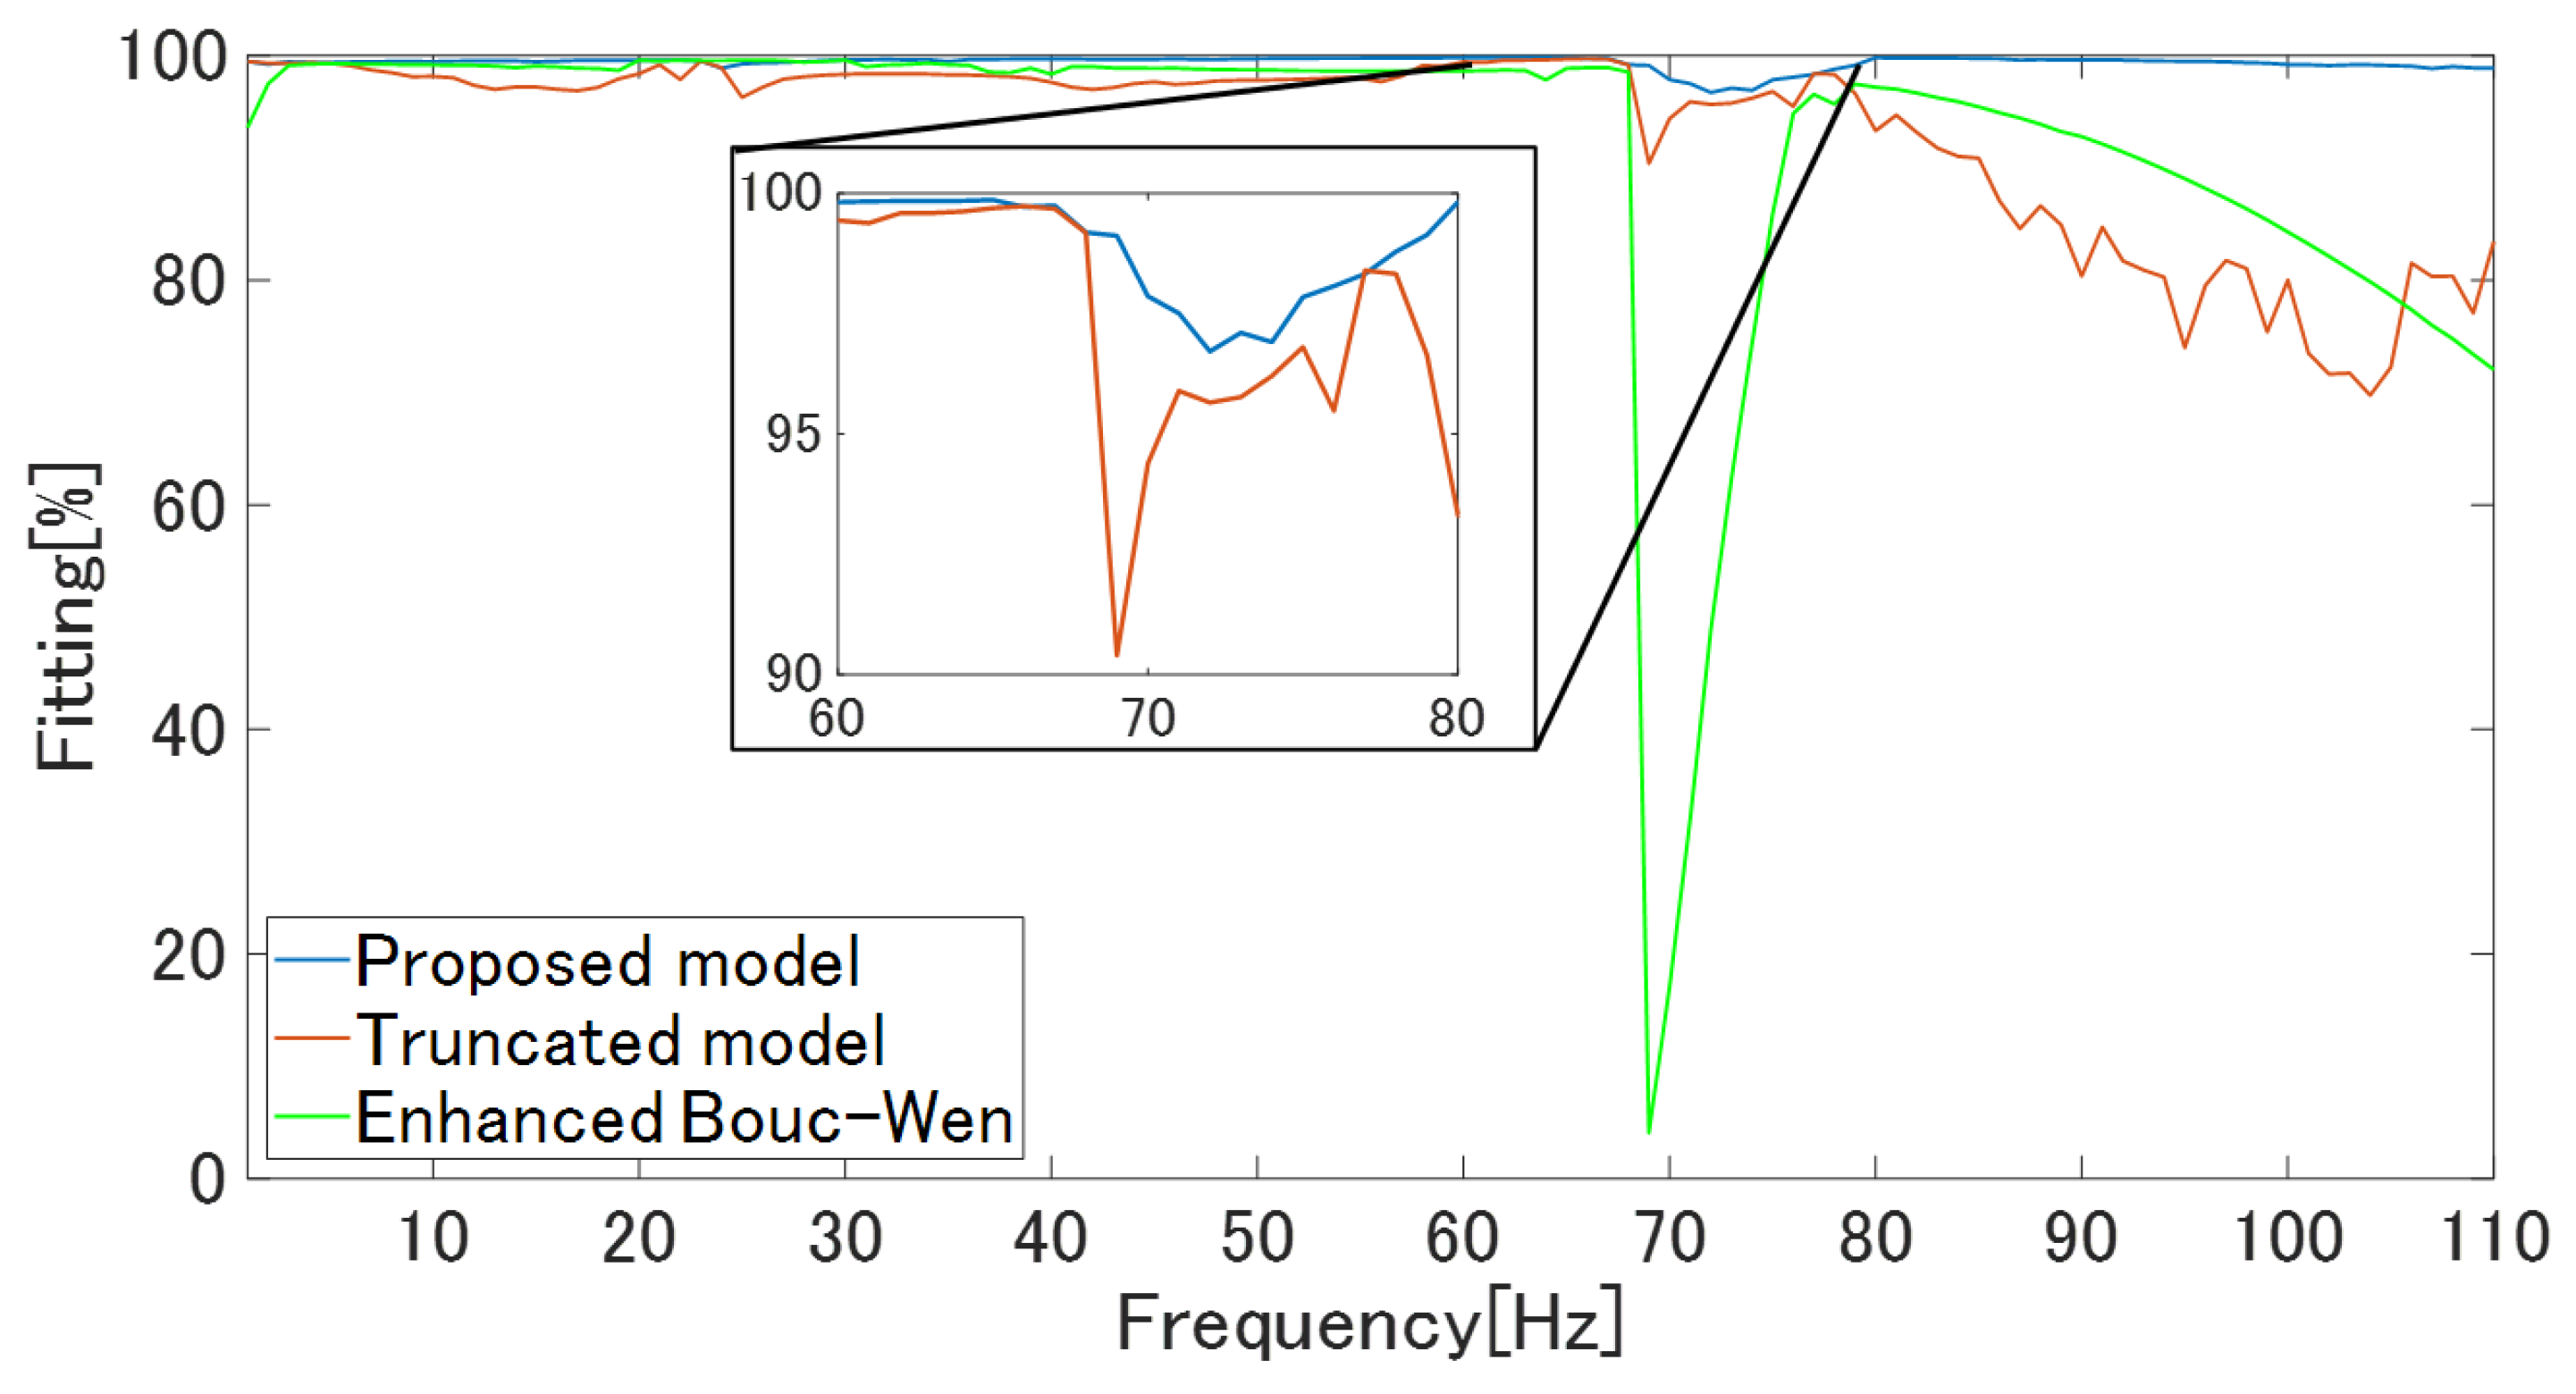
where y ¯ was the average output of the actuator displacement calculated over the available measurements for the frequency of interest. The result of the calculation was given in Figure 14. The proposed model showed the best fit for the three models tested. The loss of fitting of the proposed model around the mechanical resonance amounted to 3% at its maximum. However, the Figure 15c,d show that the model captured the peculiar hysteresis loops inside the range of frequencies.

5.3. Hysteresis Compensation Experiment

We conducted the hysteresis compensation experiment. We used the identified parameters of the proposed model to synthesize the control input sequence defined by Equation (37), where the reference displacement trajectory in mm unit is defined to be
y d = 0.05 sin ( 2 π f ( k 1 ) d t ) .
Although we have carrid out the identification experiment of the enhanced Bouc–Wen model, we have decided not to synthesize the corresponding controller to avoid damage to the sensing probe during the compensation experiment, as the identified enhanced Bouc–Wen model exhibited very large errors around the mechanical resonance frequency.
We proceeded the experiment with the proposed model and the truncated model in which the term g y [ k 1 ] u [ k 1 ] was removed from the proposed model. We have calculated 110 sets of identified parameters for the proposed model, which correspond to the reference frequency f from 1 to 110 Hz with an increment of 1 Hz. We also identified the parameters of the truncated model for 75–90 Hz inputs for comparison. We then moved on to the compensation experiment using the control law derived in the previous section. We performed 110 experiments while altering the reference frequency with the proposed model. We additionally conducted a compensation experiment with the truncated model for 75–90 Hz inputs to observe the performance of the degraded controller in that frequency range.
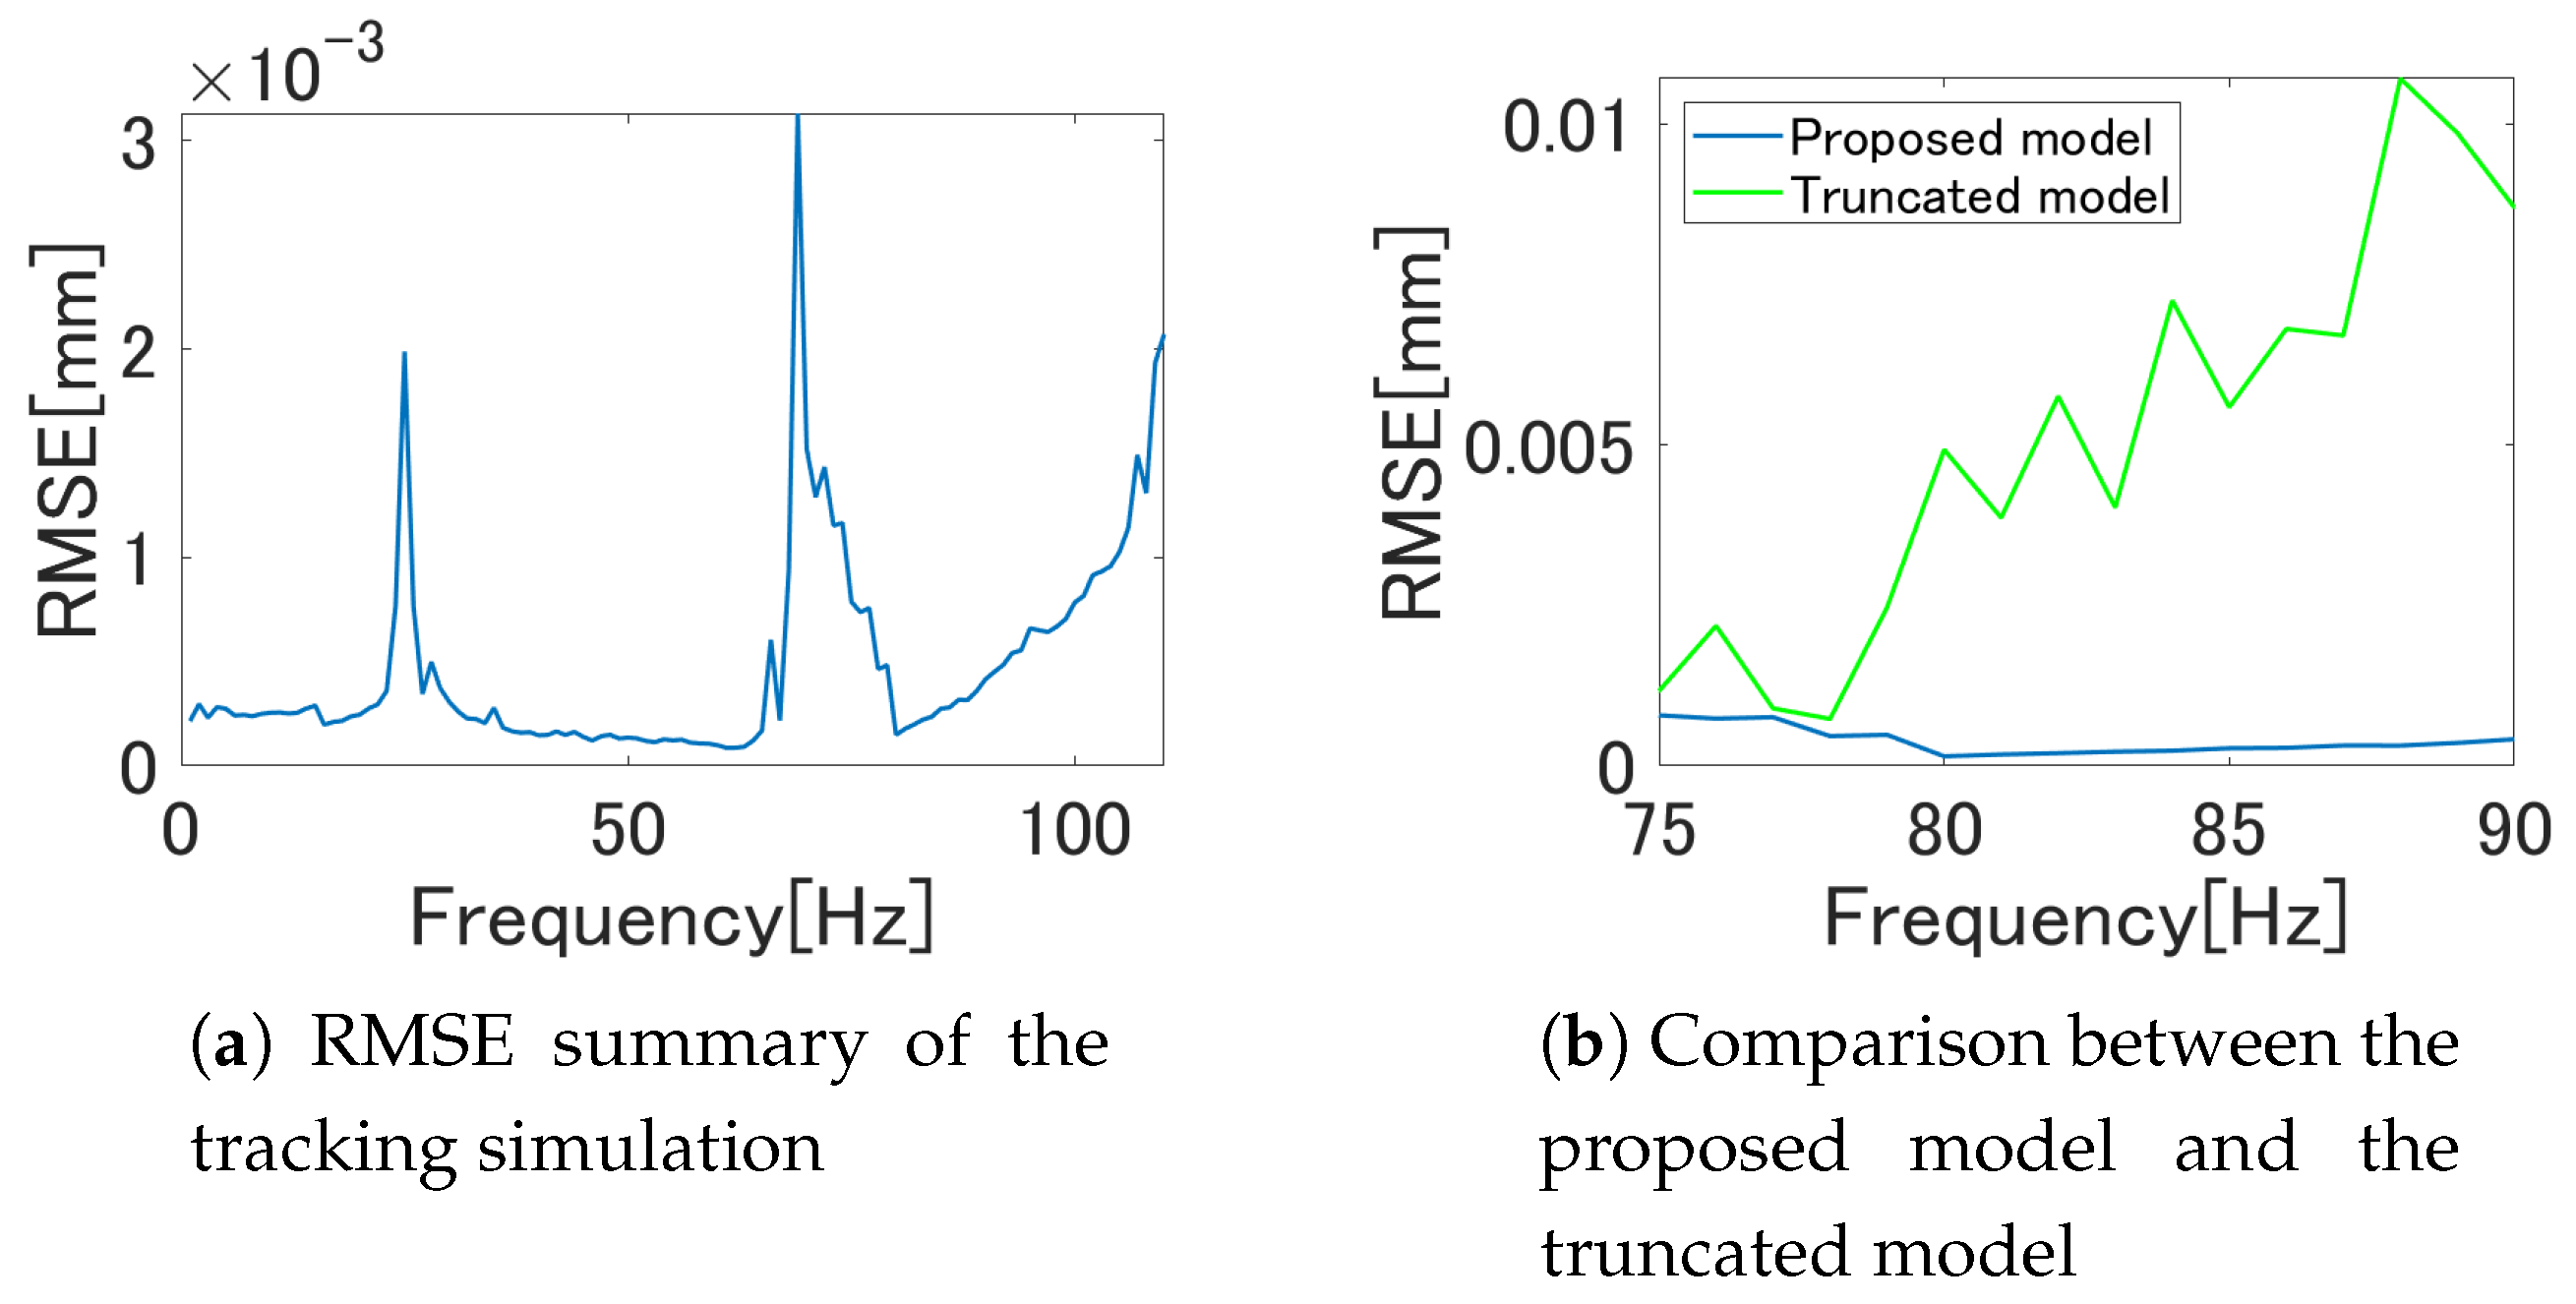
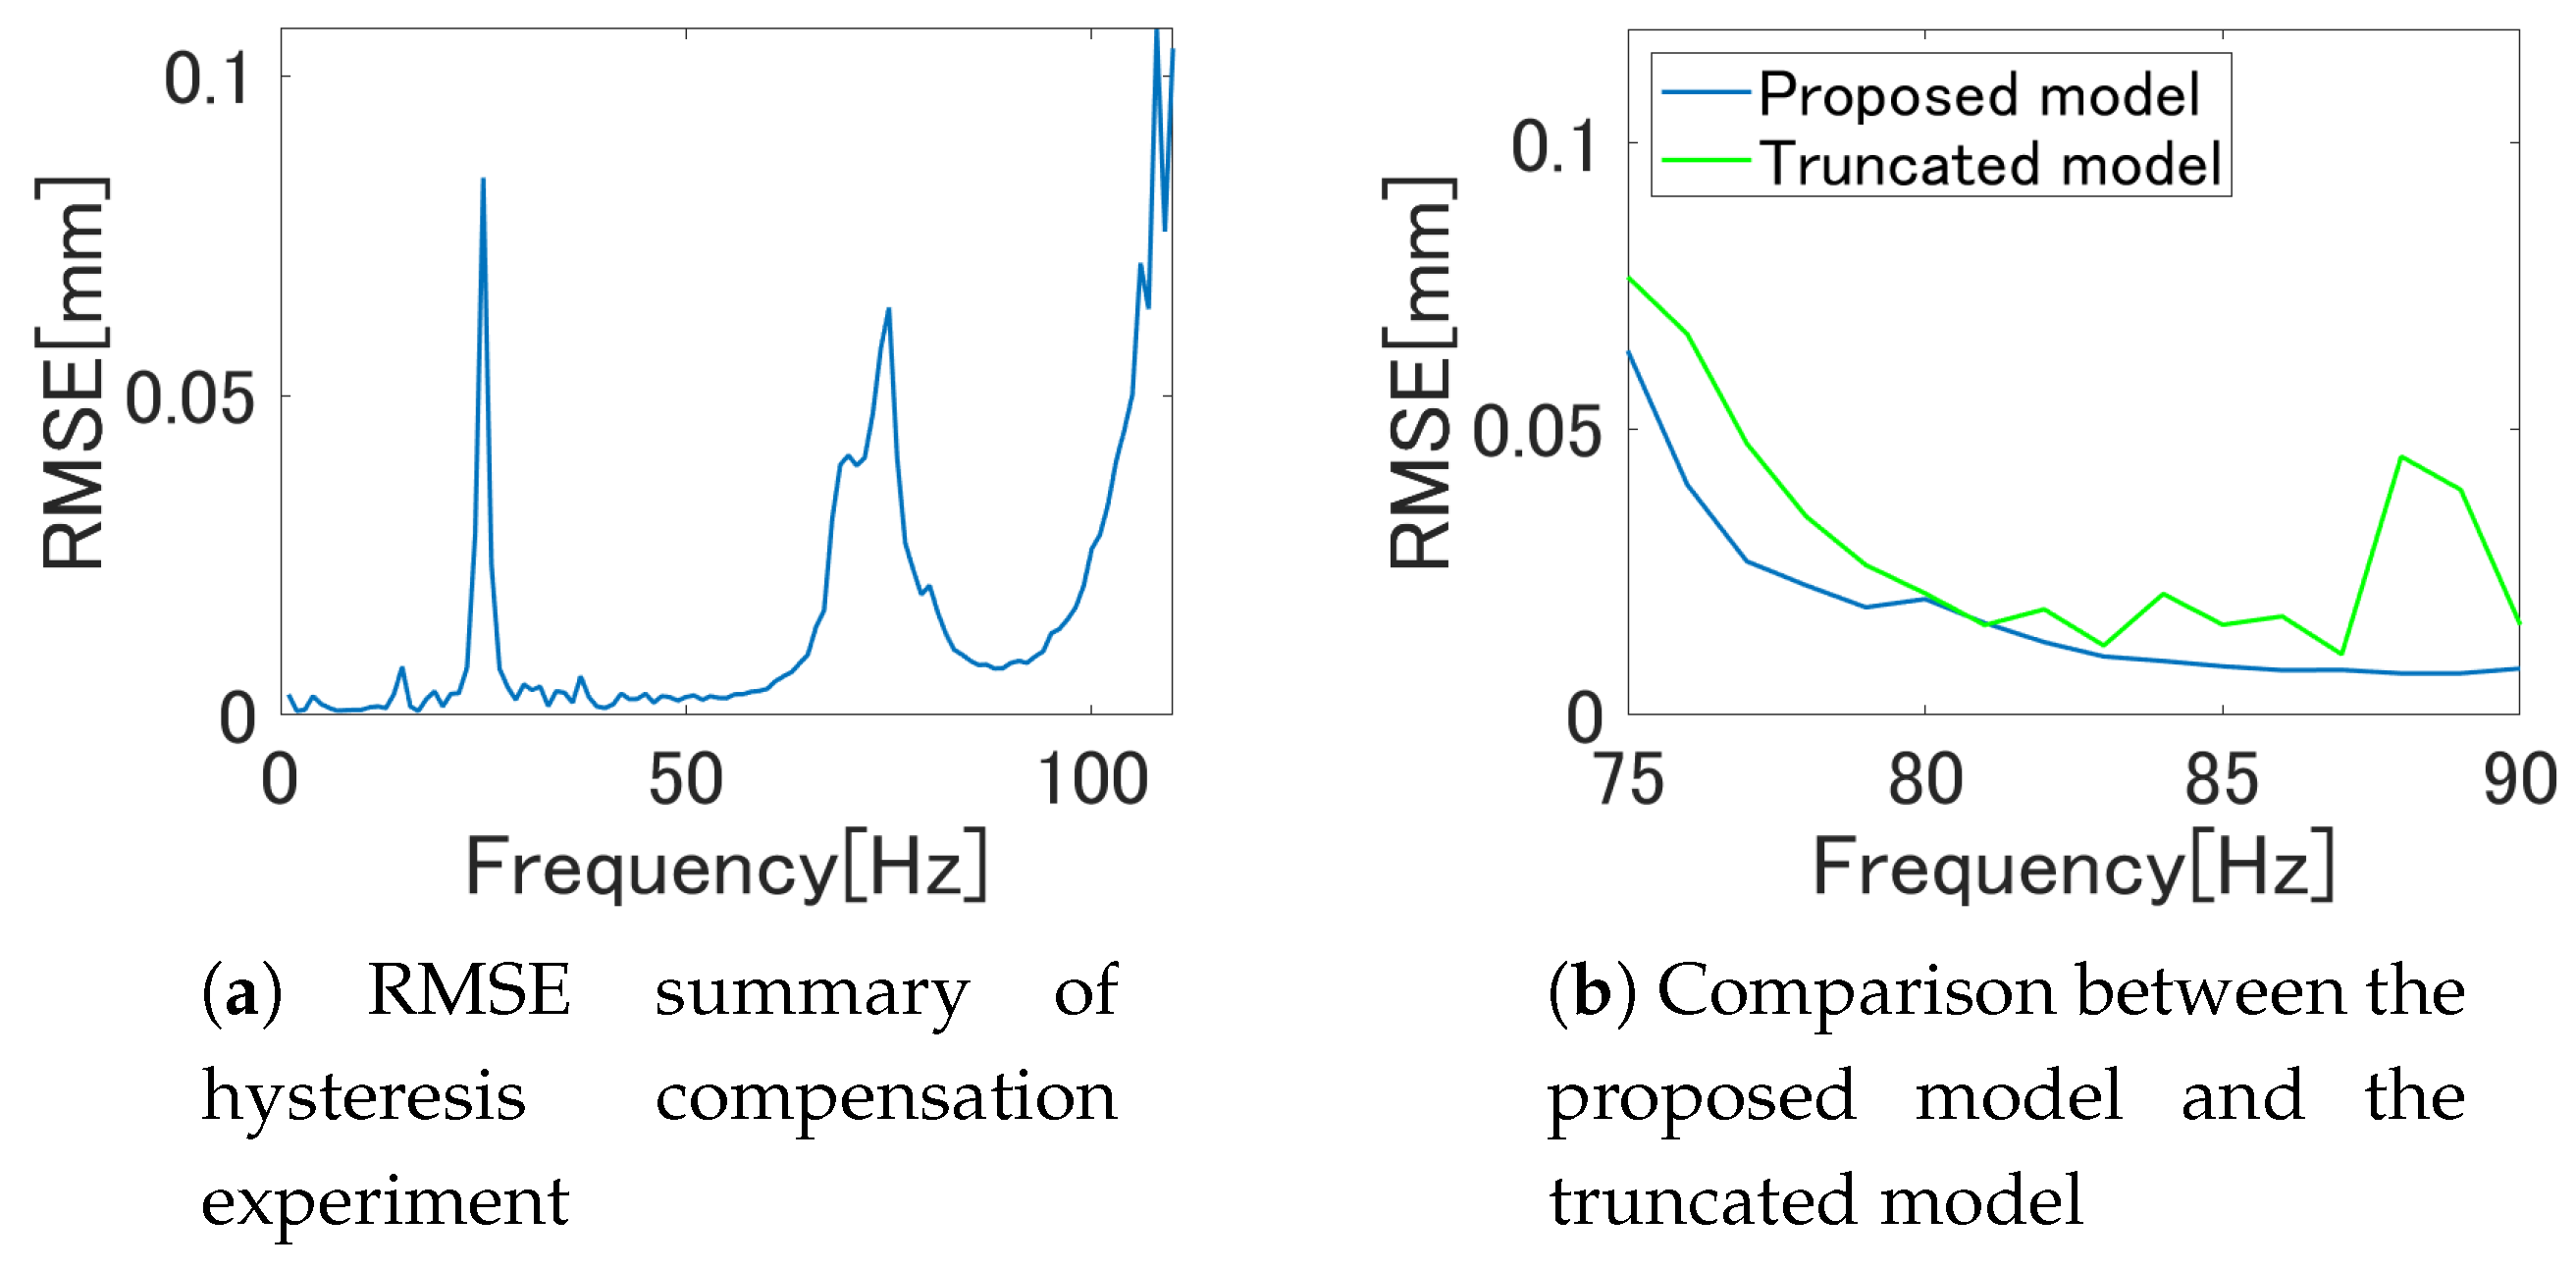
We calculated the root mean squared tracking error between the reference trajectory y d and the actuator response y. The simulation results of the hysteresis compensation are shown in Figure 16, whereas the experimentally obtained metrics are summarized in Figure 17. In both figures, the plot (a) covered all the tested frequency, whereas the plot (b) showed the comparison between the results with the proposed model (plotted with blue), and the results with the truncated model (plotted with green).
Tracking performance degradation has been observed at the frequencies 23–27 Hz, and around and beyond the mechanical resonance. However, Figure 16 and Figure 17b provide evidence to infer that the term g y [ k 1 ] u [ k 1 ] worked as expected for attenuating the peculiar hysteretic behavior including the interleaved hysteresis at high frequencies.
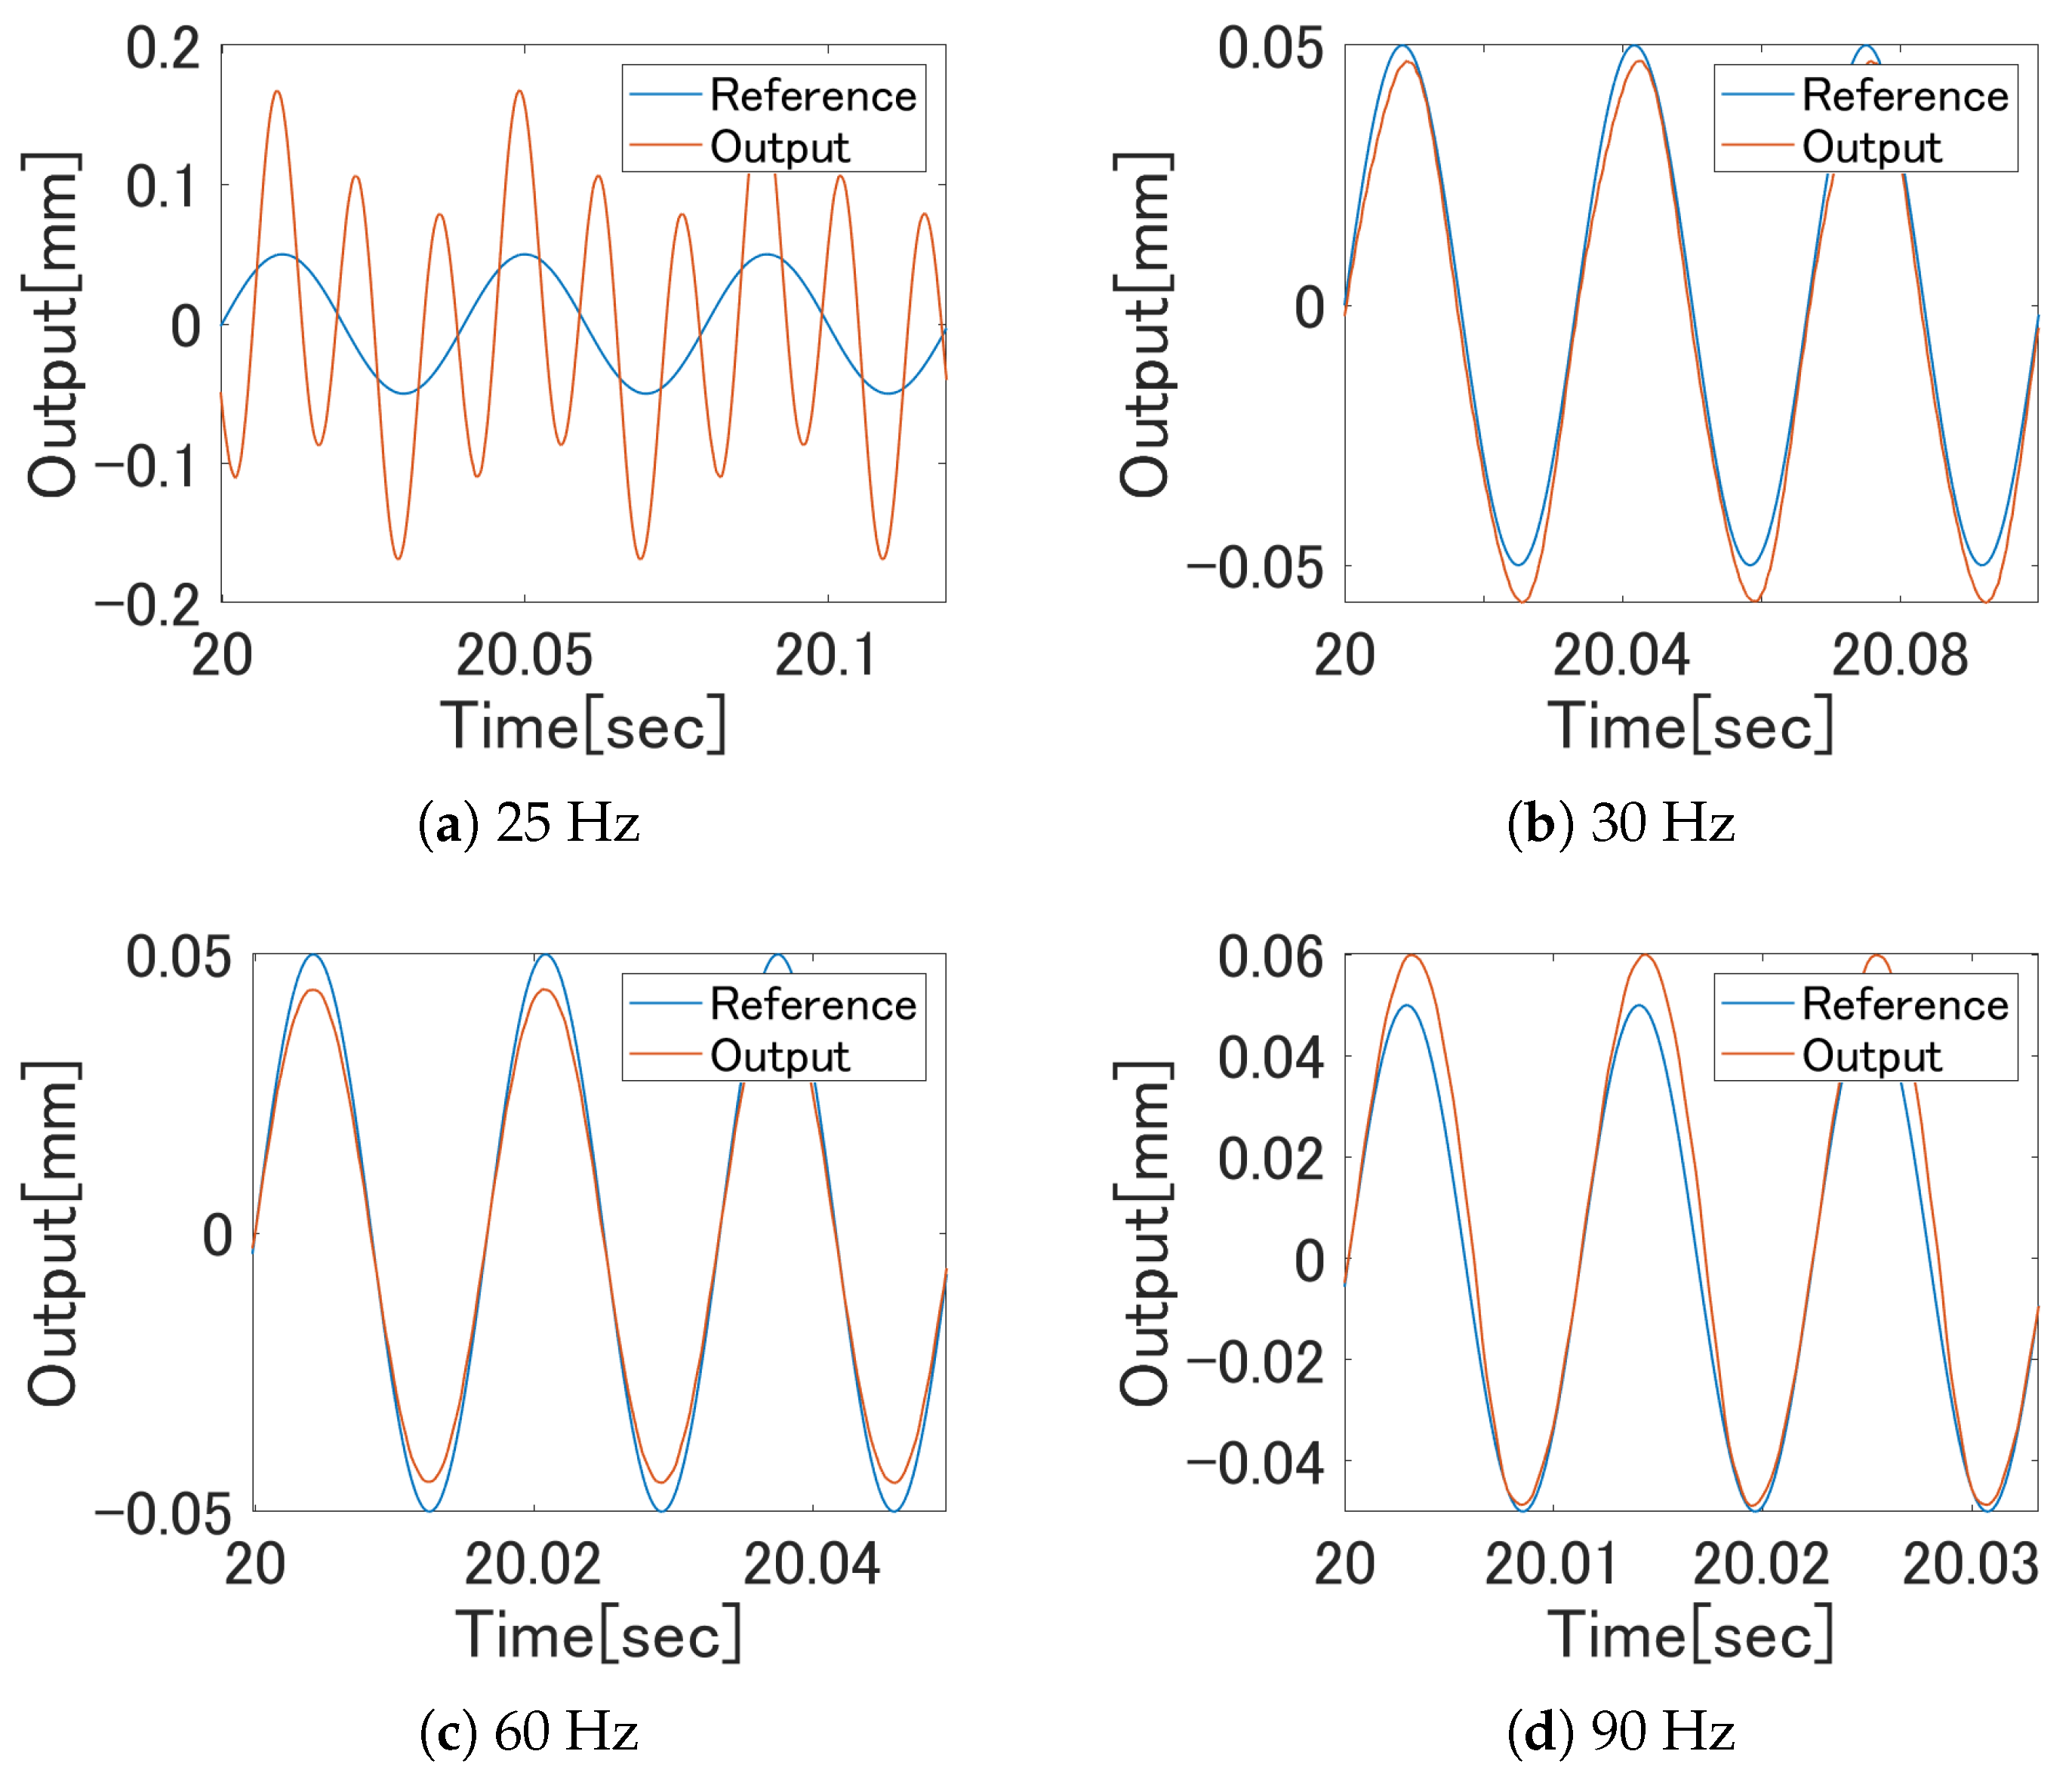
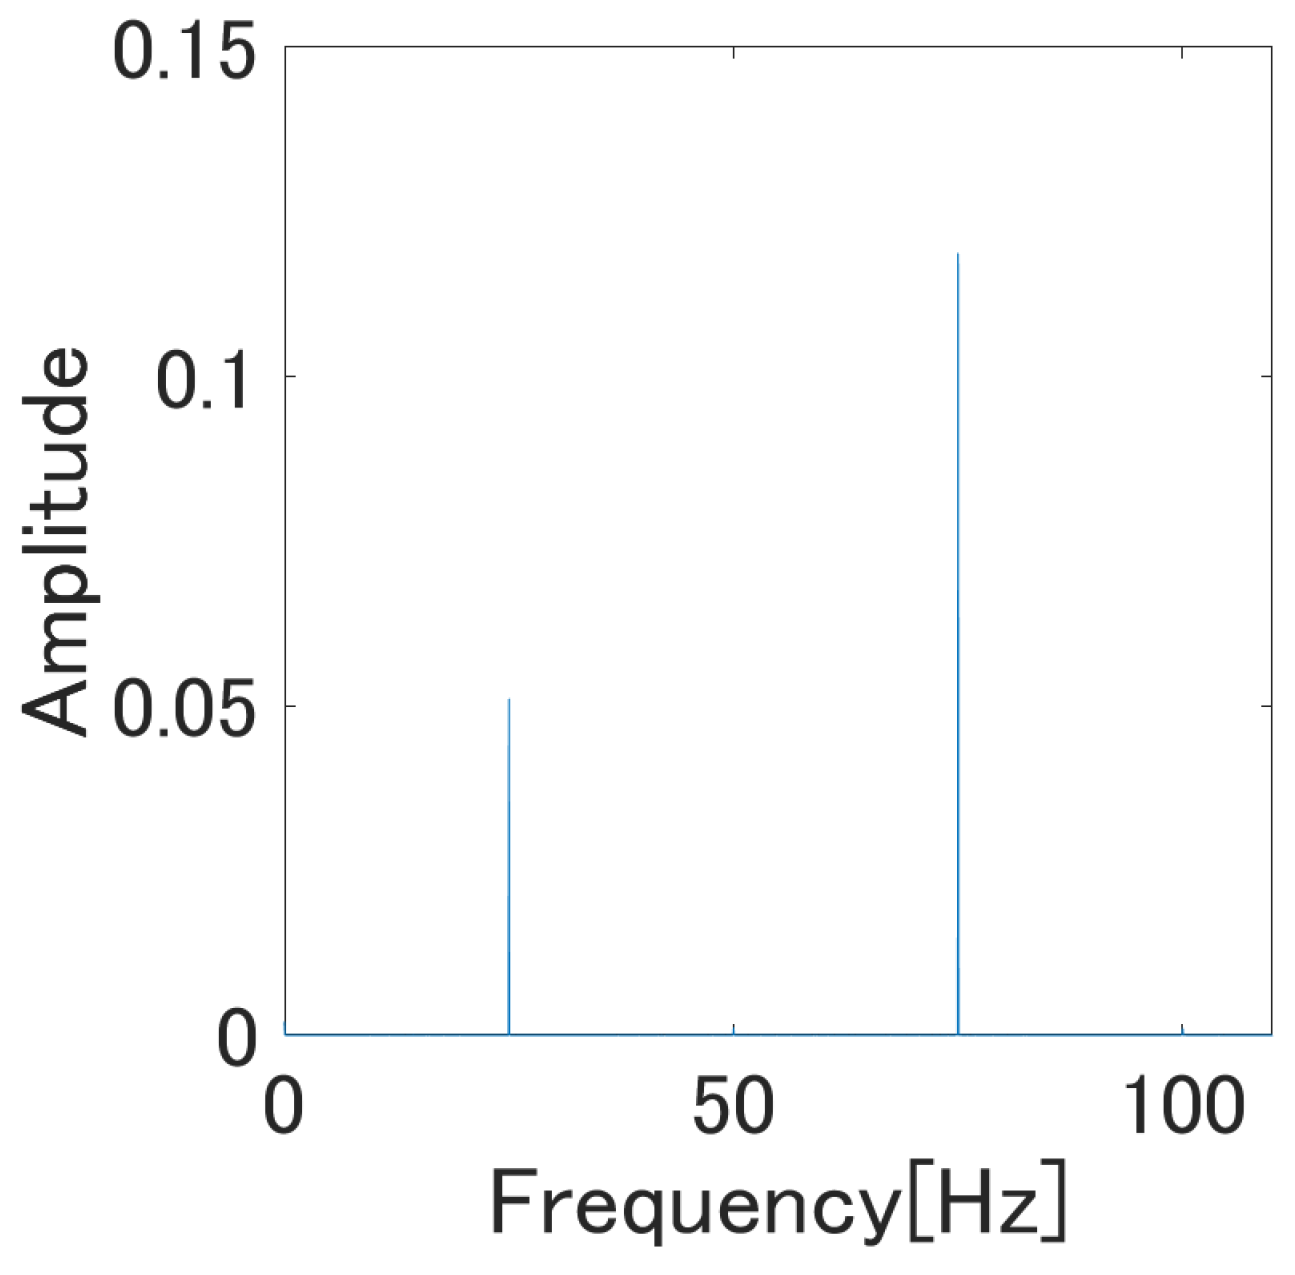
The apparent cause of performance degradation exhibited in these two figures can be attributed to the mis-compensation of odd-harmonic oscillation and the very large structural oscillation. The time-domain plots of the reference and the measured actuator response at f = 25 Hz are shown in Figure 18a. We have performed the FFT analyses on the output sequence at f = 25 Hz and the results are shown in Figure 19. The power of the 75 Hz element of the output was twice as large as that of the 25 Hz element. It seems that the compensating signal u c o m p failed to generate 180° out of phase signal of the source of odd-harmonic oscillation.
Further discussion is possible on the fail of attenuation of odd-harmonic oscillation. Equations (37) and (35) explain that the strategy to attenuate the odd-harmonic oscillation in our DIM controller is to cancel out the source of the odd-harmonic oscillation as characterized by the terms in Equation (35) including the parameters A 31 , A 32 , A 51 , and A 52 . Inside the DIM controller synthesized for 25 Hz reference motion, we used these four parameters identified with the 25 Hz pure sinusoidal input. When we do the compensation experiment, the signal which drives the piezoelectric actuator was the u c o m p [ k ] plotted in Figure 20.
It is clear from the figure that this u c o m p [ k ] is intrinsically different from the pure sinusoidal signal. Empirically speaking, we have to expect different identified values of A 31 , A 32 , A 51 , and A 52 when they were identified with a signal different from a 25 Hz pure sinusoid. We have to conclude accordingly that the parameters A 31 , A 32 , A 51 , and A 52 identified in the experiment as we detailed in Section 5.2 are no longer valid to cancel out the source of odd-harmonics. There can be cases where the odd-harmonic oscillation is not attenuated but magnified in the present situation, which was evidenced by the FFT analysis shown in Figure 19.

6. Conclusions

This paper proposed a modified play model that can capture peculiar frequency-dependent hysteretic behaviors, including the odd harmonic oscillation and interleaved hysteresis. A hysteresis compensator design based on the direct inverse multiplication algorithm using the proposed model has also been addressed. The experimental results showed that the modeling accuracy of the proposed model greatly improved as compared to our enhanced Bouc–Wen model identified for the same bimorph piezoelectric actuator. We also attempted the hysteresis compensation experiment, and the result revealed the necessity for additional work to be carried out at the frequencies where the odd-harmonic oscillation and structural resonance dominates the behavior of the bimorph piezoelectric actuator.

Author Contributions

Conceptualization, F.F. and K.M.; methodology, K.M.; software, K.M.; validation, K.M., F.F. and K.H.; formal analysis, F.F.; investigation, K.M.; resources, F.F.; data curation, K.M. and K.H.; writing—original draft preparation, K.M.; writing—review and editing, F.F.; visualization, K.M.; supervision, F.F.; project administration, F.F.; funding acquisition, F.F. All authors have read and agreed to the published version of the manuscript.

Funding

This research received no external funding.

Conflicts of Interest

The authors declare no conflicts of interest.

References

  1. Idziak, P.; Kowalski, K.; Nowak, L.; Knypiński, K. FE transient analysis of the magnetostrictive actuator. Int. J. Appl. Electromagn. Mech. 2016, 51, S81–S87. [Google Scholar] [CrossRef]
  2. Shin, D.-M.; Hong, S.W.; Hwang, Y.-H. Recent Advances in Organic Piezoelectric Biomaterials for Energy and Biomedical Applications. Nanomaterials 2020, 10, 123. [Google Scholar] [CrossRef] [PubMed] [Green Version]
  3. Stefanski, F.; Minorowicz, B.; Persson, J.; Plummer, A.; Bowen, C. Non-linear control of a hydraulic piezo-valve using a generalised Prandtl-Ishlinskii hysteresis model. Mech. Syst. Signal Process. 2017, 82, 412–431. [Google Scholar] [CrossRef] [Green Version]
  4. Liu, C.; Guo, Y. Modeling and Positioning of a PZT Precision Drive System. Sensors 2017, 17, 2577. [Google Scholar] [CrossRef] [PubMed] [Green Version]
  5. El-Sayed, A.M.; Abo-Ismail, A.; El-Melegy, M.T.; Hamzaid, N.A.; Osman, N.A.A. Development of a Micro-Gripper Using Piezoelectric Bimorphs. Sensors 2013, 13, 5826–5840. [Google Scholar] [CrossRef] [PubMed] [Green Version]
  6. Jain, R.K.; Majumder, S.; Ghosh, B.; Saha, S. Design and manufacturing of mobile micro manipulation system with a compliant piezoelectric actuator based micro gripper. J. Manuf. Syst. 2015, 35, 76–91. [Google Scholar] [CrossRef]
  7. Tsai, M.S.; Chen, J.S. Robust Tracking Control of a Piezoacuator Using a New Approximate Hysteresis Model. Trans. ASME J. Dyn. Syst. Meas. Control 2003, 125. [Google Scholar] [CrossRef]
  8. Gan, J.; Zhang, X. A review of nonlinear hysteresis modeling and control of piezoelectric actuators. AIP Adv. 2019, 9, 040702. [Google Scholar] [CrossRef] [Green Version]
  9. Yang, M.J.; Li, C.X.; Gu, G.Y.; Zhu, L.M. Modeling and compensating the dynamic hysteresis of piezoelectric actuators via a modified rate-dependent Prandtl–Ishlinskii model. Smart Mater. Struct. 2015, 24, 125006. [Google Scholar] [CrossRef]
  10. Xiao, S.; Li, Y. Modeling and High Dynamic Compensating the Rate-Dependent Hysteresis of Piezoelectric Actuators via a Novel Modified Inverse Preisach Model. IEEE Trans. Control Syst. Technol. 2013, 21, 1549–1557. [Google Scholar] [CrossRef]
  11. Matsuo, T.; Osaka, Y.; Shimasaki, M. Eddy-current analysis using vector hysteresis models with play and stop hysterons. IEEE Trans. Magn. 2000, 36, 1172–1177. [Google Scholar] [CrossRef] [Green Version]
  12. Matsuo, T.; Shimasaki, M. Representation Theorems for stop and play models with input-dependent shape functions. IEEE Trans. Magn. 2005, 41, 1548–1551. [Google Scholar] [CrossRef]
  13. Fujii, F.; Tatebatake, K.; Morita, K.; Shiinoki, T. A Bouc-Wen Model-Based Compensation of the Frequency-Dependent Hysteresis of a Piezoelectric Actuator Exhibiting Odd Harmonic Oscillation. Actuators 2018, 7, 37. [Google Scholar] [CrossRef] [Green Version]
  14. Zhou, M.; Wang, J. Research on Hysteresis of Piezoceramic Actuator Based on the Duhem Model. Sci. World J. 2013. [Google Scholar] [CrossRef] [PubMed]
  15. Janaideh, M.A.; Rakheja, S.; Su, C.Y. Experimental characterization and modeling of rate-dependent hysteresis of a piezoceramic actuator. Mechatronics 2009, 19, 656–670. [Google Scholar] [CrossRef]
  16. Yang, M.; Li, C.; Gu, G.; Zhu, L. A rate-dependent Prandtl-Ishlinskii model for piezoelectric actuators using the dynamic envelope function based play operator. Front. Mech. Eng. 2015, 10, 37. [Google Scholar] [CrossRef]
  17. Li, C.X.; Gu, G.Y.; Zhu, L.M.; Su, C.Y. Odd-harmonic repetitive control for high-speed raster scanning of piezo-actuated nanopositioning stages with hysteresis nonlinearity. Sens. Actuators A Phys. 2016, 244, 95–105. [Google Scholar] [CrossRef]
  18. Rakotondrabe, M. Bouc-Wen Modeling and Inverse Multiplicative Structure to Compensate Hysteresis Nonlinearity in Piezoelectric Actuators. IEEE Trans. Autom. Sci. Eng. 2011, 8, 428–431. [Google Scholar] [CrossRef] [Green Version]
  19. Alatawneh, N.; Pillay, P. Modeling of the interleaved hysteresis loop in the measurements of rotational core losses. J. Magn. Magn. Mater. 2016, 397, 157–163. [Google Scholar] [CrossRef]
  20. Morita, K.; Fujii, F. Modeling Bimorph Piezoelectric Actuator Exhibiting Frequency-Dependent Interleaved Hysteresis with Occasional Odd Harmonic Oscillation. In Proceedings of the 2019 IEEE 15th International Conference on Automation Science and Engineering (CASE), Vancouver, BC, Canada, 22–26 August 2019; pp. 1548–1554. [Google Scholar] [CrossRef]
  21. Sprekels, J.; Brokate, M. Hysteresis and Phase Transitions; Sprinver-Verlag: New York, NY, USA, 1996; Volume 121. [Google Scholar] [CrossRef]
  22. Al Janaideh, M.; Feng, Y.; Rakheja, S.; Tan, Y.; Su, C. Generalized Prandtl-Ishlinskii hysteresis: Modeling and robust control for smart actuators. In Proceedings of the 48h IEEE Conference on Decision and Control (CDC) held jointly with 2009 28th Chinese Control Conference, Shanghai, China, 15–18 December 2009; pp. 7279–7284. [Google Scholar] [CrossRef]
  23. Song, X.; Duggen, L.; Lassen, B.; Mangeot, C. Modeling and identification of hysteresis with modified Preisach model in piezoelectric actuator. In Proceedings of the IEEE International Conference on Advanced Intelligent Mechatronics (AIM 2017), Munich, Germany, 3–7 July 2017; pp. 1538–1543. [Google Scholar] [CrossRef]
  24. Li, Z.; Su, C.Y.; Chai, T. Compensation of Hysteresis Nonlinearity in Magnetostrictive Actuators With Inverse Multiplicative Structure for Preisach Model. IEEE Trans. Autom. Sci. Eng. 2014, 11, 613–619. [Google Scholar] [CrossRef]
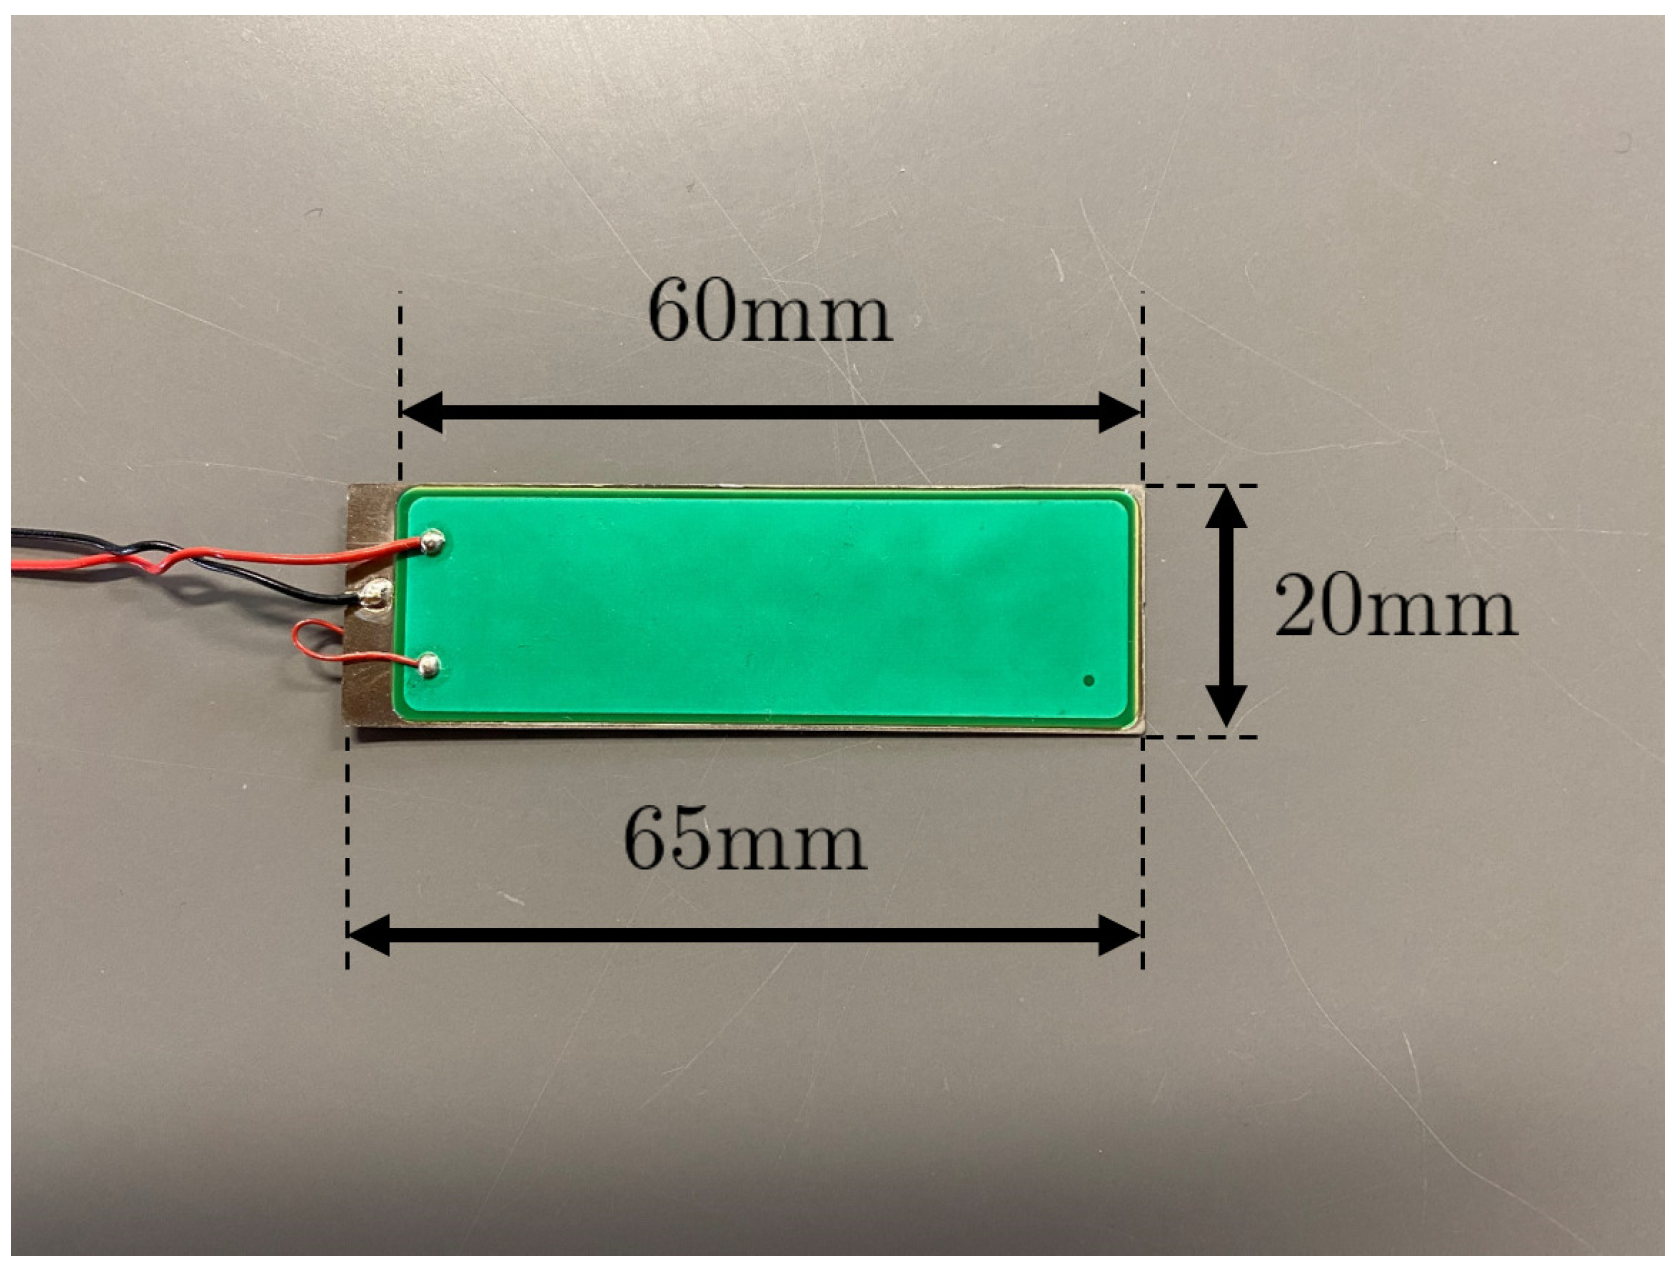
Figure 1. The piezoelectric bimorph actuator PZBA-00030.
Actuators 09 00036 g001
Figure 2. The play operator p r p .
Actuators 09 00036 g002
Figure 3. Discretizing the domain of integration of the play model.
Actuators 09 00036 g003
Figure 4. Gain-frequency characteristics of the target bimorph actuator.
Actuators 09 00036 g004
Figure 5. Time domain responses of the actuator for 1 and 30 Hz sinusoidal driving inputs.
Actuators 09 00036 g005
Figure 6. Four hysteresis loops observed around the resonance frequency.
Actuators 09 00036 g006
Figure 7. Twisted hysteresis loop because of the odd harmonic oscillation included in the response of the actuator.
Actuators 09 00036 g007
Figure 8. Results of Fast Fourier Transform (FFT) analyses of the response to three different driving frequencies.
Actuators 09 00036 g008
Figure 9. Peculiar hysteresis loops observed at frequencies higher than the resonance frequency.
Actuators 09 00036 g009
Figure 10. Magnetization boundary Q on a line r p = r .
Actuators 09 00036 g010
Figure 11. Illustrating the region corresponding to r > 0 in ( p , r p ) plane.
Actuators 09 00036 g011
Figure 12. The experimental apparatus.
Actuators 09 00036 g012
Figure 13. RMSE metrics of the three models tested.
Actuators 09 00036 g013
Figure 14. Fitting rates of the three models tested.
Actuators 09 00036 g014
Figure 15. The simulation results of the proposed identified model for four different input frequencies.
Actuators 09 00036 g015
Figure 16. RMSE plots of hysteresis simulation.
Actuators 09 00036 g016
Figure 17. Results of the hysteresis compensation experiment.
Actuators 09 00036 g017
Figure 18. Time domain plots of the reference and the corresponding actuator displacement.
Actuators 09 00036 g018
Figure 19. Result of FFT analysis on the output signal of the response for 25 Hz reference.
Actuators 09 00036 g019
Figure 20. Control input u c o m p [ k ] (“Comp-out” in the legend) and the reference y d [ k ] whose frequency is 25 Hz.
Actuators 09 00036 g020