Abstract
This paper presents a novel method for point-to-point path control for a hydraulic knuckle boom crane. The developed path control algorithm differs from previous solutions by operating in the actuator space instead of the joint space or Cartesian space of the crane. By operating in actuator space, almost all the parameters and constraints of the system become either linear or constant, which greatly reduces the complexity of both the control algorithm and path generator. For a given starting point and endpoint, the motion for each actuator is minimized compared to other methods. This ensures that any change in direction of motion is avoided, thereby greatly minimizing fatigue, jerky motion, and energy consumption. However, where other methods may move the tool-point in a straight line from start to end, the method in actuator space will not. In addition, when working in actuator space in combination with pressure-compensated control valves, there is no need for linearization of the system or feedback linearization due to the linear relationship between the control signal and the actuator velocities. The proposed solution has been tested on a physical system and shows good setpoint tracking and minimal oscillations.
1. Introduction
Presently, most hydraulic lifting and handling machines are manually operated. With an increasing demand for automation and higher efficiency, path control can be an important tool to achieve this. In this paper, a hydraulically actuated knuckle boom crane has been considered for path control. A typical offshore knuckle boom crane is shown in Figure 1.
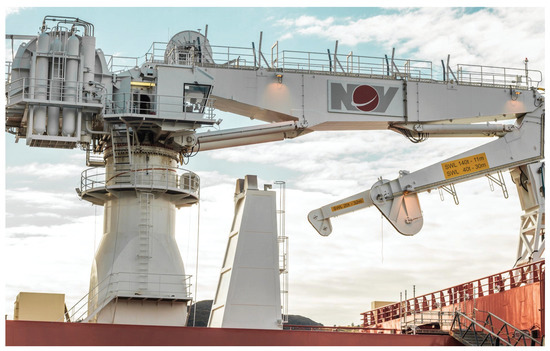
Figure 1.
Typical offshore knuckle boom crane, courtesy of National Oilwell Varco©.
The knuckle boom crane is used in a variety of industries, both onshore and offshore. This makes it a good platform for testing and development of new automation technologies. Also, it contains some of the major challenges associated with automation and path control of hydraulically actuated manipulators.
First, the relation between the controlled actuators, namely the hydraulic cylinders, and the state variables will depend on the joint angles in a nonlinear way. Secondly, the hydraulic control valves have some nonlinearity in the form of deadband, in addition to having limited bandwidth. Furthermore, the hydraulic cylinders are subjected to stiction, which may result in jerky motion when operating around zero velocity. This, in combination with the substantial structural flexibility of a weight optimized crane, may result in reduced performance and unnecessary fatigue of the crane.
Different approaches for motion control of hydraulic cranes have previously been investigated, including vector control, feed forward control, pressure control, and force control, see [1,2,3,4,5,6]. Modeling of hydraulic cranes has been investigated in [7,8,9,10]. Point-to-point control of robots has been studied in [11,12,13].
For non-redundant manipulators, tool-point control is typically done using inverse kinematics, [14,15,16]. By supplying a desired tool-point position, the joint angles for the manipulator can be calculated. This has been done on a hydraulic telescopic handler in [17], for a hydraulic crane in [18], and for flexible loader cranes in [19,20,21,22,23].
Tool-point control for a redundant loader crane was done in [24], and for a hydraulic manipulator in [25,26], where the redundancy was solved using the pseudo-inverse Jacobian method.
Trajectory planning was developed and implemented on a redundant forestry crane in [27]. The crane was controlled in 6-DOF joint space, while the task was described in 3D Cartesian space. This imposes highly nonlinear velocity constraints for the joints.
In [28], a tool-point control scheme was developed for a loader crane using interactive real-time simulation. This included velocity control in the joint space, configuration control, flow sharing, and an operator-in-the-loop.
In this paper, the idea of using the actuator space in manipulator control is introduced. It revolves around using the actuators length coordinates as the state variables. This will typically be the stroke of a hydraulic cylinder, and the rotational angle of a hydraulic motor. In Figure 2, the joint space joint angles and , and the actuator space cylinder strokes and for a typical knuckle boom crane are shown.
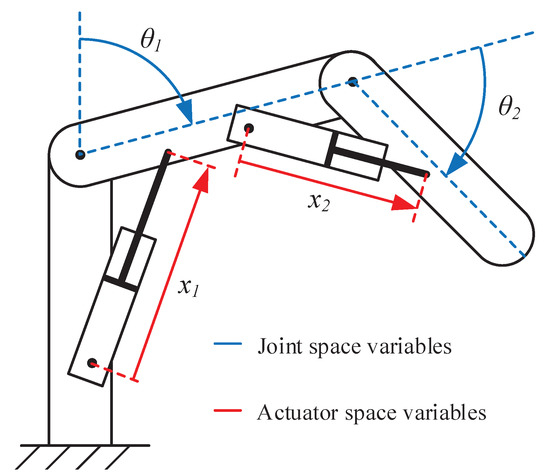
Figure 2.
Joint space coordinates and actuator space coordinates shown for a two degree of freedom crane.
For a typical hydraulic crane, the control signals are the openings of the pressure-compensated hydraulic valves. A constant valve opening will give a constant flow, and constant cylinder velocity . However, the angular velocity of the joint will not be constant. By using the cylinder stroke x as the state variable, we ensure a linear relation between the control signals and the state variables.
By using the actuator space with point-to-point path control, the motion of each actuator is inherently minimized. This will reduce fatigue and energy consumption. In addition, by ensuring that all the actuators finish their motion profile at the same time, the peak hydraulic flow of the system is minimized, which equates to indirect flow sharing. Furthermore, by avoiding change in the sign of the actuator velocity it is possible to avoid one of the main non-linearities associated with hydraulic cylinder drives, namely the jump in friction forces around zero velocity caused by stiction between piston and cylinder.
One thing to note is that when using point-to-point in actuator space, the tool-point will not follow a straight line in Cartesian space, due to the nonlinear relation between the two spaces. The tool-point will rather tend to move in an arc between two points in Cartesian space.
In this paper, model-based design has been used in combination with laboratory experiments. A simulation of the system has been made using a hydraulic-mechanical model and the developed control algorithms. The simulation results have been verified with laboratory experiments.
2. Considered System
In this paper, an HMF 2020K4 loader crane has been used for experiments. This crane has a total of 5 actuators: slew cylinder, main cylinder, knuckle cylinder, telescopic cylinder, and a winch. In this case, the winch and telescopic cylinder have been omitted, leaving the system with three degrees of freedom and no redundancy which, basically, corresponds to a knuckle boom crane. An illustration of the crane is shown in Figure 3.
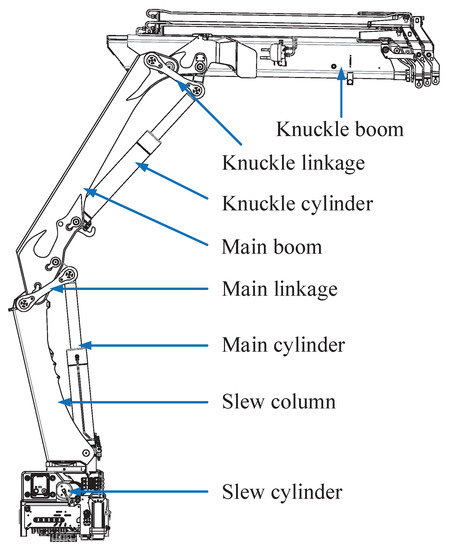
Figure 3.
Illustration of the HMF 2020K4 loader crane.
The slew cylinder is rotating the crane with a rack and pinion. The main cylinder and the knuckle cylinder are connected to their respective booms through a linkage system.
Each actuator is controlled via a pressure-compensated proportional directional valve which ensure load independent flow control of the actuators. Counterbalance valves are also used for load holding, assisting in lowering of the booms, and pressure relief of pressure surges. An illustration of the hydraulic system for the knuckle cylinder is shown in Figure 4.
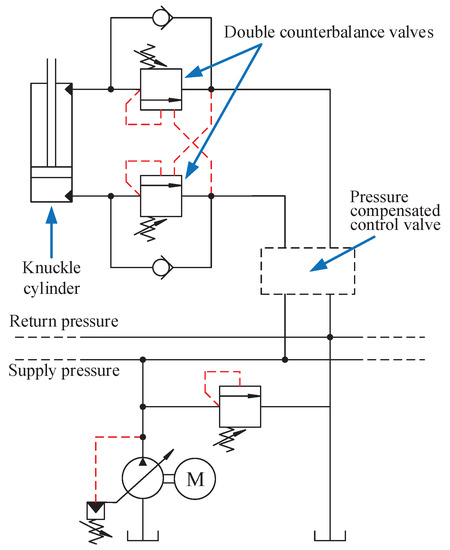
Figure 4.
Hydraulic circuit for the knuckle cylinder.
The slew cylinder and knuckle cylinder have double counterbalance valves, while the main cylinder only has one.
The HMF 2020K4 is connected to a National Instruments CompactRIO, which has I/O modules for connecting the sensors and for sending control signals to the valves. There are position sensors on the main cylinder and knuckle cylinder, and an angle sensor between the base and the slew column. The CompactRIO contains the path generator algorithm and the control algorithm.
Difference from Robotic Systems
As motion control of robots is an extensively studied subject, inspiration can be taken from it when developing motion control of hydraulic manipulators and more specifically, cranes. However, there are clear differences which affect the development of controllers and algorithms. First, the actuators for robots are typically motors connected to each joint of the robot’s arms. For the HMF 2020K4 crane, the actuators are cylinders connected to the booms via linkages. For robots, the equation of motion is generally written as shown in Equation (1).
where,
= Inertia matrix;
= Coriolis and centripetal force matrix;
= Gravitational force vector;
= Applied torque in each joint;
= Joint angle, angular velocity and angular acceleration;
Since cranes typically move with accelerations several orders of magnitude smaller than gravity and with relatively low velocities, the effect of the terms and are, typically, less important than the gravitational loads . As for actuation, for a robot the motor torque is applied in each joint. For a crane with cylinders, the applied torque of each joint is the product of the effective torque arm , which is a nonlinear function of q, and the cylinder force , which depends on the cylinder pressures and flows. The governing equations associated with the hydraulics are shown in Equations (2)–(6).
where,
= Effective torque arm;
= Cylinder force;
= Pressure in chamber a;
= Pressure in chamber b;
= Cylinder area a-side;
= Cylinder area b-side;
= Flow into chamber a;
= Flow into chamber b;
= Volume of chamber a;
= Volume of chamber b;
= Oil bulk modulus;
= Cylinder velocity.
With a pressure-compensated directional valve, the control signal controls the flows and . Since the pressure compensator senses the load pressure to ensure the desired flow, the joint torques are automatically adjusted to give the desired motion. The nonlinear dynamics does not disappear, but it is compensated for in the hydraulic circuit, instead of in the controller.
3. System Modeling
For the purpose of verifying the developed control strategies, a time domain simulation model of the crane has been developed in the commercial simulation tool SimulationX. This model contains the mechanical system with booms and linkages, and the hydraulic system with pressure-compensated proportional directional valves and counterbalance valves. The structural flexibility of the mechanical system has not been considered.
The model of the crane is a dynamic hydraulic-mechanical model. The mechanical model is a 3D multibody system, while the hydraulic model is a 1D system. The cylinders have been replaced with force elements which connect the mechanical and hydraulic model, similar to Equations (2)–(6). A 3D view of the crane from SimulationX is shown in Figure 5.
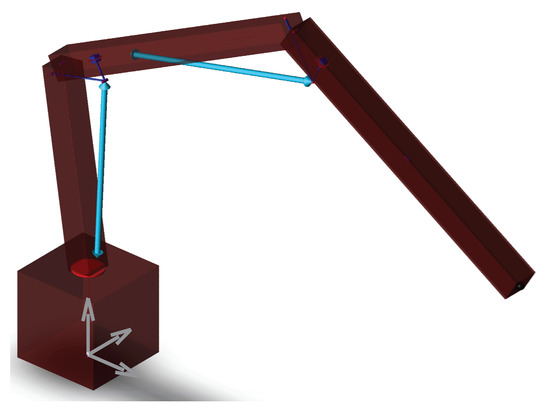
Figure 5.
3D view of the crane in SimulationX.
The mass of the booms has been estimated based on available CAD drawings. As an example, the main boom has a mass of kg, a length of m, and a mass moment of inertia around the axis of the main hinge of kg·m2.
An illustration of the pressure-compensated proportional directional valve is shown in Figure 6.
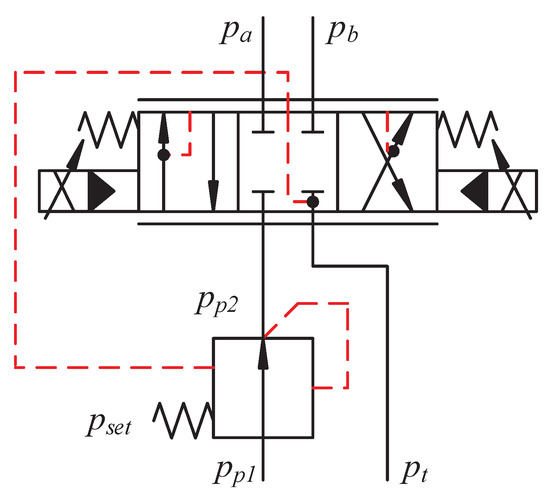
Figure 6.
Hydraulic pressure-compensated directional valve.
To mimic the behavior of the pressure compensator, a pressure source has been used for . Equation (7) describes how the pressure is calculated.
where,
= compensated pressure;
= pressure at port a;
= pressure at port b;
= tank pressure;
= spring pressure setting, set to 10 bar;
u = position of the spool, .
The sensing of the load pressures and ensure that the pressure drop over the valve always equals , and the flow is load independent. This is shown in Equation (8).
where,
= discharge coefficient;
= maximum discharge area;
= mass density;
= maximum valve flow.
To ensure that the valve will always be able to give the desired flow, a safety factor of has been used for the path generator. This will help the setpoint to stay below , even when the system is falling behind the reference and the controller needs to catch up, shown in Equation (9).
where,
= maximum valve flow reference;
= safety factor, 0.8.
An illustration of the counterbalance valves is shown in Figure 7.
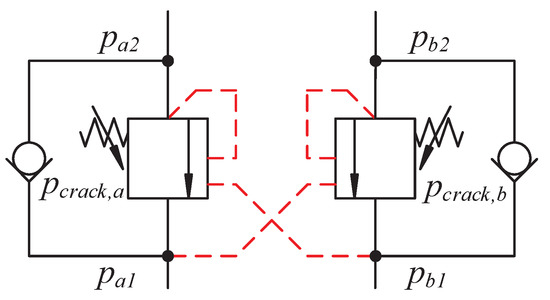
Figure 7.
Double counterbalance valve.
= unconstrained opening of valve a;
= unconstrained opening of valve b;
= opening of valve a;
= opening of valve b;
= pressure at valve a input sid;
= pressure at valve a actuator side;
= pressure at valve b input side;
= pressure at valve b actuator side;
= crack pressure of valve a;
= crack pressure of valve b;
= pilot area ratio;
= pressure difference between fully closed and fully open, 10 bar.
When and are 0, the valves are closed. When they are 1, the valves are fully open. During operation, the valves tend to be somewhere between 0 and 1, meaning that they are throttling the flow. The valves are modeled as first order transfer functions in the simulation model to induce some time delay and dynamics, since the valves have a finite bandwidth.
The model from SimulationX has been exported as C-code to MATLAB/Simulink for testing and prototyping of the path generator algorithm and control algorithm.
4. Control Architecture
The control architecture consists of two parts: the control system which measures the cylinder positions and sends control signals to the valves, and the path generator algorithm which generates the setpoints for position and velocity for each actuator.
4.1. Path Generator
The point-to-point path generator operates in actuator space, which uses the cylinder length coordinates as state variables. The main and knuckle cylinder length coordinates are used directly, but since the slew cylinder is connected to the slew column via a rack and pinion, the slew angle is used instead of the slew cylinder length coordinate. Please note that the slew angle is proportional to the slew cylinder length coordinate. This means that the state variables are:
where,
= angle of slew column;
= length of main cylinder;
= length of knuckle cylinder.
By operating in actuator space, the relationship between the input and the velocity of each actuator becomes linear, since the pressure-compensated directional control valves ensure a load independent hydraulic flow for a given valve input. The valves have some deadband, but this is counteracted with a deadband compensator in the controller.
In addition, when operating in actuator space, the velocity constraints become constant, defined by the maximum flow of the control valves and the cylinder area. This is not the case in joint space or Cartesian space, in which the velocity constraints will be nonlinear. This greatly simplifies both the path generation and control of the system.
In addition to the position and velocity constraints, artificial acceleration constraints have been imposed on the system to reduce fatigue and oscillations. The acceleration constraints correspond to the slopes of the trapezoidal velocity profiles. For the acceleration constraint, the following rule of thumb from [29] has been used, which minimizes overshoot for trapezoidal velocity profiles.
where,
= ramp time for velocity profile;
= natural frequency of the system.
A substitution can be made with the following assumptions.
where,
= maximum allowable acceleration;
= maximum velocity of actuator.
By using this substitution, all the constraints of the actuators are defined in terms of the state variables and their derivatives, and parameters from hydraulic components. Please note that the estimate of the natural frequency should be low to account for any estimation errors. This will ensure that the system will always be able to follow the trapezoidal velocity profile with minimal overshoot.
The input to the path generator is a list of the desired actuator positions, and the current actuator positions. A block diagram of the point-to-point path controller is shown in Figure 8.

Figure 8.
Point-to-point path controller structure.
From the list of points in actuator space, the path generator calculates trapezoidal velocity profiles for each actuator, based on their maximum velocity and maximum allowable acceleration. The safety factor is used for the velocity, as introduced in Section 3.
Equations (18)–(28) are used to calculate the trapezoidal velocity profiles for the three actuators. This also includes a correctional step if the ramp time is larger than half the total time. In addition, it is ensured that the actuators reach the desired point at the same time. Since the actuators reach the desired point at the same time, the maximum required flow is reduced, because in most cases only one of them will run at full speed. This would not be the case if they all ran full speed at the start, and then two of the actuators waited for the third to finish the motion, in which case the maximum flow would be large at the beginning of the motion.
The ramp time and total time T are calculated as follows for the 3 actuators:
A corrected ramp time and total time are now introduced for each actuator. They will alter the velocity profile if the ramp time is larger than half of the total time. This happens when . In this case, the velocity profile is altered into a triangle, with :
The common total time is used to ensure that all actuators finish their motion at the same time:
The corrected maximum velocity and trapezoidal velocity profile are then described as follows:
The trapezoidal velocity reference and position reference are then computed:
The parameters for the trapezoidal velocity profile are shown in Figure 9.
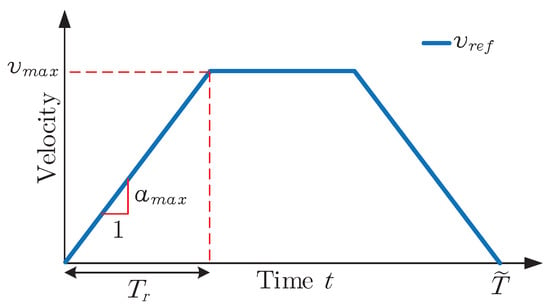
Figure 9.
Parameters for velocity profile.
An example of a trapezoidal velocity profile for three actuators is shown in Figure 10.
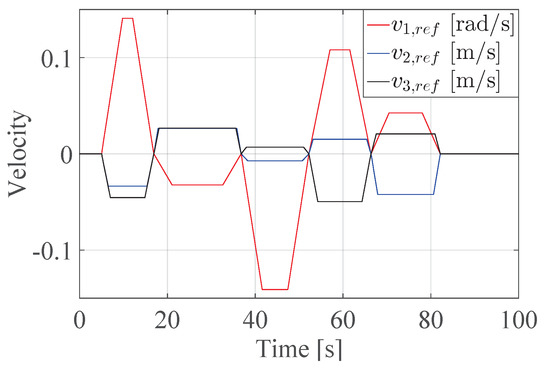
Figure 10.
Example of trapezoidal velocity reference for three actuators.
As seen in Figure 10, the maximum velocity for each segment changes, corresponding to the value of the corrected maximum velocity .
4.2. Control Structure
The selected control structure is a P-controller for position, and a feed forward gain for velocity. The feed forward gain is simply the ratio from valve opening to actuator velocity, which is determined from the components in the system. An illustration of the selected control system is shown in Figure 11.
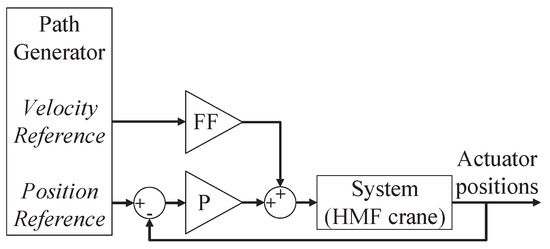
Figure 11.
Control system block diagram.
Since both the references and the output of the system are in the actuator space, a simple linear controller can be used. Please note that the system from valve input to actuator position is linear after deadband compensation has been added. The equation for the control input u is given in Equation (29).
5. System Simulation
Using the crane model described in Section 3, and path generator and control structure from Section 4, a complete system simulation has been performed in MATLAB/Simulink. A list of points for the path generator has been made to ensure a wide range of operation, both with respect to the actuator velocities and positions.
5.1. Simulation Setup
For the simulation, the natural frequency for each actuator has been estimated from the system model. A low estimate of the natural frequency has been used in the path controller to define the acceleration constraints, shown in Table 1.

Table 1.
Estimated natural frequencies for the three actuators.
The maximum velocities used are given in Table 2.

Table 2.
Maximum velocities for the three actuators.
Since a complete model of the system, path generator, and controller is available in a virtual environment, some effort has been made to tune the controller to optimize the crane motion. The virtual environment is well suited for design and numerical test of controllers and tunable parameters. Emphasis has been made to ensure minimal tracking error, as well as reducing the oscillations in the control signal. Minimizing the tracking error ensures an overall good system performance, both in simulation and real-world applications. Minimizing the oscillations in the control signal will help reducing certain unwanted phenomena in real-world applications, namely fatigue, jerky motion, and excitation of unmodeled dynamics. The tunable parameters in the controller, , , and , have all been tested manually, as well as using optimization.
An objective function has been made to both minimize the tracking error and the oscillations in the control signal, using a weighted summation. The objective function to be minimized uses the data from each iteration of the simulation, and is shown in Equation (30).
where,
= normalization vector 1, [1 rad−1 1 m−1 1 m−1]T;
= normalization vector 2, [1 s 1 s 1 s]T;
e = actuator position error;
= time derivative of control signal.
The normalization vectors and ensure that the objective function is unitless.
Since the control signal u is proportional to the actuator velocity, the time derivative of the control signal will be proportional to the actuator acceleration. By minimizing , unwanted accelerations will also be minimized.
By using the RMS value, both positive and negative tracking errors will be reduced. In addition, the variable time step of the simulation will not affect the objective function.
It should be noted that even though the weighted summation of e and might seem arbitrary, it still ensures that both design criteria will contribute to the total objective function. This ensures that potential solutions that have a low tracking error, but large oscillations, will not be selected, and vice versa.
A simplified Genetic Algorithm has been used to minimize the objective function. Inspiration was taken from [30]. The Genetic Algorithm was selected based on its robustness and ability to minimize non-smooth functions. The algorithm employs a population of potential solutions. Crossover, mutation, and elitism are then used to create a new population every iteration. A flowchart of the Genetic Algorithm is shown in Figure 12.

Figure 12.
Flowchart of the Genetic Algorithm.
To generate the parents, the individuals are sorted from best to worst and assigned in pairs. The generated list of pairs of parents follows this ranking sequence, see Table 3. denotes the best individual and so on.

Table 3.
Genetic Algorithm parent pair generation sequence.
The crossover function uses a random weighing from the parents to create the genes for the offspring, shown in Equation (31).
where,
= offspring of parent a and b;
= parent a;
= parent b;
= random number [0,1] for crossover between a and b.
After the crossover, mutation is performed on 20% of the individuals which are randomly selected, based on Equations (32)–(33).
where,
= upper bound for parameters;
= lower bound for parameters;
= mutation factor [0,1];
= mutation range;
= mutated offspring;
= offspring of parent a and b;
= random number [0,1] for offspring .
The last step is elitism, which copies the best 2% of individuals from the previous generation into the new generation without modification. This ensures that the smallest objective value does not increase from generation to generation, in addition to ensuring that the best solutions will generate even more offspring.
5.2. Simulation Results
The simulation results shown here have been made using the selected parameters from Section 5.1. The controller parameters from the Genetic Algorithm which minimized the objective function are shown in Table 4.

Table 4.
Controller parameters from minimization.
Figure 13 shows the position reference made by the path generator. The trapezoidal velocity reference gives a smooth position reference.
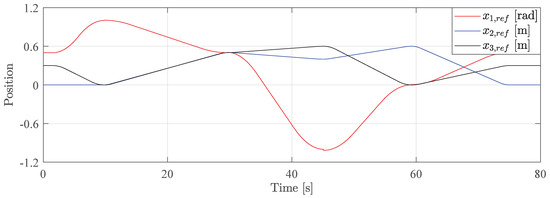
Figure 13.
Position reference from simulation.
Figure 14 shows the valve input during operation. The maximum valve input is approximately 0.8 during the simulation, which corresponds to the safety factor . This figure also shows that the valve inputs are not oscillating, which helps to reduce fatigue in a real-world scenario.
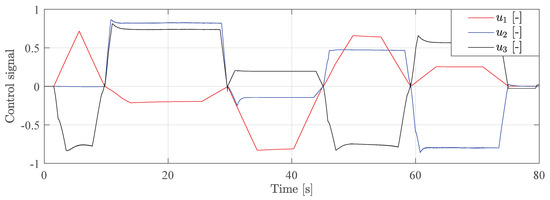
Figure 14.
Valve input from simulation.
Figure 15 shows the position error for each actuator, which is less than 0.01 m for the cylinders, and less than 0.04 rad for the slew column.
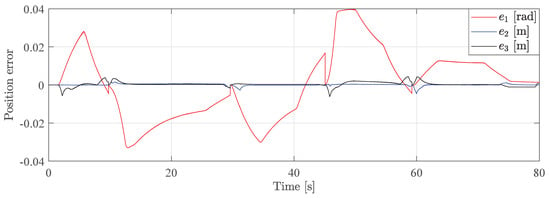
Figure 15.
Position error from simulation.
These results show that the path generator and controller have good tracking performance without large oscillations in the system.
6. Practical Implementation
Laboratory experiments have been made with the HMF 2020K4 loader crane to verify and compare the results from the simulations, and to ensure that the proposed controller is feasible in a real-world scenario.
The control system and path generator have been implemented on a CompactRIO connected to the crane, and have been programmed in LabVIEW. The CompactRIO supports the LabVIEW MathScript Module, which allows MATLAB code to be used. This means that the algorithms developed in MATLAB/Simulink in Section 4 have been used directly.
Deadband compensation has been implemented for the laboratory experiments. The deadband for each actuator are shown in Table 5.

Table 5.
Deadband for each actuator.
The formula for the deadband compensation is shown in Equation (34).
where,
= compensated control signal;
u = control signal;
= deadband out;
= deadband in;
= desired deadband, 0.01.
By adding a small deadband , it is ensured that the valves will be able to stay closed when no movement is needed.
A path has been made from a list of desired actuator positions to test the system performance.
Figure 16 shows the control signal for each actuator in the laboratory test. The maximum control signal is approximately 0.8, which corresponds to the safety factor .
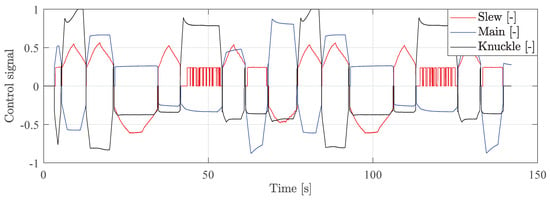
Figure 16.
Control signal from laboratory test.
It can also be seen that the control signals are not oscillating during regular motion, which was a criterion from Section 5. At around 50 s and 120 s the control signal for the slew valve is sitting at the edge of the deadband while moving slowly, which makes it appear to be oscillating heavily. At 10 s and 80 s the control signal for the knuckle valve saturates slightly as it tries to keep up with the reference.
Figure 17 shows the velocity for each actuator in the laboratory test.
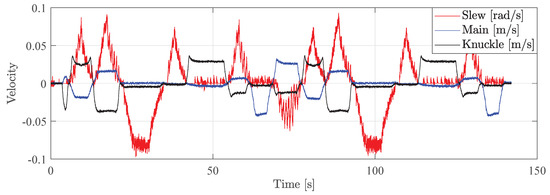
Figure 17.
Velocity from laboratory test.
The velocity of each actuator is proportional to the control signal, as expected with pressure-compensated valves. This also verifies that the actuators are moving at a constant velocity. The noise comes from the fact that the velocity signal is the derivative of the position sensor measurements.
Figure 18 shows the position error for each actuator in the laboratory test.
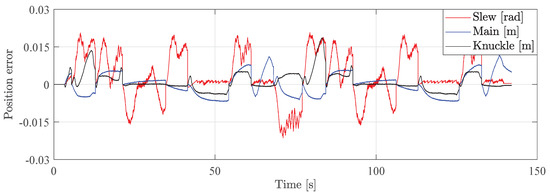
Figure 18.
Position error from laboratory test.
It can be seen that the errors are similar to the position errors from the simulation results in Section 5.2. This shows that the tuning has been successful.
7. Conclusions
In this paper, an HMF 2020K4 loader crane has been used as a testing platform for path control. By using a time domain simulation model of the crane, a path generator algorithm and control algorithm have successfully been developed and implemented. The novel path generator operates in actuator space, which indirectly linearizes the system and its constraints based on crane component specifications. This makes it possible to use a simple P-controller with feed forward without the need for plant linearization or feedback linearization.
An effort has also been made to optimize the controller, using a Genetic Algorithm for minimization, to ensure minimal tracking error as well as reducing oscillations in the system.
Simulation results show that the path generator and control system yield good performance. Tests performed in the laboratory also confirm the result, which show good setpoint tracking and minimal oscillations.
The proposed solution allows for simpler controller design compared to other methods, which eases implementation and tuning. In addition, the elimination of stiction during motion is a unique and advantageous feature of the proposed solution.
Future work can include extending the path control to cranes and hydraulic manipulators with kinematic redundancy. Implementation of path control with hanging loads can also be investigated where payload dynamics affect the manipulator. A performance evaluation of the proposed solution compared to other methods can also be made.
Author Contributions
Conceptualization, K.J.J., M.K.E. and M.R.H.; methodology, K.J.J.; software, K.J.J.; validation, K.J.J.; formal analysis, K.J.J.; investigation, K.J.J.; data curation, K.J.J.; writing–original draft preparation, K.J.J.; writing–review and editing, K.J.J., M.K.E. and M.R.H.; visualization, K.J.J.; supervision, M.K.E. and M.R.H. All authors have read and agreed to the published version of the manuscript.
Funding
This research was funded by the Norwegian Ministry of Education and Research grant number 155597. The APC was funded by the University of Agder.
Conflicts of Interest
The authors declare no conflict of interest.
References
- Krus, P.; Palmberg, J.O. Vector Control of a Hydraulic Crane. Int.-Off-Highw. Powerpl. Congr. Expo. 1992. [Google Scholar] [CrossRef]
- Beiner, L. Identification and Control of a Hydraulic Forestry Crane. Mechatronics 1997, 7, 537–547. [Google Scholar] [CrossRef]
- Mattila, J.; Virvalo, T. Energy-efficient Motion Control of a Hydraulic Manipulator. In Proceedings of the 2000 IEEE International Conference on Robotics and Automation, San Francisco, CA, USA, 24–28 April 2000. [Google Scholar] [CrossRef]
- Zhang, Q. Hydraulic Linear Actuator Velocity Control Using a Feedforward-plus-PID Control. Int. J. Flex. Autom. Integr. Manuf. 1999, 7, 277–292. [Google Scholar]
- Sørensen, J.K.; Hansen, M.R.; Ebbensen, M.K. Boom Motion Control Using Pressure Control Valve. In Proceedings of the 8th Fluid Power Net International Ph.D Symposium on Fluid Power, Lappeenranta, Finland, 11–13 June 2014. [Google Scholar] [CrossRef]
- Sørensen, J.K.; Hansen, M.R.; Ebbesen, M.K. Load Independent Velocity Control on Boom Motion Using Pressure Control Valve. In Proceedings of the Fourteenth Scandinavian International Conference on Fluid Power, Tampere, Finland, 21–23 May 2015. [Google Scholar]
- Hera, P.L.; Morales, D.O. Model-Based Development of Control Systems for Forestry Cranes. J. Control. Sci. Eng. 2015. [Google Scholar] [CrossRef][Green Version]
- Dai, L.; Wu, Y.; Wang, J.; Li, Y.; Liu, Y. Modeling and Control of Flexible Hydraulic Robotic Arm. Adv. Eng. Forum 2012, 2–3, 334–339. [Google Scholar] [CrossRef]
- Nielsen, B.; Pedersen, H.C.; Andersen, T.O.; Hansen, M.R. Modelling and simulation of mobile hydraulic crane with telescopic arm. Aust. J. Mech. Eng. 2005, 2, 105–116. [Google Scholar] [CrossRef]
- Pedersen, H.C.; Andersen, T.O.; Nielsen, B.K. Comparison of Methods for Modeling a Hydraulic Loader Crane With Flexible Translational Links. J. Dyn. Syst. Meas. Control. 2015, 137. [Google Scholar] [CrossRef]
- Park, Y.S.; Cho, H.S.; Koh, K.C. Robot Positioning Based on Point-to-Point Motion Capability; University of North Texas Libraries: Denton, TX, USA, 2000. [Google Scholar]
- Ailon, A.; Zohar, I. Point-to-point control and trajectory tracking in wheeled mobile robots: Some further results and applications. In Proceedings of the 17th IFAC World Congress, Seoul, Korea, 6–11 July 2008; Volume 41, pp. 9546–9551. [Google Scholar] [CrossRef]
- Alipour, K.; Moosavian, S.A.A. Point-to-point stable motion planning of wheeled mobile robots with multiple arms for heavy object manipulation. In Proceedings of the 2011 IEEE International Conference on Robotics and Automation, Shanghai, China, 9–13 May 2011; pp. 6162–6167. [Google Scholar]
- Kucuk, S.; Bingul, Z. The Inverse Kinematics Solutions of Industrial Robot Manipulators. In Proceedings of the IEEE International Conference on Mechatronics, Istanbul, Turkey, 5–5 June 2004; pp. 274–279. [Google Scholar] [CrossRef]
- Pieper, D.L. The Kinematics of Manipulators under Computer Control. Ph.D. Thesis, Department of Mechanical Engineering, the Stanford University, Stanford, CA, USA, 24 October 1968. [Google Scholar]
- Paul, R.P. Robot Manipulators: Mathematics, Programming, and Control: The Computer Control of Robot Manipulators; MIT Press: Cambridge, MA, USA, 1981; Available online: https://books.google.no/books?id=UzZ3LAYqvRkC&printsec=frontcover&redir_esc=y#v=onepage&q&f=false (accessed on 9 April 2020).
- Cinkelj, J.; Kamnik, R.; Cepon, P.; Mihelj, M.; Munih, M. Robotic control system for hydraulic telescopic handler. In Proceedings of the 19th International Workshop on Robotics in Alpe-Adria-Danube Region, Budapest, Hungary, 24–26 June 2010. [Google Scholar] [CrossRef]
- Bak, M.K.; Hansen, M.R.; Karimi, H.R. Robust Tool Point Control for Offshore knuckle boom crane. In Proceedings of the 18th IFAC World Congress, Milano, Italy, 28 August–2 September 2011. [Google Scholar]
- Ebbesen, M.; Andersen, T.; Hansen, M. Optimal Control of Hydraulically Actuated Flexible Multibody Systems. In Proceedings of the 2nd International Conference on Computational Methods in Fluid Power, FPNI’06, Aalborg, Denmark, 2–3 August 2006. [Google Scholar]
- Ebbesen, M.; Hansen, M.; Andersen, T. Optimal Velocity Control of Hydraulically Actuated Flexible Loader Crane. In Proceedings of the 20th Nordic Seminar on Computational Mechanics, Gothenburg, Sweden, 23–24 November 2007. [Google Scholar]
- Ebbesen, M.K.; Hansen, M.R. Correction Scheme for Tool Point Velocity Control of a Flexible Hydraulically Actuated Manipulator. In Proceedings of the International Conference Modelling, Identification, and Control, Innsbruck, Austria, 15–17 February 2010; pp. 298–305. [Google Scholar]
- Ebbesen, M.; Andersen, T.; Hansen, M. Trajectory Planning for Hydraulically Actuated Flexible Loader Crane. In Proceedings of the 12th AIAA/ISSMO Multidisciplinary Analysis and Optimization Conference, Victoria, BC, Canada, 10–12 September 2008. [Google Scholar] [CrossRef]
- Ebbesen, M.; Hansen, M. Tool Point Control of Material Handling Crane in Marine Operations. In Proceedings of the 24th International Congress on Condition Monitoring and Diagnostics Engineering Management, COMADEM International, Stavanger, Norway, 30 May–1 June 2011. [Google Scholar]
- Pedersen, H.C.; Nielsen, B.; Andersen, T.O.; Hansen, M.R.; Pedersen, P. Resolved Motion Control of a Hydraulic Loader Crane. In Proceedings of the 1st International Conference on Computational Methods in Fluid Power Technology, Melbourne, Australia, 26–28 November 2003. [Google Scholar]
- Kjelland, M.B.; Tyapin, I.; Hovland, G.; Hansen, M.R. Tool-point control for a redundant heave compensated hydraulic manipulator. In Proceedings of the 2012 IFAC Workshop on Automatic Control in Offshore Oil and Gas Production, Norwegian University of Science and Technology, Trondheim, Norway, 31 May–1 June 2012; pp. 299–304. [Google Scholar]
- Kjelland, M.B.; Hansen, M.R.; Tyapin, I.; Hovland, G. Tool-point control of a planar hydraulically actuated manipulator with compensation of non-actuated degree of freedom. In Proceedings of the 12th International Conference on Control, Automation and Systems, JeJu Island, Korea, 17–21 October 2012; pp. 672–677. [Google Scholar]
- Mettin, U.; Hera, P.X.L.; Morales, D.O.; Shiriaev, A.S.; Freidovich, L.B.; Westerberg, S. Path-constrained Trajectory Planning and Time-independent Motion Control: Application to a Forestry Crane. In Proceedings of the 14th International Conference on Advanced Robotics, Munich, Germany, 22–26 June 2009. [Google Scholar]
- Pedersen, M.M.; Hansen, M.R.; Ballebye, M. Developing a Tool Point Control Scheme for a hydraulic crane using interactive real-time dynamic simulation. Model. Identif. Control. 2010, 31, 133–143. [Google Scholar] [CrossRef][Green Version]
- Bak, M.K. Model Based Design of Electro-Hydraulic Motion Control Systems for Offshore Pipe Handling Equipment. Ph.D. Thesis, University of Agder, Grimstad, Norway, 2014. Available online: https://uia.brage.unit.no/uia-xmlui/handle/11250/194938 (accessed on 9 April 2020).
- How the Genetic Algorithm Works. Available online: https://se.mathworks.com/help/gads/how-the-genetic-algorithm-works.html (accessed on 20 March 2020).
© 2020 by the authors. Licensee MDPI, Basel, Switzerland. This article is an open access article distributed under the terms and conditions of the Creative Commons Attribution (CC BY) license (http://creativecommons.org/licenses/by/4.0/).