Article

A Novel, Low-Cost and Reliable Workbench for Optimal Voltage Distribution on Piezoelectric Array Actuators

Department of Engineering, University of “Roma Tre”, Via della Vasca Navale 79, 00146 Roma, Italy
*
Author to whom correspondence should be addressed.
Actuators 2019, 8(1), 6; https://doi.org/10.3390/act8010006
Submission received: 5 December 2018 / Revised: 30 December 2018 / Accepted: 2 January 2019 / Published: 4 January 2019

Abstract

:
The vibration control of structures is a valuable technique to increase their integrity and life-cycle. Among smart materials, the passive and active control systems based on piezoelectric elements have been studied in depth. Since the size and location of the piezo-elements on the structure are relevant matters for the damping efficiency, many works have focused on their placement optimization. Under certain circumstances, some structures may be excited by more vibration modes at the same time; hence, the signal conditioning system of the piezoelectric actuators must be capable of adjusting the driving signal in terms of voltage distribution, frequencies and associated amplitudes in order to maximize the damping efficiency. Moreover, in some applications, it could be useful to individually control each actuator therefore tailor-made power supply and signal generation systems are often necessary. This work suggests a low-cost and reliable workbench that overcomes the afore mentioned problems. The system consists of: (1) two arrays of 13 piezoceramic plates which have been glued on an aluminium beam, (2) ad hoc power supply equipment, and (3) mechanical relays arrays managed by a microcontroller for the individual handling of their operating modes. Furthermore, an Arduino board and an in-house software have been implemented in order to perform a task on each relay that is in turn wired to a single piezoelectric plate (PP). The performance of the developed system is evaluated in terms of noise and distortion of the testing signal measured at different points of the workbench. The results show that the proposed workbench may represent a good trade-off between affordability, accuracy and reliability and it can be used for several research purposes.

1. Introduction

The vibration control is a topic of great interest in many technical fields [1,2,3,4,5,6,7,8,9]. In gas turbine engines, e.g., the vibrations are often produced by interactions between blades and fluid and the corresponding fatigue phenomena can lead to catastrophic failures [10,11,12,13,14,15,16,17]. If an active vibration mitigation system based on piezoelectric actuators is considered, the voltage distributions to the elements is a relevant issue for the damping efficiency [6,7,8,18,19,20,21]. However, the use of piezoelectric actuators may involve high voltage (hundreds of Volts) to produce adequate force and displacement so a proper power supply and signal conditioning systems are required. High voltage amplifiers are necessary to magnify the piezoelectric actuator driving signal but, as a consequence, the equipment involves high costs. In this regard, a commercial low-noise (100 μ V RMS –25 m V RMS ) single-channel benchtop amplifier typically provides ± 200 V with costs ranging from 2000$ to 4000$. Moreover, in some applications, higher voltage is necessary and multiple piezoelectric actuators must be driven so that more amplifiers are required. In this regard, the present work suggests a low-cost and low-noise alternative equipment to individually manage two arrays of PPs. According to the above considerations some target requirements, which must be accomplished by the proposed workbench are identified:
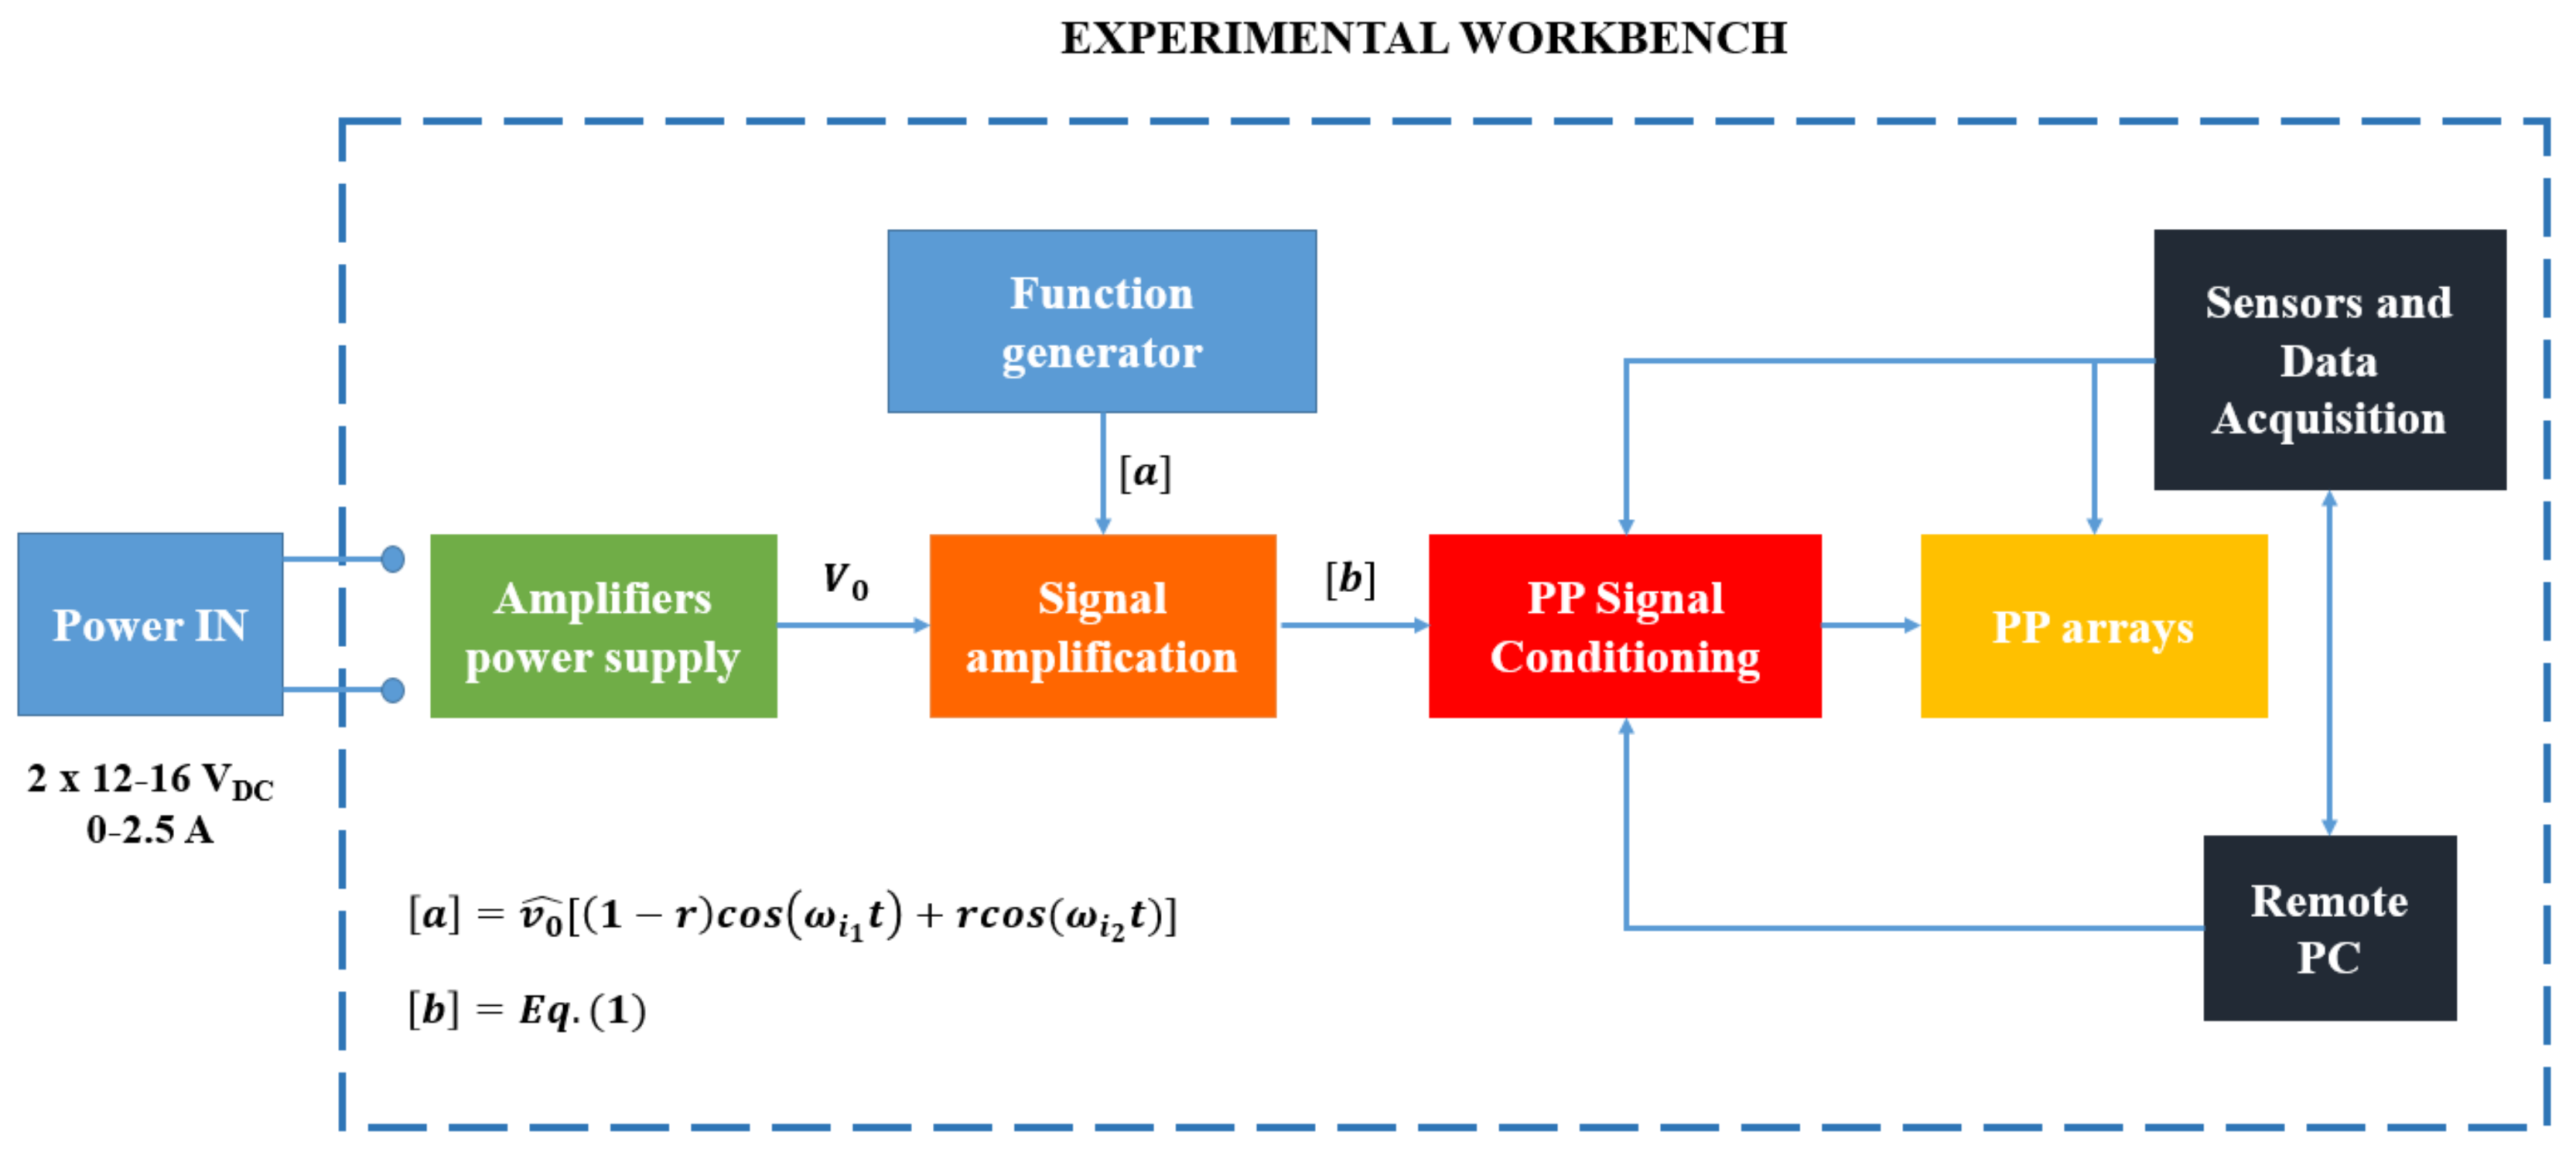
  • the workbench must be powered by a dual-channel DC power source (12–16 V DC , 0–2.5 A for each channel);
  • according to the Pin Force model [6] each PP couple (upper and lower plate) must be driven by the same signal (single or dual–tone), but one must be in opposition phase with respect to the other;
  • the PP driving signal must be adjustable in frequency (range 10 Hz–2 kHz) and tone amplitude (up to 450 V);
  • two operating modes of the PPs couples must be included;
  • the PP signal must be unaffected by the number of activated PP couples;
  • the PP couples operating modes must be managed by a remote PC.
In the current study, the whole workbench is presented and discussed in depth and a quality signal assessment has been performed on some key workbench components in the last Section. The corresponding values of the Signal–to-Noise And Distortion ratio (SINAD) and the Total Harmonic Distortion (THDF) have been evaluated by means of ten repetitive measurements as to the output signal of: (1) function generator, (2) piezo amplifiers, and (3) the actual signal delivered to each PP.

2. Materials and Methods

To damp the bimodal flexural vibrations, by piezoelectric active device, a new model for the electrical potential distribution has been proposed [22]. To summarize briefly, if ω i 1 , ω i 2 are the excited angular frequencies, r the relative contribution to the excitation induced by the second mode with respect to the first one and using the following expression for the voltage supplied to the piezoelectric plates:
v ( t ) = v 0 ( 1 r ) cos ( ω i 1 t ) + r cos ( ω i 2 t )
The optimal potential distributions, for the various coupling modes, are represented in Figure 1 and Figure 2 where x ¯ is the dimensionless length of the beam. For example, by analyzing Figure 1 and considering r = 1, the potential applied to the actuators located from the joint to x ¯ = 0.216 must be the opposite of that applied to the other, in such a way it is possible to optimally damp the second flexural mode. From a closer inspection of the graphs in Figure 2, it can be seen that, in accordance with the coupled modes and r values, up to 4 potential sign switches could be necessary to optimize the distribution of the potential (see the lower right graph in Figure 2).
To experimentally validate this model, a low-cost experimental setup has been realized. In this section the concept that underlies the circuit will first be described by means of a block diagram and then, in further detail, the functionality of each component will be disclosed. From an operational point of view, two arrays of 13 piezoelectric PZT plates (PI Ceramic PIC255) have been mounted on an aluminium cantilever beam (see Figure 3) so that 2 13 = 8192 PPs working configurations for each operating mode (Figure 4 and Table 1) can be obtained. Two consecutive piezoelectric plates can be considered practically joined together; in fact, the total gap (considering all the 13 PPs) is estimated to be 1 mm.
In order to accomplish all these combinations the following block diagram of the workbench is proposed (Figure 5):
The function generator (YOKOGAWA FG420) was used to provide the signal (1). Since a standard function generator cannot provide more than 20 V pp ( v ^ 0 m a x = 10 V) for each channel and by referring to the target requirements each PP may be supplied with v 0 which may reach up to 450 V, a signal amplification stage is required. Considering that a commercial high voltage power supply could cost up to 2000–4000$, in order to dramatically reduce the costs an amplifier power supply device has been designed and built. In Figure 6 its working principle is reported. It consists of: two high efficiency DC-AC step-up power converters, two diode bridges, two linear high voltage regulators and two potentiometers. Each DC-AC step-up power converter provides 320 V AC which is rectified by the diode bridge. In order to obtain ± 450 V DC the power converters were interconnected as shown in Figure 6. To allow the adjustment of v 0 two linear high voltage regulators were used and they can provide a v 0 from ±50 V DC to ±450 V DC depending on the potentiometers setting. As can be seen by Figure 6, the high voltage regulators are equipped with an internal feedback which is linked to the corresponding potentiometer, in such a way that they keep the chosen output voltage constant (±5%) even if the electrical load changes.
The role of the PP signal conditioning system is to experimentally reproduce one of the combinations of Table 1, while the sensors and data acquisition system acquire the measurement signal that is stored and processed by a remote computer (Figure 5). From a practical point of view the system was realized as shown in Figure 7. Because of the corresponding opposite plates (jA and jB in Figure 7) must be supplied with voltages of opposite signs (accordingly to the Pin Force Model [6]), two commercial high voltages op-amp (APEX 95) (one set in non inverting and the other in inverting configuration) provide the signals + [ b ] and [ b ] (refer to Figure 5 and Equation (1)). The PP signal conditioning apparatus consists of: an Arduino board, a demultiplexer and 26 single pole double throw (SPDT) mechanical relays. Figure 7 shows an example of a switching operating mode for the i-th combination of Table 1. The i-th combination is first reproduced by means of the digital outputs of the microprocessor, then the 13 output signals are doubled by a demultiplexer and sent to the reference channel of both the mechanical relays linked to each pair of actuators ( R jA , R jB ). It can be observed that the proper wiring of the mechanical relays allows to handle both of them with the same reference signal. For example to supply the signal + [ b ] and [ b ] , respectively, to the piezoelectric plates 1A and 1B, it is sufficient to set REF = +1.
The data acquisition and the selection of the voltage distribution that has to be applied on the PPs (see Table 1) can be performed at the same time by means of a LabView Virtual Instrument (LVI). The LVI was used to start the Arduino microprocessor that enables one combination at a time. Since a typical mechanical relay is affected by a switching delay of 15 ms, a time of about 0.4 s is needed to switch all the relays. Therefore a proper time period has been considered to ensure that every relay completes the commutation. In fact only after 3 s from the beginning of an Arduino task (execution of a combination from Table 1, does the acquisition of the measurement signal start and after 6 s Arduino de-activates the combination. This procedure is repeated for the successive test configurations. The flow chart of the Arduino software is reported in Figure 8. Some pictures of the actual whole system are shown in Figure 9 and Figure 10.

3. Results

In different application areas (wireless signal communication [23], mechanical vibrations measurement [24], transimpedance amplifier characterization [25], parametric multicasting mixer noise evaluation [26], ADC testing [27,28], low voltage non-linear power sources [29], electric power quality monitoring [30,31]) the SINAD (Signal to Noise and Distortion ratio, in dB) and the THDF (Total Harmonic Distortion, in %) were adopted to evaluate the workbench performance in terms of noise and distortion. The THDF was calculated as:
THD F ( % ) = 100 n = 2 m A n 2 A 1
where A n is the amplitude of the n-th harmonic, A 1 is the amplitude of the fundamental harmonic and m is the highest harmonic considered (7-th). The SINAD is the ratio of the RMS signal amplitude to the RMS sum of all other spectral components (excluding the DC component):
SIN AD ( dB ) = 10 l o g F 2 + N 2 + H 2 N 2 + H 2
where F , N , H are, respectively, the fundamental, noise and harmonic RMS levels. The workbench previously described is composed of several components such as the waveform generator, the two piezo amplifiers and the array of relays (see Figure 7) and some of them may introduce noise and distortion in the signal delivered to each PP. A sinusoidal test signal ( v 0 = 15 V pp , frequency corresponding to the first eigenfrequency of the beam) was set on the function generator and ten repetitive measurements were performed for the output of (refer to Figure 7):
  • the FUNCTION GENERATOR;
  • the AMP INV;
  • the AMP NOT INV.
All the tests were performed by executing the first and i-th combinations of Table 1. The average THDF for the function generator is very low as can be expected (uncertainty expressed as standard deviation), while the outputs of the amplifiers exhibit a slightly higher distortion. In Table 2 the measured values of SINAD and THDF are reported for the afore mentioned components. Finally, the same measurements and analysis were applied on the voltage actually delivered to each PP and the SINAD and THDF were assessed (Table 3 and Table 4). From a closer analysis of the SINAD and THDF data of Table 3 and Table 4 it can be seen that the performance of the workbench are substantially stable even if two different potential distributions are considered.
In conclusion a quite low signal distortion is confirmed through the whole workbench components and the stability of the system has been also verified.

4. Conclusions

In the present work, a low-cost workbench to experimentally reproduce the optimal potential distribution on PPs couples has been proposed. Furthermore, a LabView software has been developed to manage the Arduino microprocessor and collect the data from a sensor. One of the possible applications of the workbench could be the bimodal vibrations damping of a beam (by means of the optimal potential distribution). In order to evaluate the workbench performances in terms of noise and distortion, a characterization was carried out by means of SINAD and THDF assessment for different devices output (function generator, amplifiers and PPs input voltages). The results confirm a low signal distortion for all the devices and a substantial performance uniformity for different potential distribution configurations.
Future developments of this research aim to apply the present workbench and the optimal voltage distribution strategy to complex geometry beams, in which the flexural–torsional vibrations are coupled. In such a way it could be possible to damp the bimodal vibrations on turbomachinery rotor blades in order to enhance the fatigue-life of such components.

Author Contributions

L.S., F.B., A.R. and R.M. conceived and designed the proposed workbench; L.S., A.R. and R.M. factually built the workbench; L.S., F.O., A.S. and S.A.S. performed the experiments and analyzed the data; A.R. and F.B. wrote the paper.

Funding

The authors received no specific funding for this research.

Conflicts of Interest

The authors declare no conflict of interest.

References

  1. Weber, F.; Distl, H.; Fischer, S.; Braun, C. MR Damper Controlled Vibration Adsorber for Enhanced Mitigation of Harmonic Vibrations. Actuators 2016, 5, 27. [Google Scholar] [CrossRef]
  2. Botta, F.; Marx, N.; Schwingshackl, C.; Cerri, G.; Dini, D. A Wireless Vibration Control Technique for Gas Turbine Blades Using Piezoelectric Plates and Contactless Energy Transfer. ASME 2013. [Google Scholar] [CrossRef]
  3. Herold, S.; Mayer, D. Adaptive Piezoelectric Absorber for Active Vibration Control. Actuators 2016, 5, 7. [Google Scholar] [CrossRef]
  4. Botta, F.; Toccaceli, F. Piezoelectric Plates Distribution for Active Control of Torsional Vibrations. Actuators 2018, 7, 23. [Google Scholar] [CrossRef]
  5. Mokrani, B.; Bastaits, R.; Romanescu, I.; Horodinca, M.; Burda, I.; Preumont, A. Passive Damping of Rotationally Periodic Structures with Tuned Piezoelectric Inductive Shunt. Actuators 2018, 7, 41. [Google Scholar] [CrossRef]
  6. Crawley, E.F.; de Luis, J. Use of piezoelectric actuators as elements of intelligent structures. AIAA J. 1987, 25, 1373–1385. [Google Scholar] [CrossRef]
  7. Gupta, V.; Sharma, M.; Nagesh, T. Optimization Criteria for Optimal Placement of Piezoelectric Sensors and Actuators on a Smart Structure: A Technical Review. J. Intell. Mater. Syst. Sruct. 2010, 21, 1227–1243. [Google Scholar] [CrossRef]
  8. Frecker, M.I. Recent Advances in Optimization of Smart Structures and Actuators. J. Intell. Mater. Syst. Sruct. 2003, 14, 207–216. [Google Scholar] [CrossRef] [Green Version]
  9. Rossi, A.; Orsini, F.; Scorza, A.; Botta, F.; Belfiore, N.P.; Sciuto, S.A. A review on parametric dynamic models of magnetorheological dampers and their characterization methods. Actuators 2018, 7, 16. [Google Scholar] [CrossRef]
  10. Poursaeidi, E.; Salavatian, M. Fatigue grow simulation in a generator fan blade. Eng. Fail. Anal. 2009, 16, 888–898. [Google Scholar] [CrossRef]
  11. Witek, L. Experimental crack propagation and failure analysis of the first stage compressor blade subject to vibration. Eng. Fail. Anal. 2009, 16, 2163–2170. [Google Scholar] [CrossRef]
  12. Rafiee, M.; Nitzsche, F.; Labrosse, M. Dynamics, vibration and control of rotating composite beams and blades: A critical review. Thin-Walled Struct. 2017, 119, 795–819. [Google Scholar] [CrossRef]
  13. Ehrich, F.F. Observed Rotordynamic Phenomena in Aircraft Gas Turbine Development. In Proceedings of the 27th Conference on Mechanical Vibration and Noise International Design Engineering Technical Conferences and Computers and Information in Engineering Conference, Boston, MA, USA, 2–5 August 2015. [Google Scholar]
  14. Lourenco, N.J.; Graca, M.L.A.; Franco, L.A.L.; Silva, O.M.M. Fatigue failure of a compressor blade. Eng. Fail. Anal. 2008, 15, 1150–1154. [Google Scholar] [CrossRef]
  15. Kermanpur, A.; Sepehri, A.H.; Ziaei-Rad, S.; Nourbakhshnia, N.; Mosaddeghfar, M. Failure analysis of Ti6Al4V gas turbine compressor blades. Eng. Fail. Anal. 2008, 15, 1052–1064. [Google Scholar] [CrossRef]
  16. Witek, L. Simulation of crack growth in the compressor blade subjected to resonant vibration using hybrid method. Eng. Fail. Anal. 2015, 49, 57–66. [Google Scholar] [CrossRef]
  17. Witek, L. Fatigue Investigations of the Compressor Blades with Mechanical Defects. Key Eng. Mater. 2014, 598, 269–274. [Google Scholar] [CrossRef]
  18. Botta, F.; Dini, D.; Schwingshackl, C.; di Mare, L.; Cerri, G. Optimal placement of piezoelectric plates to control multimode vibrations of a beam. Adv. Acoust. Vib. 2013, 2013, 905160. [Google Scholar] [CrossRef]
  19. Botta, F.; Marx, N.; Gentili, S.; Schwingshackl, C.W.; Di Mare, L.; Cerri, G.; Dini, D. Optimal placement of piezoelectric plates for active vibration control of gas turbine blades: Experimental results. In Proceedings of the SPIE Smart Structures and Materials + Nondestructive Evaluation and Health Monitoring, San Diego, CA, USA, 3 April 2012. [Google Scholar]
  20. Botta, F.; Rossi, A.; Schinaia, L.; Scorza, A.; Orsini, F.; Sciuto, S.A.; Belfiore, N.P. Experimental Validation on Optimal Placement of PZT Plates for Active Beam Multimode Vibrations Reduction. In Proceedings of the 23rd Conference of the Italian Association of Theoretical and Applied Mechanics, Salerno, Italy, 4 September 2017. [Google Scholar]
  21. Rossi, A.; Botta, F.; Maiozzi, R.; Scorza, A.; Sciuto, S.A. Experimental results for active control of multimodal vibrations by optimally placed piezoelectric actuators. MATEC Web Conf. 2018, 211, 20001. [Google Scholar] [CrossRef]
  22. Botta, F.; Scorza, A.; Rossi, A. Optimal piezoelectric potential distribution for controlling multimode vibrations. Appl. Sci. 2018, 8, 551. [Google Scholar] [CrossRef]
  23. Zhao, J.J.; Zhao, X.B.; Li, X.H.; Zhang, B.; Wang, B.; Zhang, W. Fasteners State Detection System Based on Wireless Data Transfer Module. Appl. Mech. Mater. 2014, 513, 3924–3927. [Google Scholar] [CrossRef]
  24. Orsini, F.; Rossi, A.; Scorza, A.; Sciuto, S.A. Development and preliminary characterization of a novel system for the force platforms dynamic calibration. In Proceedings of the IEEE International Instrumentation and Measurement Technology, Torino, Italy, 22–25 May 2017. [Google Scholar]
  25. Adamo, F.; Attivissimo, F.; Marracci, M.; Tellini, B. Characterization of a system for measurements on soft ferrites. Meas. Sci. Technol. 2012, 23, 085602. [Google Scholar] [CrossRef]
  26. Wiberg, A.O.J.; Bres, C.S.; Danicic, A.; Myslivets, E.; Radic, S. Performance of Self-Seeded Parametric Multicasting of Analog Signals. IEEE Photonics Technol. Lett. 2011, 23, 1570–1572. [Google Scholar] [CrossRef]
  27. Šaliga, J.; Kollár, I.; Michaeli, L.; Buša, J.; Lipták, J.; Virosztek, T. A comparison of least squares and maximum likelihood methods using sine fitting in ADC testing. Measurement 2013, 46, 4362–4368. [Google Scholar] [CrossRef]
  28. Rapuano, S. Preliminary considerations on ADC standard harmonization. IEEE Trans. Instrum. Meas. 2008, 57, 386–394. [Google Scholar] [CrossRef]
  29. Ciufu, L.; Popescu, C.L.; Popescu, M.O. Experimental mitigation techniques to reduce the Total Harmonic Distortion of low voltage non-linear power sources. In Proceedings of the 10th International Symposium on Advanced Topics in Electrical Engineering, Bucharest, Romania, 23–25 March 2017. [Google Scholar]
  30. Dwivedi, V.; Singh, D. Electric Power Quality Monitoring (PQM) using Virtual Instrumentation. In Proceedings of the International Symposium on Power Electronics Electrical Drives Automation and Motion, Pisa, Italy, 14–16 June 2010. [Google Scholar]
  31. Shmilovitz, D. On the definition of total harmonic distortion and its effect on measurement interpretation. IEEE Trans. Power Deliv. 2005, 20, 526–528. [Google Scholar]
Figure 1. Optimal potential distributions for the coupling between the first and second modes. The picture on the right side shows the optimal potential distribution for r = 1.
Actuators 08 00006 g001
Figure 2. Optimal potential distributions for several coupled modes and r values. From the upper left graph to the lower left (clockwise): coupling between the 2nd and 3rd modes (upper left), coupling between the 3rd and 4th modes (upper right), coupling between the 2nd and 5th modes (lower right), coupling between the 1st and 3rd modes (lower left).
Actuators 08 00006 g002
Figure 3. Schematic diagram of the cantilever beam embedded with the piezoelectric plates. PPs in the upper surface are highlighted with a red rectangle, while green PPs are placed on the bottom surface.
Actuators 08 00006 g003
Figure 4. Illustration of the i-th combination of Table 1.
Actuators 08 00006 g004
Figure 5. Schematic diagram of the experimental workbench sections.
Actuators 08 00006 g005
Figure 6. Scheme of the amplifiers power supply circuit.
Actuators 08 00006 g006
Figure 7. Connection scheme of the proposed workbench.
Actuators 08 00006 g007
Figure 8. Arduino software flow chart.
Actuators 08 00006 g008
Figure 9. PPs signal conditioning section of the proposed workbench.
Actuators 08 00006 g009
Figure 10. Upper view of the PZT beam.
Actuators 08 00006 g010
Table 1. Operating mode possible combinations. + 1 and 1 are associated, respectively, to the activated or switched states depending on the considered operating mode.
Combination\Plates Couple12345678910111213
1+1+1+1+1+1+1+1+1+1+1+1+1+1
2+1+1+1+1+1+1+1+1+1+1+1+1−1
3+1+1+1+1+1+1+1+1+1+1+1−1+1
4+1+1+1+1+1+1+1+1+1+1+1−1−1
5+1+1+1+1+1+1+1+1+1+1−1+1+1
i+1+1+1+1+1−1−1−1−1−1−1−1−1
8192−1−1−1−1−1−1−1−1−1−1−1−1−1
Table 2. SINAD and THDF values measured for the function generator and amplifiers (±Standard Deviation).
SINAD (dB)THDF (%)
FUNCTION GENERATOR66.46 ± 0.070.013580 ± 1.62 × 10 4
AMP INV34.32 ± 0.030.03 ± 0.01
AMP Not INV33.70 ± 0.210.03 ± 0.01
Table 3. SINAD and THDF values measured for the i-th combination of Table 1: piezoelectric plates (±Standard Deviation).
PPs CoupleSINAD (dB) THDF (%)
PP A PP B PP A PP B
120.87 ± 0.3620.76 ± 0.111.61 ± 0.181.35 ± 0.16
219.93 ± 2.0119.64 ± 1.952.05 ± 0.151.65 ± 0.20
320.77 ± 0.3020.47 ± 0.181.95 ± 0.161.63 ± 0.21
421.30 ± 0.3821.04 ± 0.161.84 ± 0.161.50 ± 0.09
521.10 ± 0.0720.78 ± 0.102.06 ± 0.071.51 ± 0.08
620.44 ± 0.1721.21 ± 0.141.51 ± 0.232.19 ± 0.09
720.70 ± 0.1821.35 ± 0.331.56 ± 0.171.85 ± 0.15
820.89 ± 0.1621.64 ± 0.141.53 ± 0.182.09 ± 0.08
920.63 ± 0.2321.21 ± 0.691.53 ± 0.161.84 ± 0.14
1020.60 ± 0.1221.30 ± 0.101.45 ± 0.142.04 ± 0.09
1115.92 ± 1.1320.55 ± 1.565.61 ± 0.372.29 ± 0.76
1220.65 ± 0.1221.42 ± 0.111.47 ± 0.182.14 ± 0.06
1320.66 ± 0.1221.35 ± 0.101.50 ± 0.142.03 ± 0.08
Table 4. SINAD and THDF values measured for the first combination of Table 1: piezoelectric plates (±Standard Deviation).
PPs CoupleSINAD (dB) THDF (%)
PP A PP B PP A PP B
123.71 ± 0.2119.91 ± 0.490.32 ± 0.131.27 ± 0.32
224.32 ± 0.0321.00 ± 0.050.30 ± 0.041.23 ± 0.10
324.29 ± 0.4721.53 ± 0.080.36 ± 0.141.20 ± 0.10
424.64 ± 0.0121.84 ± 0.020.38 ± 0.191.20 ± 0.18
524.14 ± 0.3721.23 ± 0.860.36 ± 0.061.20 ± 0.21
624.65 ± 0.0321.49 ± 0.040.37 ± 0.041.34 ± 0.10
724.86 ± 0.0121.88 ± 0.040.43 ± 0.071.28 ± 0.10
824.90 ± 0.0122.01 ± 0.020.39 ± 0.151.24 ± 0.11
924.98 ± 0.0221.26 ± 0.040.38 ± 0.111.26 ± 0.14
1025.12 ± 0.0224.49 ± 0.120.31 ± 0.041.22 ± 0.03
1125.56 ± 0.2321.58 ± 0.760.76 ± 0.051.26 ± 0.45
1225.46 ± 0.0521.61 ± 0.120.43 ± 0.042.01 ± 0.23
1325.52 ± 0.0221.66 ± 0.130.50 ± 0.161.72 ± 0.17

