Abstract
This study presents a numerical investigation of the internal flow characteristics within the draft tube of a Kaplan turbine using computational fluid dynamics (CFD). The distribution and evolution of vortical structures, particularly the formation and development of vortex ropes under various operating conditions, are systematically analyzed. The study aims to explore the effects of blade angle and guide vane opening on the internal flow characteristics of the unit, thereby providing guidance for flow control strategies. The influence of guide vane opening and turbine head on vortex dynamics and flow stability is examined, with a focus on the pressure pulsations induced by vortex ropes through frequency-domain analysis. The results indicate that increased guide vane openings and higher heads lead to the expansion and downstream extension of the vortex rope into the elbow section, causing significant low-frequency pressure pulsations and enhancing flow instability. These findings contribute to a deeper understanding of unsteady flow behavior in Kaplan turbine draft tubes and provide a theoretical foundation for improving hydraulic stability and optimizing operational performance.
1. Introduction
With the growing emphasis on the “low-carbon” movement, hydropower resources have been extensively developed worldwide, leading to the widespread application and in-depth research of Kaplan turbines [1]. As a key component in renewable energy systems, Kaplan turbines have attracted significant attention regarding their operational efficiency, stability, and hydraulic performance under various conditions.
Numerical simulation has become a fundamental tool for investigating the complex flow phenomena within Kaplan turbines, both in domestic and international research. Peng [2] proposed a nonlinear dynamic model integrating the turbine, generator, and governor to analyze coordinated control strategies. Utilizing the EFAST method and stability theory, sensitivity and stability analyses were conducted to explore the influence of coordinated regulation on transient behavior and system stability. Yan [3], through a combination of field tests and numerical simulations, identified vortex formation near the high-pressure side of the runner at small guide vane angles, leading to flow disturbances and complex pressure pulsation spectra. Wang [4] highlighted sediment erosion risks near turbine blade edges, where leakage vortices create characteristic erosion patterns, and observed varying erosion rates along the draft tube.
Further experimental and numerical studies have expanded understanding of Kaplan turbine behavior under specific operational conditions. Roig [5] conducted no-load speed tests under cavitation and non-cavitation conditions, examining the influence of different guide vane and runner blade angle combinations. Zhang [6] investigated crown clearance cavitation through numerical simulations, revealing consistent flow patterns but different energy and cavitation characteristics between prototypes and models. Roig [7] analyzed vibration modes of runner blades and shafts, while Zhang and Chen [8] assessed the impact of blade interactions on added mass and damping. Other studies have applied CFD methods to optimize draft tube designs [9], improve fish-passage performance [10], and address hydraulic efficiency.
In parallel, extensive research has focused on the formation mechanisms and mitigation strategies for vortex ropes in draft tubes, a critical factor affecting turbine stability and efficiency. The integration of numerical simulations with physical model testing has become a widely adopted approach. Advanced hydraulic test platforms equipped with piezoelectric pressure sensors, particle image velocimetry (PIV), laser Doppler velocimetry (LDV), and high-speed imaging systems have enabled comprehensive measurements of pressure fluctuations, three-dimensional flow fields, and vortex structures [11,12,13,14].
By combining high-precision experimental techniques, flow visualization, and 3D numerical reconstruction, researchers have developed multi-physics frameworks to systematically investigate vortex rope generation, dynamic evolution, and their impact on energy conversion efficiency [15,16,17,18]. Foundational studies by Dörfler [19] decomposed vortex instability into passive stagnation zones and active helical vortex cores, highlighting nonlinear topological evolution under varying conditions. Nishi [20] introduced a dual-parameter model distinguishing axial and circumferential vortex dynamics in conical draft tubes. Subsequent research by Tamura [21] demonstrated the relationship between draft tube vortices and axial thrust fluctuations through combined CFD and experimental analysis.
Recent efforts have focused on mitigation strategies, such as damping grids, which Wang [22] showed to be effective in suppressing low-frequency pulsations induced by vortex ropes under off-design conditions. Favrel [23,24] further revealed how flow rate adjustments impact vortex coherence and excitation levels. Finally, Kirschner [25] experimentally confirmed the strong coupling between broadband pressure oscillations and vortex momentum transport during vortex rope evolution, emphasizing the importance of controlling unsteady flow phenomena in draft tubes.
In this study, numerical simulations were conducted to explore the flow characteristics within the draft tube of a Kaplan turbine. Particular attention was given to the distribution and evolution of vortical structures, as well as the pressure pulsation phenomena induced by the presence of vortex ropes.
2. Methodology
2.1. Numerical Simulation Method
This study employed NX UG 10.0 software to perform a 1:1 simulation modeling of the Kaplan turbine model, as shown in Figure 1. The turbine consisted of five flow-passing components: a spiral case, stay vanes, guide vanes, a runner, and a draft tube. The main structural parameters of the axial-flow Kaplan turbine are presented in Table 1.
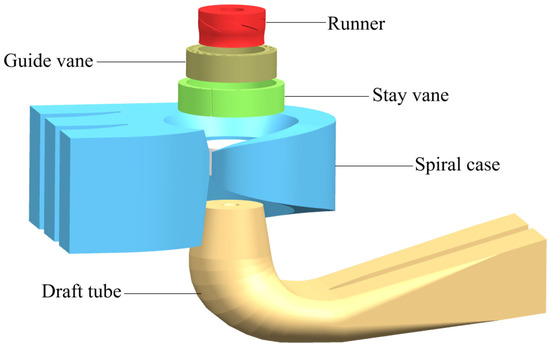
Figure 1.
Model Kaplan turbine.

Table 1.
Main structural parameters of the Kaplan turbine.
The entire computational domain was meshed with hexahedral grids using ICEM and Turbo Grid. The meshed grids of each flow-passing component are shown in Figure 2.
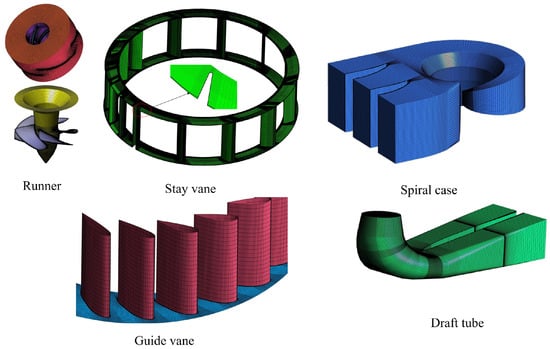
Figure 2.
Grids of model Kaplan turbine.
The commercial CFD software ANSYS CFX 17.0 was used for the simulations in this study. Considering the characteristics of the Kaplan turbine, the inlet of the spiral case was set as the computational inlet boundary, while the outlet of the draft tube was defined as the computational outlet boundary. The inlet boundary condition was specified as a total pressure inlet, with the total pressure determined based on the calculated head for each operating condition. The outlet boundary condition was set as a static pressure outlet. In this study, the mesh quality of the runner exceeded 0.4, while that of the other flow-passage components exceeded 0.5, meeting the computational requirements. As shown in Figure 3a, the results exhibited minimal variation when the total mesh count exceeded 9 million, confirming mesh independence. Table 2 presents the detailed mesh count for each component. The final total mesh count was 9,165,889, with a total of 9,632,165 nodes.
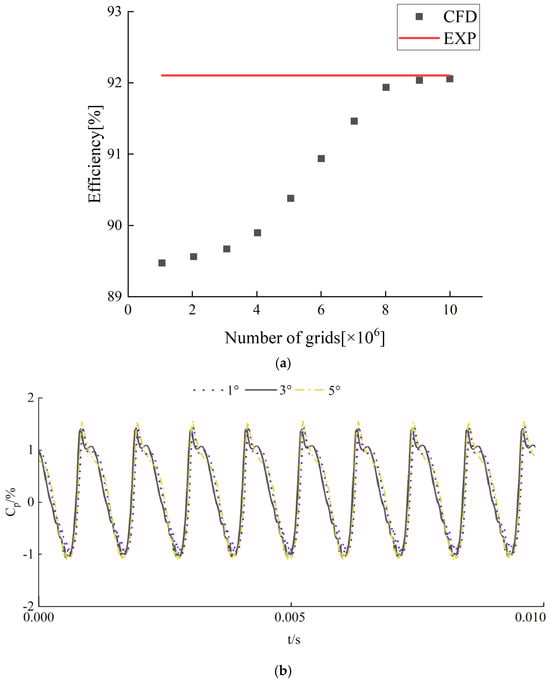
Figure 3.
Grid and time-step independence verification. (a) Grid independence verification. (b) Time-step independence validation.
Table 2.
Grid count of each component.
The SST k-ω turbulence model [26,27,28,29,30] was used to accurately capture the complex flow characteristics within the turbine. During unsteady simulations, the Transient Frozen Rotor approach was applied at the rotor–stator interface. The residual convergence criterion was set to 10−5, with a time step corresponding to a 3° rotation of the runner. A total of 15 cycles were computed, and data from stable cycles were selected for analysis and post-processing.
To investigate the influence of guide vane opening and head on the vortex characteristics within the draft tube of a Kaplan turbine, three guide vane openings and two operating heads were selected for computational analysis. The turbine blade angle was set at 0°, with a rotational speed of 643.333 r/min. The remaining parameters are shown in Table 3.
where Cp is the dimensionless pressure pulsation coefficient (%), is the corresponding pressure at point i (Pa), is the time-averaged pressure, H is the head (m), ρ is the density of water, and g is the gravitational acceleration.
Table 3.
Computational operating conditions.
As shown in Figure 3b, the pressure fluctuations exhibit similar waveforms and only slight numerical differences when the time step corresponds to 1° and 3° of runner rotation. However, when the time step increases to 5°, the waveform of the pressure pulsation changes noticeably, and the amplitude becomes significantly larger. Considering both computational efficiency and accuracy, it can be concluded that using the time required for 3° of runner rotation as the time step for unsteady simulations is appropriate.
2.2. Test Method
A schematic diagram of the Kaplan turbine model test rig is presented in Figure 4. The rig primarily consists of high- and low-pressure water tanks, a model Kaplan turbine, and a drive motor, forming a closed-loop circulation system. The main parameters of the test rig are summarized in Table 4. For details of the experimental setup, please refer to reference [1].
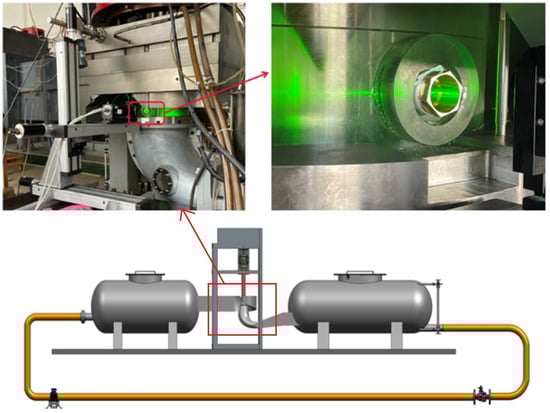
Figure 4.
Schematic diagram of the model Kaplan turbine test rig.
Table 4.
Main parameters of the test rig.
3. Results
3.1. Numerical Validation
During model testing, video recordings were captured in the visible section of the draft tube cone. Analysis of the footage confirmed the formation of a vortex rope within the draft tube. The right panel of Figure 5a shows the vortex rope identified by the Omega method from the post-processed numerical simulation under the same operating condition. Figure 5b,c present comparisons of the time-averaged axial and tangential velocity distributions in the draft tube, derived from both experimental measurements and numerical simulations. The strong agreement between the results highlights the accuracy of the simulation. Figure 5d compares the external characteristic data obtained from simulations and experiments across various operating conditions. The deviations are within 2% for all cases, further validating the reliability of the numerical approach.
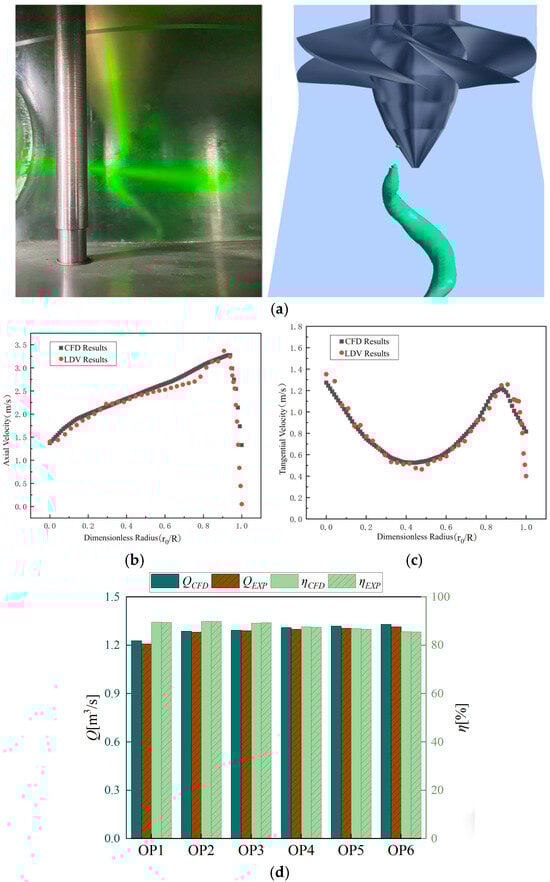
Figure 5.
Comparison of flow characteristics between experimental observations and numerical simulation. (a) Vortex rope. (b) Axial velocity. (c) Tangential velocity. (d) Flow rate and Efficiency.
To eliminate the influence of the mean velocity, fluctuation coefficients for the tangential and axial velocities are defined as follows:
In the equations, Cma denotes the axial velocity fluctuation coefficient, Cua denotes the tangential velocity fluctuation coefficient, Vma is the mean axial velocity at the measurement point (m/s), and Vua is the mean tangential velocity at the measurement point (m/s).
Figure 6a,b show the time-domain scatter plots of Cua and Cma, respectively, obtained from numerical simulations. At the center of the draft tube (Rx/R0 = 0.05 and 0.3), both Cua and Cma exhibit regular periodic fluctuation patterns. At Rx/R0 = 0.7, the amplitude of Cua fluctuations significantly decreases, while that of Cma increases markedly, indicating that the tangential velocity tends to stabilize in this region, whereas the instability of the axial velocity is enhanced. Near the wall region (Rx/R0 = 0.95), both Cua and Cma show varying degrees of increase, attributed to the destabilizing effect of wall friction on the local flow.
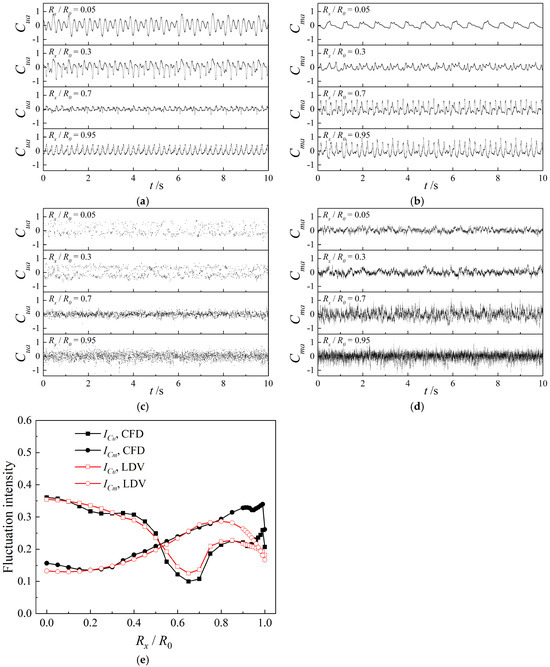
Figure 6.
Experimental and simulated velocity pulsation coefficient time-domain scatterplots of OP1: (a) CFD, Cua; (b) CFD, Cma; (c) LDV, Cua; (d) LDV, Cma; (e) velocity fluctuation intensity.
Figure 6c,d display the time-domain scatter plots of Cua and Cma measured experimentally. The LDV velocity data exhibit a distinctly discrete pattern, with instantaneous velocities approximately following a normal distribution centered on the steady-state velocity. This is due to the randomness inherent in the LDV system, which acquires velocity by detecting laser light scattered by tracer particles. When the number of samples is sufficiently large, the measured velocity distribution approximates a Gaussian profile.
At the center of the draft tube (Rx/R0 = 0.05 and 0.3), Cua appears more dispersed, while Cma is more concentrated, indicating stronger tangential velocity fluctuations and relatively stable axial flow. At Rx/R0 = 0.7, the dispersion of Cua decreases noticeably, while Cma becomes more scattered, suggesting a stabilization of tangential velocity and increased instability in axial flow—consistent with the trends shown in Figure 6a,b. Near the wall (Rx/R0 = 0.95), the dispersion of Cua increases significantly, while that of Cma increases slightly, further demonstrating that wall friction amplifies velocity fluctuations.
Additionally, the number of LDV samples for Cua and Cma is much higher in the near-wall region than in the center. This is because the higher flow velocity near the wall results in a higher concentration of tracer particles, which enhances the effective sampling rate of the LDV system. Comparing Figure 6c,d, it is evident that, under the same sampling duration, the number of samples for Cma is significantly greater than for Cua. This is attributed to the dominance of axial flow in the draft tube under rated turbine conditions and the higher detection efficiency of the LDV optical system for the axial velocity component, leading to a higher effective sampling rate for Cma.
Considering that the data obtained from the LDV flow measurement experiment are non-periodic discrete signals, while the data from numerical simulations are periodic and continuous, the same Fourier transform method cannot be applied for frequency-domain analysis. To quantitatively compare the degree of velocity fluctuation obtained from the experiment and simulation, the fluctuation coefficients of tangential and axial velocities are substituted into the root mean square formula to construct the fluctuation intensity of the velocity. The corresponding equations are as follows:
where ICu represents the fluctuation intensity of the tangential velocity and ICm represents the fluctuation intensity of the axial velocity.
As shown in Figure 6e, the value of ICm exhibits a nonlinear increasing trend from the center of the draft tube to Rx = 0.65, while ICu shows a nonlinear decreasing trend over the same range, followed by a nonlinear increase from Rx = 0.65R_x = 0.65Rx = 0.65 to Rx = 0.95. The maximum values of ICu and ICm are 0.36 and 0.34, respectively. Meanwhile, the distribution trends of the predicted ICu and ICm values closely match the experimental results, indicating the reliability of the numerical simulations.
3.2. Analysis of Hydraulic Characteristics of the Draft Tube
After the water exchanges energy at the runner, it flows into the draft tube. As a critical energy recovery device, the draft tube of the turbine not only serves to smoothly guide the discharged flow from the runner downstream but also recovers residual energy from the flow. To investigate the influence of guide vane opening on the hydraulic performance of the turbine, it is essential to analyze the flow patterns within the draft tube. A total of 11 monitoring sections were selected across the conical section, elbow section, and diffuser section to observe flow characteristics and velocity distribution at different cross-sections, thereby identifying the influence patterns of guide vane openings.
Figure 7 presents a comparison of velocity vectors at various cross-sections of the draft tube under different guide vane openings for two head conditions. Observing the velocity distribution in the conical section, the flow velocity is relatively low at the center of the draft tube and increases progressively from the center towards the wall, showing a stable increasing trend. This pattern closely matches the velocity distribution observed in experiments. Overall, the velocity under high-head conditions is significantly greater than that under the rated head, as the higher flow rate leads to a higher relative velocity, which also contributes to increased flow instability. It can be seen from the figure that, with increasing guide vane opening, the area of high-velocity zones across sections from the elbow to the diffuser expands significantly, with this effect being particularly pronounced under high-head conditions.
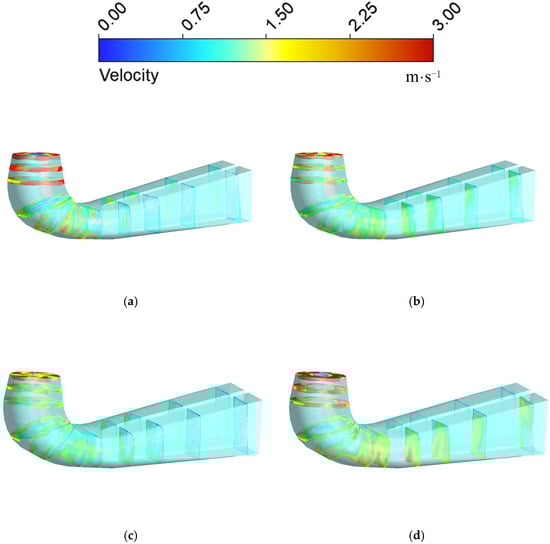
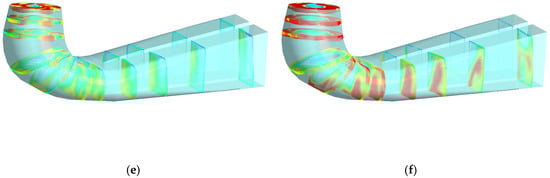
Figure 7.
Velocity vector diagrams at various cross-sections of the draft tube: (a) OP1; (b) OP4; (c) OP2; (d) OP5; (e) OP3; (f) OP6.
According to Figure 7, under small guide vane openings (i.e., conditions OP1 and OP4), energy losses result in lower outflow velocities near the hub, forming a large low-velocity zone in the center of the draft tube. Flow pulsations are evident, with a tendency for backflow. After leaving the flow passage, the fluid near the wall still exhibits tangential velocity similar to the inlet direction of the draft tube. Under the influence of inertia and gravity, the fluid flows diagonally downward along the wall, with the inclination angle gradually decreasing as the fluid moves downstream. A comparison of the two small-opening conditions reveals that the inflow under the maximum head increases compared to the rated head, and the low-velocity zone is significantly reduced; however, the overall flow characteristics remain chaotic and disordered.
At high-efficiency operating points (i.e., conditions OP2 and OP5), low-energy fluid exiting the flow passage is concentrated at the center of the conical section, where the central low-velocity zone expands progressively with the widening of the cone. As the flow passes through the elbow section, the velocity distribution becomes asymmetric, and the flow characteristics become more complex. In the diffuser section, velocity vectors across the sections are unevenly distributed. Under large guide vane openings, the increased flow rate leads to the outflow velocity being dominated by relative velocity. The inlet velocity within the draft tube is relatively uniform, but its direction forms a certain angle with the inlet surface. A distinct central low-velocity zone is present, which interacts with surrounding high-velocity flow to form vortices.
To further understand the flow characteristics within the draft tube, streamline patterns at the y = 0 cross-section were examined, as shown in Figure 8. Analysis of flow patterns across different operating conditions and head levels reveals common features: low velocities at the center, higher velocities near the wall, and vortex formation in both flow regimes. Due to the unique structure of the draft tube, the flow velocity increases significantly after passing through the elbow section.
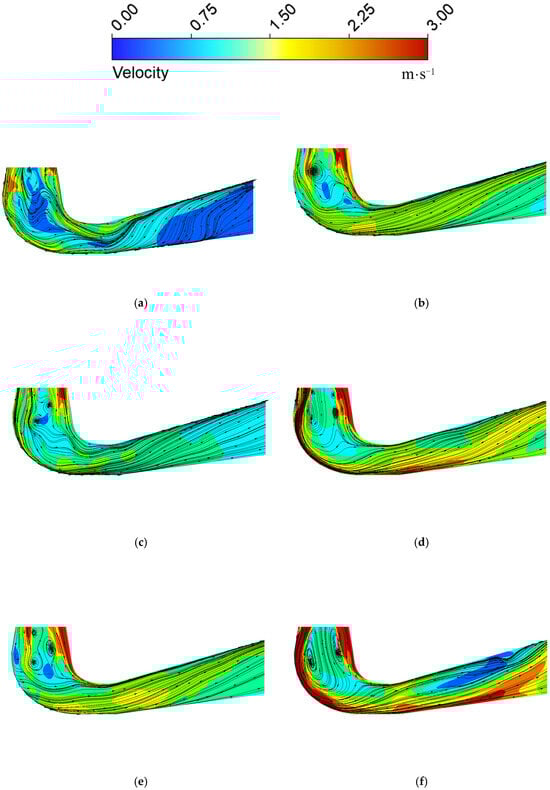
Figure 8.
Streamline diagram at y = 0 cross-section of the draft tube: (a) OP1; (b) OP4; (c) OP2; (d) OP5; (e) OP3; (f) OP6.
In the streamline plot for condition OP1, higher velocities can be observed near the wall (with peak values around 2.50 to 3.00 m/s), while the central region of the draft tube exhibits significant velocity decay (with some areas below 0.50 m/s), indicating a clear velocity gradient stratification. Local curvature of streamlines appears in the elbow section, likely due to flow inertia causing separation between high-speed flow near the wall and low-speed flow at the center, accompanied by localized backflow, which increases hydraulic losses. Small vortices can be observed near the inlet of the draft tube, while the downstream streamlines appear disordered. In comparison, under condition OP4, the overall flow velocity increases, vortices appear in the midsection of the conical part, and while backflow still occurs, the overall outflow is more stable.
Under high-efficiency operating conditions, the velocity distribution becomes more uniform, with streamlines smoothly diffusing along the wall surface. No significant low-velocity zones or backflow can be observed, indicating a higher efficiency in flow energy recovery. The draft tube vortex rope exhibits a helical shape with a significant velocity difference between its two sides—the low-velocity side typically located near the center and the high-velocity side near the draft tube wall. Compared to small guide vane openings, the overall flow pattern is slightly improved, and the backflow phenomenon is noticeably reduced. However, distinct vortex structures still appear in the conical section, with four vortices observed under condition OP5.
Examining the streamline diagrams for OP3 and OP6, it was found that the number of vortices increases compared to other conditions at the same head, with vortices extending into the elbow section. Under OP3, a clear low-velocity zone appears along the draft tube wall, accompanied by curved streamlines, indicating flow separation in this region.
In summary, it can be observed that changes in guide vane opening are closely related to the formation and evolution of vortices within the draft tube. Vortices generally appear in regions where there is a large velocity difference between two sides, suggesting that significant velocity gradients lead to pronounced pressure differences. Excessive tangential velocity induces convection, resulting in vortex formation. It was also noted that vortices mainly occur near the center of the conical section of the draft tube. To better understand the formation and distribution of vortices, the conical section of the draft tube was divided into planes, as shown in Figure 9. DT1 represents the cross-section at the draft tube inlet, with subsequent sections taken at 100 mm intervals. DT3 corresponds to the end of the conical section.
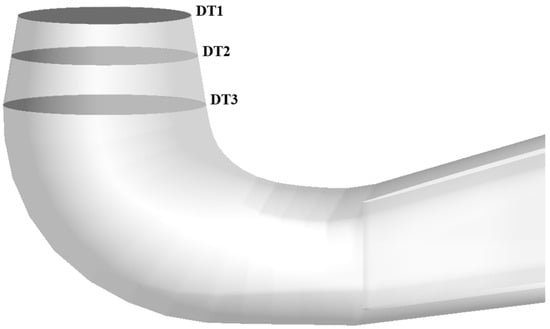
Figure 9.
Schematic of planar division in the draft tube conical section.
Figure 10 presents the pressure distribution diagrams at various draft tube cross-sections under different operating conditions. It can be observed that the pressure gradually increases from section DT1 to DT3. In condition OP1, a distinct low-pressure zone appears at the center of section DT1, suggesting the possible presence of a vortex in this region. Additionally, five other low-pressure zones can be observed in DT1, corresponding to the number of runner blades, as this section is closest to the runner outlet and the flow is significantly influenced by the runner. The pressure distribution pattern in section DT2 is similar to that in DT1, with the low-pressure zones caused by the runner remaining largely unchanged in position, indicating the potential formation of a columnar vortex rope. However, the position of the central low-pressure zone shifts, suggesting that the central vortex rope is an eccentric helical vortex rope.
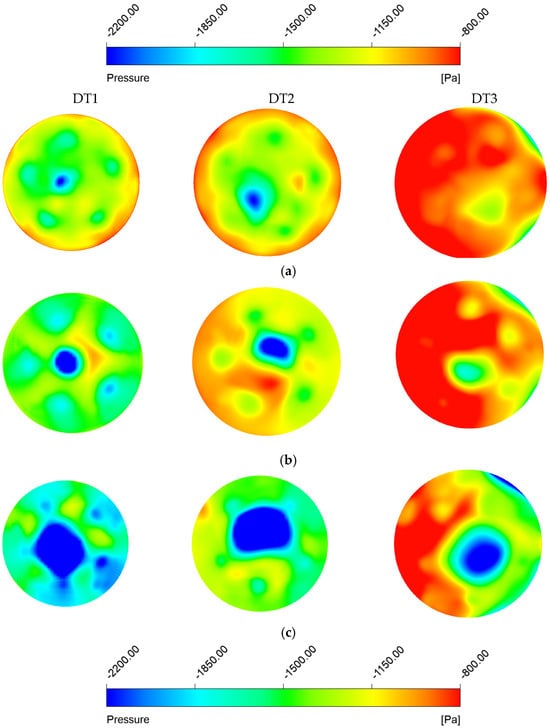
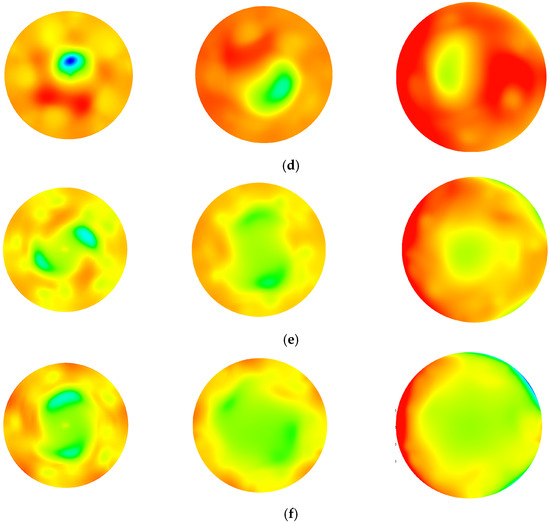
Figure 10.
Pressure distribution diagrams at various cross-sections: (a) OP1; (b) OP2; (c) OP3; (d) OP4; (e) OP5; (f) OP6.
Section DT3 is predominantly characterized by high pressure, indicating that the helical vortex rope dissipates under OP1 conditions by this point. The pressure distribution patterns at each section under high-efficiency and high-flow conditions are generally consistent with those observed in OP1. However, it is evident from the figure that as the flow rate increases, the area of the central low-pressure zone also expands. At section DT3, near the draft tube wall, the low-pressure distribution becomes more pronounced with increasing guide vane opening. Due to boundary layer effects, the flow velocity near the wall is relatively low, making it easier for high-velocity fluid to interact and generate chaotic vortices that affect the overall flow pattern within the draft tube. Under OP3, which has the highest flow rate, the central low-pressure zone reaches its maximum area, and significant low-pressure regions can still be observed at DT3, indicating that the helical vortex rope extends continuously from the conical section to the elbow section of the draft tube.
In this study, the Q-criterion was employed for vortex identification. Figure 11 shows the vorticity distribution under various operating conditions, where Figure 11a presents a comparative diagram of the vortex rope and vorticity distribution for condition OP1. Observing the vortex rope distribution and vorticity contours at each cross-section for OP1, it is evident that a significant high-vorticity region appears at the center of section DT1, where the helical vortex rope originates. Notably, five additional regularly distributed high-vorticity zones are present within the section, corresponding precisely to the number of runner blades. This is primarily due to the proximity of this section to the runner outlet, where it is heavily influenced by periodic blade wake disturbances. These high-vorticity zones correspond to columnar vortex ropes, confirming the earlier hypothesis.
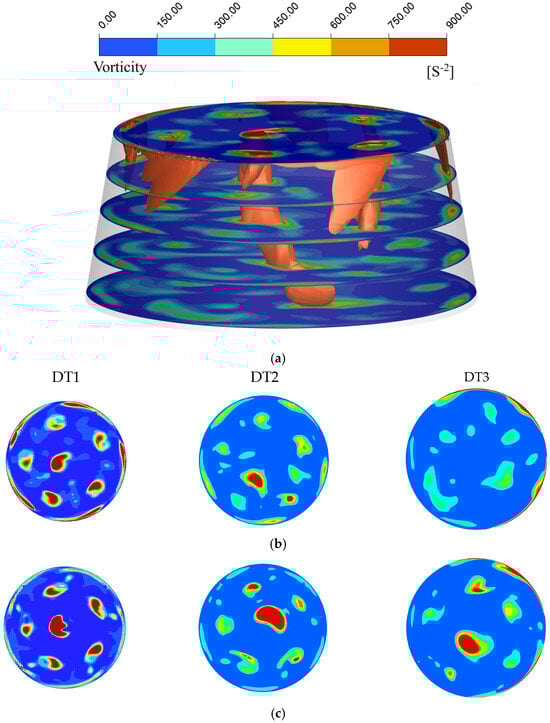
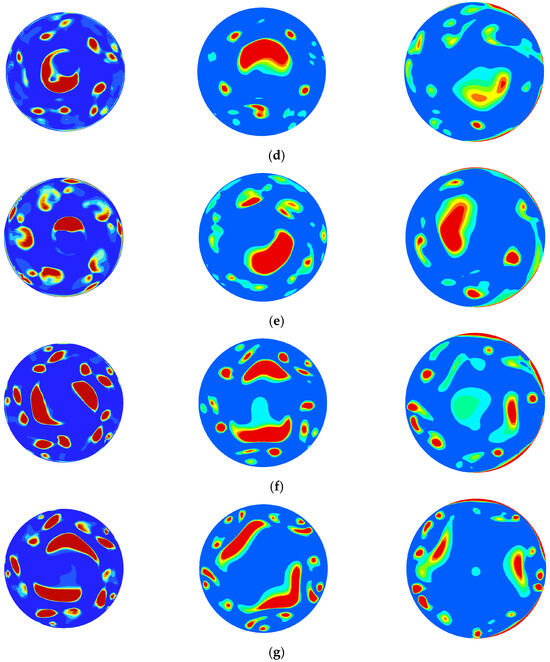
Figure 11.
Vortex rope and vorticity distribution in the draft tube. (a) Comparison of vortex rope and vorticity distribution for OP1. (b) OP1. (c) OP2. (d) OP3. (e) OP4. (f) OP5. (g) OP6.
High vorticity can also be observed near the draft tube wall at DT1, where fluid flows downward along the wall under the influence of inertia and gravity. Due to boundary layer effects, vortices are generated in this region. Comparative analysis indicates that while section DT2 maintains a similar number of high-vorticity zones, the core high-vorticity regions exhibit a circumferential shift, reflecting the spatial evolution characteristics of the vortex rope. By DT3, the vorticity gradient changes significantly, with the overall flow field displaying low vorticity, indicating that the energy of the helical vortex rope has been fully dissipated in this region.
Compared to small guide vane openings, both high-efficiency and large-opening conditions exhibit a noticeable increase in the area of the central high-vorticity zone, along with significant enhancement in the volume and intensity of the helical vortex rope. The vorticity distribution at DT3 under these conditions shows that the vortex rope extends into the elbow section. Furthermore, the comparison reveals that as the guide vane opening increases, the higher outflow velocity reduces the influence of the boundary layer, leading to the gradual disappearance of the annular vortex rope near the draft tube wall.
Compared to the operating conditions at a head of 3 m, the vortex intensity under the 5 m head conditions shows a significant increase. Relative to OP1, the central high-vorticity region in OP4 exhibits notable expansion, with section DT5 still maintaining a high vorticity intensity (vorticity > 750 s−1). The pressure distribution characteristics in OP5 and OP6 differ markedly from those in other conditions, with a dual-vortex core structure appearing in the center of section DT1. The abnormal number and shape of vortex cores suggest the possible presence of a coupled double-helical vortex rope phenomenon. As the head increases, changes in the circulation distribution at the runner outlet lead to volumetric expansion and topological deformation of the central helical vortex rope.
Figure 12 illustrates the temporal evolution of vortex ropes under various operating conditions, where T0 represents the initial moment and T denotes the time for one full rotation of the turbine. At a head of 3 m, the vortex rope under small guide vane openings is relatively slender, with a smaller eccentric angle. At the initial moment, a few random vortices are present near the draft tube inlet, which tend to interact with the draft tube wall, generating random pressure pulsations; these vortices gradually dissipate over time. Under OP2, the vortex rope volume increases compared to OP1, while the number of random vortices at the inlet decreases. In the large-guide vane opening condition, OP3, the vortex rope becomes larger and the number of random vortices increases.
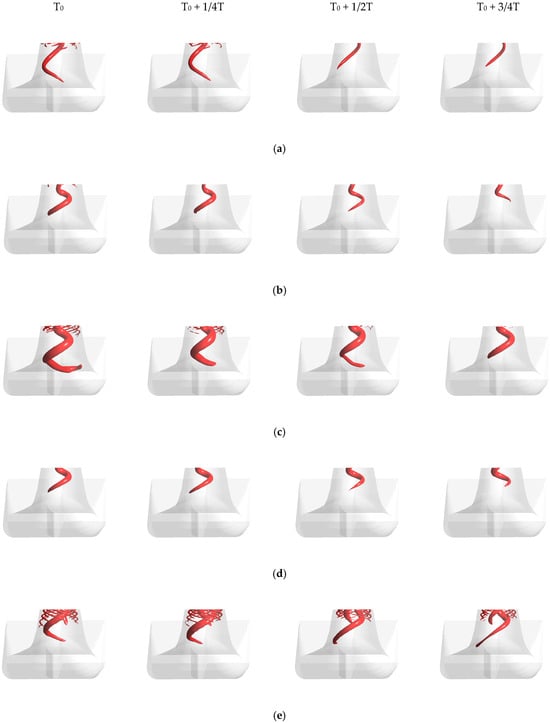
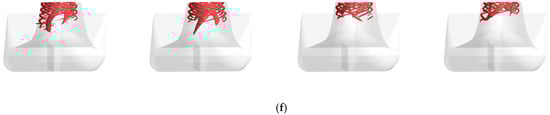
Figure 12.
Schematic diagram of vortex rope evolution (The red part indicates the vortex core): (a) OP1; (b) OP2; (c) OP3; (d) OP4; (e) OP5; (f) OP6.
Due to the rotational effect of the runner, the fluid acquires a tangential velocity similar to the direction of velocity at the flow passage outlet. Under the influence of inertia and gravity, the fluid flows downward along the wall and interacts with the stagnation zone at the center of the conical section of the draft tube, leading to vortex formation. Compared to OP1, the helical vortex rope in OP4 exhibits a larger volume and a greater eccentric angle. Under OP5 and OP6, double-helical vortex ropes appear, likely caused by increased blade loading under high-head conditions, where the intensified pressure difference between the suction and pressure sides of the blades induces secondary flows, generating counter-rotating vortex pairs. Additionally, the number of annular vortices near the draft tube wall significantly increases in these two conditions.
To analyze the pressure pulsation characteristics induced by the vortex rope in the draft tube of the Kaplan turbine under different operating conditions, OP1, OP2, OP3, and OP5 were selected based on the previous computational analysis. The distribution of monitoring surfaces and points is shown in Figure 13, where the monitoring surfaces correspond to the previously defined DT1, DT2, and DT3 cross-sections. Taking the DT1 section as an example, the monitoring points are labeled dt101 to dt104, with similar naming conventions applied to the other sections.
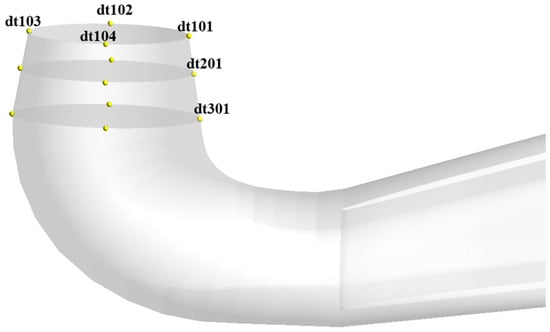
Figure 13.
Schematic diagram of monitoring points (yellow points).
For the pressure pulsations caused by the vortex rope, pressure data from four real-time monitoring points on each cross-section were extracted from the flow field calculations to obtain time-domain signals. These time-domain signals were processed using the 97% confidence method and subsequently subjected to the Fast Fourier Transform (FFT) to generate the frequency-domain spectra of the pressure pulsations.
Figure 14 shows the pressure pulsation frequency spectra of the draft tube under various operating conditions. The rotational frequency is non-dimensionalized, with the runner speed at 643.333 r/min, resulting in a rotational frequency of 643.333/60 = 10.722 Hz. The blade-passing frequency is five times the rotational frequency, which equals 53.611 Hz.
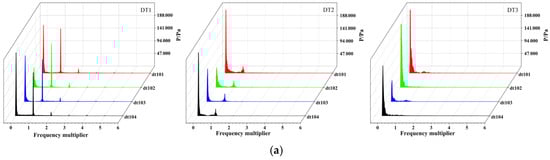
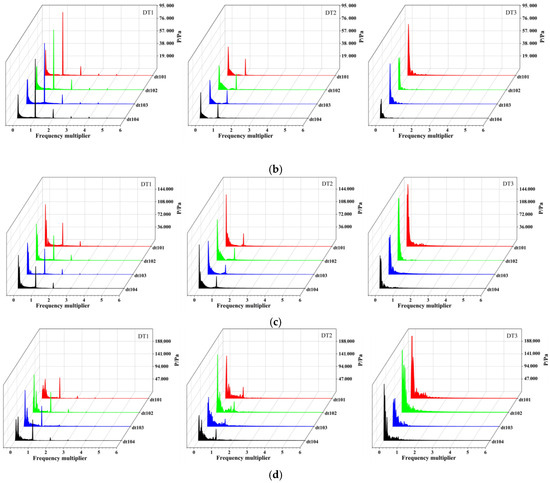
Figure 14.
Pressure pulsation frequency spectra of the draft tube: (a) OP1; (b) OP2; (c) OP3; (d) OP5.
From Figure 14, it can be observed that under all operating conditions, the pressure pulsation signals at each monitoring point are primarily low-frequency signals, followed by blade-passing frequency (BPF) signals. In OP1, aside from the low-frequency components, the dominant frequencies at monitoring points dt101 to dt104 are 5 times and 10 times the rotational frequency, corresponding to the blade-passing frequency and its second harmonic. This is due to the proximity of the DT1 section to the runner outlet, where the frequency signals are mainly caused by rotor–stator interaction at the interface between the runner and the draft tube.
At the DT2 section, the amplitude of the BPF signals significantly decreases. By the DT3 section, the BPF signals disappear entirely, leaving only low-frequency signals induced by the vortex rope. The pressure pulsation amplitude at points dt101 to dt104 shows a trend of decreasing first and then increasing, reaching a minimum at dt102 and a maximum at dt104. A similar pattern can be observed at DT2. However, at DT3, the minimum amplitude occurs at dt303.
For OP2, the BPF amplitudes at DT1 are significantly higher than the low-frequency components, with additional signals at two and three times the BPF. As the distance from the runner outlet increases, the BPF signals gradually weaken. This indicates that under OP2, the draft tube flow is less affected by the vortex rope, resulting in higher energy recovery efficiency. However, low-frequency pulsations induced by the vortex rope remain dominant at DT3. The pressure pulsation amplitude at monitoring points tends to increase with the distance from the runner outlet.
In OP3, compared to the other two conditions at the same head, the BPF amplitude is the lowest, with low-frequency signals dominating. These low-frequency components are more complex, likely originating from pulsations transmitted by blade channel vortices and other sources. Comparing the three conditions at the same head, OP2 exhibits the lowest pressure pulsation amplitude, while OP1 shows the highest. This aligns with previous analyses, indicating that the draft tube flow under OP3 is significantly affected by the helical vortex rope.
Analyzing the pressure pulsations in OP5 reveals that low-frequency signals remain dominant and are relatively chaotic, mainly influenced by the draft tube vortex rope. When the circulation at the runner outlet reaches a critical value, the vortex rope rotates in the opposite direction to the runner, causing expansion of the precessing vortex core diameter. This fluid–structure interaction can induce self-excited vibrations, leading to significant increases in pressure pulsation. The amplitude of pressure pulsations at each monitoring point increases with the distance from the runner outlet, reaching a maximum at DT3.
By analyzing Figure 15 and Figure 16 together, it can be observed that an eccentric vortex rope forms at the center of the draft tube, and as the guide vane opening increases, both the volume and the eccentric angle of the vortex rope increase accordingly. From the vorticity distribution diagrams, six high-vorticity regions are present at the draft tube inlet section. Excluding the central vortex rope, the other five high-vorticity zones are mainly influenced by the runner. Based on the position of the high-vorticity regions in section DT2, the vortex rope rotates clockwise, which is consistent with the rotational direction of the runner.
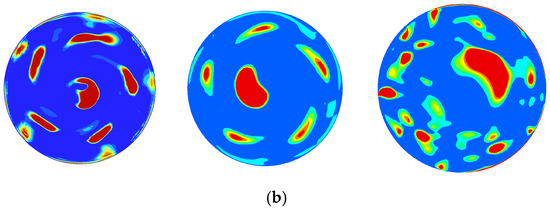
Figure 15.
Vorticity distribution diagrams. (a) Small guide vane opening. (b) Large guide vane opening.
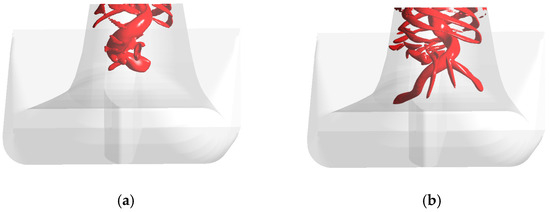
Figure 16.
Schematic diagram of the vortex rope (The red part indicates the vortex core). (a) Small guide vane opening. (b) Large guide vane opening.
At section DT3, a central high-vorticity zone remains, and the number of scattered vortices significantly increases, particularly under large guide vane openings. Since DT3 marks the end of the draft tube’s conical section and the beginning of the elbow section, it can be inferred that these scattered vortices are largely due to structural influences of the draft tube. When the flow impacts the elbow wall, interactions with high-velocity fluid lead to vortex formation. Overall, the hydraulic behavior of the turbine at a blade angle of 6° follows a similar pattern to that observed at a blade angle of 0°.
4. Conclusions
In this study, unsteady numerical simulations were performed on a Kaplan turbine to investigate the effects of guide vane opening and turbine head on internal flow characteristics and hydraulic performance. In particular, the study focused on how blade angle and guide vane opening influence flow behavior within the unit, providing a theoretical basis for the regulation and control of internal flow. The main conclusions are summarized as follows:
- Effects of Guide Vane Opening and Head on Flow Characteristics:
Variations in guide vane opening and head significantly affect the velocity distribution at the draft tube inlet. At small guide vane openings, a large central low-velocity region (<0.50 m/s in some areas) develops, accompanied by backflow and tangential velocity stratification. Under higher head conditions (5 m), the increased flow rate reduces the extent of the low-velocity core, although the flow remains highly non-uniform. Near the best-efficiency point, the velocity distribution becomes more uniform, improving energy recovery, though a helical vortex rope still persists in the conical section with significant velocity gradients. At large openings (e.g., OP3 and OP6), an increased flow rate leads to lower velocity uniformity, expansion of the low-velocity core, extension of the vortex rope into the elbow section, and intensified flow separation.
- 2.
- Flow Stability and Vortex Rope Evolution:
Both guide vane opening and head strongly influence flow stability in the draft tube. A prominent low-pressure zone appears near DT1, marking the origin of the vortex rope, while additional low-pressure regions are associated with runner blade wake effects. At higher heads, the central low-pressure zone enlarges, and the dissipation of the vortex rope is delayed. In OP5 and OP6, double vortex cores can be observed, indicating the presence of coupled double-helical vortex ropes driven by asymmetric outflow from the runner. As the guide vane opening increases, the vortex rope extends further into the elbow section. These flow behaviors remain consistent after adjustments to the runner blade angle, confirming the robustness of the observed trends and reinforcing the significance of blade and guide vane coordination in internal flow control.
- 3.
- Pressure Pulsation Characteristics:
Across all operating conditions, low-frequency pressure pulsations induced by vortex rope dynamics dominate in the draft tube, while blade-passing frequency (BPF) components are secondary. Near the runner outlet (DT1), pulsations are primarily caused by rotor–stator interaction. Further downstream (DT2 and DT3), BPF signals diminish while low-frequency components become more pronounced. Among the cases studied, OP2 exhibits the lowest pressure pulsation amplitudes, indicating stable flow and efficient energy recovery, while OP1 shows the highest. In OP5, reverse rotation of the vortex rope interacts with the runner flow, leading to an expanding precessing vortex core and significantly increased pressure pulsations. Overall, the pressure pulsation amplitude increases along the draft tube, confirming that vortex rope dynamics are the primary source of low-frequency unsteadiness.
These results offer valuable insights into the unsteady flow behavior in Kaplan turbine draft tubes and support the design and operation of more stable and controllable flow conditions through coordinated adjustment of blade angles and guide vane openings.
Author Contributions
Conceptualization, Q.Y. and L.X.; methodology, Z.X. and Y.Z.; software, Z.X.; validation, Q.Y., C.F. and Y.Z.; formal analysis, C.F.; investigation, L.H.; resources, L.X.; data curation, Q.Y.; writing—original draft preparation, Q.Y.; writing—review and editing, Z.L. and C.F.; visualization, L.X.; project administration, L.X.; funding acquisition, L.X. All authors have read and agreed to the published version of the manuscript.
Funding
This study was supported by the Sichuan Science and Technology Program (Grant No. 2022ZDZX0041); the National Natural Science Foundation of China (Grant No. 52209110); the Open Research Subject of Key Laboratory of Fluid Machinery and Engineering, Sichuan Province, Xihua University (Grant No. LTJX-2025002); and the Jiangsu Innovation Support Program for International Science and Technology Cooperation (Grant No. BZ2023047).
Data Availability Statement
The data that support the findings of this study are available from the corresponding author upon reasonable request.
Conflicts of Interest
The authors declare no conflicts of interest.
References
- Xu, L.; Kan, K.; Zheng, Y.; Liu, D. Experimental study on draft tube of a model kaplan turbine. J. Phys. Conf. Ser. 2024, 2752, 012014. [Google Scholar] [CrossRef]
- Wei, P.; Li, S. Sensitivity and stability analysis of a Kaplan turbine system considering synergistic regulation. Nonlinear Dyn. 2021, 103, 383–397. [Google Scholar] [CrossRef]
- Yan, D.; Chen, S.; Ren, P.; Zhao, W.; Chen, X.; Liu, C.; Zhou, L.; Wang, Z. Vibration and Flow Characteristics of a 200 MW Kaplan Turbine Unit under Off-Cam Conditions. Machines 2024, 12, 586. [Google Scholar] [CrossRef]
- Wang, T.; Li, X.; Guo, P.; Zhang, J.; Fan, W.; Chen, H. Influence of sediment particle size on wear characteristics of Kaplan turbines. J. Drain. Irrig. Mach. Eng. (JDIME) 2024, 42, 802–809. (In Chinese) [Google Scholar]
- Roig, R.; Sánchez-Botello, X.; Mulu, B.; Högström, C.-M.; Escaler, X. On the Vaneless Space Vortex Structures in a Kaplan Turbine Model Operating at Speed No Load. Appl. Sci. 2023, 13, 13285. [Google Scholar] [CrossRef]
- Zhang, Y.; Luo, W.; Chen, T.; Zhou, L.; Wang, Z. Study on the Cavitation Characteristics of Shroud Clearance in Prototype and Model of a Kaplan Turbine. Water 2023, 15, 3960. [Google Scholar] [CrossRef]
- Roig, R.; De La Torre, O.; Jou, E.; Mulu, B.; Escaler, X. Experimental and numerical modal analysis of a reduced scale Kaplan turbine model. IOP Conf. Ser. Earth Environ. Sci. 2022, 1037, 012006. [Google Scholar] [CrossRef]
- Zhang, M.; Chen, Q.G. Influence of internal blade-interactions on the added mass and added damping of a prototype Kaplan turbine runner. Alex. Eng. J. 2022, 61, 2376–2385. [Google Scholar] [CrossRef]
- Abbas, S.; Ekayana, I.; Nugroho, B.C.H.; Al-Alusi, H.R.; Kholil, A.; Harahap, S. Investigation of conical draft tube of Kaplan turbine with spiral liner and without spiral liner using CFD simulation. IOP Conf. Ser. Mater. Sci. Eng. 2021, 1173, 012011. [Google Scholar]
- Benigni, H.; Schneider, J.; Reckendorfer, W.; Jaberg, H.; Zenz, G.; Tuhtan, J. Numerical Simulation and Experimental Verification of Downstream Fish Migration in a Kaplan turbine. IOP Conf. Ser. Earth Environ. Sci. 2021, 774, 012149. [Google Scholar] [CrossRef]
- Decaix, J.; Müller, A.; Favrel, A.; Avellan, F.; Münch, C. URANS Models for the Simulation of Full Load Pressure Surge in Francis Turbines Validated by Particle Image Velocimetry. J. Fluids Eng. 2017, 139, 121103. [Google Scholar] [CrossRef]
- Skripkin, S.G.; Tsoy, M.A.; Kuibin, P.A.; Shtork, S.I. Study of Pressure Shock Caused by a Vortex Ring Separated From a Vortex Rope in a Draft Tube Model. J. Fluids Eng. 2017, 139, 081103. [Google Scholar] [CrossRef]
- Müller, A.; Yamamoto, K.; Alligné, S.; Yonezawa, K.; Tsujimoto, Y.; Avellan, F. Measurement of the Self-Oscillating Vortex Rope Dynamics for Hydroacoustic Stability Analysis. J. Fluids Eng. 2015, 138, 021206. [Google Scholar] [CrossRef]
- Trivedi, C. Investigations of Compressible Turbulent Flow in a High-Head Francis Turbine. J. Fluids Eng. 2017, 140, 011101. [Google Scholar] [CrossRef]
- Avellan, F. Flow Investigation in a Francis Draft Tube: The Flindt Project. In Proceedings of the 20th IAHR Symposium, Charlotte, NC, USA, 6–9 August 2000; pp. 1–18. [Google Scholar]
- Susan-Resiga, R.; Ciocan, G.D.; Anton, I.; Avellan, F. Analysis of the Swirling Flow Downstream a Francis Turbine Runner. J. Fluids Eng. 2005, 128, 177–189. [Google Scholar] [CrossRef]
- Zuo, Z.; Liu, S.; Liu, D.; Qin, D. Numerical predictions and stability analysis of cavitating draft tube vortices at high head in a model Francis turbine. Sci. China Technol. Sci. 2014, 57, 2106–2114. [Google Scholar] [CrossRef]
- Yang, J.; Zhou, L.J.; Wang, Z.W. Numerical investigation of the cavitation dynamic parameters in a Francis turbine draft tube with columnar vortex rope. J. Hydrodyn. 2019, 31, 931–939. [Google Scholar] [CrossRef]
- Dörfler, P. Mathematical model of the pulsations in Francis turbines caused by the vortex core at part load. Escher Wyss News 1980, 1, 101–106. [Google Scholar]
- Nishi, M.; Matsunaga, S. Surging characteristics of conical and elbow type draft tubes. In Proceedings of the 12th IAHR Symposium, Stirling, UK, 27–30 August 1984; pp. 272–283. [Google Scholar]
- Tamura, Y.; Chugun, A.; Obuchi, R.; Ishihara, T. Experimental and Numerical Investigation of Hydraulic Axial Thrust Fluctuation due to Draft Tube Vortex at partial load on Francis turbine. IOP Conf. Ser. Earth Environ. Sci. 2024, 1411, 012020. [Google Scholar] [CrossRef]
- Wang, S.; Pang, S.; Ding, J.; Wang, M.; Chen, Z. The effect of damping grid on vortex rope and pressure fluctuation in the draft tube of Francis turbine. J. Phys. Conf. Ser. 2024, 2707, 012062. [Google Scholar] [CrossRef]
- Favrel, A.; Müller, A.; Landry, C.; Gomes, J.; Yamamoto, K.; Avellan, F. Dynamics of the precessing vortex rope and its interaction with the system at Francis turbines part load operating conditions. J. Phys. Conf. Ser. 2017, 813, 012023. [Google Scholar] [CrossRef]
- Favrel, A.; Müller, A.; Landry, C.; Yamamoto, K.; Avellan, F. Space and time reconstruction of the precessing vortex core in Francis turbine draft tube by 2D-PIV. IOP Conf. Ser. Earth Environ. Sci. 2016, 49, 082011. [Google Scholar] [CrossRef]
- Kirschner, O.; Ruprecht, A.; Göde, E.; Riedelbauch, S. Experimental investigation of pressure fluctuations caused by a vortex rope in a draft tube. IOP Conf. Ser. Earth Environ. Sci. 2012, 15, 062059. [Google Scholar] [CrossRef]
- Li, W.; Li, Z.; Han, W.; Li, D.; Yan, S.; Zhou, J. Study of The Flow Characteristics of Pumped Media in The Confined Morphology of A Ferrofluid Pump with Annular Microscale Constraints. J. Fluids Eng. 2024, 147, 021201. [Google Scholar] [CrossRef]
- Li, W.; Li, Z.; Han, W.; Tan, S.; Yan, S.; Wang, D.; Yang, S. Time-mean equation and multi-field coupling numerical method for low-Reynolds-number turbulent flow in ferrofluid. Phys. Fluids 2023, 35, 125145. [Google Scholar] [CrossRef]
- Li, W.; Li, Z.; Han, W.; Wang, Y.; Zhao, J.; Zhou, J. Morphologic transformation of ferrofluid during micropump driving under field control. Ann. N. Y. Acad. Sci. 2025, 1543, 194–203. [Google Scholar] [CrossRef]
- Xu, L.; Zhang, Y.; Xu, J.; Zhang, D.; Feng, C.; Zhang, Z.; Zheng, Y. Vortex and Energy Characteristics in the Hump Region of Pump-Turbines Based on the Rigid Vorticity and Local Hydraulic Loss Method. Phys. Fluids 2025, 37, 035194. [Google Scholar] [CrossRef]
- Xu, L.; Zhang, Y.; Xu, J.; Wang, Y.; Feng, C.; Yang, Y.; Liu, D.; Liu, X.; Zheng, Y. Towards the integration of New-Type Power Systems: Hydraulic Stability Analysis of Pumped Storage Units in the S-Characteristic Region Based on Experimental and CFD Studies. Energy 2025, 329, 136755. [Google Scholar] [CrossRef]
Disclaimer/Publisher’s Note: The statements, opinions and data contained in all publications are solely those of the individual author(s) and contributor(s) and not of MDPI and/or the editor(s). MDPI and/or the editor(s) disclaim responsibility for any injury to people or property resulting from any ideas, methods, instructions or products referred to in the content. |
© 2025 by the authors. Licensee MDPI, Basel, Switzerland. This article is an open access article distributed under the terms and conditions of the Creative Commons Attribution (CC BY) license (https://creativecommons.org/licenses/by/4.0/).