1. Introduction
Gear transmission is widely used in machinery, national defense, and other industries, and has evolved to accommodate high-speed, heavy-load applications. Helical idler gear transmissions are well-suited to such environments. One of the major faults in high-speed, heavy-duty transmission is root cracking in the gear teeth, which often changes the dynamic response characteristics. As such, the dynamic characteristics of gear transmission systems are a focus of many research efforts.
Andrade et al. [
1] applied the KS test to the specific problem of condition monitoring of straight-tooth spur gears, giving trends in crack development. Al-shyyab and Kahraman [
2] proposed a discrete nonlinear torsional vibration model for a single-stage planetary unit, which includes all possible power flow configurations. The semi-analytic solution results show the influence of key gear design parameters on the dynamic response. Inalpolat and Kahraman [
3] verified the effects of coupling stiffness and kinematic configuration on natural modal and dynamic responses by proposing a generalized dynamic model for multistage planetary gear trains of automotive automatic transmission. Saryazdi and Durali [
4] presented a routine for prediction of the crack growth path in gears, helping to determine failure modes and detect cracks by vibration monitoring. Chaari et al. [
5] derived an analytical formula for the meshing stiffness of time-varying gears, proposed an original analytical model for tooth cracking and quantified the reduction in meshing stiffness caused by tooth cracking. Huang [
6] proposed a dynamic stiffness matrix method (DSM) and calculated with numerical derivatives to obtain the dynamic response of gears caused by external torque and total motion excitation.
Omar et al. [
7] proposed a nine-degree-of-freedom model of a one-stage gear system with realistic representation of different meshing stiffnesses and gearing errors and gear failures. Rincon et al. [
8] evaluated the effect of defects such as cracks and pitting on relevant parameters such as load transfer error or load sharing. Mohammed et al. [
9] presented a new method to calculate the gear mesh stiffness during tooth root extension cracking. The effects of gear mesh stiffness on vibration-based fault detection metrics RMS, cliffness and peak factor are investigated. Pandya and Parey [
10,
11,
12] used a finite element method based on linear elastic fracture mechanics (LEFM) to investigate the crack expansion path of HCR spur gears containing tooth root cracks under two gear parameters of prepared tooth ratio and pressure angle. Rincon et al. [
13] developed a model to analyze the contact forces and deformations of spur gear drives by imposing compatibility and complementarity conditions through finite element models and Hertzian contact theory. Liang et al. [
14] applied the potential energy method to evaluate the time-varying mesh stiffness of a planetary gear set. Ma et al. [
15,
16] proposed an improved mesh stiffness model for a healthy gear pair considering the misalignment of the tooth root and base circles and the accuracy of the transition curve, and verified it using the finite element method. Zhao et al. [
17] established the finite element model of nonlinear multi-clearance planetary gear system of wind turbine, and studied the variation law of dynamic transmission error of planetary gear system under different speeds and loads.
Chen and Shao [
18] develop a new method to transform the gear tooth errors (TEs) to be the appropriate dynamic excitations through the mesh stiffness and the unloaded static transmission error (USTE). Wang and Zhang [
19] modelled the effects of tooth misalignment and assembly errors on helical gear mesh stiffness, load transmission errors, tooth contact stresses and tooth root stresses. Salagianni et al. [
20] considered the effects of backlash and friction of gears under mixed lubrication, established a planetary gearbox model of complex states, and characterized the system dynamics with eigenvalues and eigenmodes of corresponding linearized systems. Yang and Tang [
21] studied the dynamic characteristics of a hoist equipped with a two-stage planetary gear reducer, and gave the natural frequency and corresponding mode. Liu et al. [
22] established a multi-body dynamic model of planetary gear train with local faults of planetary bearing and elastic gear ring foundation, and analysed the influence of local faults on vibration. Guo and Fang [
23] calculated the dynamic excitation including time-varying meshing stiffness and meshing impact based on the contact analysis of loading tooth surface based on the superposition of random pitch error and initial gap between matching teeth. Hou et al. [
24] established the rigid-flexible coupling dynamics model of gear transmission system, and studied the effects of the thickness of gear rim and gear billet web on NVH excitation source, dynamic meshing force and the dynamic response of the system at bearings and bearing housings.
In order to synthesize the sources of excitation for the analysis of gear trains, Bruzzone and Rosso [
25] discuss the use of various sources of excitation in different dynamic models, which include simple analytical models, concentrated mass models and finite element models, among others. Yu et al. [
26] proposed a new model for cylindrical gear pair dynamics, the main improvement of this model is to consider the effect of nonlinear elliptical tooth contact pattern. Tang et al. [
27] developed a novel analytical model of a curved cylindrical gear based on the sound-vibration coupling theory using the finite element boundary element method. In order to investigate at the level of the overall system, Lin [
28] used a time-varying displacement excitation model of the half-sine function type to describe the fault-induced excitation and developed a new dynamic model for rotor-rolling bearing-housing systems (RBHSs). Dai et al. [
29] developed a comprehensive model of the gear-rotor-bearing system based on the excitation generated by localized faults, and the model and analysis results were verified by several sets of experiments.
Matania et al. [
30] systematically explored fault diagnosis methods for rotating machinery, categorizing the research objectives into two main directions: fault severity and remaining useful life estimation. Wang et al. investigated gears with four different faults using several well-accepted techniques (phase and amplitude demodulation, beta kurtosis, and wavelet transform), comparing the sensitivity of various fault diagnosis methods to signal variations [
31]. The spectral kurtosis (SK) technique employs fourth-order statistical measures to decompose the variation of signal power with frequency and can be applied to fault diagnosis of rotating machinery such as bearings and gears (Wang 2016) [
32]. Lee et al. [
33] analysed the impulse character in the corresponding vibration signals by comparing the transmission errors under normal operating conditions with those observed during broken-tooth failures. Ravikumar et al. [
34] employed machine learning methods to examine the fault features associated with various degrees of failure (25% defect, 50% defect, 75% defect, and complete tooth breakage). Zhang et al. [
35] proposed a modulation signal bispectrum-based sideband estimator (MSB-SE) method for gear wear faults. This method can extract the sideband information of the acceleration of the faulty gear and evaluate the degree of wear. Gao and Wang [
36] proposed the concept of cumulative comprehensive energy ratio as a new indicator to intuitively evaluate the wear degree of gears. Hu et al. [
37] established a damage dynamics model for the helicopter’s main reduction gearbox, incorporating coupling effects to investigate the influence mechanism of sun gear cracks on vibration characteristics. Meanwhile, Chen et al. [
38] identified faults associated with sun gear and inner ring tooth cracks using the fast spectral kurtosis method and analysed the corresponding fault response characteristics.
Previous studies have mostly focused on analysing the dynamic characteristics of undamaged gear transmission systems and single-flank cracks. Therefore, the innovation of this paper lies in dividing the cracks into two cases—those occurring on the working flank of the gear tooth and those on the non-working flank—and in conducting a comparative analysis of their dynamic responses. In this paper,
Section 2 describes the structure of a practical helical idler gear system and develops its corresponding dynamic model. The finite element method is employed to conduct flexible modelling of a faulty gear, which is then integrated into the established dynamic model. In
Section 3, a simulation analysis of the rigid–flexible coupling model is performed. Dynamic response signals of the helical idler gear system under various fault conditions are obtained, and the influence of gear root cracks on the working flank and the non-working flank is analysed in the time and frequency domains. Additionally, a time–frequency spectrum is derived based on the short-time Fourier transform, and the results are discussed. In
Section 4, experiments using an FZG closed power flow gear test bench are conducted to validate the accuracy of the developed dynamic model of the helical idler drive system.
2. Dynamics Model of Helical Idler Gear System
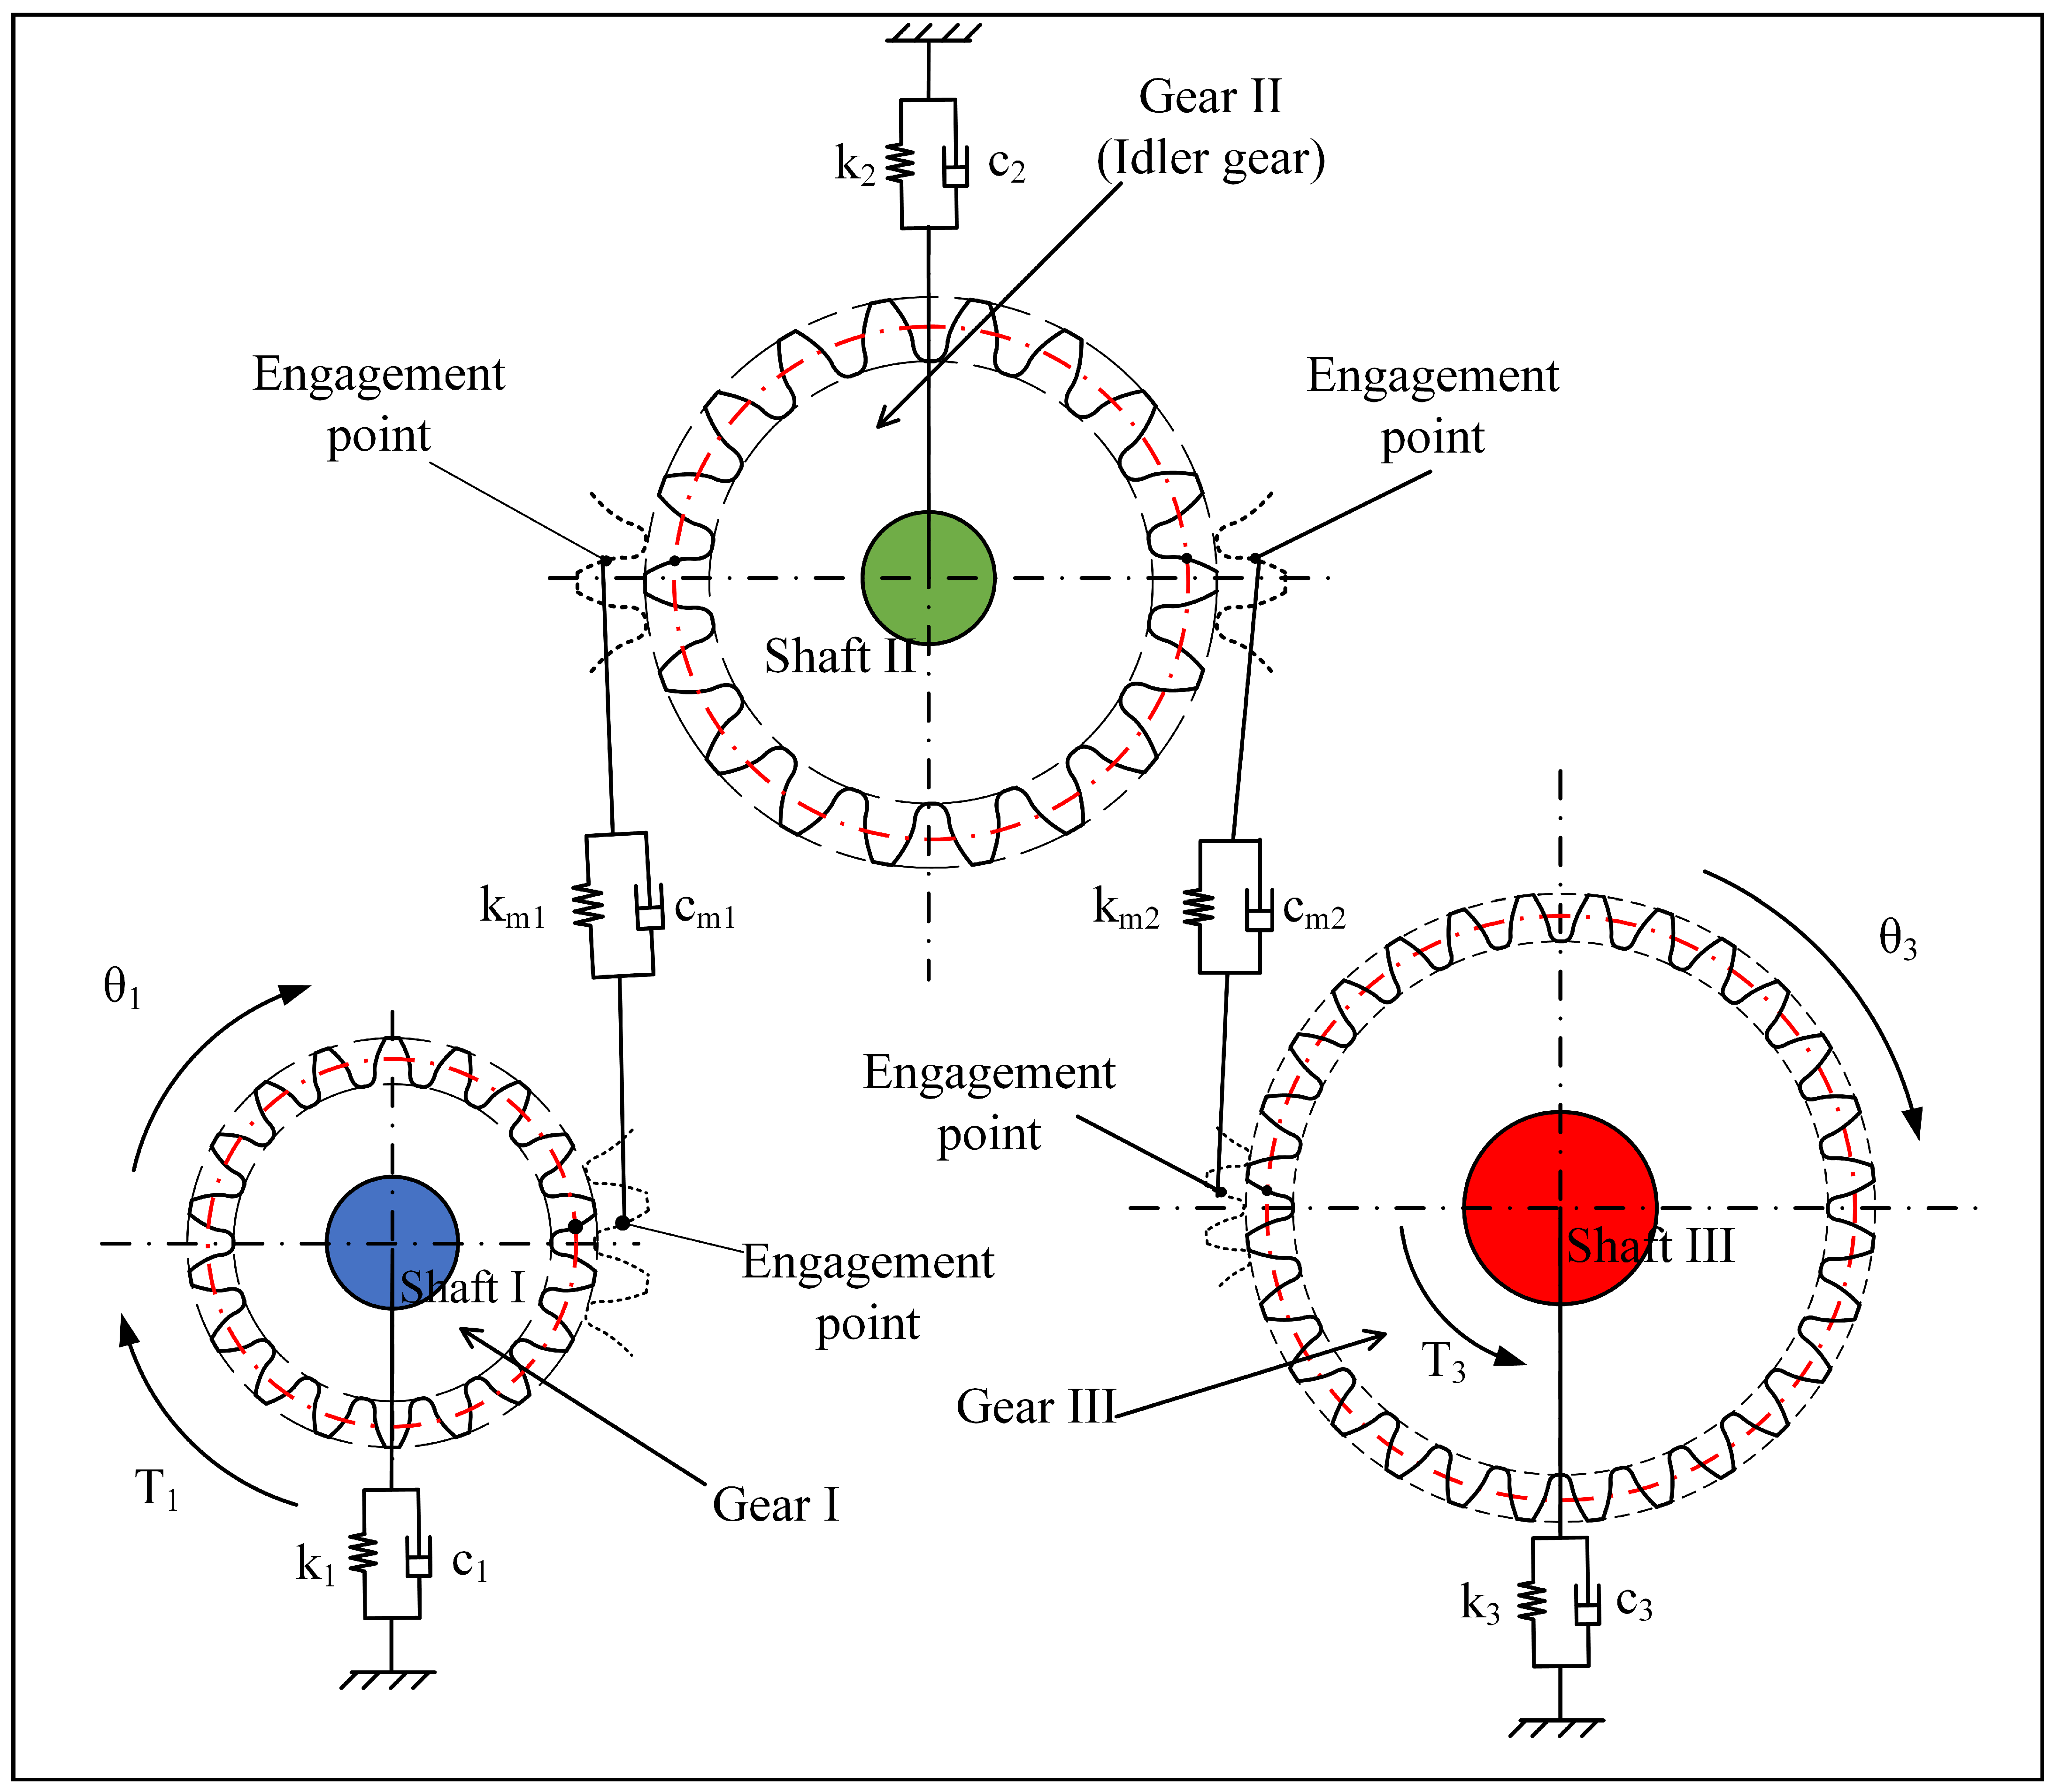
The dynamics model of helical idler gear system is established, as shown in
Figure 1. The tooth dynamic mesh force along y direction is:
where
is pressure angle;
is helix angle of the helical gear;
,
are, respectively, normal mesh stiffness and damping of gear pair I (gear I and gear II) and II (gear II and gear III);
are, respectively, linear displacements of gear I, II and III along y direction; and
are static transmission error of the gear pair I and II which takes profile modification, crowning, machining error, assembly error and mesh phase difference into consideration.
Then the formula of dynamics model of integral helical idler gear system is established:
where,
are equivalent mass of gear I, II and III;
are bearing damping of shaft I, II and III; and
are bearing stiffness of shaft I, II and III.
The formation of crack failures is a complex process. When gears are subjected to cyclic loads over prolonged periods, the effects of gear contact fatigue can induce fatigue damage, which in turn leads to the initiation and propagation of cracks [
39,
40]. Fuchs et al. [
41] found that initial cracks appeared at the sites of non-metallic inclusions in gears, while Vukelic et al. [
42] similarly indicated that cracks originate at inclusion points. These findings suggest that under complex operating conditions, the locations where cracks initiate may vary. Consequently, in practical environments, cracks may develop on either the working flank or the non-working flank, necessitating a clear distinction of the specific positions at which they appear. Thereafter, under the continued influence of contact fatigue, cracks propagate from their points of origin until ultimate fracture occurs.
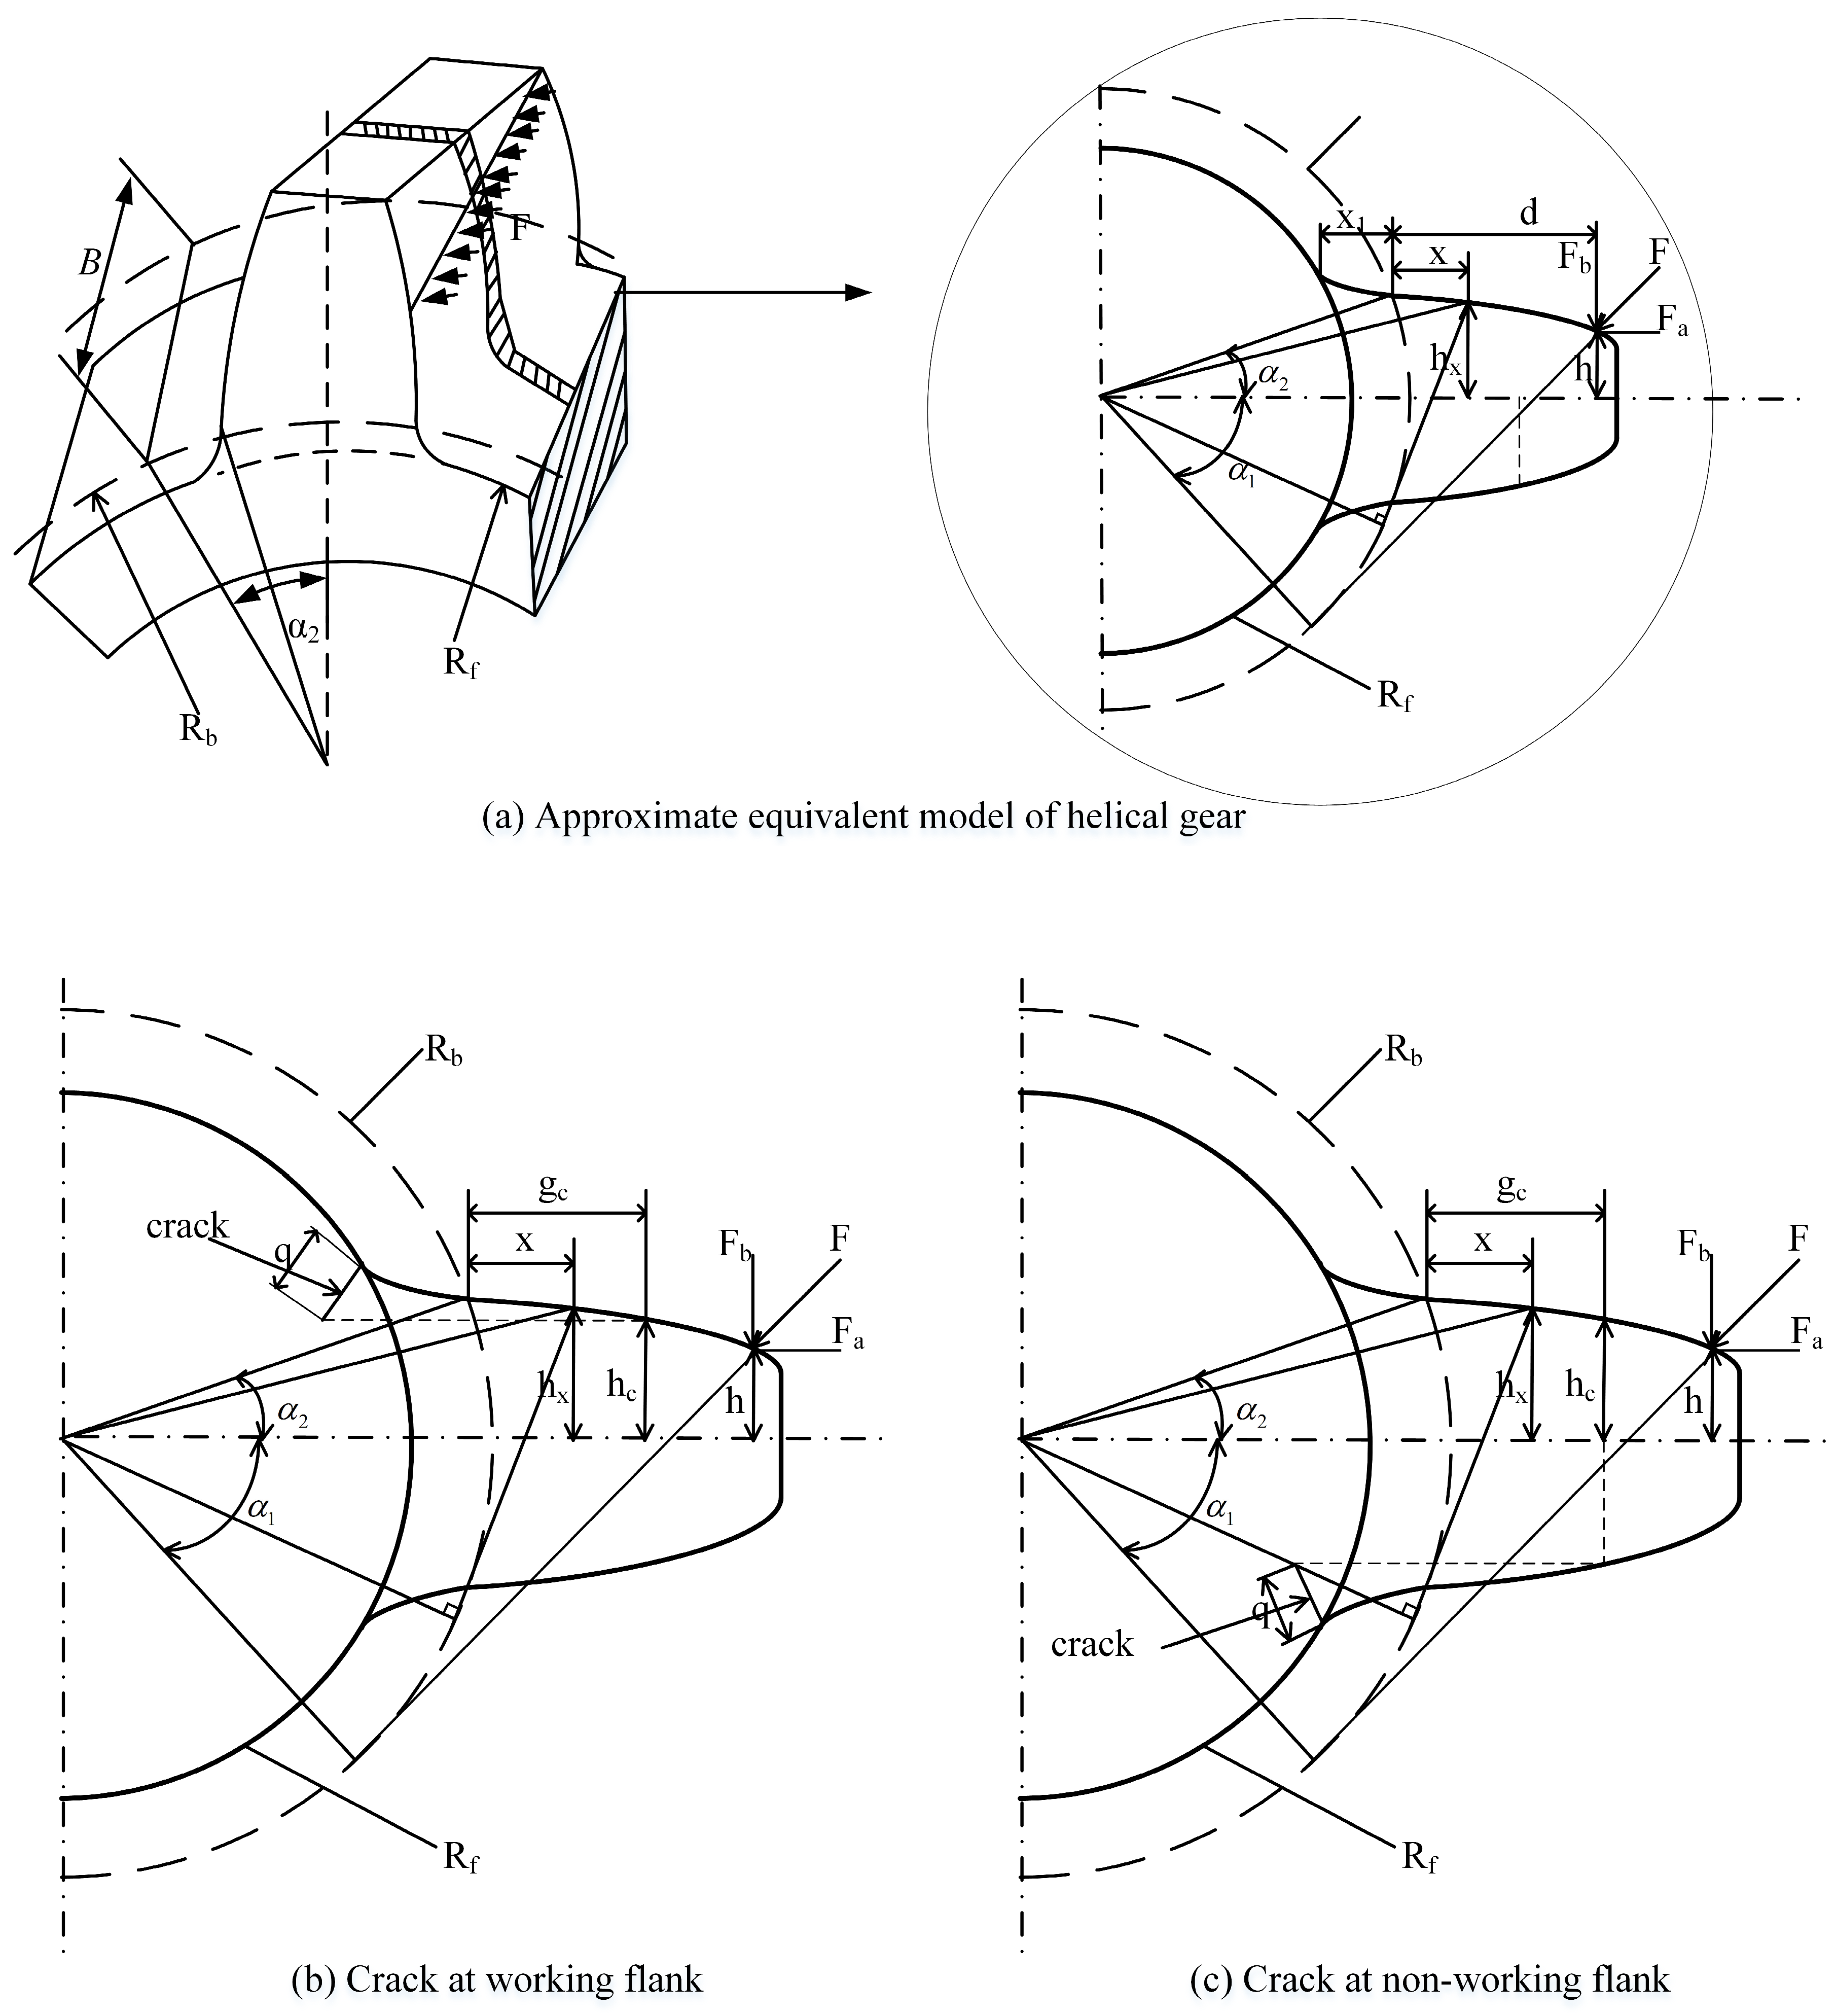
The time-varying meshing stiffness is an important parameter of the dynamics model of a helical idler gear system, and the influence of root crack fault is primarily manifested in this parameter. Considering the different scenarios in which cracks appear at the working flank and the non-working flank, based on the potential energy method, stiffness calculation models under different conditions are established, and the principle is depicted in
Figure 2.
The energy method assumes that the potential energy stored in a meshing gear consists of four parts: Hertzian energy
, bending energy
, compressive energy
, and shear energy
. They are used separately for calculating Hertzian contact stiffness
, bending stiffness
, compressive stiffness
and shear stiffness
. The total mesh stiffness is the series form of each stiffness, according to elastic mechanics, mechanics of materials:
where
F is the meshing force at the meshing point, the direction is along the line of engagement,
is the radial component of
F,
is the tangential component of
F,
E is elastic modulus,
G is shear modulus,
is the moment of inertia of the tooth section at the distance
x from the base circle,
is cross-sectional area,
d is the horizontal distance between the meshing point and the base circle,
h is the distance between the meshing point and the symmetry line of the gear teeth,
x is the distance from any point on the involute curve to the base circle, and
is the distance from any point on the transition curve to the root circle.
In addition, the effect of the flexible deformation of the gear base has to be considered, and the expression corresponding to the flexible deformation of the gear base is given by:
where
is tooth thickness at the critical section according to Weber, and
is the pressure angle. The coefficients
L*,
M*,
P* and
Q* are fitted by polynomial functions, and they can be found in Ref. [
43].
According to Equation (8), single-tooth-pair mesh stiffness can be given as:
And the double pair tooth mesh stiffness can be given as:
where the subscript numbers 1 and 2 represent the driving and driven gears, respectively, and
i indicates the gear meshing of the
ith pair.
As shown in
Figure 2b,c, root cracks appear at the working flank and the non-working flank separately. Component
of the meshing force along the vertical direction tends to make the cracks open, thus affecting the meshing stiffness of the gear teeth. When root cracks exist, the effective area
and the moment of inertia
of the tooth section at the distance from the gear base circle x can be expressed as:
where,
L represents the gear width,
represents the vertical distance between the crack tip and the centre line of the gear teeth,
represents the distance between the tooth profile at the base circle
x and the centre line of the gear teeth, and
represents the horizontal distance between the tooth profile at the crack tip and the base circle. By substituting Equations (10) and (11) into Equations (3)–(9), the formula for calculating the time-varying meshing stiffness of helical gear with root crack fault can be simplified. According to the formula, the time-varying meshing stiffness of helical gear under the influence of root crack fault can be solved and applied to the solution of dynamics model.
It is essential to note that numerous effective and advanced methods exist for calculating gear tooth stiffness, capable of considering nonlinear and non-Hertzian hypotheses on either a 2D or 3D basis [
44,
45,
46]. Typical methods encompass analytical, finite element, hybrid, and approximated analytical models. Among the widely used methods, the finite element method can more comprehensively account for the effects of tooth-structure features, such as thin-rimmed and slot structures [
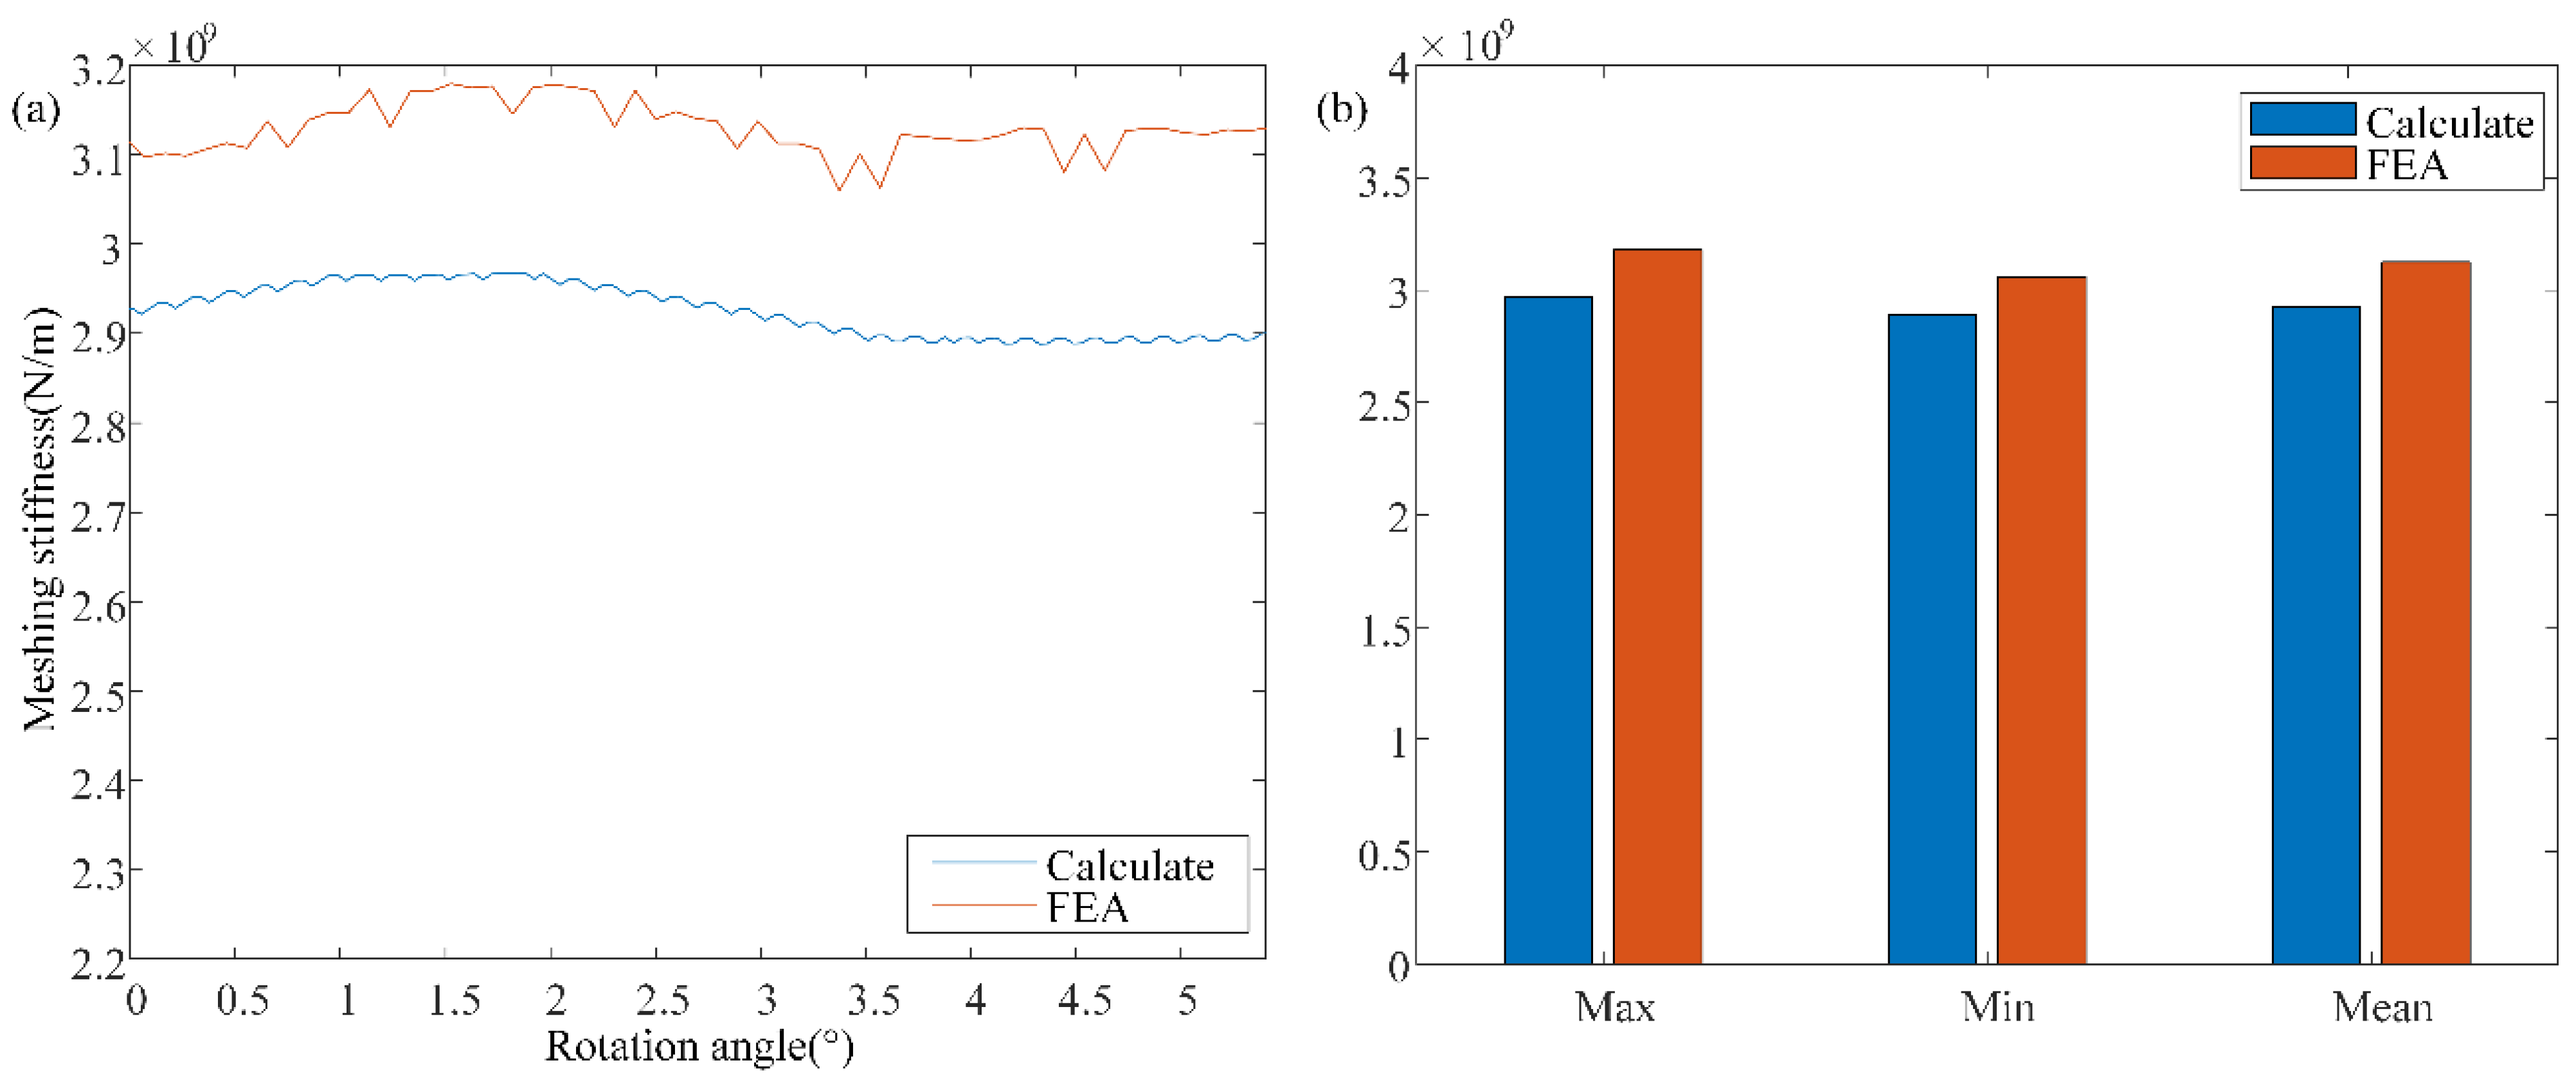
47]. Therefore, it is necessary to establish a finite element model of the gear. By comparing the results obtained from the finite element model, the accuracy of the proposed stiffness calculation method can be verified. The results of the comparison are depicted in
Figure 3.
Figure 3a reveals that the computational model and the finite element model exhibit similar curves in computational results. Comparing the maximum, minimum and average values of the computational results to make
Figure 3b, the errors are found to be 6.7%, 5.6% and 6.3%, respectively. These findings indicate that the errors of the computational model and the finite element model can be kept within 10%.
3. Simulation Analysis of Dynamics Model of Helical Idler Gear System
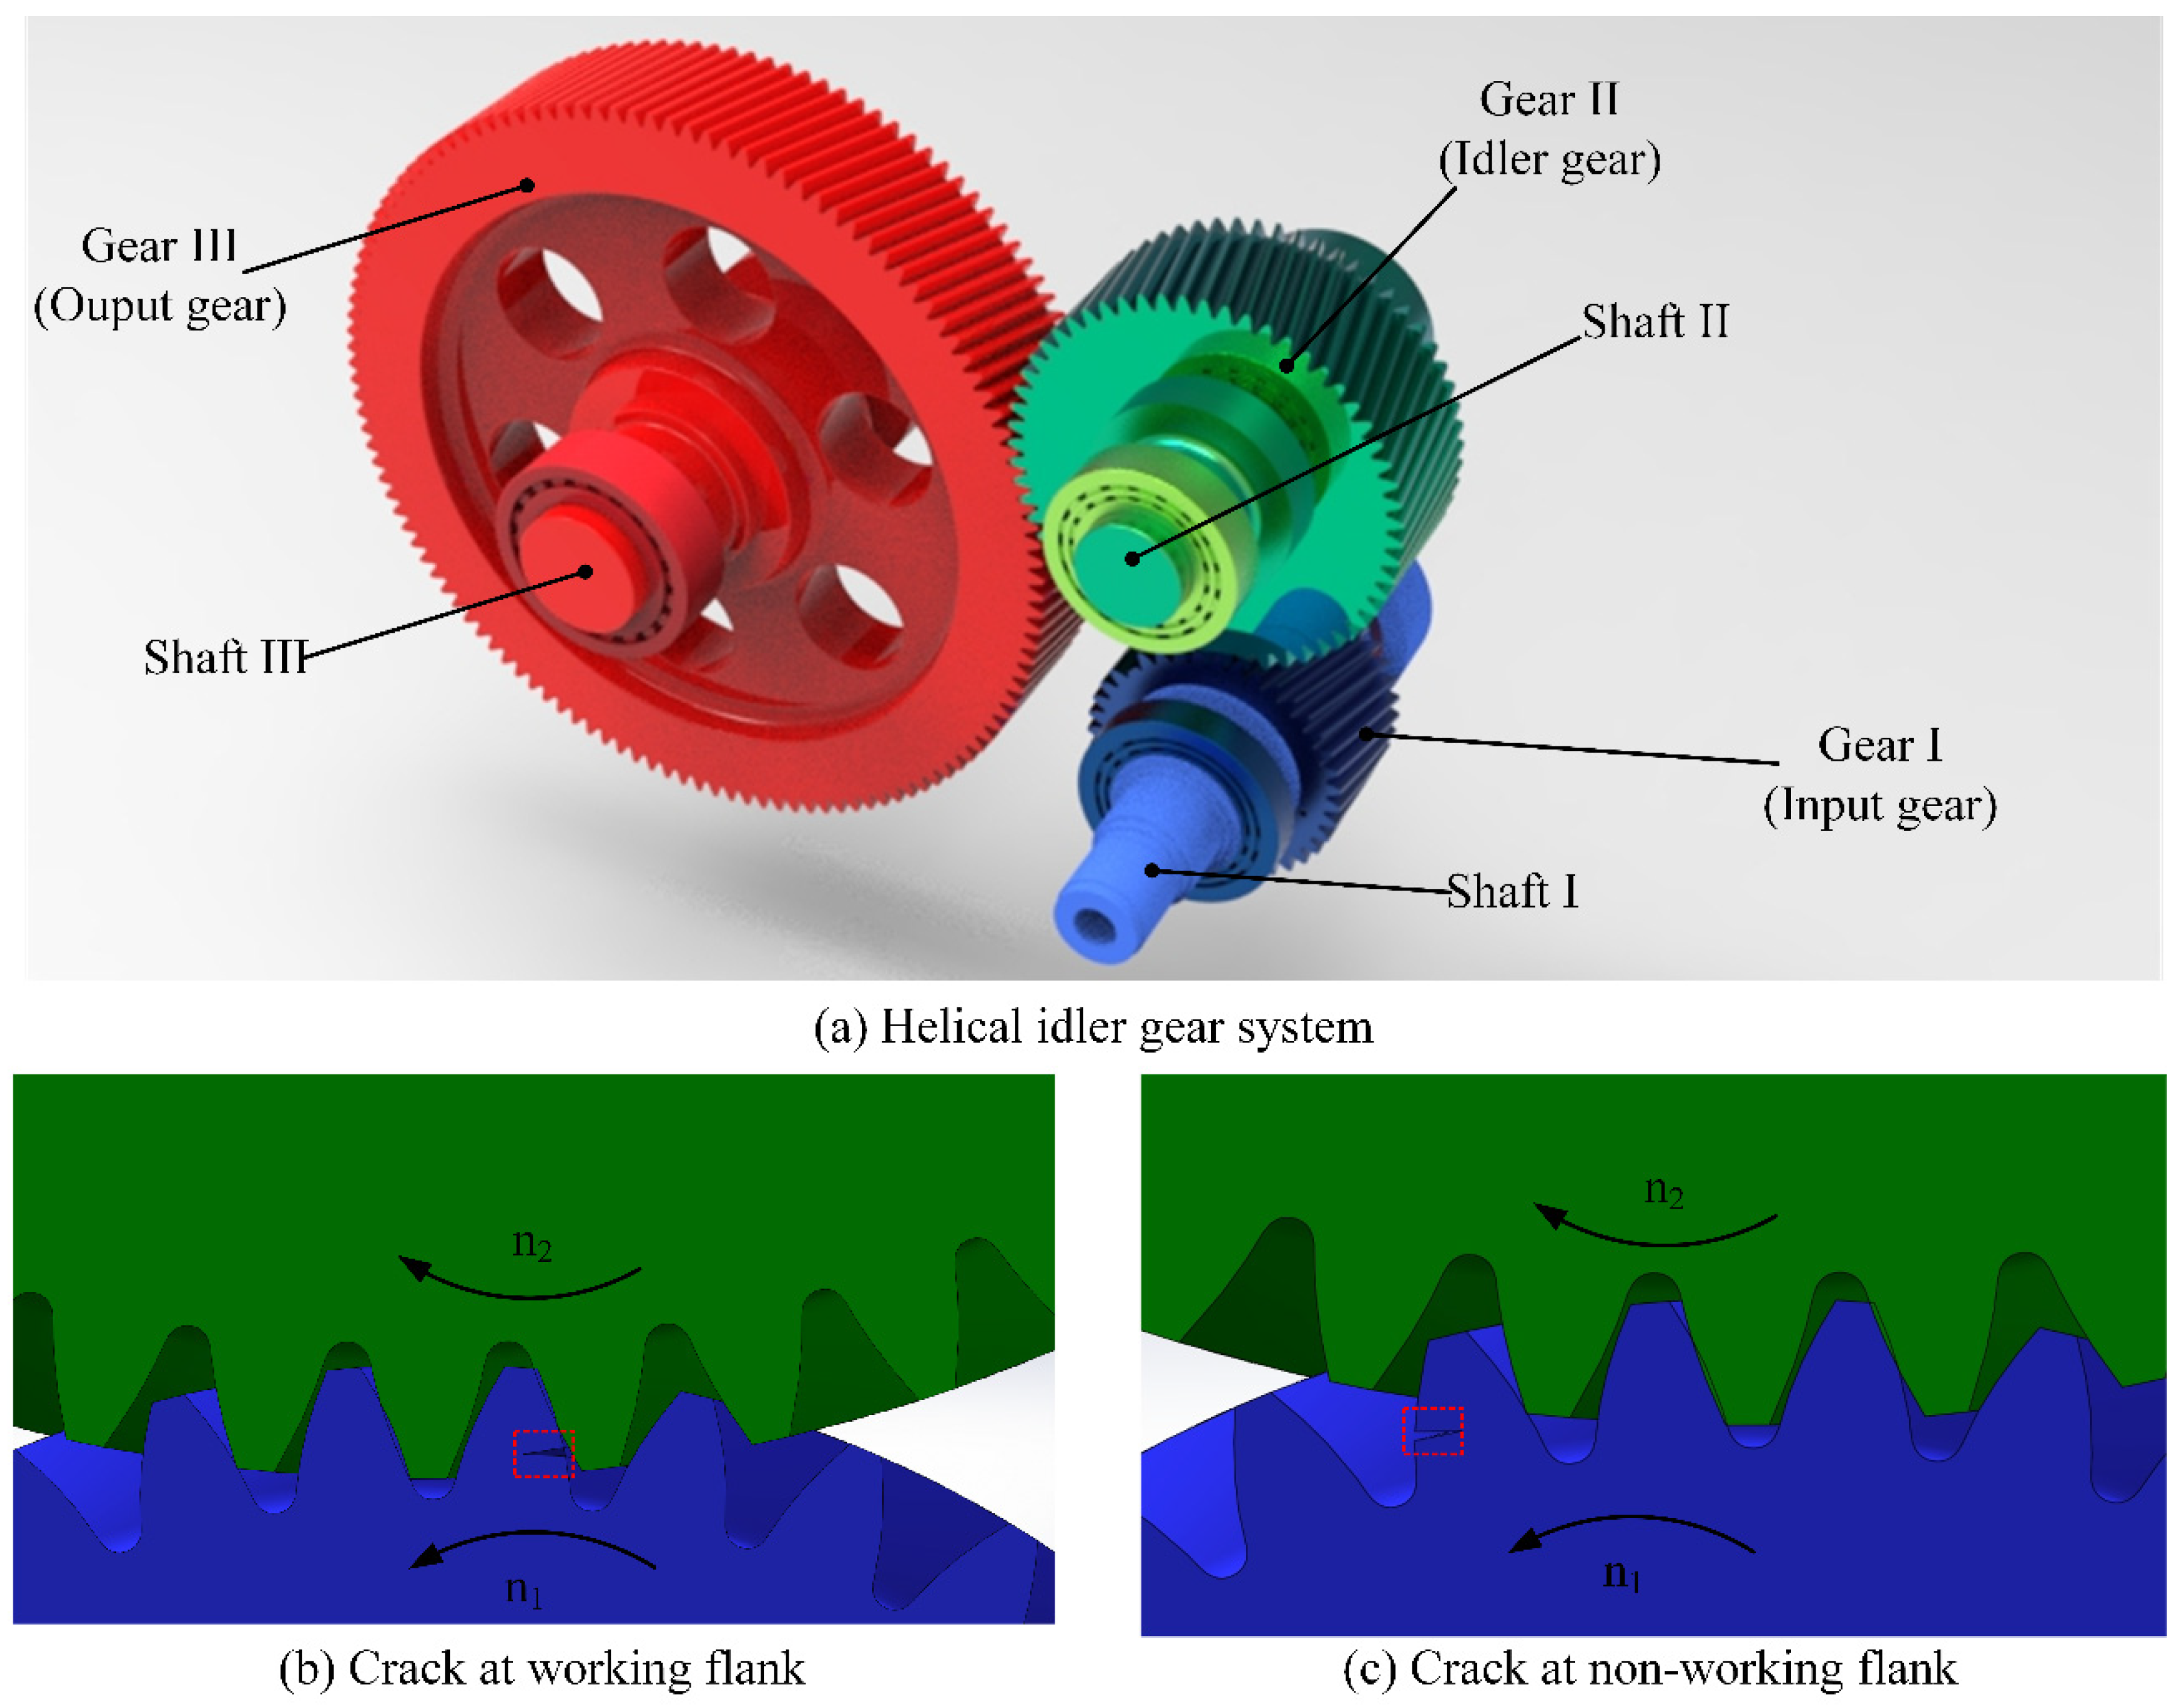
Considering the different situations of cracks that appear at the working flank and the non-working flank, a rigid–flexible coupling dynamics model is established according to professional dynamics simulation software, the relevant parameters and the schematic diagrams of the three-dimensional model which are shown in
Table 1 and
Figure 4.
The solution of the model follows the dynamics model formula provided in the previous section. The transmission system of helical idler gear with different crack locations was modelled, as shown in
Figure 4b,c, corresponding to
Figure 2b,c. The crack appears at the root of the input gear. The dynamic model is solved by simulation and its dynamic characteristics are analysed.
3.1. Time Domain Analysis of Dynamic Response
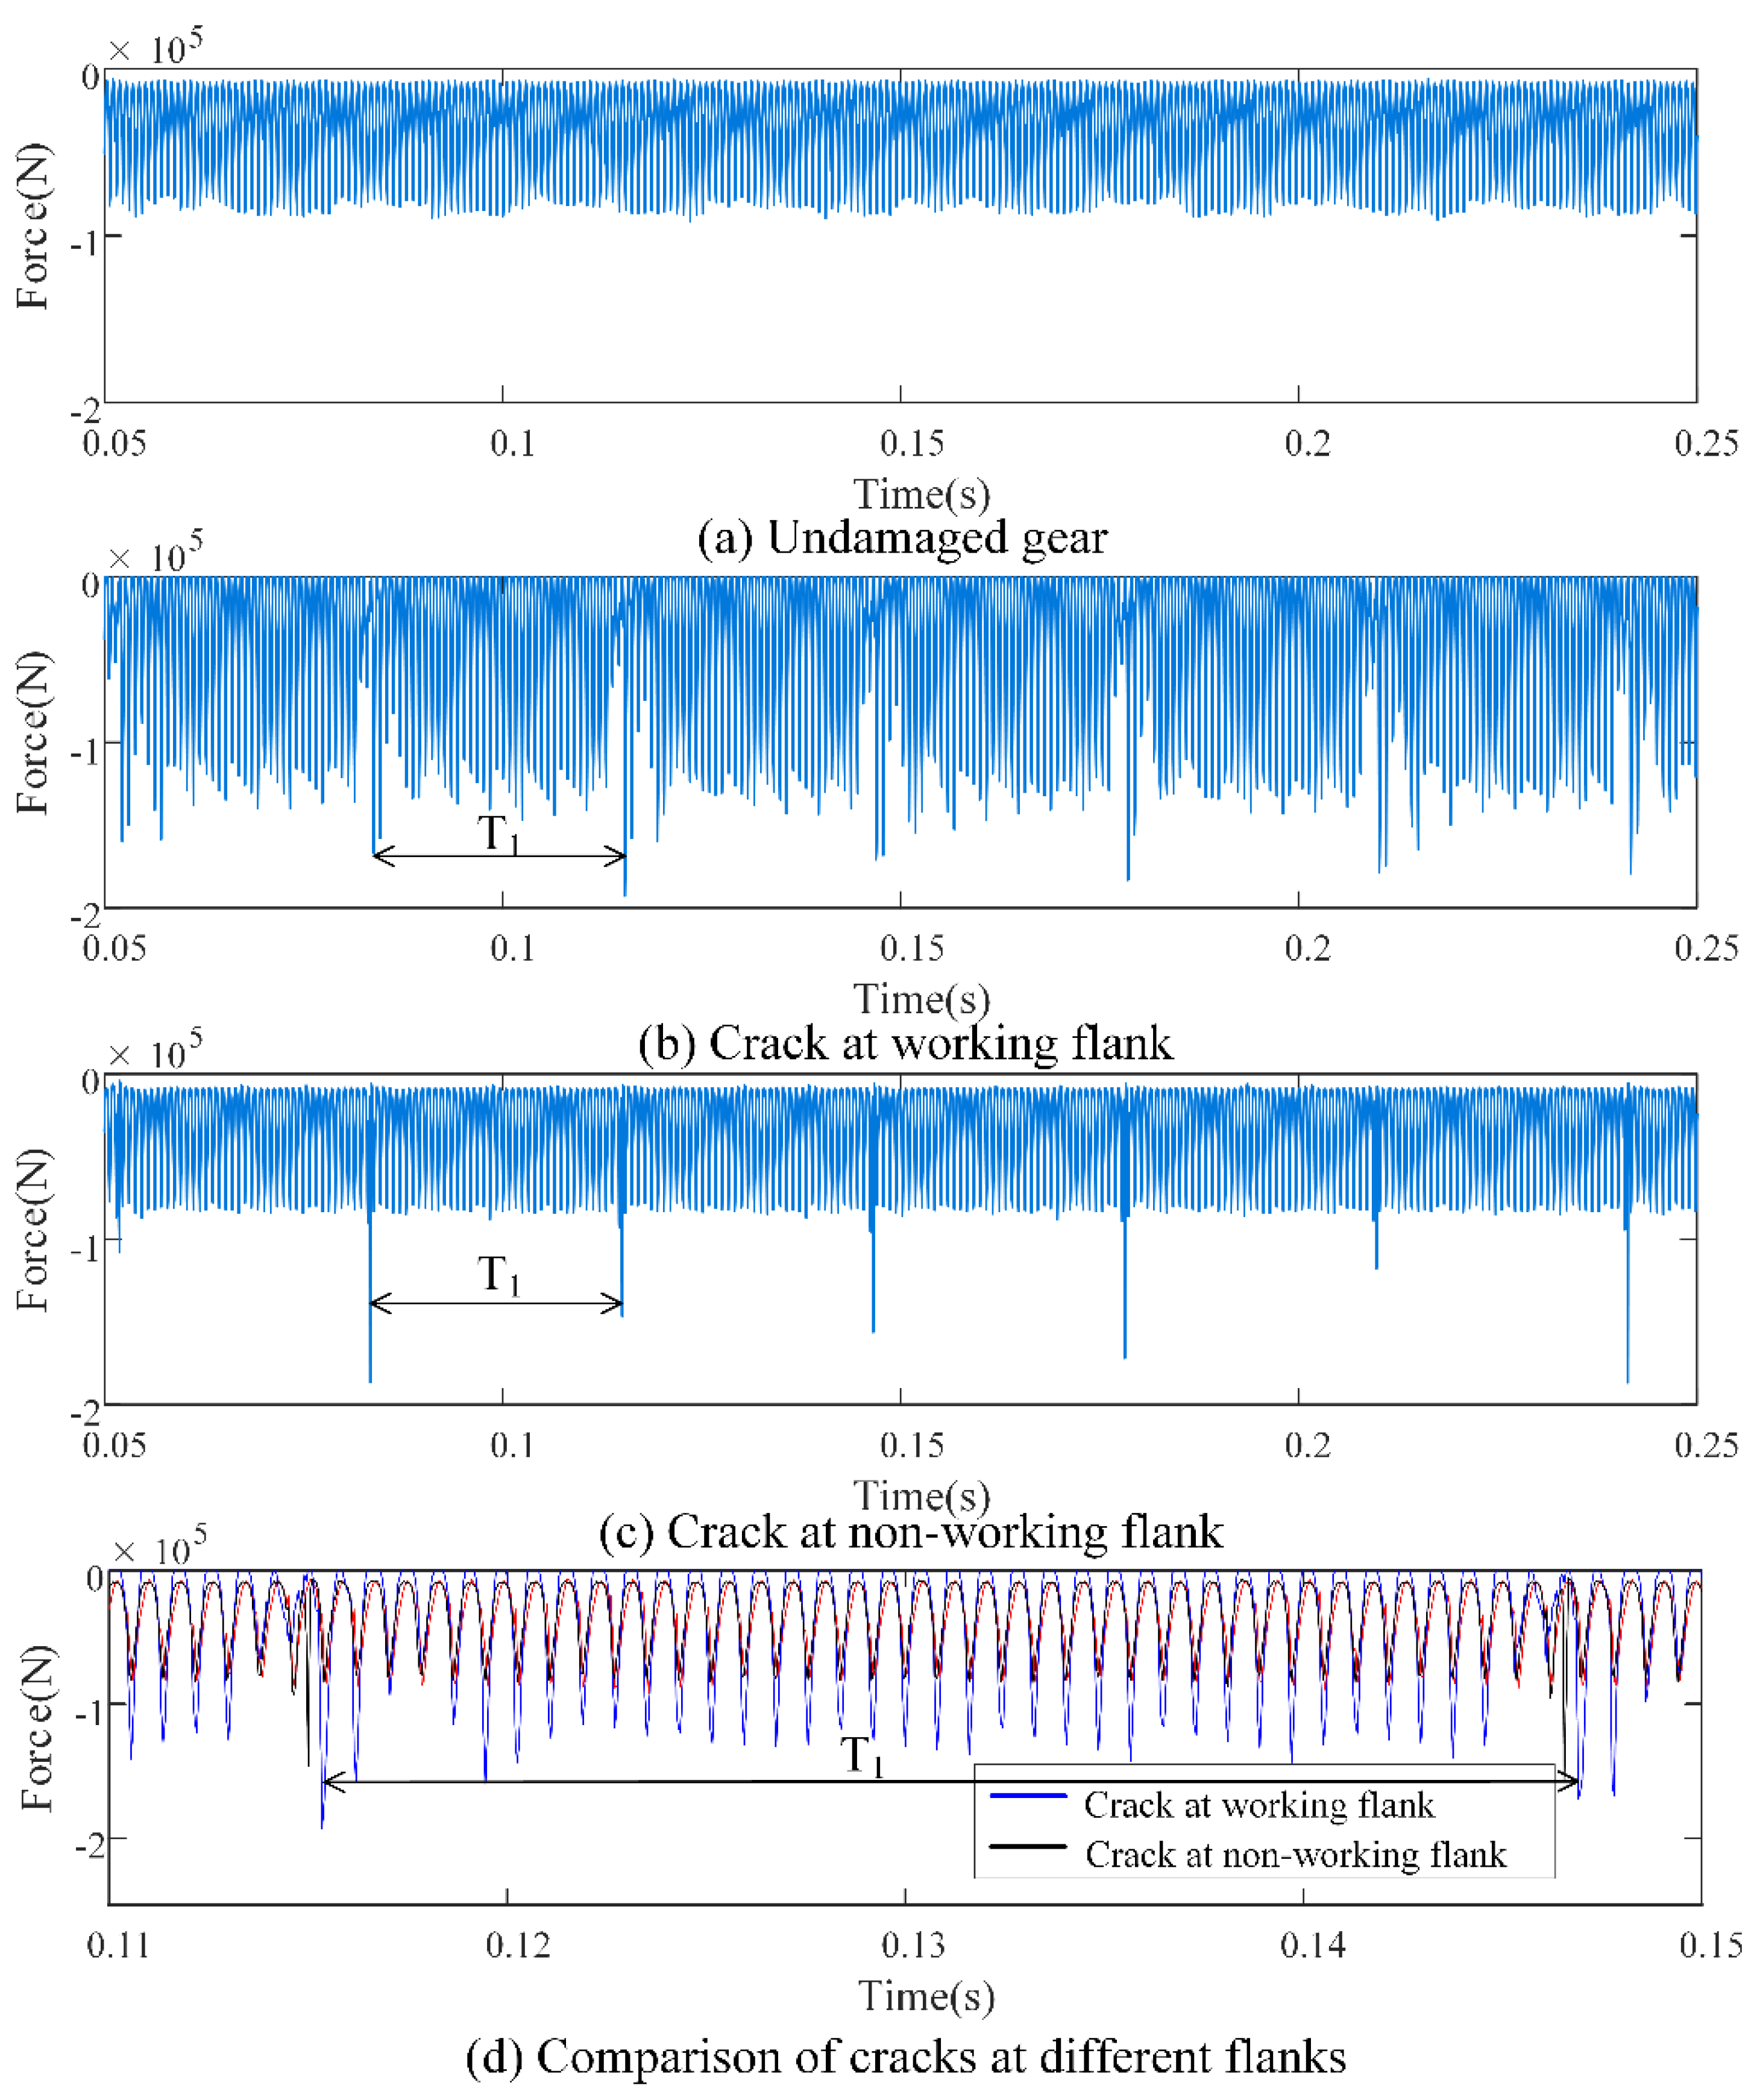
Dynamic simulation analysis was conducted on the established model of a helical idler gear transmission system to study its dynamic response, as shown in
Figure 5. When the dynamic load of undamaged gear transmission system is evenly distributed and the crack appears at the working flank, periodic impact will occur in the time domain. The period
is 0.032 s (equal to the reciprocal of the input gear frequency
), and the impact amplitude reaches 209.8% of the amplitude of the undamaged gear transmission system.
The dynamic load around the impact area changes dramatically, and the dynamic load far away from the impact area also fluctuates to a certain extent, with the amplitude up to 159.7% of that of undamaged gear transmission system. When the crack appears at the non-working flank, periodic impact will also occur in the time domain. The period is equal to , and the impact amplitude is about 203.1% of that of undamaged gear transmission system. However, in the area far from the impact, the crack at the non-working flank is close to the dynamic load response of undamaged gear, that is, the dynamic load is evenly distributed, and the fault characteristics is not obvious.
From an overall perspective, root mean square (RMS) under different states are calculated. It is found that when the crack appears at the working flank, the RMS of the damaged gear transmission system increases significantly compared to the undamaged gear transmission system, reaching 132.4%. Furthermore, as shown in
Figure 5b,d, the dynamic load curve fluctuates more violently in this state than in the undamaged gear transmission system, indicating that the overall operating state of the system tends to be unstable when periodic shocks occur. When the crack appears at the non-working flank, its RMS is very close to that of the undamaged gear transmission system, about 97.3%, which can be regarded as a very small gap. Observe the time-domain response curves in
Figure 5c,d. When the crack appears at the non-working flank, the dynamic load curve far away from the impact area basically coincides with that of the undamaged gear transmission system, indicating that the dynamic load of the system in this state will quickly return to the state of smooth operation after the impact. This is different from the case where the crack appears at the working flank.
3.2. Frequency Domain Analysis Based on Fast Fourier Transform
Fast Fourier transform is performed on the dynamic load time domain signal to obtain its frequency domain response, as shown in
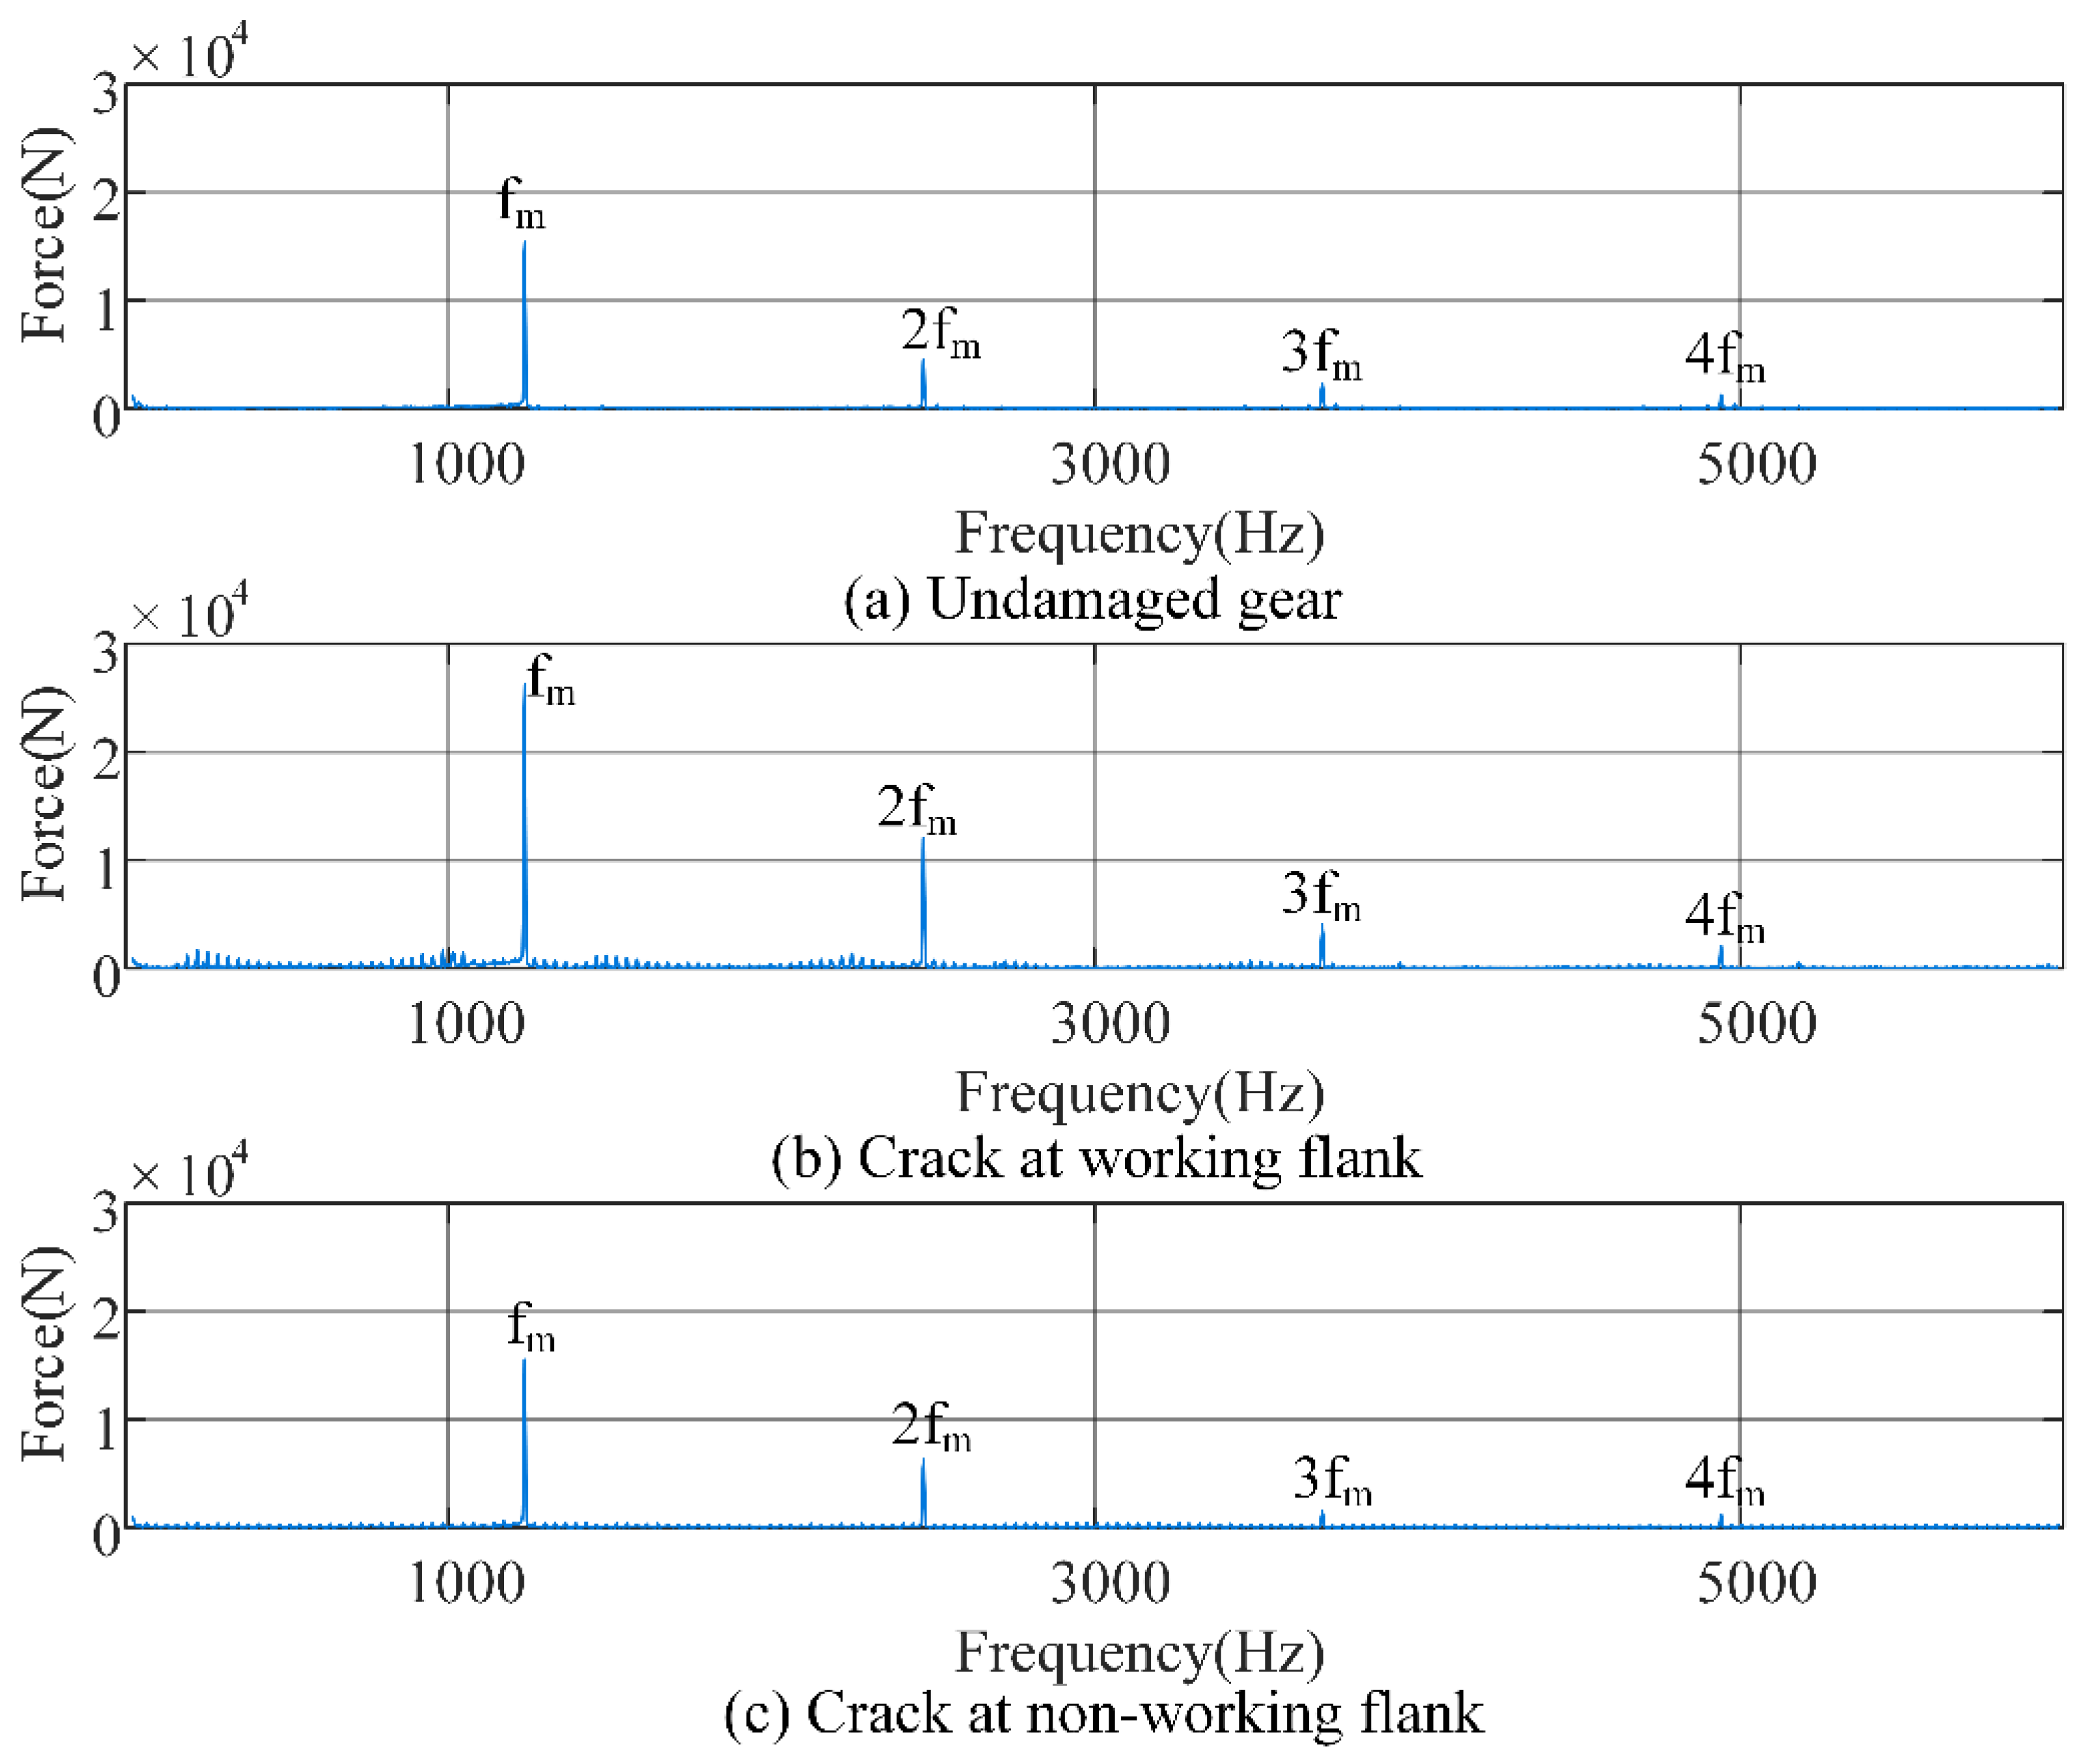
Figure 6.
Figure 6 shows that the peaks of the gear transmission system in different states all occur at the meshing frequency
(
is the meshing frequency of gear transmission system, n = 1, 2, 3, 4). When the crack appears at the working flank, the peaks at
and
are significantly higher than those of the undamaged gear transmission system. However, the peak gap decreases at
and
. When the crack appears at the non-working flank, the peak gap from that of the undamaged gear transmission system is smaller than crack appears at the working flank. Compared with an undamaged gear transmission system, the most important characteristic of cracks in the frequency domain should be the sideband phenomenon near
, so the areas near
,
,
and
in
Figure 6 need to be enlarged for further observation, as shown in
Figure 7.
As can be seen from
Figure 7, due to complex working conditions of a helical idler gear transmission system, the
(
is the meshing frequency, n = 1, 2, 3, 4) of an undamaged gear transmission system is not completely level, but exhibits a certain degree of sideband phenomenon, but is not periodic at all and has low amplitude, as shown in
Figure 7a. When the crack appears at the working flank, as shown in
Figure 7b, there are sideband phenomena with high amplitude and great fluctuation in the
, and the interval between adjacent amplitudes is equal to the reciprocal of the axial frequency
of the input gear, showing obvious periodicity. When the crack appears at the non-working flank, as shown in
Figure 7c, a sideband with low amplitude and uniform distribution appears on the
, and the interval between adjacent amplitudes is equal to the reciprocal of shaft frequency
of the input gear. The periodicity is the same as when the crack appears at the working flank. The amplitude indicates that the sideband amplitude in this state can be completely distinguished from the irregular band in the undamaged gear state, but the amplitude is far lower than that when the crack appears at the working flank. At the same time, it is found that with the increase in frequency, the sideband amplitude difference decreases gradually when the crack appears at the working flank and the crack appears at the non-working flank.
In the high frequency region, namely, near and , the peaks of gear transmission systems in different states have little difference, while in the low frequency region, namely, near and , when the crack appears at the working flank, the peaks are obviously greater than those in the undamaged gear state or crack at the non-working flank. In the undamaged gear state, there are frequency bands with low amplitude and no periodicity near ( is the meshing frequency, n = 1, 2, 3, 4) of gear transmission system, which can be regarded as no sideband phenomenon, while the cracked gear appears with obvious periodic sideband phenomenon near . The period is equal to the reciprocal of the shaft frequency of the faulty gear. When the crack appears at the working flank, the sideband generally has a high amplitude and large fluctuation, when the crack appears at the non-working flank, the sideband generally has a low amplitude and uniform distribution. This difference always exists, but the comparison is more obvious in the low-frequency region, which can be used as a reference to distinguish the crack location at the working flank or the non-working flank.
3.3. Energy Spectrum Analysis Based on Time–Frequency Domain
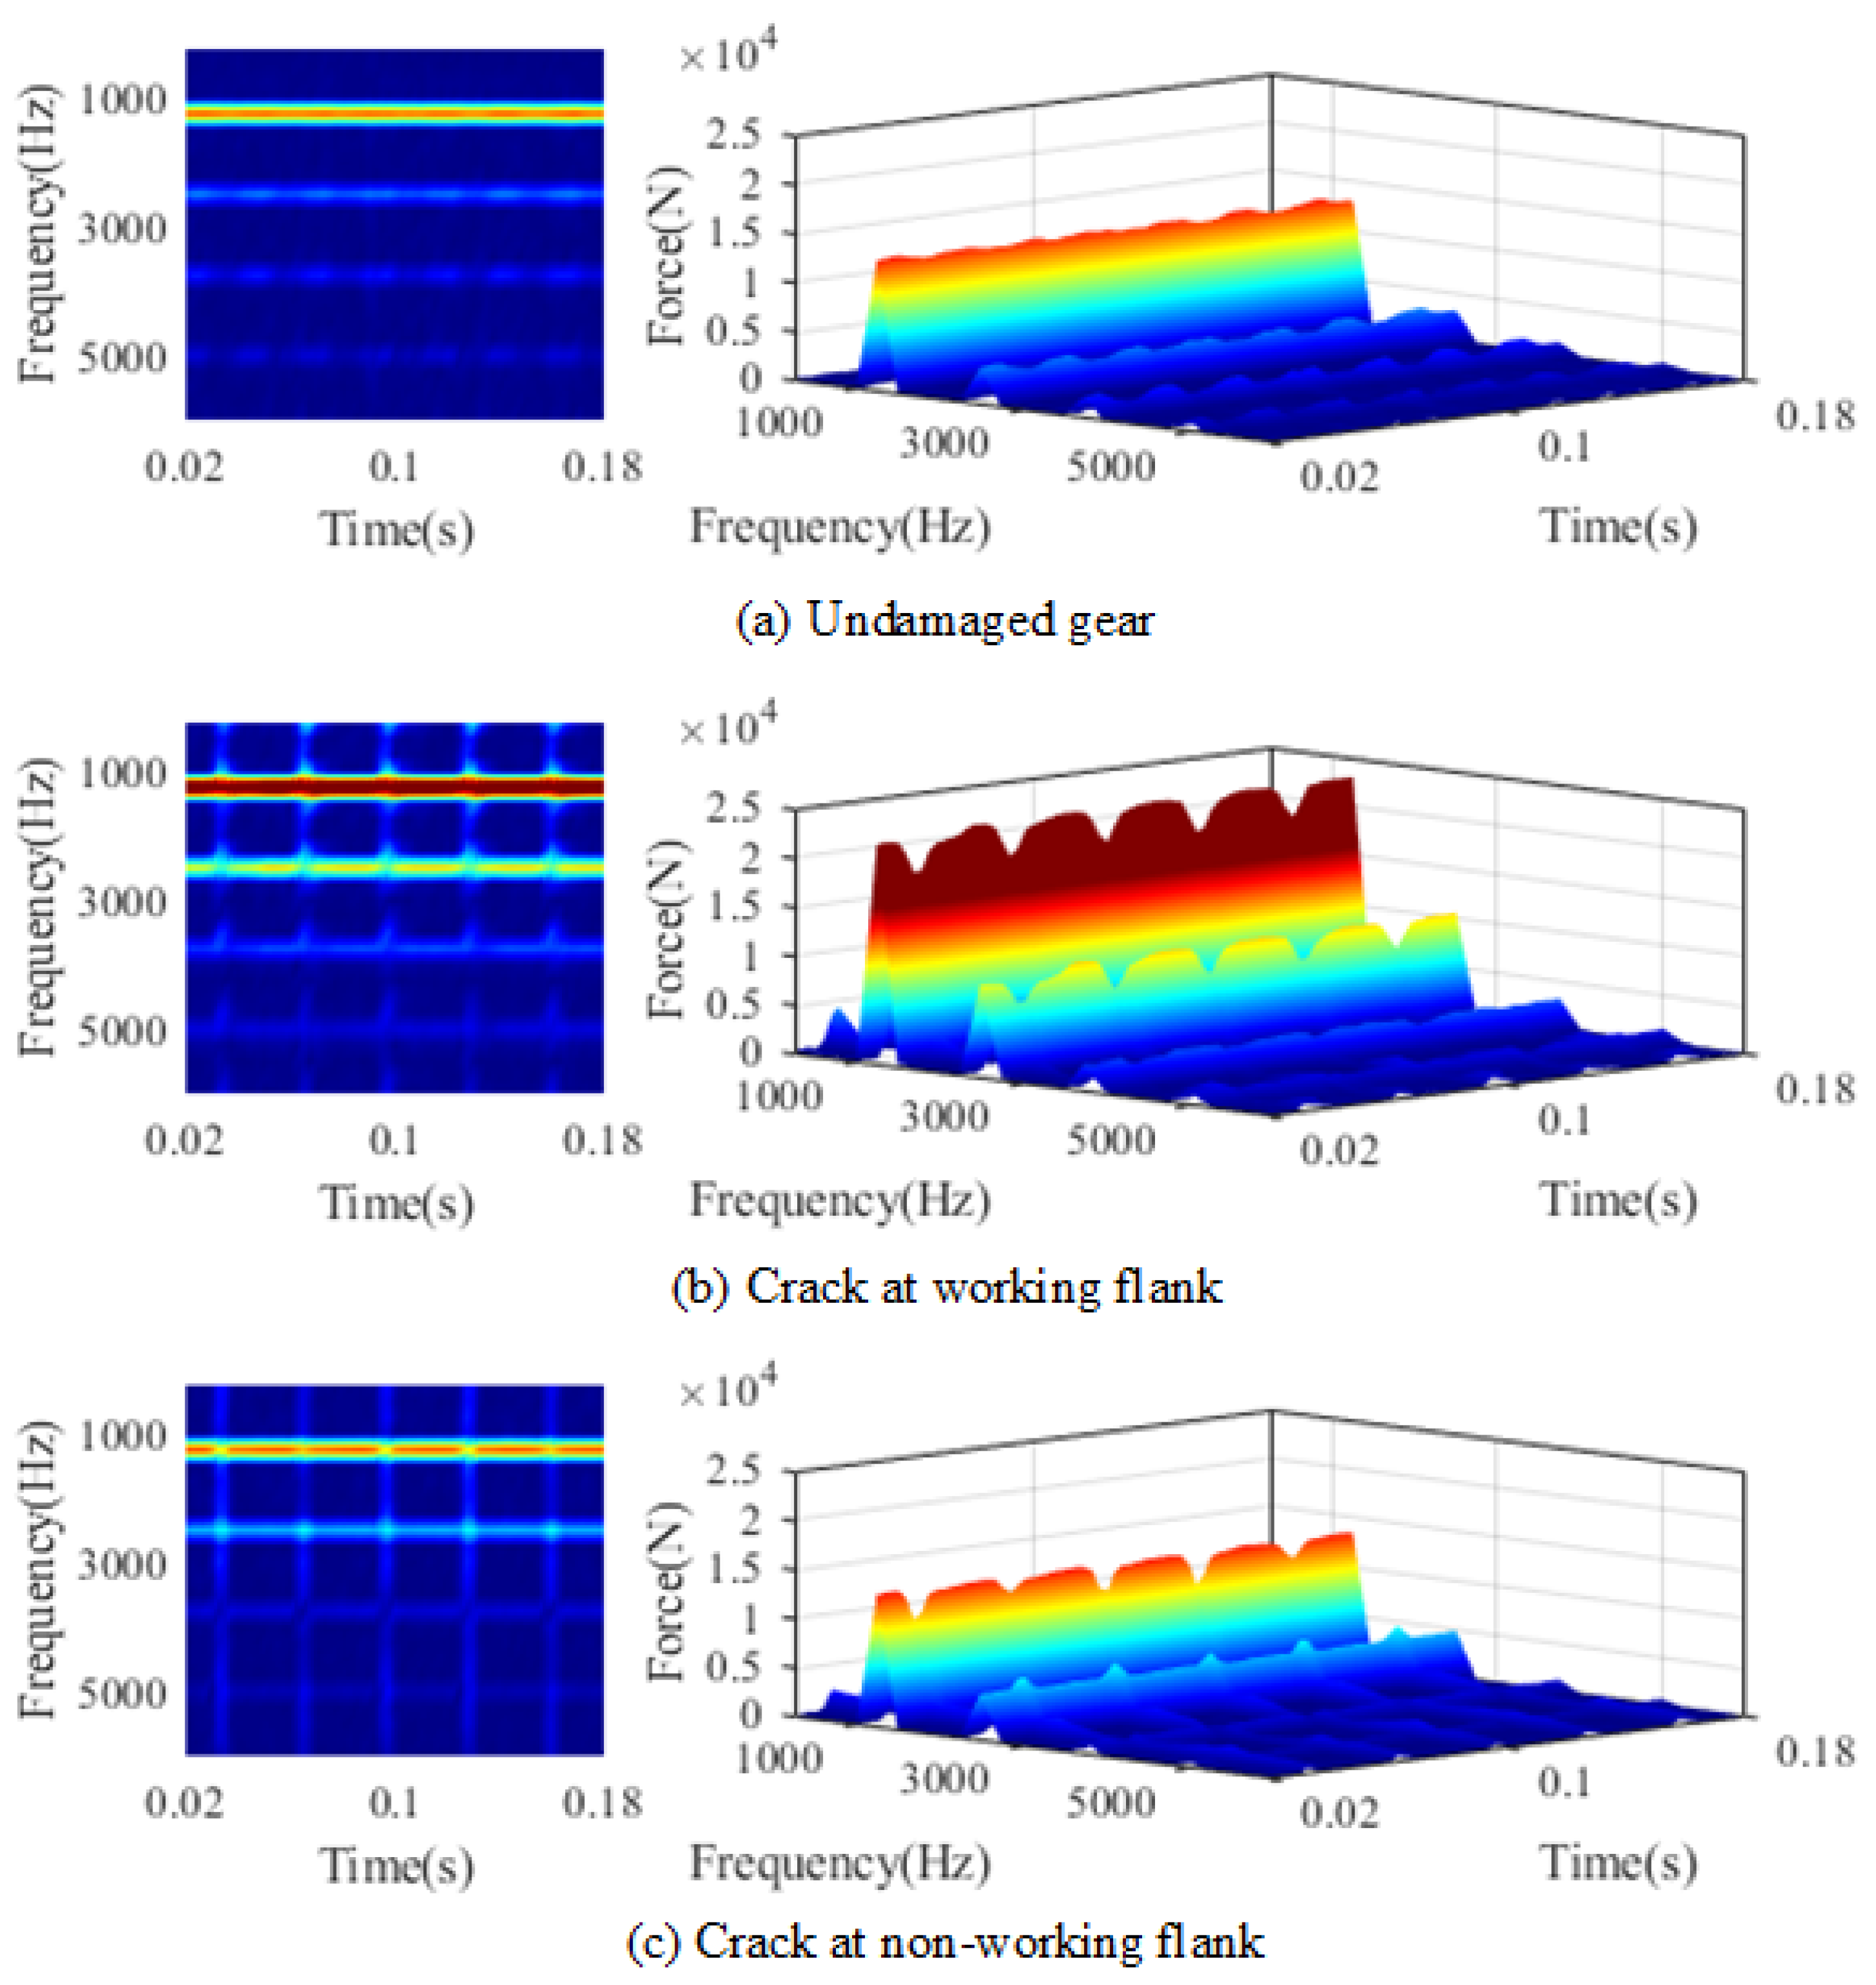
The time–frequency domain response energy spectrum of helical idler gear transmission system was obtained, as shown in
Figure 8. In the undamaged gear state, energy is mainly concentrated at
, and is most obvious near
and
, as shown in the bright color area in
Figure 8a. The energy spectral density at any frequency does not change significantly with time. When the crack appears at the working flank, as shown in
Figure 8b, the location of the bright colour region remains at
, and the colour is significantly deepened, indicating that the energy spectrum density increases and the width increases in the frequency direction, corresponding to the sideband phenomenon in the frequency domain response. Periodic fluctuations appear in the time direction, corresponding to the periodic impact
in the time domain response. When the crack appears at the non-working flank, compared with the undamaged gear state, the colour of the bright area at
is deepened and the width in the frequency direction is increased. This phenomenon is similar to when the crack appears at the working flank, but less obvious. The periodic fluctuation period in the time direction is the same as the period when the crack appears at the working flank.
In conclusion, the concentration of energy spectrum density always appears at
and decreases with increasing frequency, whether the crack appears at the working flank or the non-working flank. This phenomenon is most obvious near the
and
. When the crack appears at the working flank, the energy spectral density of
and
apparently increases, and there is obvious diffusion in the frequency domain. When the crack appears at the non-working flank, the energy spectral density of
and
only increases to some extent, and there is a tendency of diffusion in the frequency domain; as shown in
Figure 8b,c, the widths of the brightly coloured areas in the frequency domain around
and
increased. As long as cracks occur, periodic impact phenomena can be found on the time axis of the energy spectral density diagram, which is relatively obvious near
. With the increase in frequency, the energy spectral density decreases continuously, leading the periodic phenomenon gradually to become less obvious. The analysis results in the time–frequency domain show that, in order to distinguish whether the crack occurs at the working flank or the non-working flank, the main observation area should be near
and
.
4. Experimental Verification
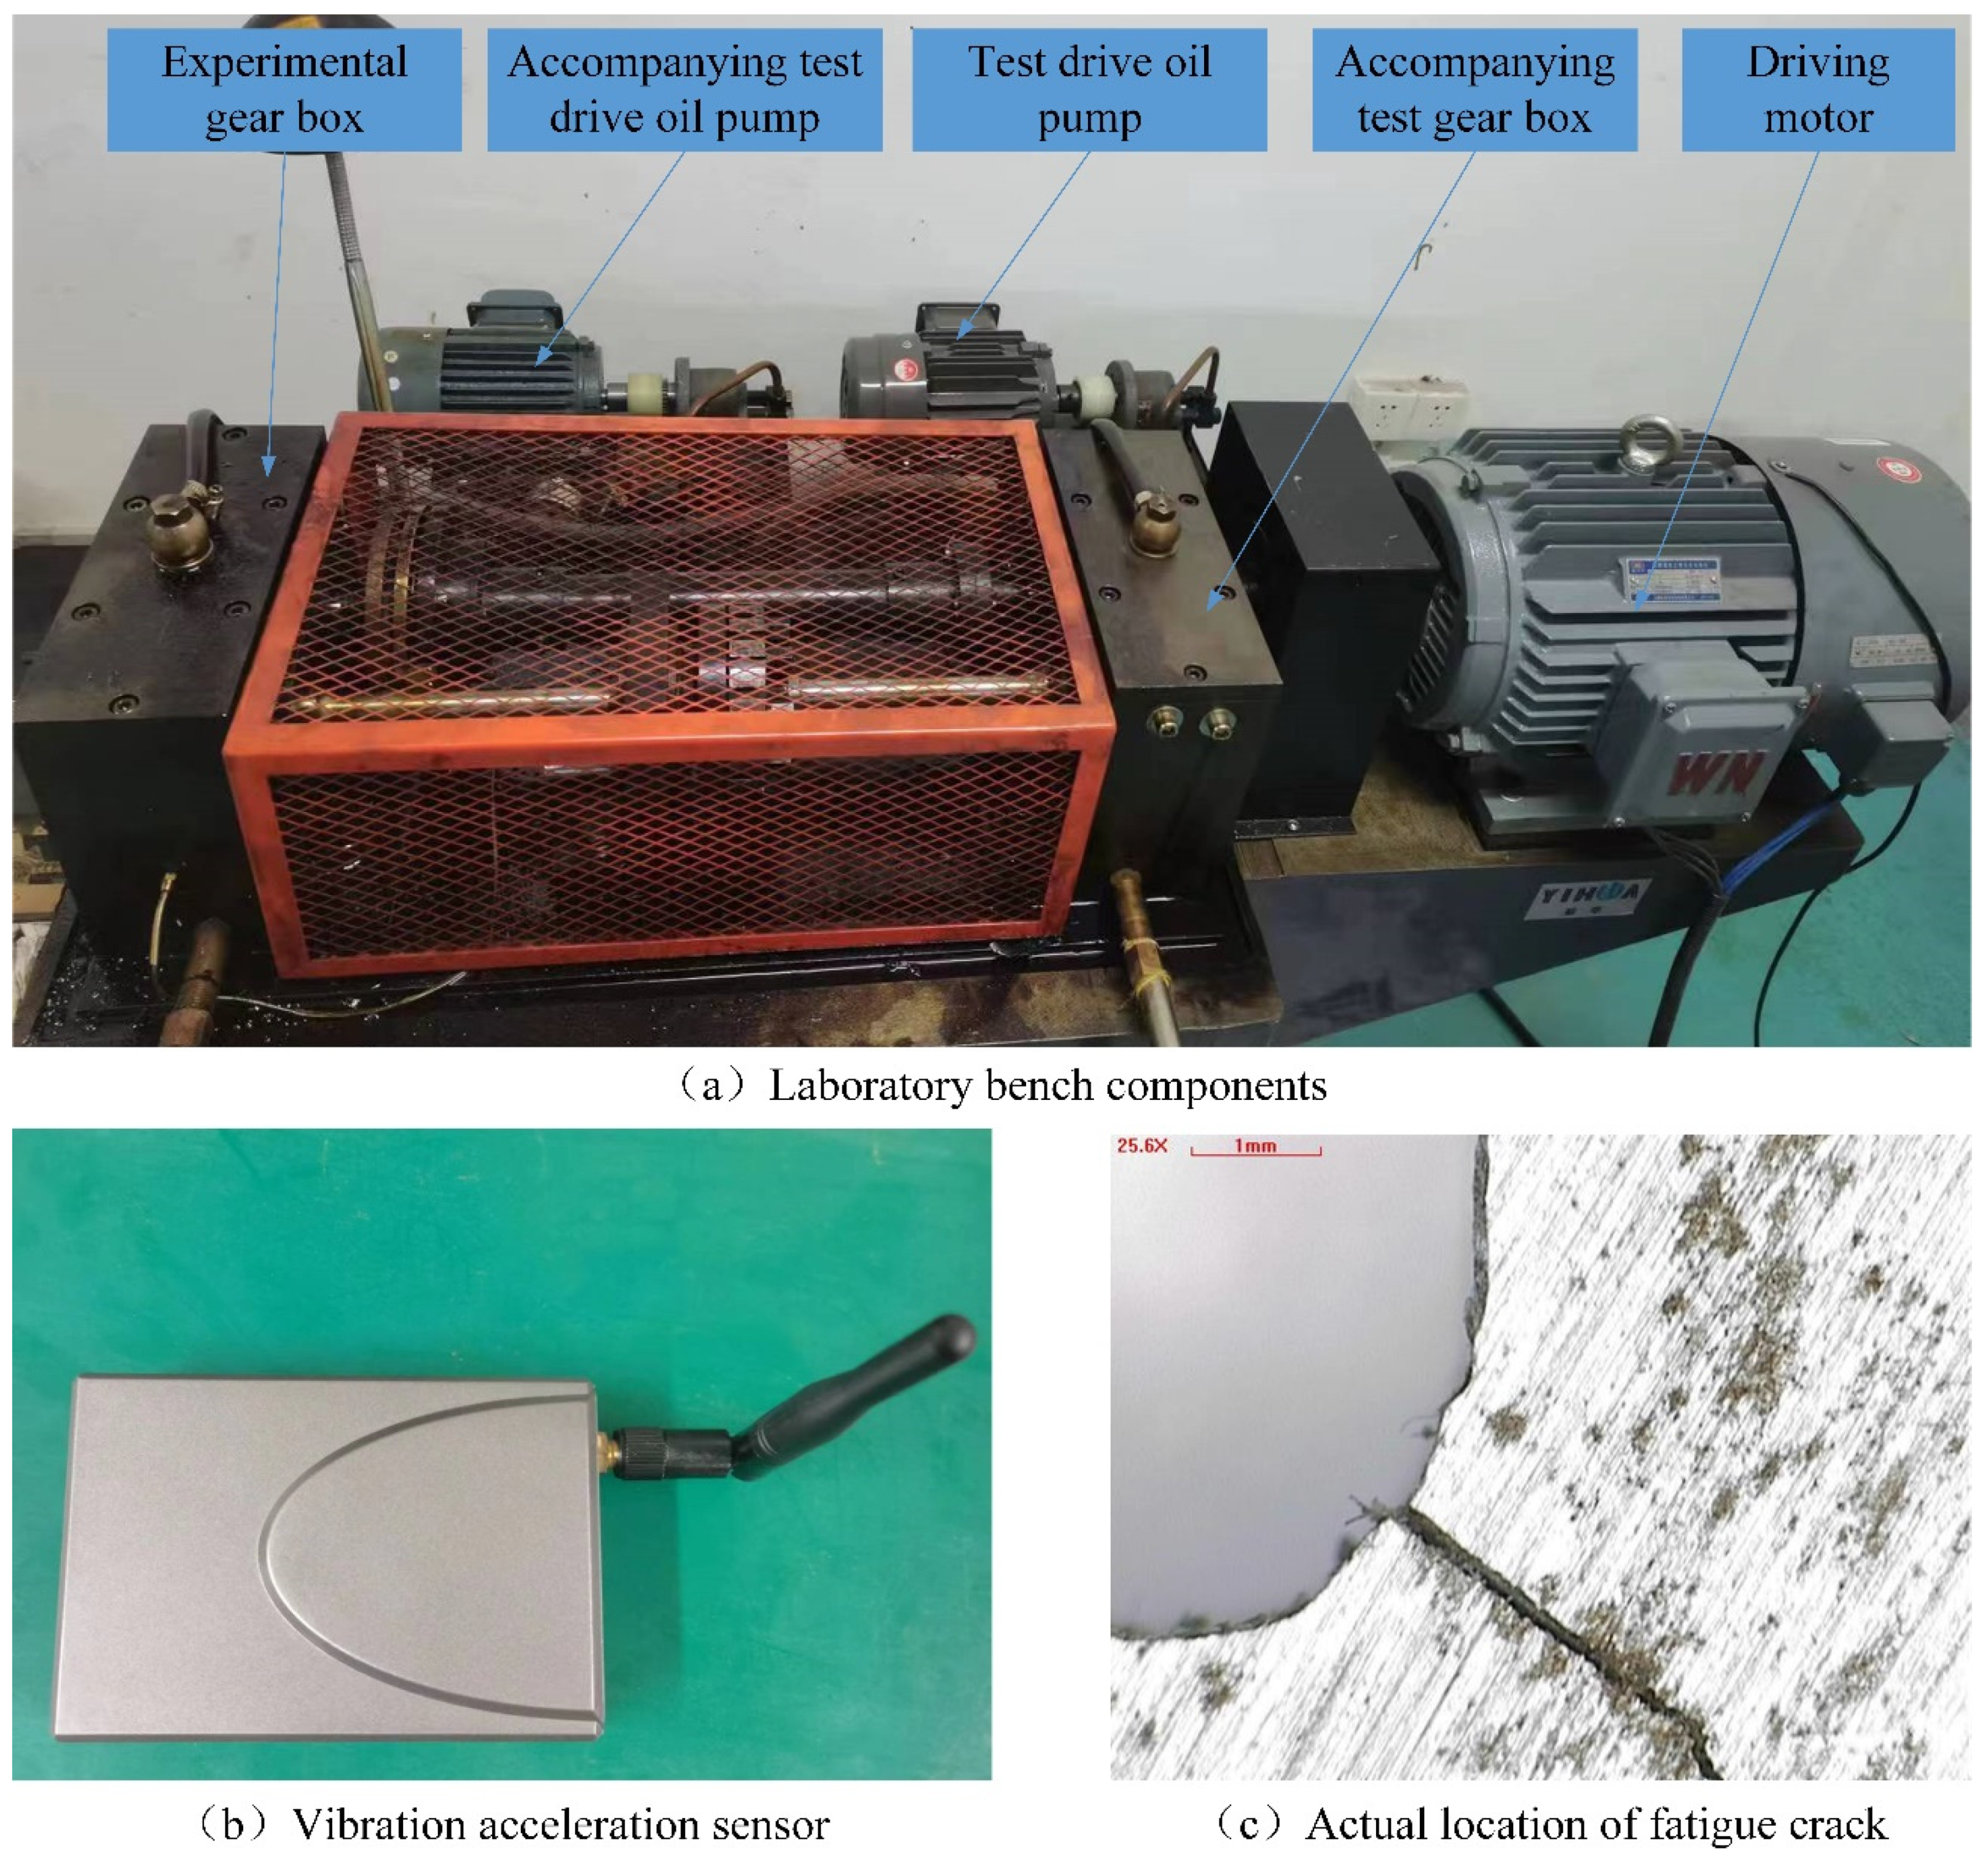
The vibration experiment of the gear system was carried out using the FZG closed power flow gear experimental platform, and the corresponding position was selected for wire cutting based on the actual fatigue crack location, as shown in
Figure 9.
The experimental gears exhibited cracks appearing at the working flank and the non-working flank. The vibration signal of the gear system is captured by a vibration acceleration sensor, installed on the bearing end cover of the gearbox. As the gear transmission system is a closed whole, the vibration signal of the gear during operation will be transmitted outward along the transmission route of gear–key–shaft–bearing–bearing cover, so the vibration signal measured by the sensor on the bearing end cover can be considered as the reflection of the gear body’s vibration signal.
Considering the complex experimental conditions, Empirical Mode Decomposition processing is applied to signals collected by a vibration acceleration sensor, and appropriate signal components are selected to yield response results in both the time and frequency domains. In the time domain, we observe that the vibration amplitude of the cracked gear transmission system is significantly increased compared to the undamaged gear state and is more obviously increased when the crack appears at the working flank. However, due to interference from other vibration signals on the transmission path, the periodic impact is only relatively obvious when the crack appears at the working flank. When the crack appears at the non-working flank, the periodic impact in the time domain is difficult to recognize. This experimental phenomenon aligns with the trend of the model solution presented in
Section 3.
The response signals in the frequency domain are obtained via fast Fourier transform, and it is found that the main differences are concentrated in the vicinity of and ; is the meshing frequency of the experimental gear transmission system. When the crack appears, the peaks at and increase obviously. The spectrum exhibits sidebands near and , with a period equal to ; is the shaft frequency of the test gear with crack fault. When the crack appears at the working flank, the increase in the peaks at and is more obvious. The sideband is periodic but the amplitude is obviously larger than that of the crack at the non-working flank. The occurrence of the crack and the location of the crack can be preliminarily judged based on these two phenomena.
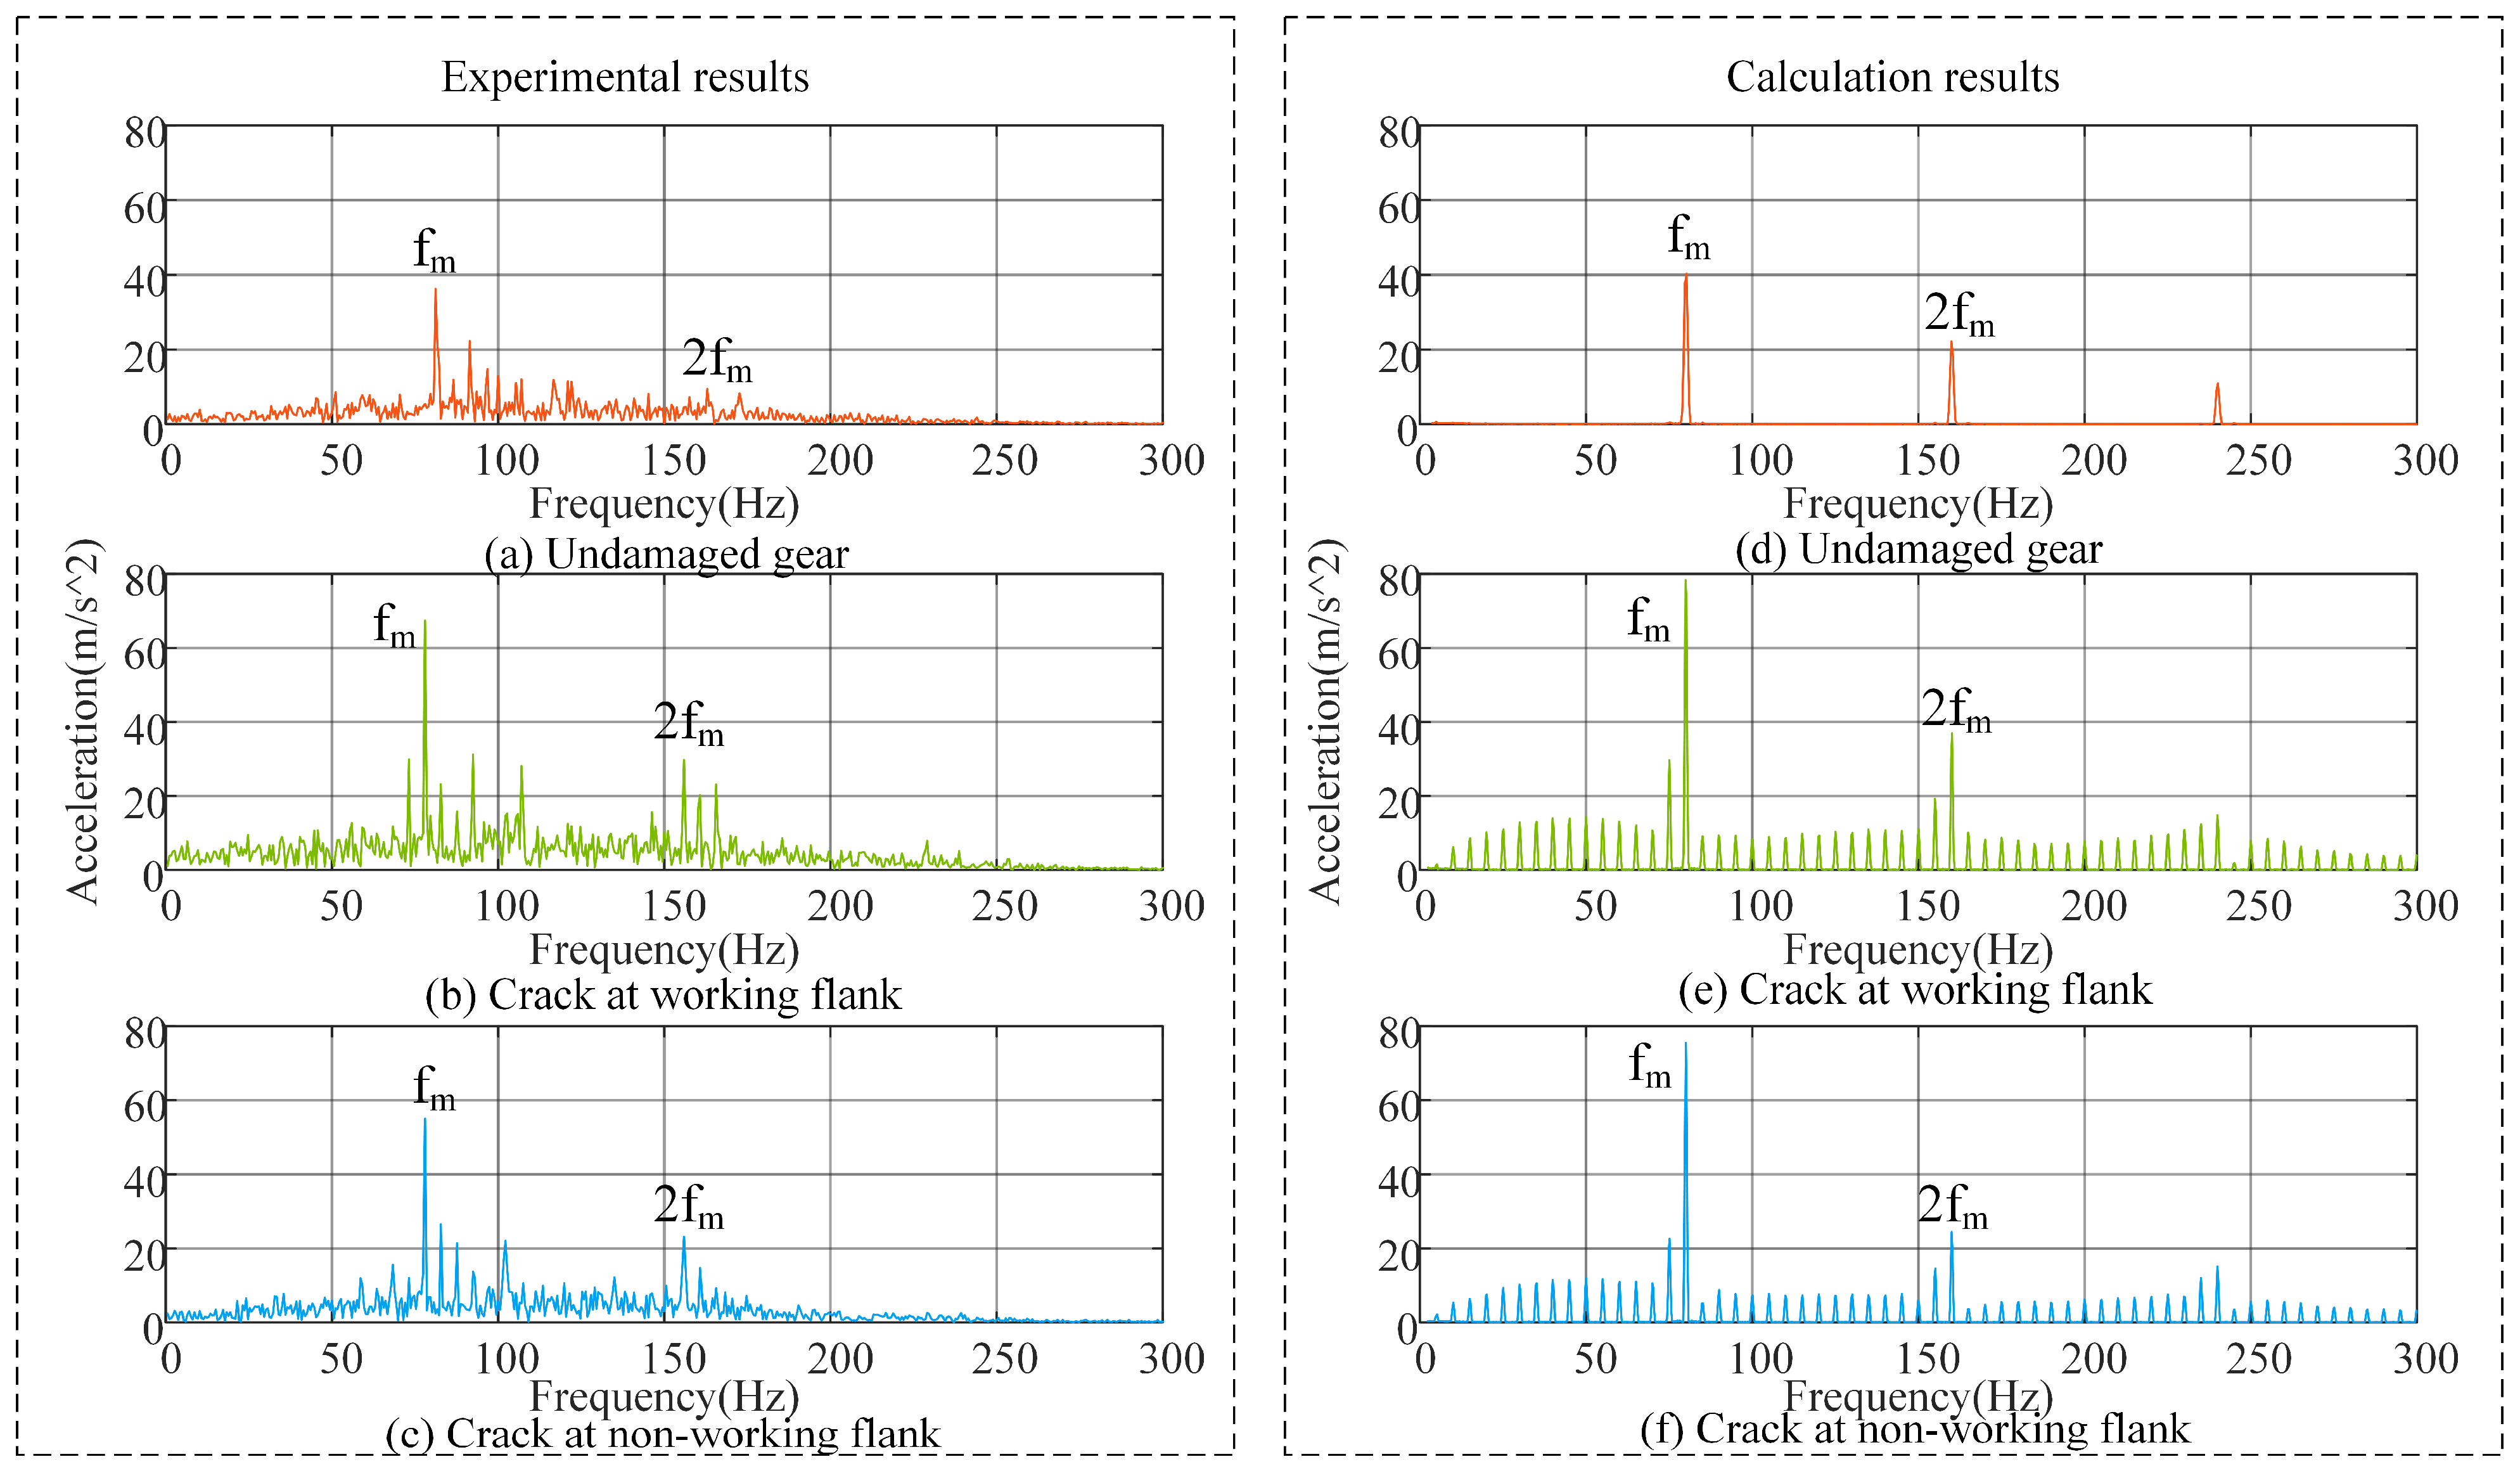
To verify the accuracy of the calculation model, according to the relevant parameters of the experiment, the previous method is used for modelling. The frequency domain responses of the experimental and computational results are compared in
Figure 10. The trends of their curves in the frequency domain are consistent. When the crack appears, the sidebands with a period of
appear near
and
. The amplitude of the sidebands is significantly higher when the crack appears at the working flank compared to when it appears at the non-working flank.
Taking the experimental results as the standard value, the sideband amplitudes of the two results near
and
are extracted for error analysis, and the results are shown in
Table 2.
Table 2 illustrates that the error between the experimental and computational results can be kept within 20%, indicating good correspondence between the experimental and computational models.
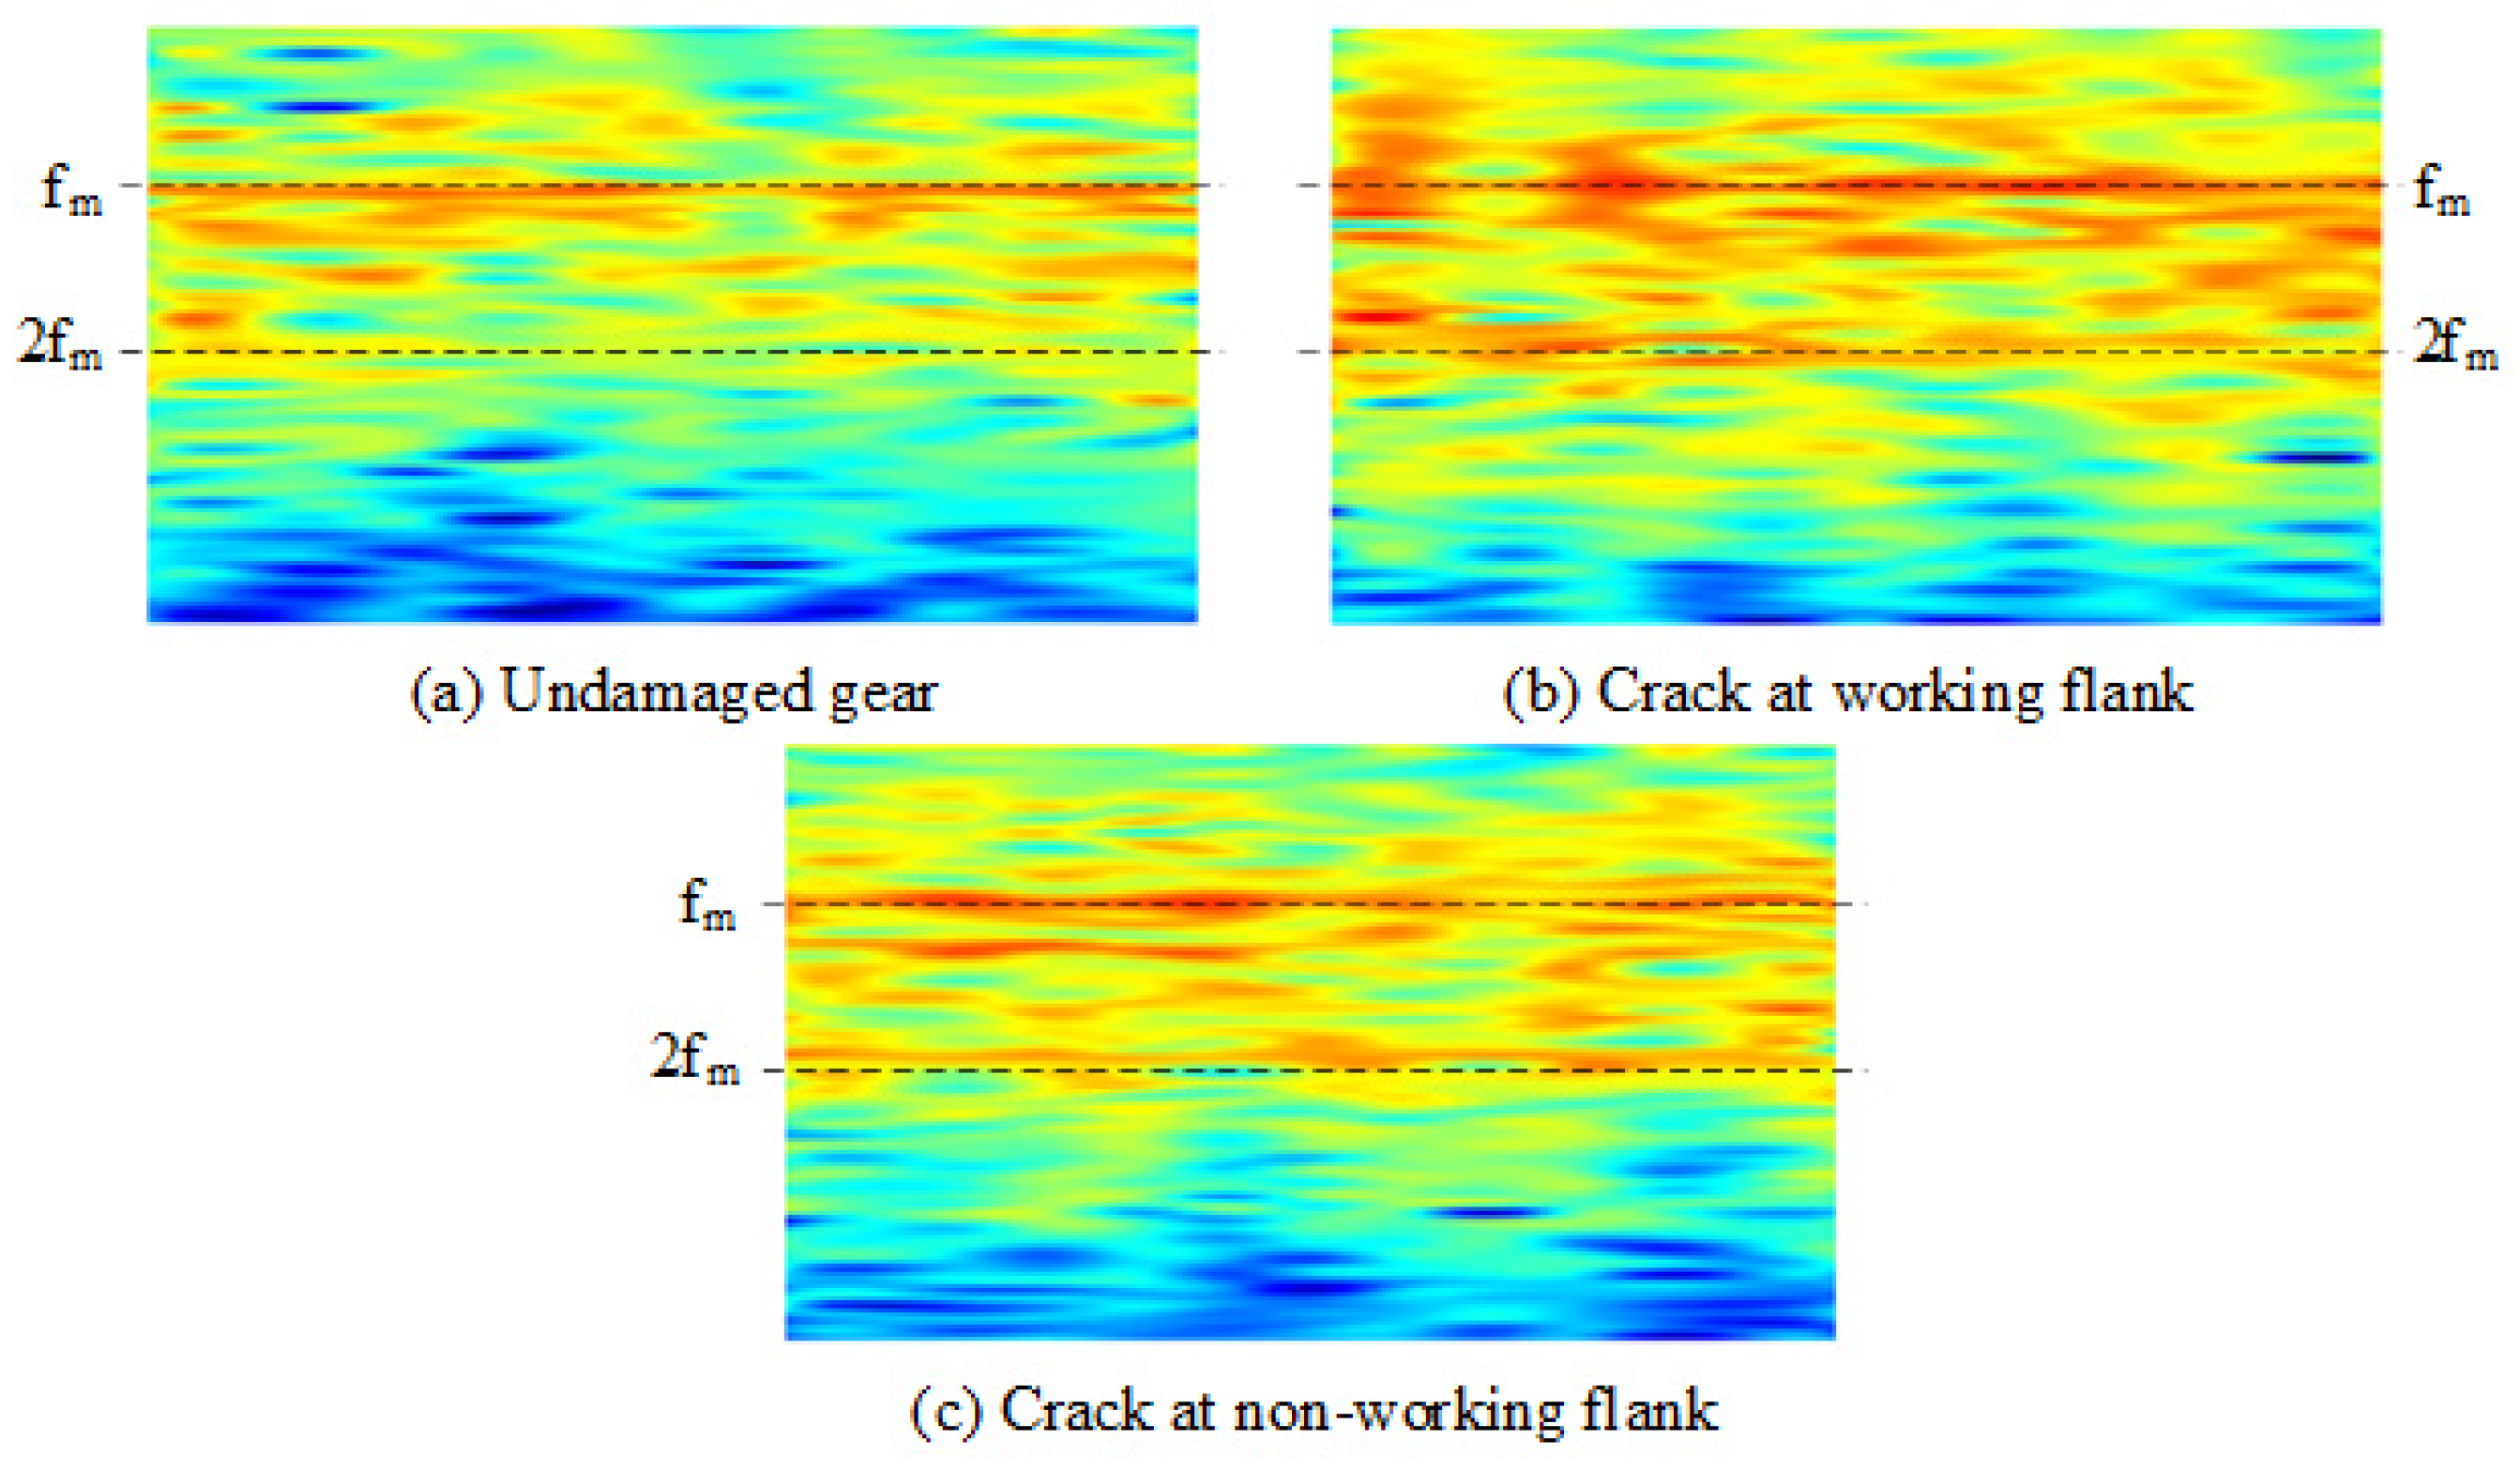
To study the response results of experimental signals in the time–frequency domain, short-time Fourier transform is applied to the collected signals, and the results are shown in
Figure 10. Due to complex experimental conditions, the energy spectral density in the time–frequency domain is less stable than the dynamics model solution results, showing non-uniformity. Therefore, the positions of
and
are marked by dotted lines in the figure, and the nearby energy spectral density is observed. In the undamaged gear state, the energy bands of
and
can be identified as shown in
Figure 11a.
When the crack appears at the working flank, as shown in
Figure 11b, the energy bands at
and
obviously widen and deepen in colour, indicating that the energy spectral density increases and sidebands appear around them. As the energy spectral density increases, the non-uniformity of energy spectral density becomes more obvious, leading to the appearance of energy gap. When the crack appears at the non-working flank, as shown in
Figure 11c, the energy band at
and
tends to widen and deepen in color, and there is no obvious energy gap phenomenon, indicating that the amplitude growth and sideband phenomenon at the
and
are not as obvious as the crack at the working flank state.


