Article

Dynamic Analysis of Vibration Attenuation in Dual-Stage Cascade Spring-Mass System (DCSMS) for High-Precision Instrumentation

by
Xin Jin
*,
Yihua Kang
and
Zhiwei Huang
School of Mechanical Science & Engineering, Huazhong University of Science and Technology, 1037 Luoyu Road, Wuhan 430074, China
*
Author to whom correspondence should be addressed.
Actuators 2025, 14(4), 179; https://doi.org/10.3390/act14040179
Submission received: 6 March 2025 / Revised: 30 March 2025 / Accepted: 3 April 2025 / Published: 7 April 2025
(This article belongs to the Section Actuators for Manufacturing Systems)

Abstract

:
The detrimental effects of low-frequency vibrations on the measurement accuracy of commercial high-precision instrumentation demand urgent resolution, particularly for instruments requiring <1 μm positioning stability. Conventional base-mounted active damping systems exhibit limitations in suppressing the structural resonance induced by passive isolators—especially when the environmental vibration intensity surpasses the standard thresholds. Therefore, in this study, we developed an innovative multi-mode control architecture to substantially enhance the vibration-damping capabilities of the DCSMS. The proposed methodology synergistically integrates foundation vibration isolators with embedded passive modules through a dual-stage spring-mass system optimization framework. Experimental validation combining ADAMS–MATLAB multi-physics co-simulation, complemented by a decoupling analytical control model based on the vibrational transmission characteristics of the source propagation path, substantiated the efficacy of the proposed control methodology.

1. Introduction

The majority of commercial high-precision instruments are currently integrated with passive vibration isolation components [1,2] to isolate the vibration effects from the environment. However, the introduction of these components undoubtedly increases the system’s sensitivity to low-frequency vibrations. Furthermore, with the continuous development of the semiconductor industry and the resolution of precision instruments reaching the sub-nanometer scale or even higher, passive vibration isolation and its improved forms [3], as well as semi-active vibration control [4,5], are unable to achieve the vibration levels required by precision instruments [6].
Once the sensors and actuators have been selected, the enhancement of the system performance is dependent on adjustments to the system structure [7,8] and the optimization of the control algorithm [9,10,11]. In the event of severe ground vibrations exceeding the standard, the maximum output driving force of a single-layer linear motor is constrained by the determined motor thrust constant, rendering it challenging to fulfill the rigorous vibration requirements of the equipment. Although the installation of parallel motors [12] can increase the maximum output torque of the system in a single direction and then effectively isolate the vibrations of large inertial loads in a shorter period of time, this approach not only complicates the structure but also introduces additional modes due to the non-collinearity of their output driving forces, leading to complex control.
A degradation of the damping performance of cascaded passive systems is possible due to the coupling of intrinsic resonant frequencies [13], which can be readjusted and redesigned to facilitate the dispersion and absorption of the vibration energy to achieve a better vibration isolation effect [14,15,16,17,18]. Furthermore, the modal problems caused by structural coupling in cascaded passive vibration isolation systems and the constraint boundary problem for the transfer function of the multi-degree-of-freedom (MDOF) system in the frequency domain can be effectively solved by introducing the active vibration control technique [19]. Originally, pure feedback control was primarily employed to regulate periodic source vibrations [20] and enhance the performance of the cascaded vibration isolation system to a specified level in the presence of motor output saturation. The findings of [21] indicate that multi-loop feedback control outperforms single-loop feedback control in cascaded systems. Feedforward control is an effective method for isolating the impact of ground vibrations on precision instruments with multiple inputs and outputs [22]. An integration control strategy that combines feedback and feedforward control for precision instrument vibration control has been demonstrated in [23].
Current active vibration control systems in commercial high-precision instrumentation predominantly employ hybrid architectures combining ground-based feedforward and platform feedback. However, while these systems effectively isolate ground-borne vibrations, they fail to suppress platform-intrinsic vibration sources, such as chilled water circulation systems, pneumatic compressors, molecular pumps, and cooling fans. To mitigate these high-frequency disturbances, manufacturers typically integrate passive isolators, but due to the inherent structural characteristics of the target system, the reliance of purely algorithmic solutions on base-layer isolation proves insufficient in mitigating the resolution degradation caused by severe environmental vibration. Therefore, a customized engineering-oriented framework design that synergistically integrates the transmission electron microscope (TEM) system architecture with advanced vibration isolation mechanisms to address extreme overshooting vibration challenges is essential.
Enlightened by the aforementioned research, a multiple combined vibration suppression method based on dual feedback control (DFBC) of table velocity and feedforward control (FFC) of ground velocity is proposed (Figure 1) to eliminate the adverse effects of severe low-frequency vibrations on the performance of isolated precision instruments. By introducing this control technology in the DCSMS, the maximum thrust limitations are overcome, while structural constraints on the single-layer motor are avoided. To obtain more accurate simulation results, the white noise velocity signal was employed as the system’s foundation excitation, which effectively avoided the simulation error caused by single-frequency excitation. Through experimental testing and a comparison of the internal and external sensors, the vibration isolation control effect of the proposed method, which is superior to that of pure dual tabletop feedback control with the same quantity of actuators, can effectively inhibit the influence of the resonance of the floating unit itself and realize an effective improvement of the vibration isolation control effect.
First, an exhaustive investigation was conducted into the vibration-damping characteristics of the DCSMS, which are governed by both passive and active control mechanisms. Initially, a general expression for the velocity transfer function of the DCSMS in the passive configuration was derived from the kinetic perspective, which was followed by an analysis of the system structure stability via the Routh–Hurwitz criterion. Furthermore, the DCSMS model was constructed utilizing ADAMS, which enables a more nuanced exploration of the impact of the fundamental parameters on the system’s frequency response characteristics (FRCs) and power spectral density (PSD). Moreover, the investigation then extended to the vibration transmission characteristics of the DCSMS under various control modes, with the introduction of a detailed analytical model for the system’s active control. Subsequently, the combined control strategy for the DCSMS was demonstrated through ADAMS and MATLAB co-simulation. Finally, an experimental platform for the DCSMS prototype was established to validate the feasibility and effectiveness of the proposed active vibration multiple-control method.

2. Passive Characteristics of the DCSMS

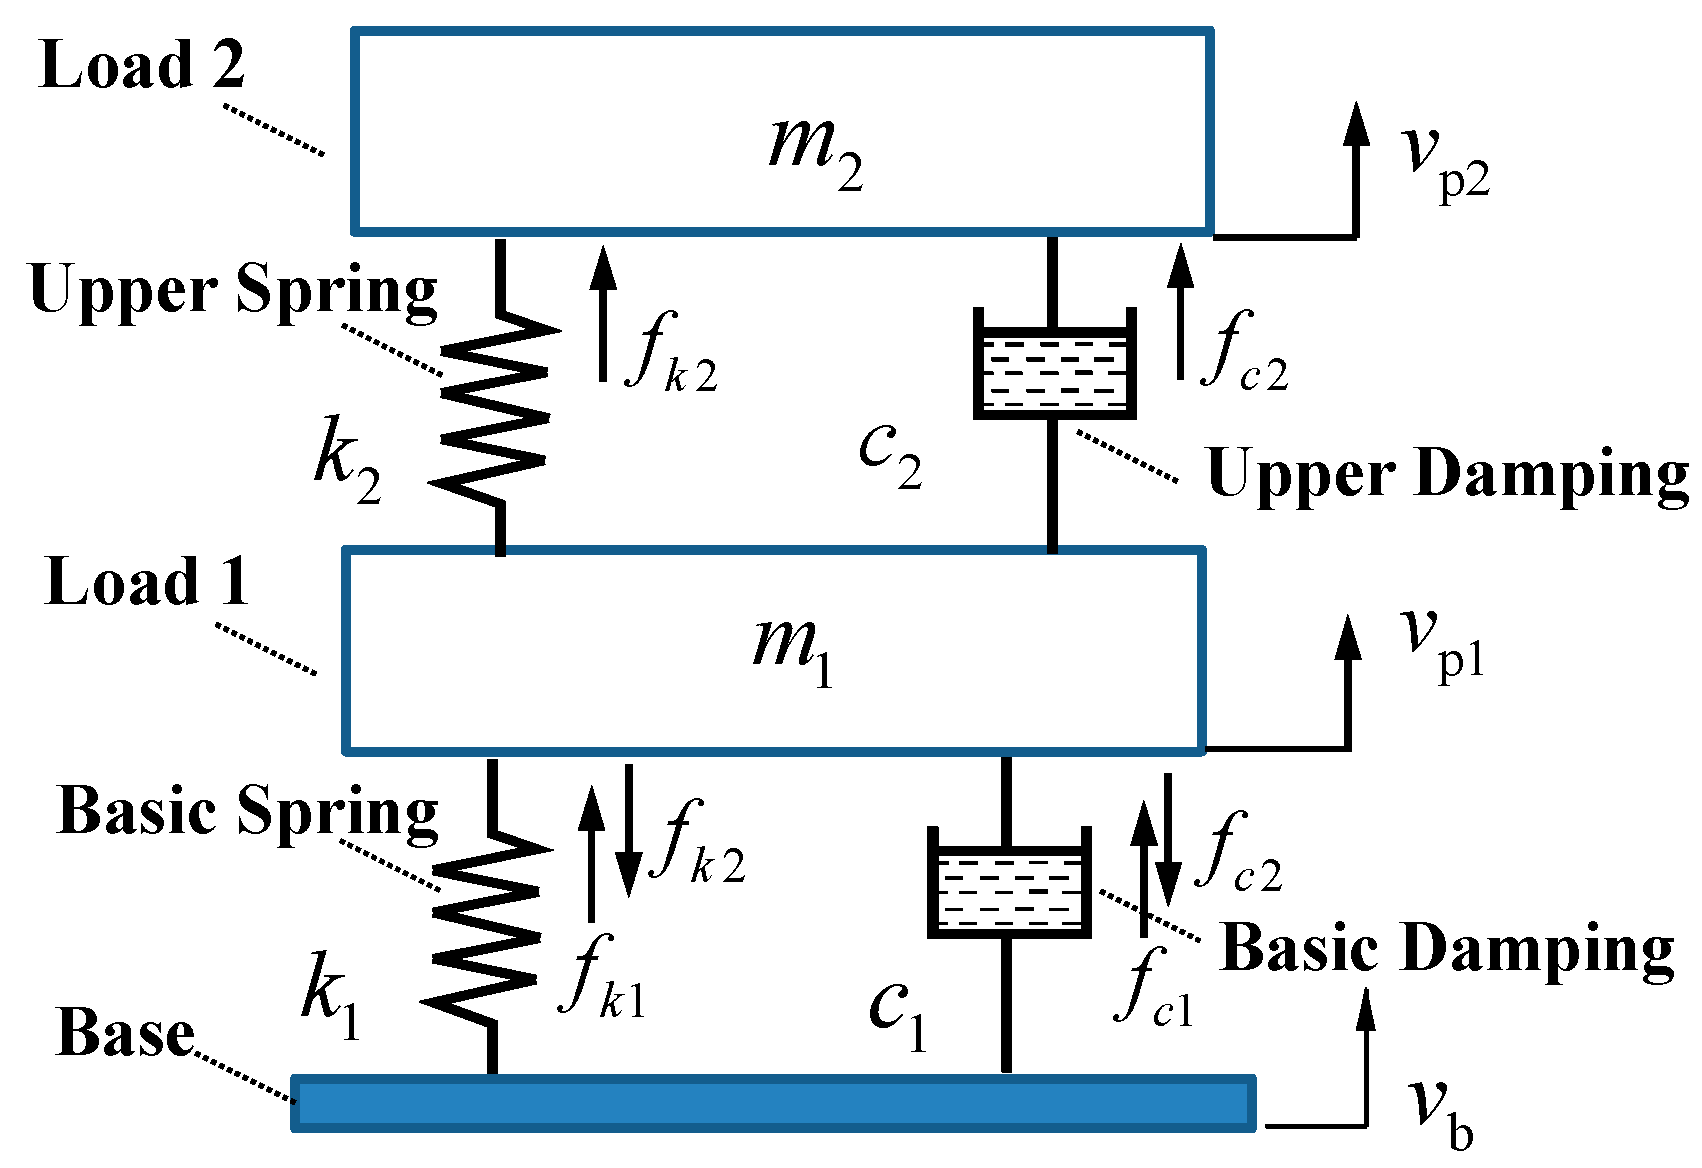
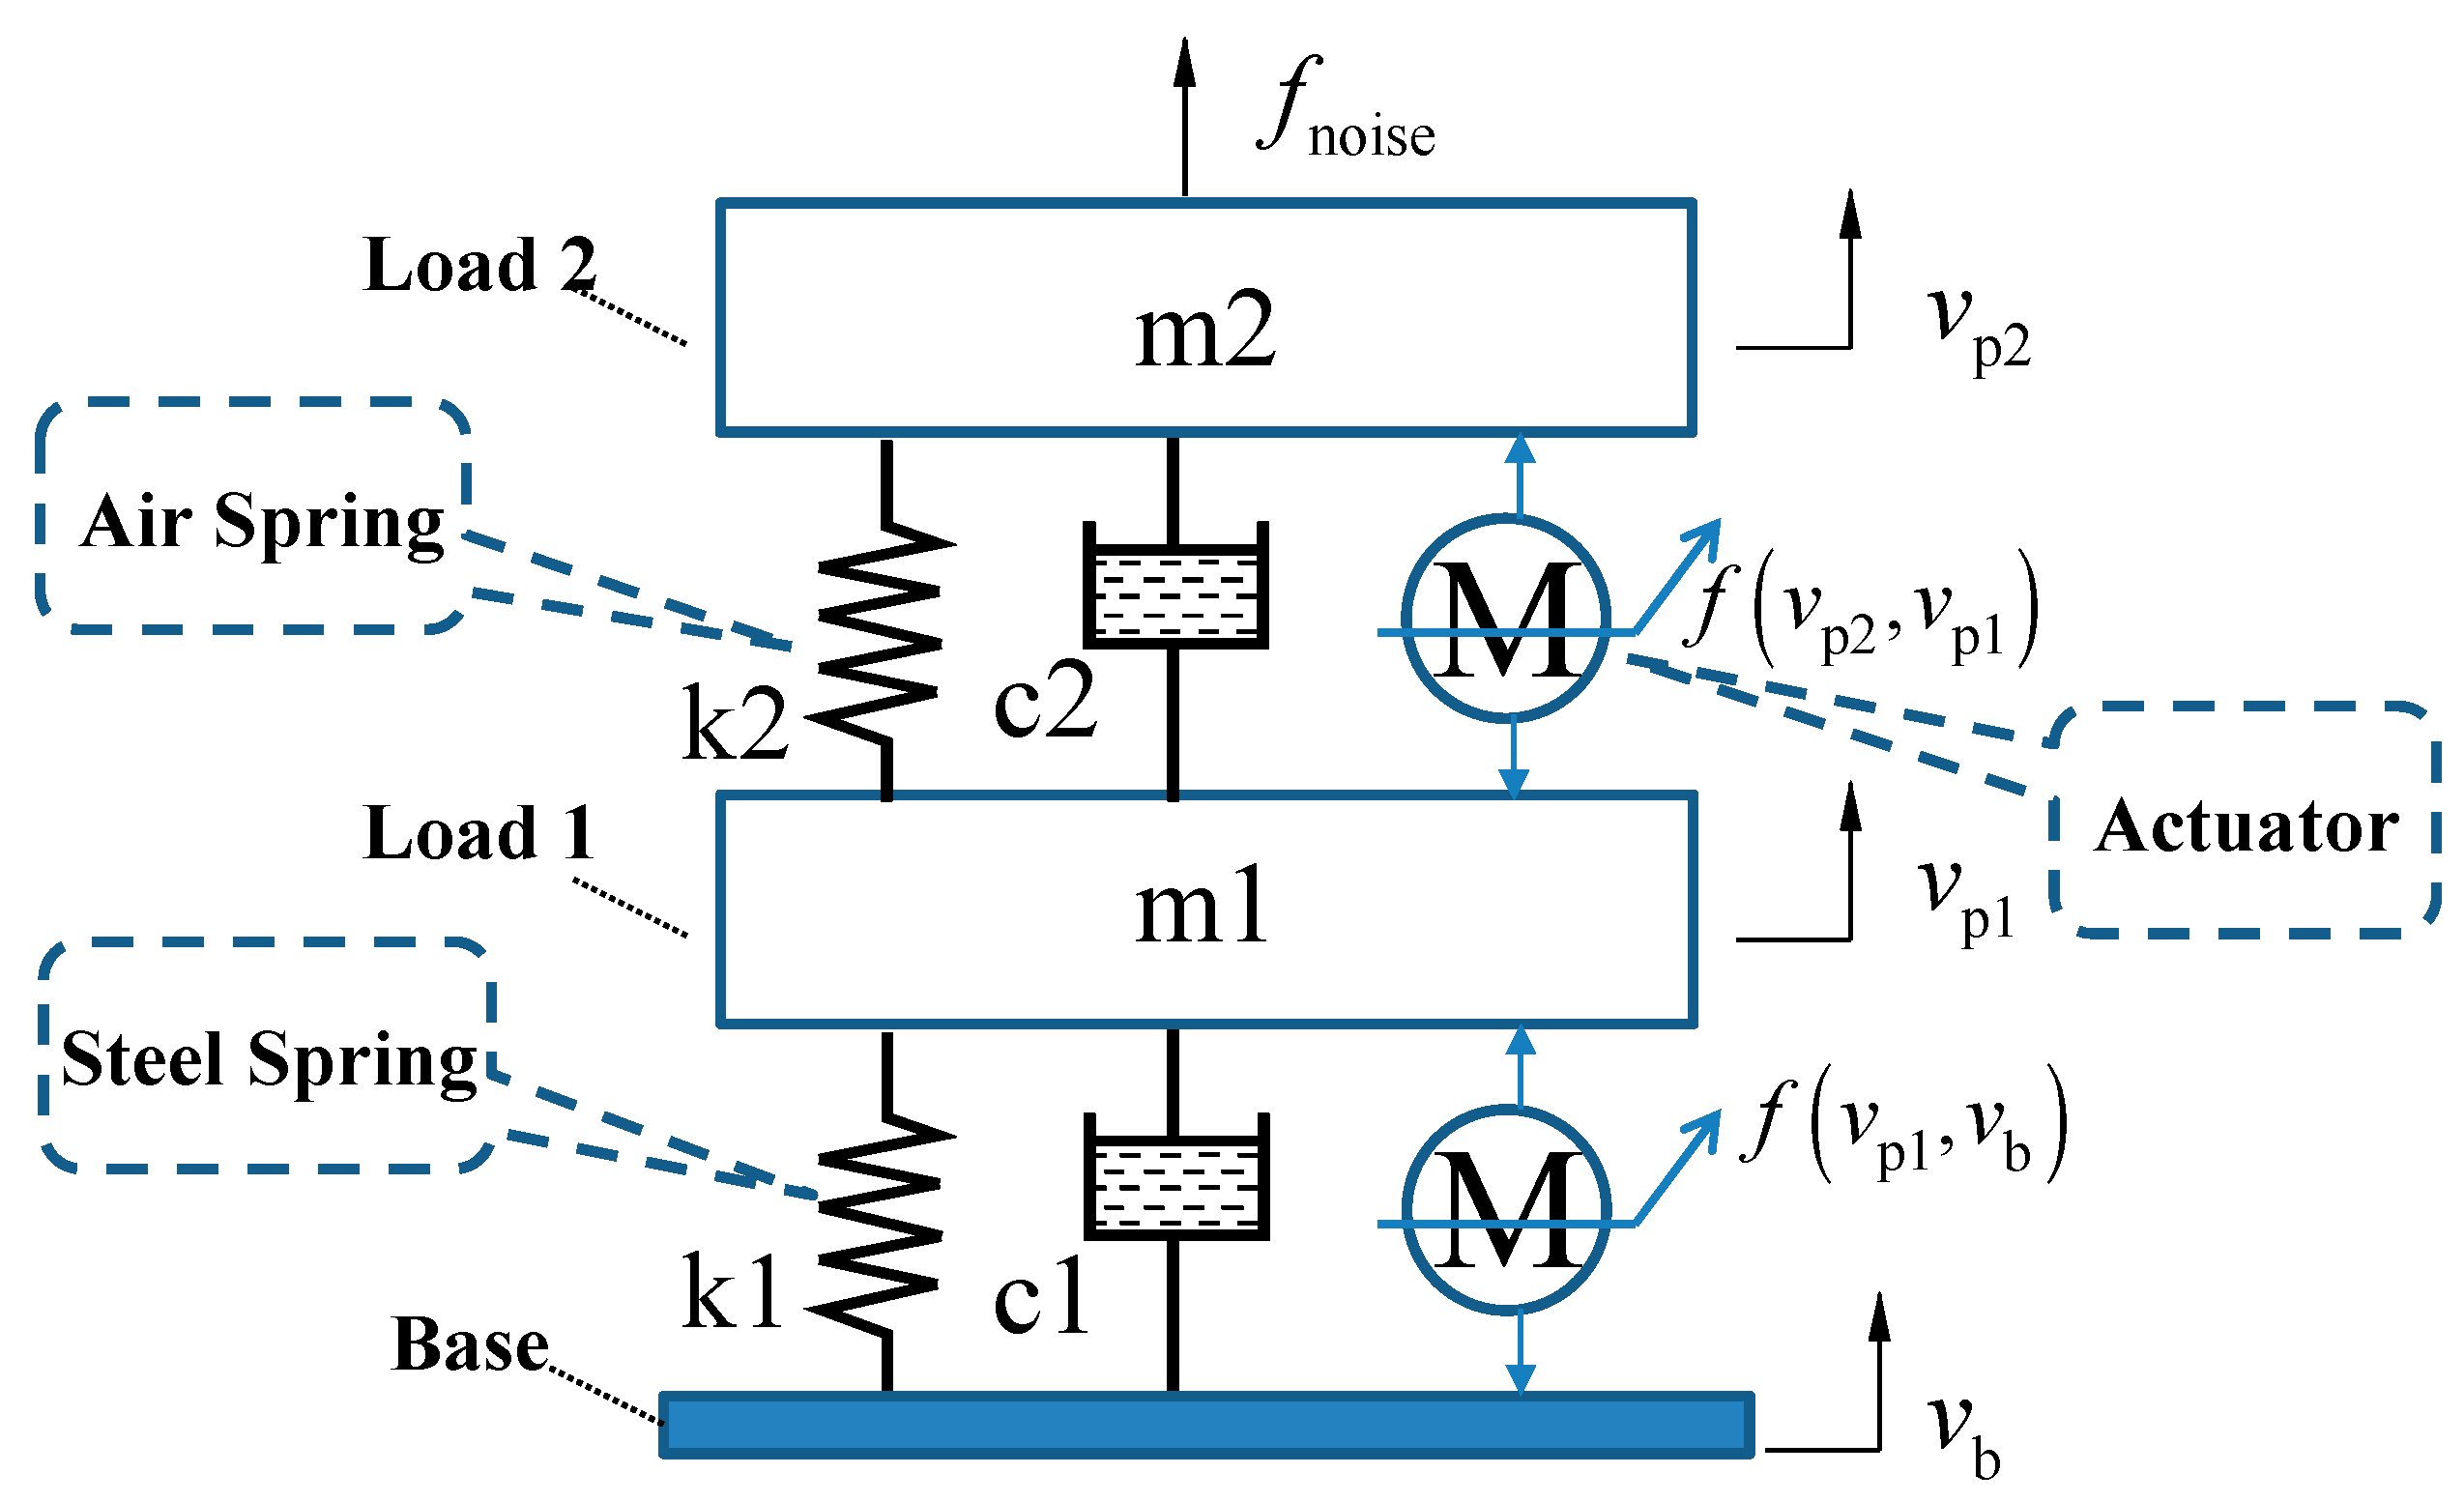
2.1. Analysis of the Vibration Propagation Characteristics of the DCSMS

A diagrammatic sketch of the DCSMS is shown in Figure 2, where v b , v p 1 , and v p 2 represent the absolute velocities of the ground stage, first stage, and second stage, respectively. Neglecting the influence of gravity and the relative equilibrium force, the first-stage load ( m 1 ) is subject to the following four forces: the basic elastic force ( f k 1 ), the basic damping force ( f c 1 ), the upper elastic force ( f k 2 ), and the upper damping force ( f c 2 ). In contrast, the second-stage load ( m 2 ) is influenced solely by f k 2 and f c 2 .
In accordance with the established definition, f k 2 and f c 2 satisfy the following equations:
f k 2 s = k 2 s v p 1 s v p 2 s
f c 2 s = c 2 v p 1 s v p 2 s
Here, s represents the Laplace operator. Then, the transfer function between v p 2 and v p 1 in the equilibrium position can be derived as follows:
v p 2 s v p 1 s = c 2 s + k 2 m 2 s 2 + c 2 s + k 2
Meanwhile, the velocity transfer function of the DCSMS can be expressed as follows:
v p 2 s v b s = v p 2 s v p 1 s v p 1 s v b s = c 2 + k 2 / s c 1 + k 1 / s m 2 s + c 2 + k 2 / s m 1 s + c 1 + k 1 / s + m 2 s c 2 + k 2 / s
A comparison of Equations (3) and (4) shows that the vibration transfer function of the DCSMS cannot be obtained by multiplying the parameters of the single-layer spring- mass system (SLSMS) separately. The additional term m 2 s c 2 + k 2 / s in the denominator of Equation (4) alters the eigenvalue distribution of the DCSMS, thereby affecting its inherent modes.

2.2. DCSMS Stability Analysis

The stability of the system is contingent upon its inherent characteristics and is independent of external conditions. Thus, following the transformation, the characteristic equation of the DCSMS can be rewritten as follows:
F 2 ( s ) = m 2 m 1 s 4 + ( c 1 m 2 + c 2 m 2 + c 2 m 1 ) s 3 + ( m 2 k 1 + m 2 k 2 + c 2 c 1 + k 2 m 1 ) s 2 + ( c 2 k 1 + k 2 c 1 ) s + k 2 k 1
Assuming that the term coefficients of Equation (5) are A 0 , A 1 , A 2 , A 3 , and A 4 in sequence, then, according to the Routh–Hurwitz stability criterion, in addition to all the coefficients of the characteristic equation being positive, the following inequality still exists:
( A 1 A 2 A 0 A 3 ) A 3 A 1 2 A 4 = c 1 c 2 m 2 2 k 1 2 + c 1 c 2 m 1 2 k 2 2 2 c 1 c 2 m 1 m 2 k 2 k 1 + c 2 2 m 2 2 k 1 2 + c 1 m 2 2 k 2 + c 2 m 2 2 k 2 + 2 c 2 m 1 m 2 k 2 k 2 c 1 + c 1 2 m 2 c 2 + c 1 c 2 2 m 2 + c 1 c 2 2 m 1 c 2 k 1 + k 2 c 1 c 2 2 m 2 2 k 1 2 + c 1 m 2 2 k 2 + c 2 m 2 2 k 2 + 2 c 2 m 1 m 2 k 2 k 2 c 1 + c 1 2 m 2 c 2 + c 1 c 2 2 m 2 + c 1 c 2 2 m 1 c 2 k 1 + k 2 c 1 > 0
Therefore, the requisite and sufficient condition for the stability of the DCSMS has been met.

2.3. Influence of Parameters on DCSMS Vibration Isolation Performance

The DCSMS was employed as a representative example to investigate the influence of the parameters on the eigenvalue distribution, frequency response characteristics (FRCs), and power spectral density (PSD) to gain a deeper understanding of the impact of the parameters on the intrinsic properties of a multiple-cascade spring-mass system (MCSMS).
(1)
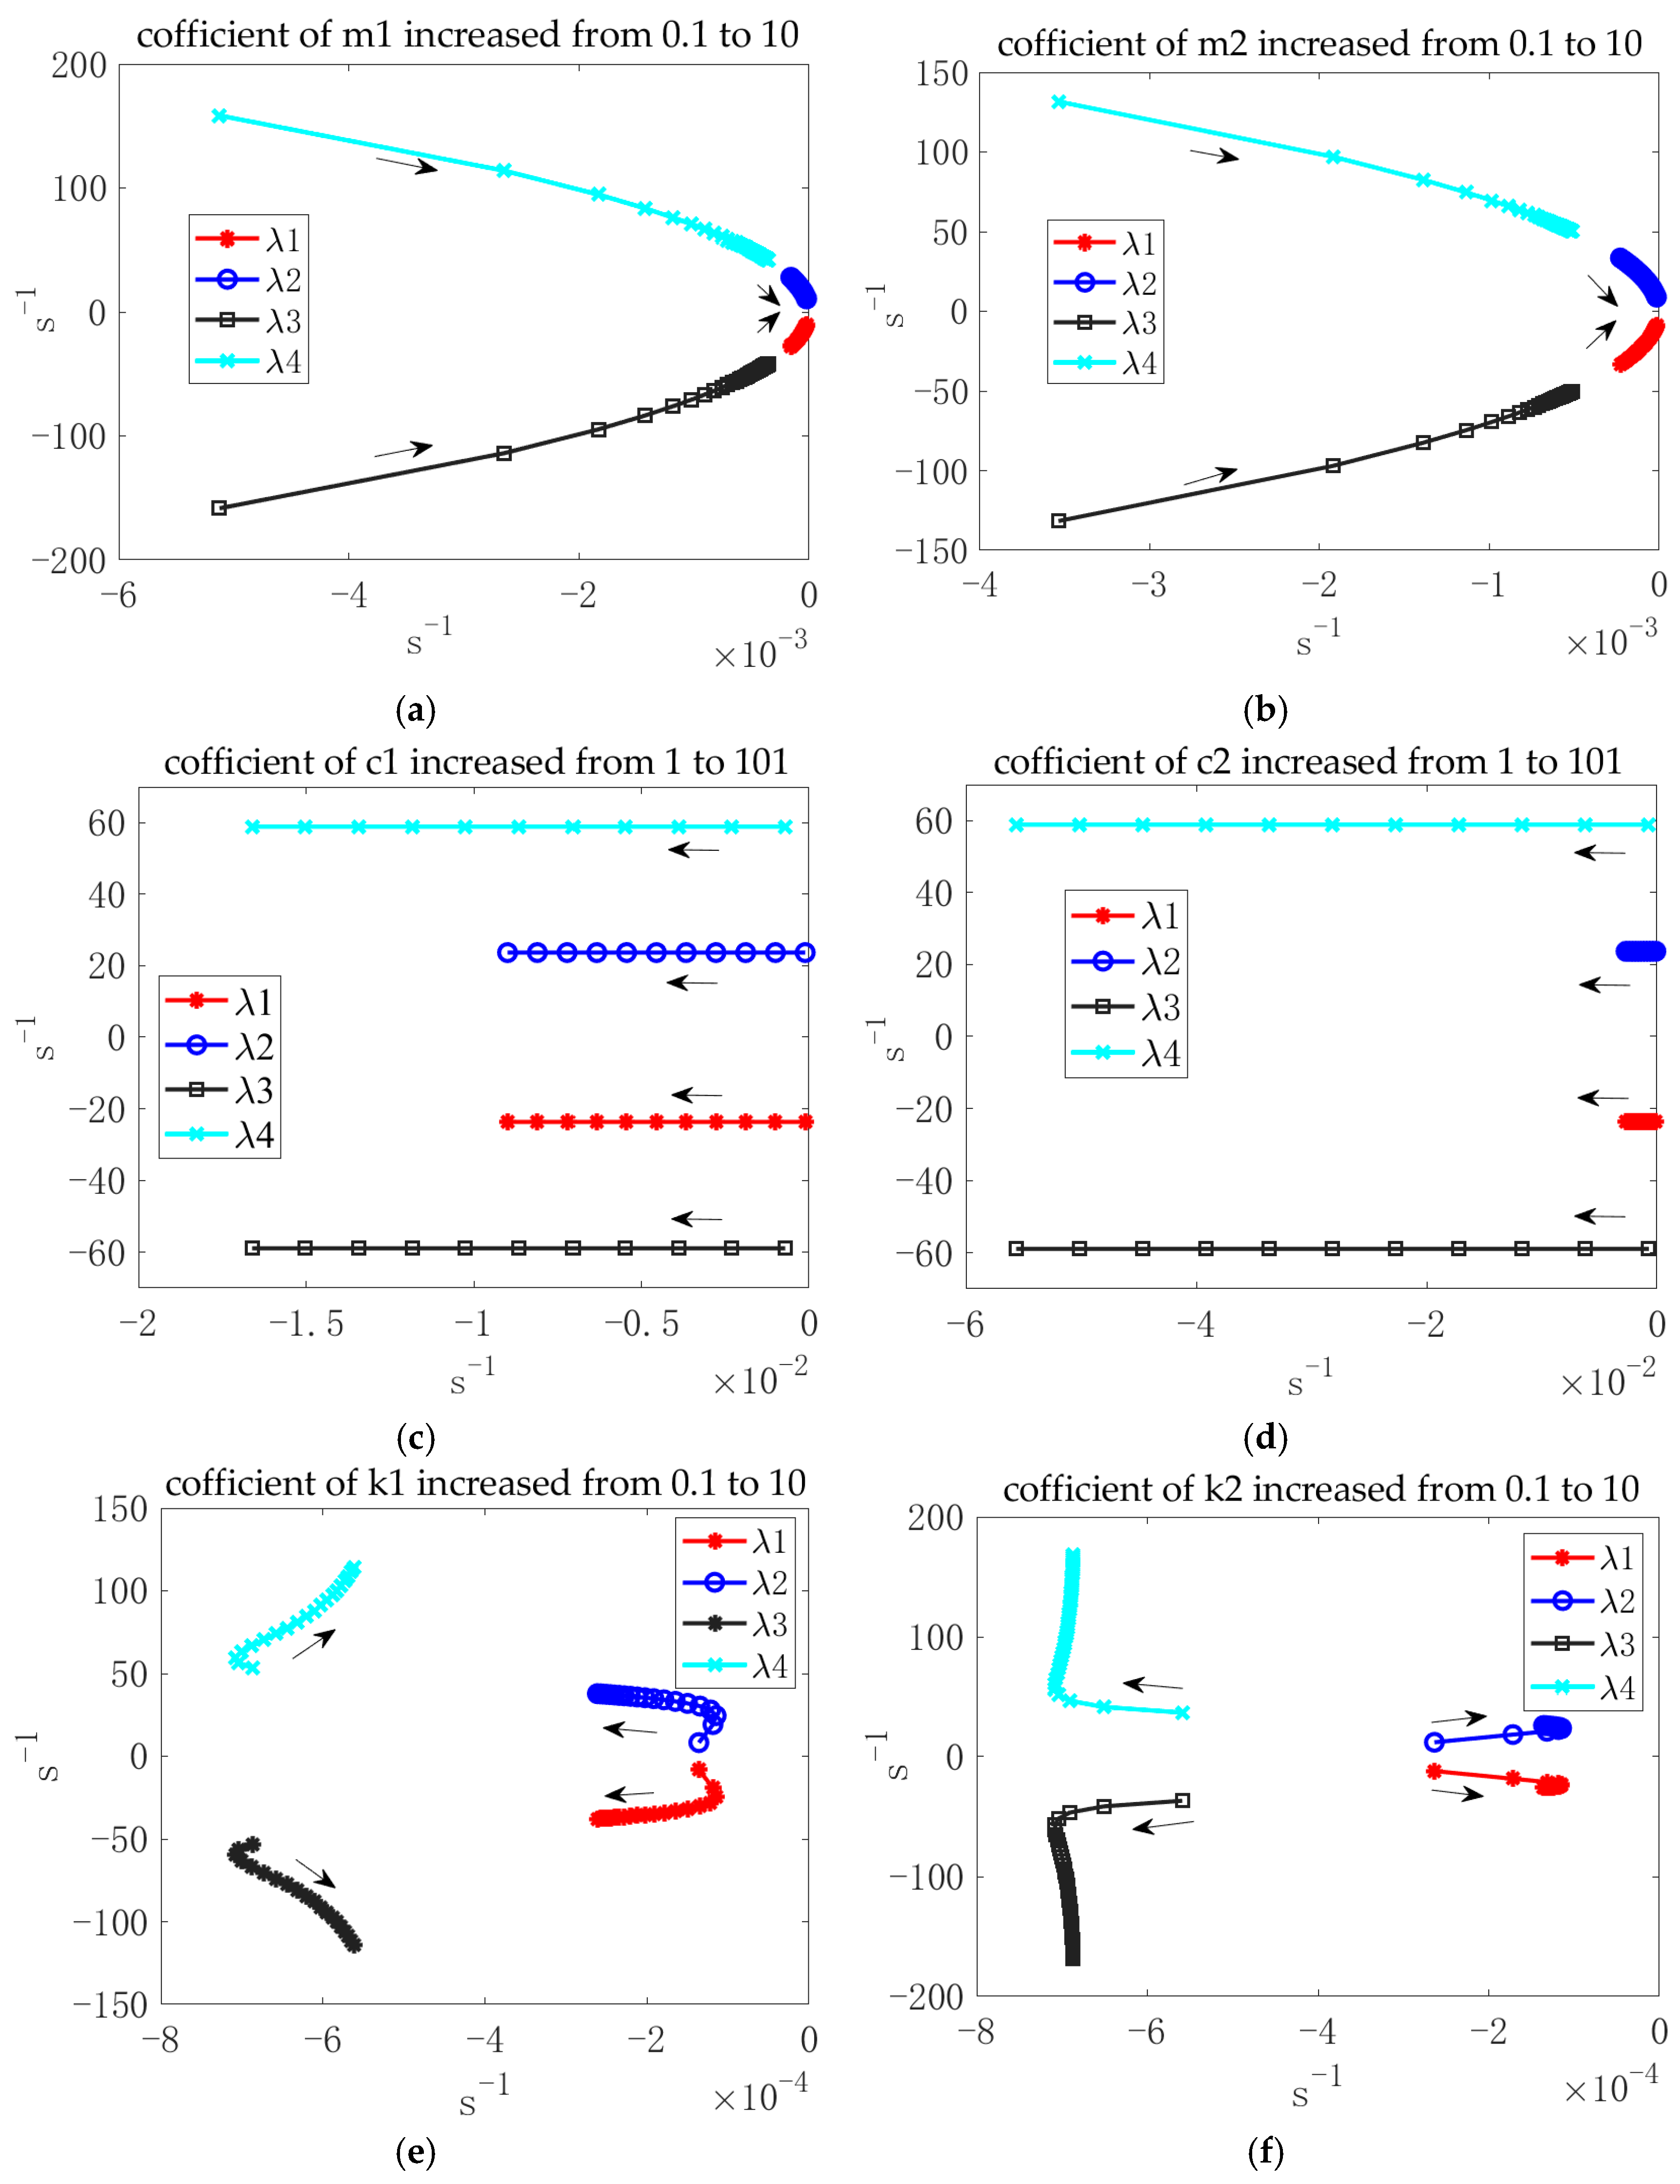
Parametric Influence Analysis of the Characteristic Roots of DCSMS
To facilitate both simulation and experimental verification, the square platform, which is supported by four identical springs, was used as the basic research unit. Consequently, the DCSMS is composed of two cascade units.
The preliminary parameters of the DCSMS are illustrated in Table 1. The symbols k 1 , k 2 and c 1 , c 2 represent the stiffness and damping of the springs at each stage, respectively. Before cascading, the natural resonance frequency of each unit is as follows:
f 1 = 1 2 π k 1 m 1 = 1 2 π 300 × 4 × 1000 988.8 = 5.544   Hz f 2 = 1 2 π k 2 m 2 = 1 2 π 300 × 4 × 1000 748.8 = 6.37   Hz
The eigenvalues of the DCSMS can be obtained through the root function of MATLAB upon the synthesis of the aforementioned two units into a DCSMS, as follows:
λ 1 = 0.0729 + 3.7677 i λ 2 = 0.0729 3.7677 i λ 3 = 0.4509 + 9.3633 i λ 4 = 0.4509 9.3633 i
Consequently, the natural frequencies of the DCSMS are as follows:
f 1 * = 3.7677   Hz f 2 * = 9.3633   Hz
Figure 3 depicts the eigenvalue distribution of the DCSMS, obtained through a MATLAB simulation under the influence of varying parameters. The variation range for the multiplication coefficient was set to [0.1, 10] or [1, 101], considering the system’s practical feasibility. Figure 3a–f illustrate the distributions of the characteristic roots λ 1 , λ 2 , λ 3 , and λ 4 related to the variation in m 1 , m 2 , c 1 , c 2 , and k 1 , k 2 , and the arrows indicate the direction of the parameter changes.
As the product factor of m 1 increases by an equal step of 0.1, the vibration attenuation ability, as determined by the real part of the characteristic roots, gradually weakens, while the natural oscillation frequency of the system, as determined by the imaginary part, decreases (Figure 3a). A comparison of Figure 3a,b shows that the impact of m 2 on the root locus of the DCSMS is similar to that of m 1 .
Figure 3c depicts the eigenvalue diagram of the DCSMS as the multiplier factor of c 1 is increased from 1 to 101 with a step size of 2.0. All characteristic roots exhibit a uniform movement in the negative direction along the coordinate axis, as indicated by the changes in c 1 , which suggests that c 1 plays a pivotal role in determining the vibration attenuation rate of the system, without exerting any influence on its natural resonance frequency. The contrast between Figure 3c,d indicates that the impact of c 1 on the vibration-damping rate of λ 1 and λ 2 is greater than that of c 2 , whereas c 2 is more effective at influencing λ 3 and λ 4 . We postulate that c 1 exerts a direct influence on the vibration decay rate at the low resonance frequency, while c 2 is more pertinent to the higher resonance frequency.
In the absence of constraints on the extension and compression of springs, the distribution of λ 1 , λ 2 , λ 3 , and λ 4 , as illustrated in Figure 3e, can be partitioned into two processes when the multiplier factor of k 1 varies from its initial value of 0.1 to 10, with a step size of 0.1. The initial range is [0.1, 1], while the subsequent range is [1,10]. Although the absolute values of the imaginary part of λ 1 , λ 2 , λ 3 , and λ 4 all increase gradually throughout the entire process, the variation rates are different. Furthermore, the absolute values of the real part of λ 1 and λ 2 gradually decrease in process (1) and increase in process (2), while the λ 3 and λ 4 trends are the opposite. When the multiplier factor is equal to 1, the absolute values of the real part of λ 1 and λ 2 reach a minimum, while those of λ 3 and λ 4 reach a maximum. Overall, proportionally increasing k 1 will increase the inherent frequencies of the DCSMS, while the trend of the vibration-damping rate is independent of the value of the natural frequencies. Figure 3f indicates that the variation process of eigenvalues is influenced by k 2 , which exhibits a similar trend to that of k 1 when they have the same initial values and multiplier factor. However, distinct curves are observed due to the differing variation rates.
The analysis presented above is based on theoretical conditions. In practical engineering applications, the parameter selection is subject to constraints, such as the limits of spring extension and compression. Therefore, it is necessary to comprehensively optimize the parameters according to the actual application requirements.
(2)
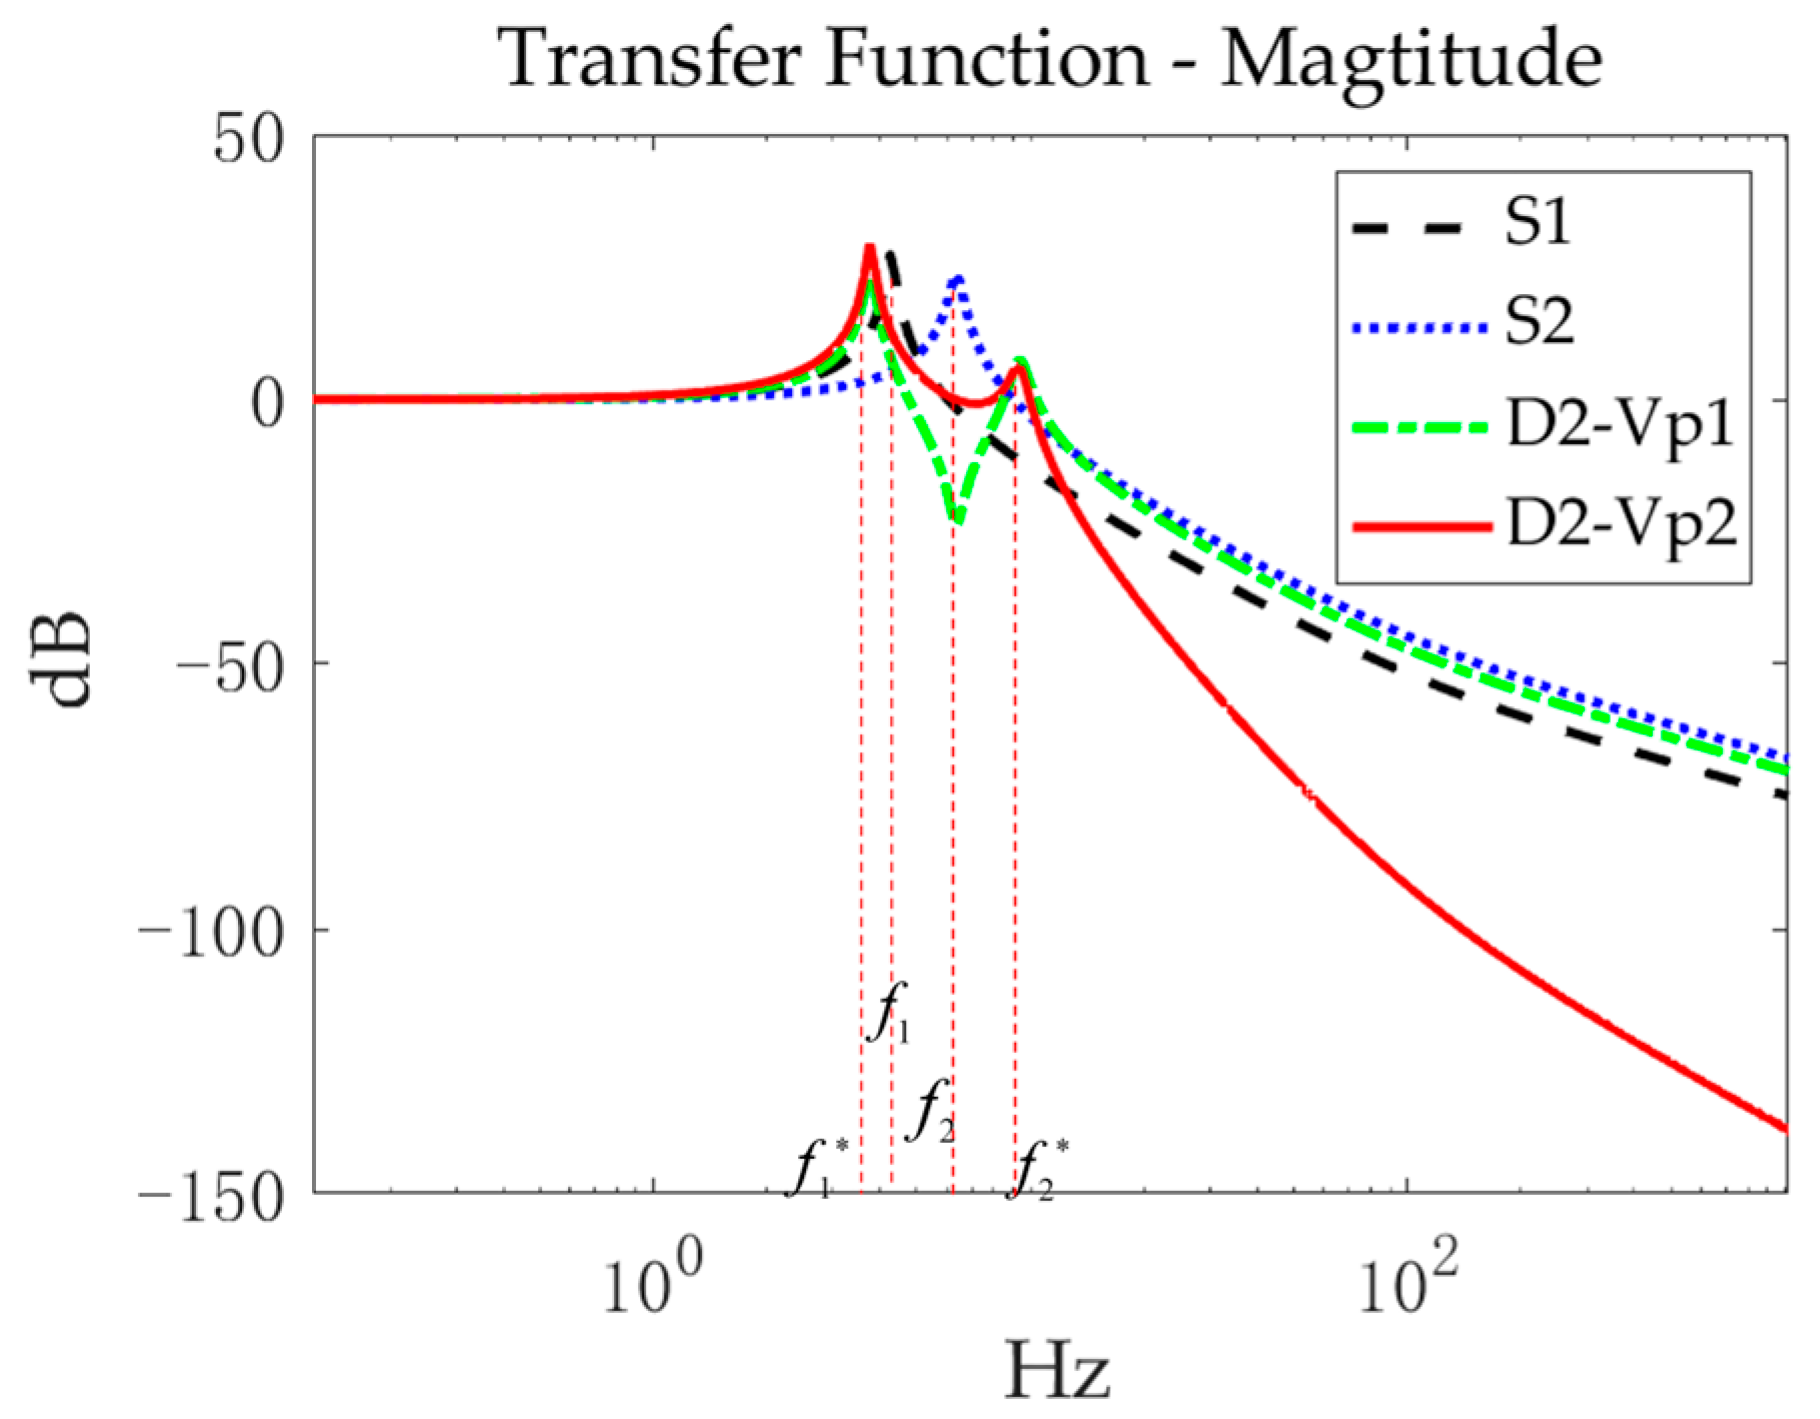
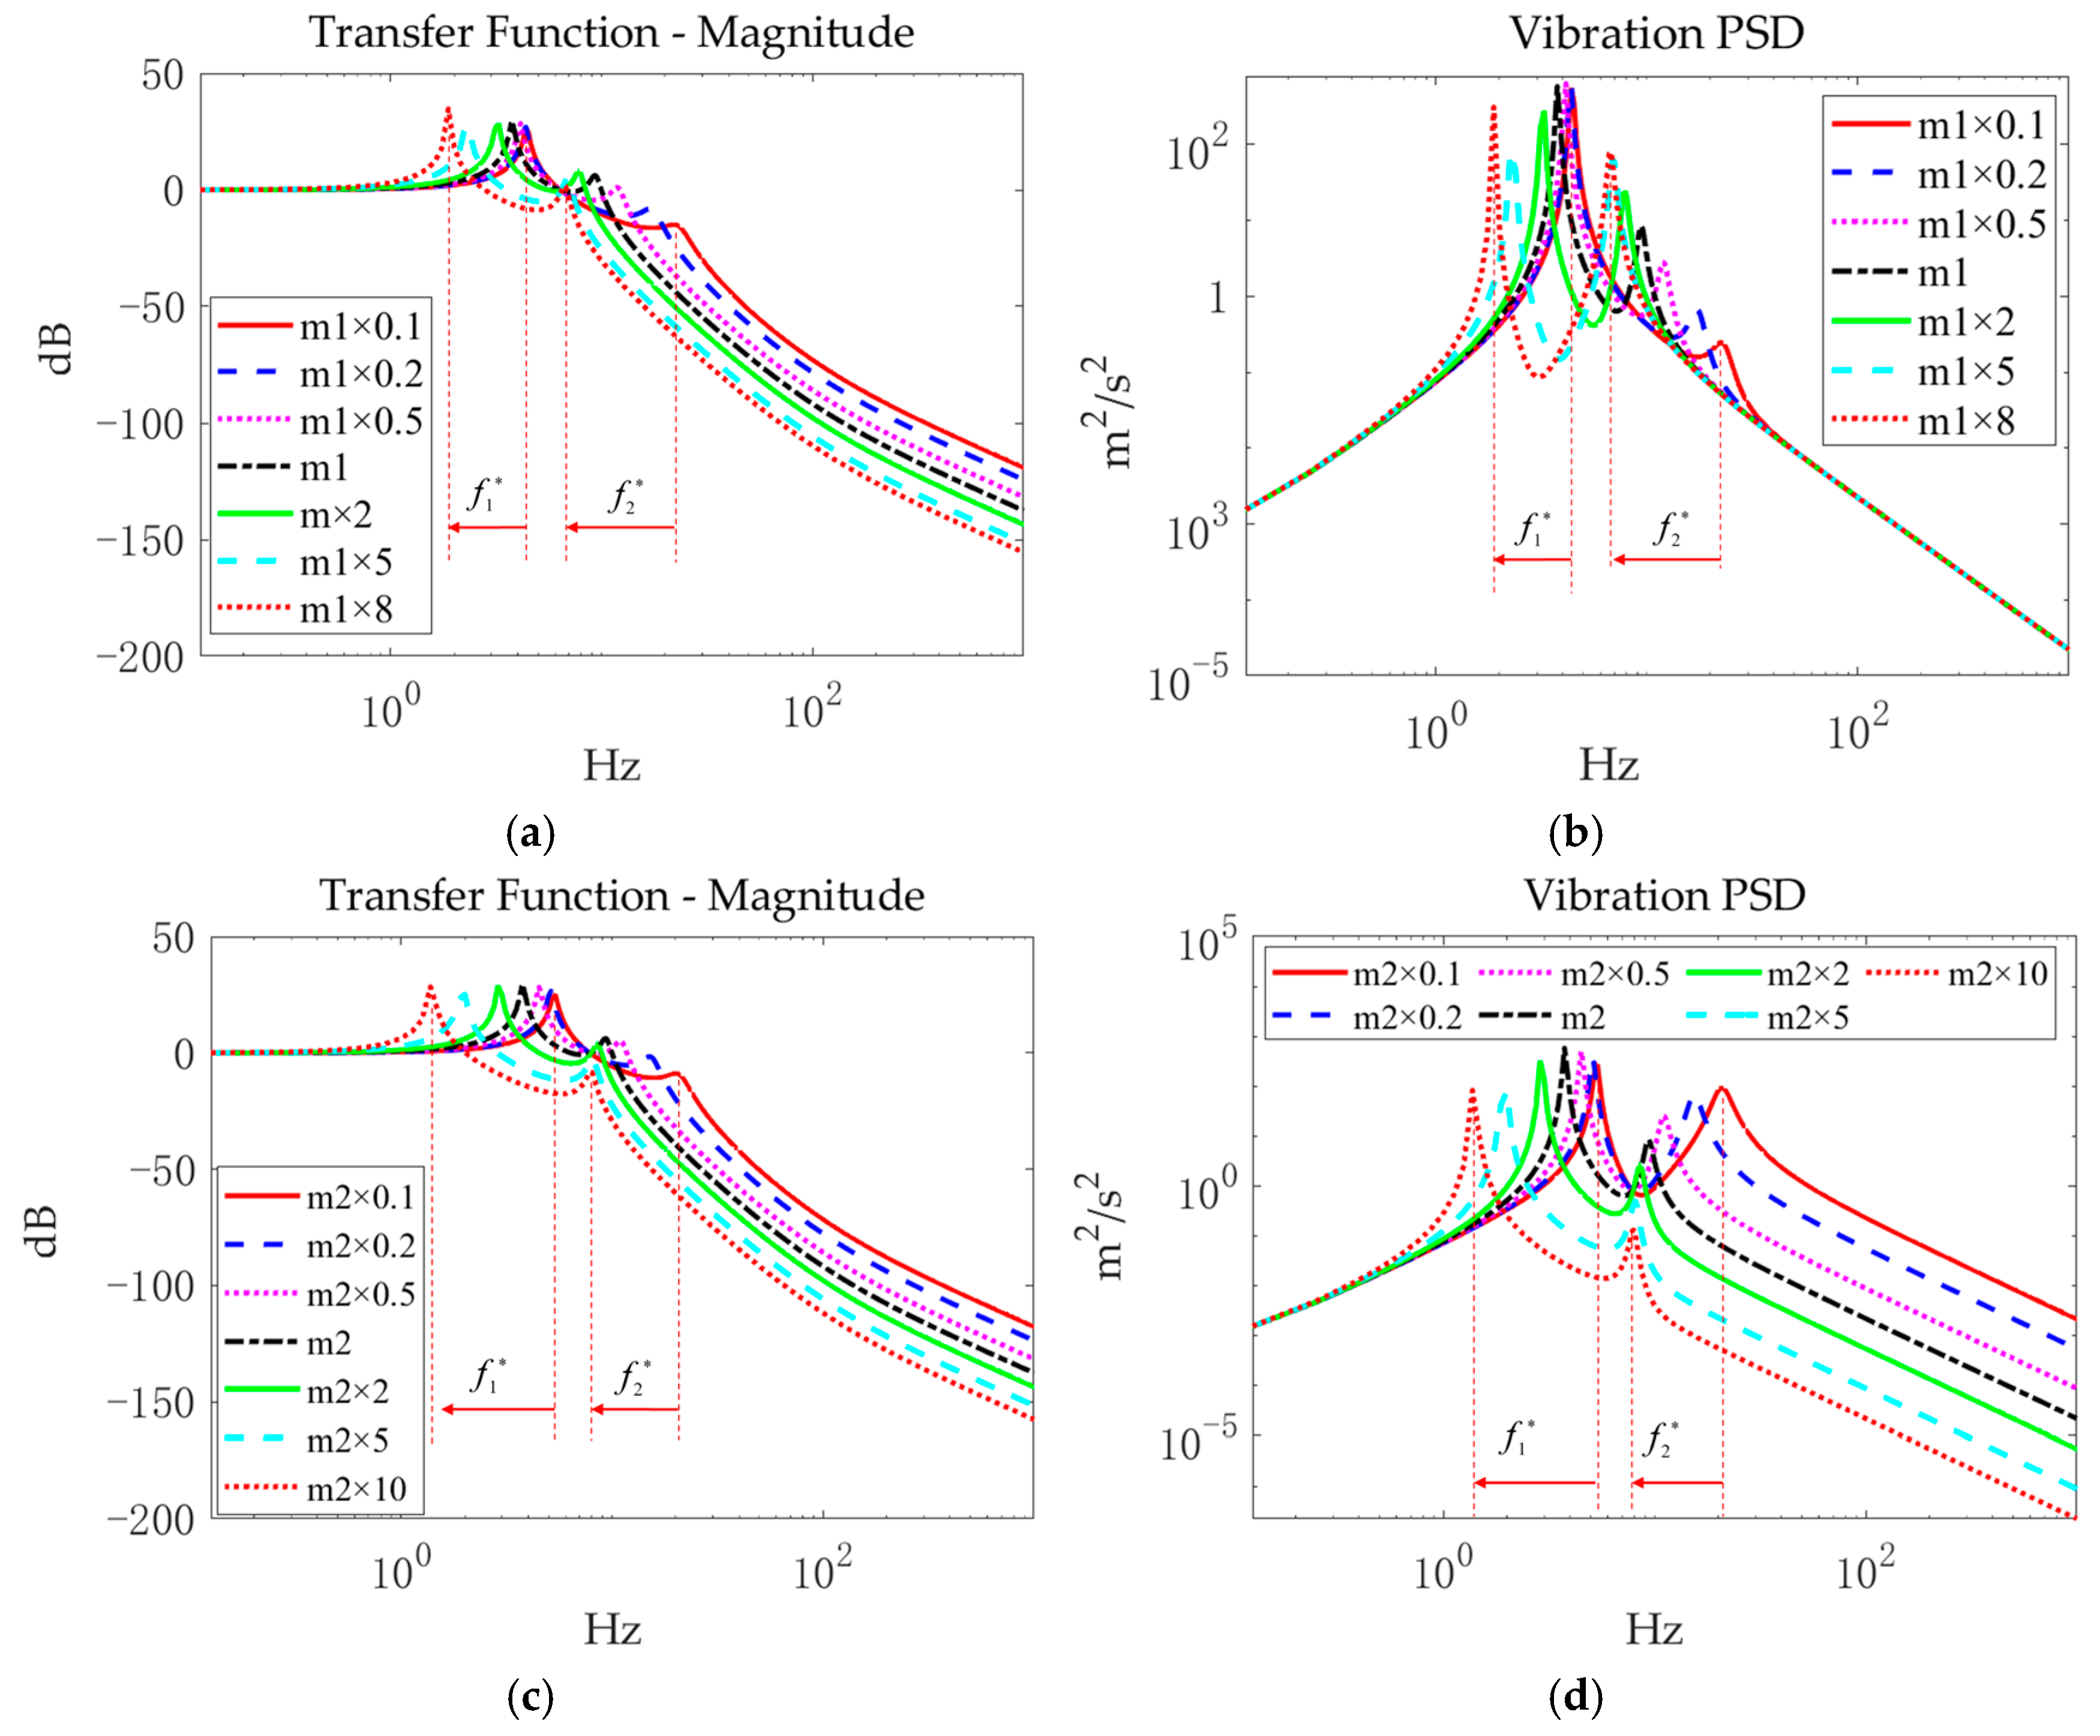
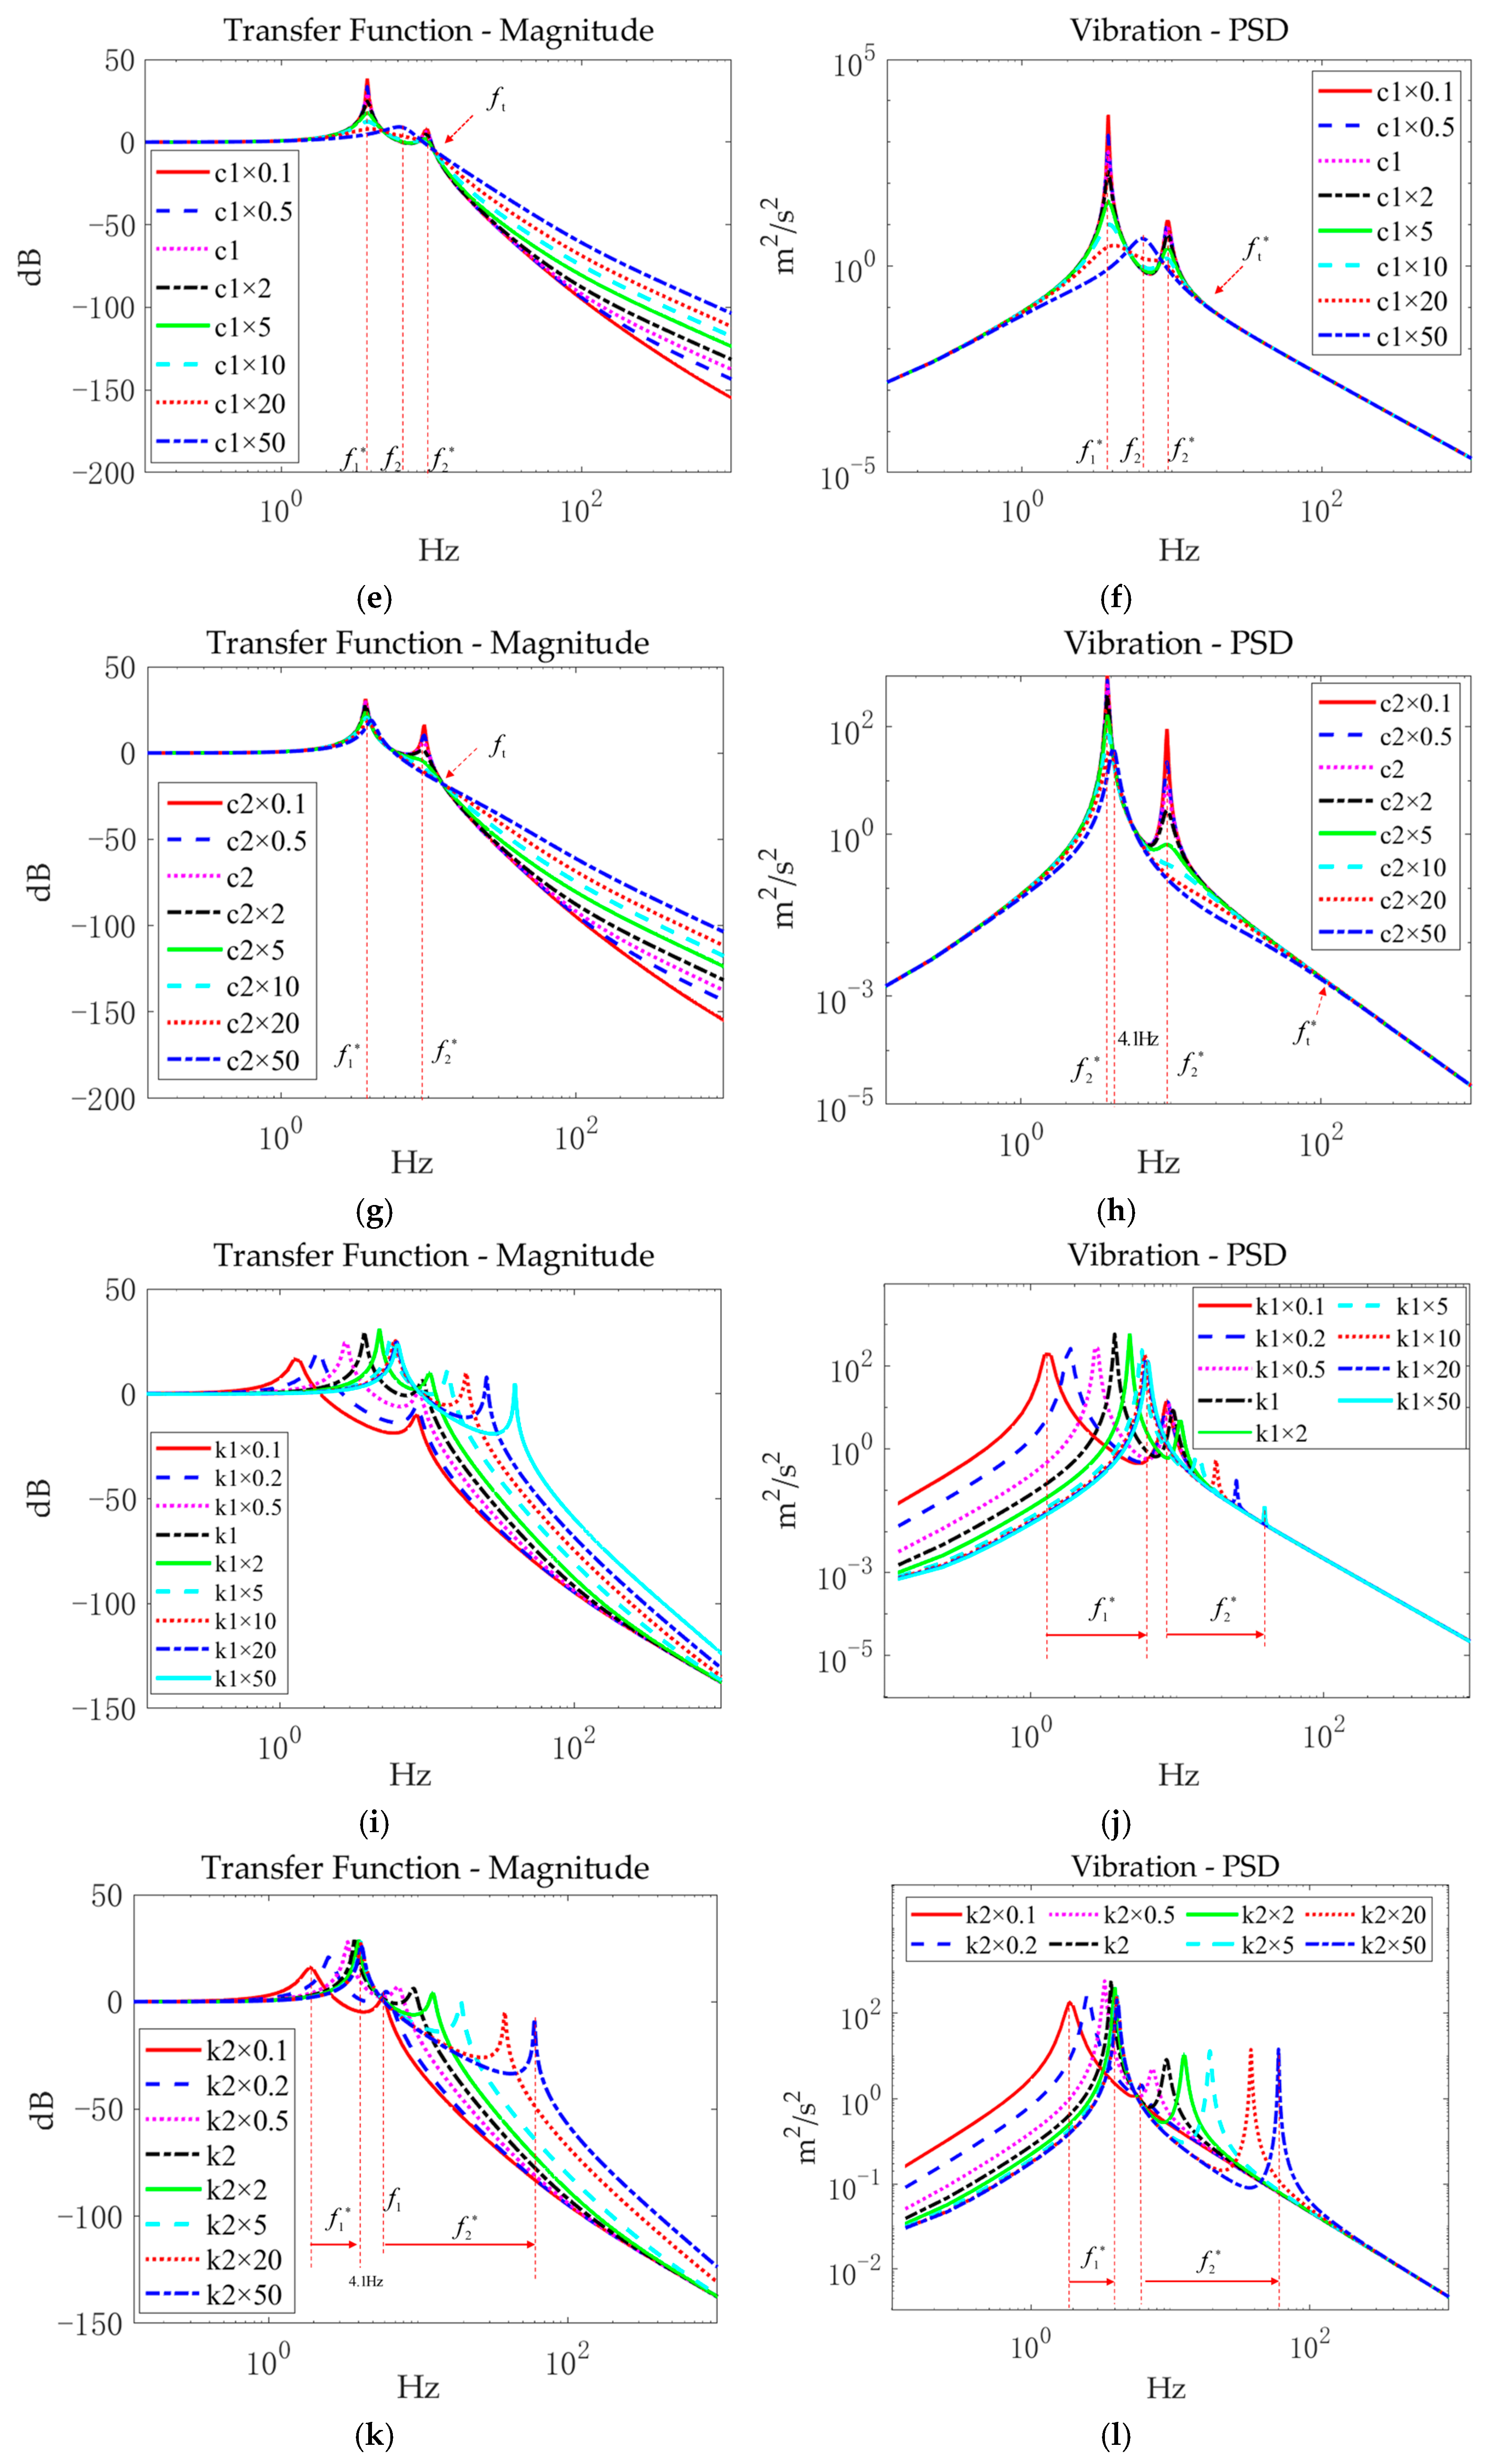
Frequency Response Characteristics and Power Spectral Density Analysis of DCSMS
A simulation model of the system (shown in Figure 4) was constructed in ADAMS to further analyze and study the performance of the DCSMS and validate the correctness of the theoretical calculations. The white noise signal generated by the SPLINE function was applied to the base as the foundation excitation, and the initial simulation parameters were set according to Table 1.
The comparison of the eigenvalues exported by ADAMS (Table 2) with the calculated values in Equation (9) reveals that the results obtained from the simulation model are consistent with the theoretical calculations, thereby indicating the reliability of the model established via ADAMS.
The separate velocity transmissibility curves of the SLSMS are represented by the black and blue lines shown in Figure 5, with the corresponding resonance frequencies f 1 and f 2 , respectively. Following cascading, the second-stage velocity transfer function curve (the red solid line) exhibits the same characteristic roots ( f 1 * and f 2 * ) as those of the first-stage velocity transmissibility (the green dot-dashed line). Furthermore, the numerical value of the red solid line is equal to the sum of the numerical values of the blue dotted and green dashed lines.
In Figure 5, the DCSMS exhibits superior vibration attenuation in the frequency range greater than the natural frequency point ( f 2 * ) compared to the SLSMS. However, due to the influence of the natural frequency ( f 2 ) corresponding to the blue dotted line, the vibration attenuation rate of the red curve is inferior to that of the green curve in the interval where the red and green lines intersect, suggesting that although the high-frequency vibration attenuation rate was markedly enhanced following cascading, the low-frequency vibration-damping rate was diminished.
The FRC and PSD simulation curves of the ADAMS model of the DCSMS under distinct parameter-tuning scenarios are presented in Figure 6. One unit of velocity white noise excitation is employed to simulate ground vibrations, while 1000 units of force white noise excitation are applied to simulate the direct disturbance of the loads.
Figure 6a depicts the FRC curves between the second tabletop velocity ( v p 2 ) and the foundation velocity ( v b ), whereas Figure 6b illustrates the PSD curves of v p 2 when the first-stage load mass ( m 1 ) was varied. As m 1 increased, the natural frequencies f 1 * and f 2 * of the DCSMS decreased. The energy peaks are concentrated at f 1 * and f 2 * , which is consistent with Equation (9). f 1 * begins at 4.5 Hz, with f 2 * gradually approaching 6.4 Hz, indicating f 1 * < 4.5 Hz and f 2 * > f 2 . However, when m 1 increases to nine times its initial value, the simulated system encounters an overturning issue due to spring compression constraints.
Variation in the second-stage load mass ( m 2 ) produced FRC and PSD curves in Figure 6c,d that are similar to those shown in Figure 6a,b. The difference between them is that f 1 * starts from the initial value ( f 1 ) and continues to decrease with f 2 * as m 2 increases, and finally, f 2 * gradually approaches the calculated value of 7.833 Hz. According to the comparison of Figure 6b,d, m 2 determines the PSD of v p 2 in the high-frequency range, in contrast to m 1 . f 1 * < f 1 and f 2 * > 7.833 Hz throughout the entire m 2 variation process. When m 2 increases to 10 times its initial value, the simulated system encounters an overturning problem.
Figure 6e,f illustrate the FRC and PSD curves of v p 2 as the multiplication factor of the first-stage spring damping ( c 1 ) was varied from 0.1 to 50. The transition frequency indicated by the red arrow in Figure 6e is designated as f t . Consequently, the curves must be analyzed in different scenarios: (1) In the case wherein the multiplication factor is less than 10, although the DCSMS has two unchanged natural resonance frequencies ( f 1 * and f 2 * ) during the variation in c 1 , and the v p 2 amplitude decreases as c 1 increases. (2) When the multiplication factor is greater than 43, the system gradually transitions from having two inherent frequencies to having only one natural frequency, and its value approaches the second-stage resonance frequency point ( f 2 ). Furthermore, in the frequency domain around f 2 and above f t , the amplitude of v p 2 increases as MM increases. If a transition frequency ( f t * ) can be identified in the PSD curves of Figure 6f, then f t * > f t is satisfied. In the region above f t * , the PSD of v p 2 remains unchanged as c 1 varies. When the multiplication factor of c 1 is greater than 43, the distribution of the characteristic roots no longer appears in pairs.
A gradual change from 0.1 to 50 in the multiplication factor of the second-stage spring damping ( c 2 ) produced the same curves in Figure 6e,f as those shown in Figure 6g,h. In the range below f t , the amplitude of v p 2 gradually decreased as c 2 increased. Furthermore, there was a single natural resonance frequency of the DCSMS when the multiplication factor of c 2 was greater than 25. The value of the inherent frequency approaches 4.1 Hz, which is approximately f = 1 2 π k 1 m 1 + m 2 . However, in the domain higher than f t , although the damping performance deteriorates as c 2 increases, the PSD value does not change in the region greater than f t * .
Figure 6i,j illustrate the FRC and PSD curves of v p 2 as the multiplication factor of the first-stage spring stiffness ( k 1 ) was varied from 0.1 to 50. Through theoretical calculations, the initial value of the high-frequency resonance ( f 2 * ) shown in Figure 6i was estimated to be 8.43 Hz. Furthermore, a static balance error warning occurred in the simulation when the multiplication factor of k 1 was lower than 0.05. f 1 * and f 2 * gradually increased as the multiplication factor increased from 0.1. When the multiplication factor was greater than 50, f 1 * approached 5.37 Hz, which indicates that the low-frequency resonance frequency ( f 1 * ) of the DCSMS reached f 2 . According to the PSD curves in Figure 6j, although a new f 2 * was introduced to the DCSMS, the energy of the high-frequency region decreased as the multiplication factor of k 1 increased.
According to the results presented in Figure 6k,l, the inherent frequencies f 1 * and f 2 * gradually increase as the multiplication factor of the second-stage spring stiffness ( k 2 ) varies from 0.1. When the multiplication factor is less than 0.01, the frequency f 2 * approaches the natural resonance frequency ( f 1 ) of the single first-stage system. As the multiplication factor is greater than 50, the frequency f 1 * is approximately equal to the calculated frequency f = 1 2 π k 1 m 1 + m 2 , which is the natural frequency of the single first-stage system with the superposition of m 1 and m 2 . According to the PSD curves in Figure 6l, the introduction of high stiffness at the upper stage not only results in the generation of a novel vibration mode but also has the potential to enhance the propagation of high-frequency vibrations.

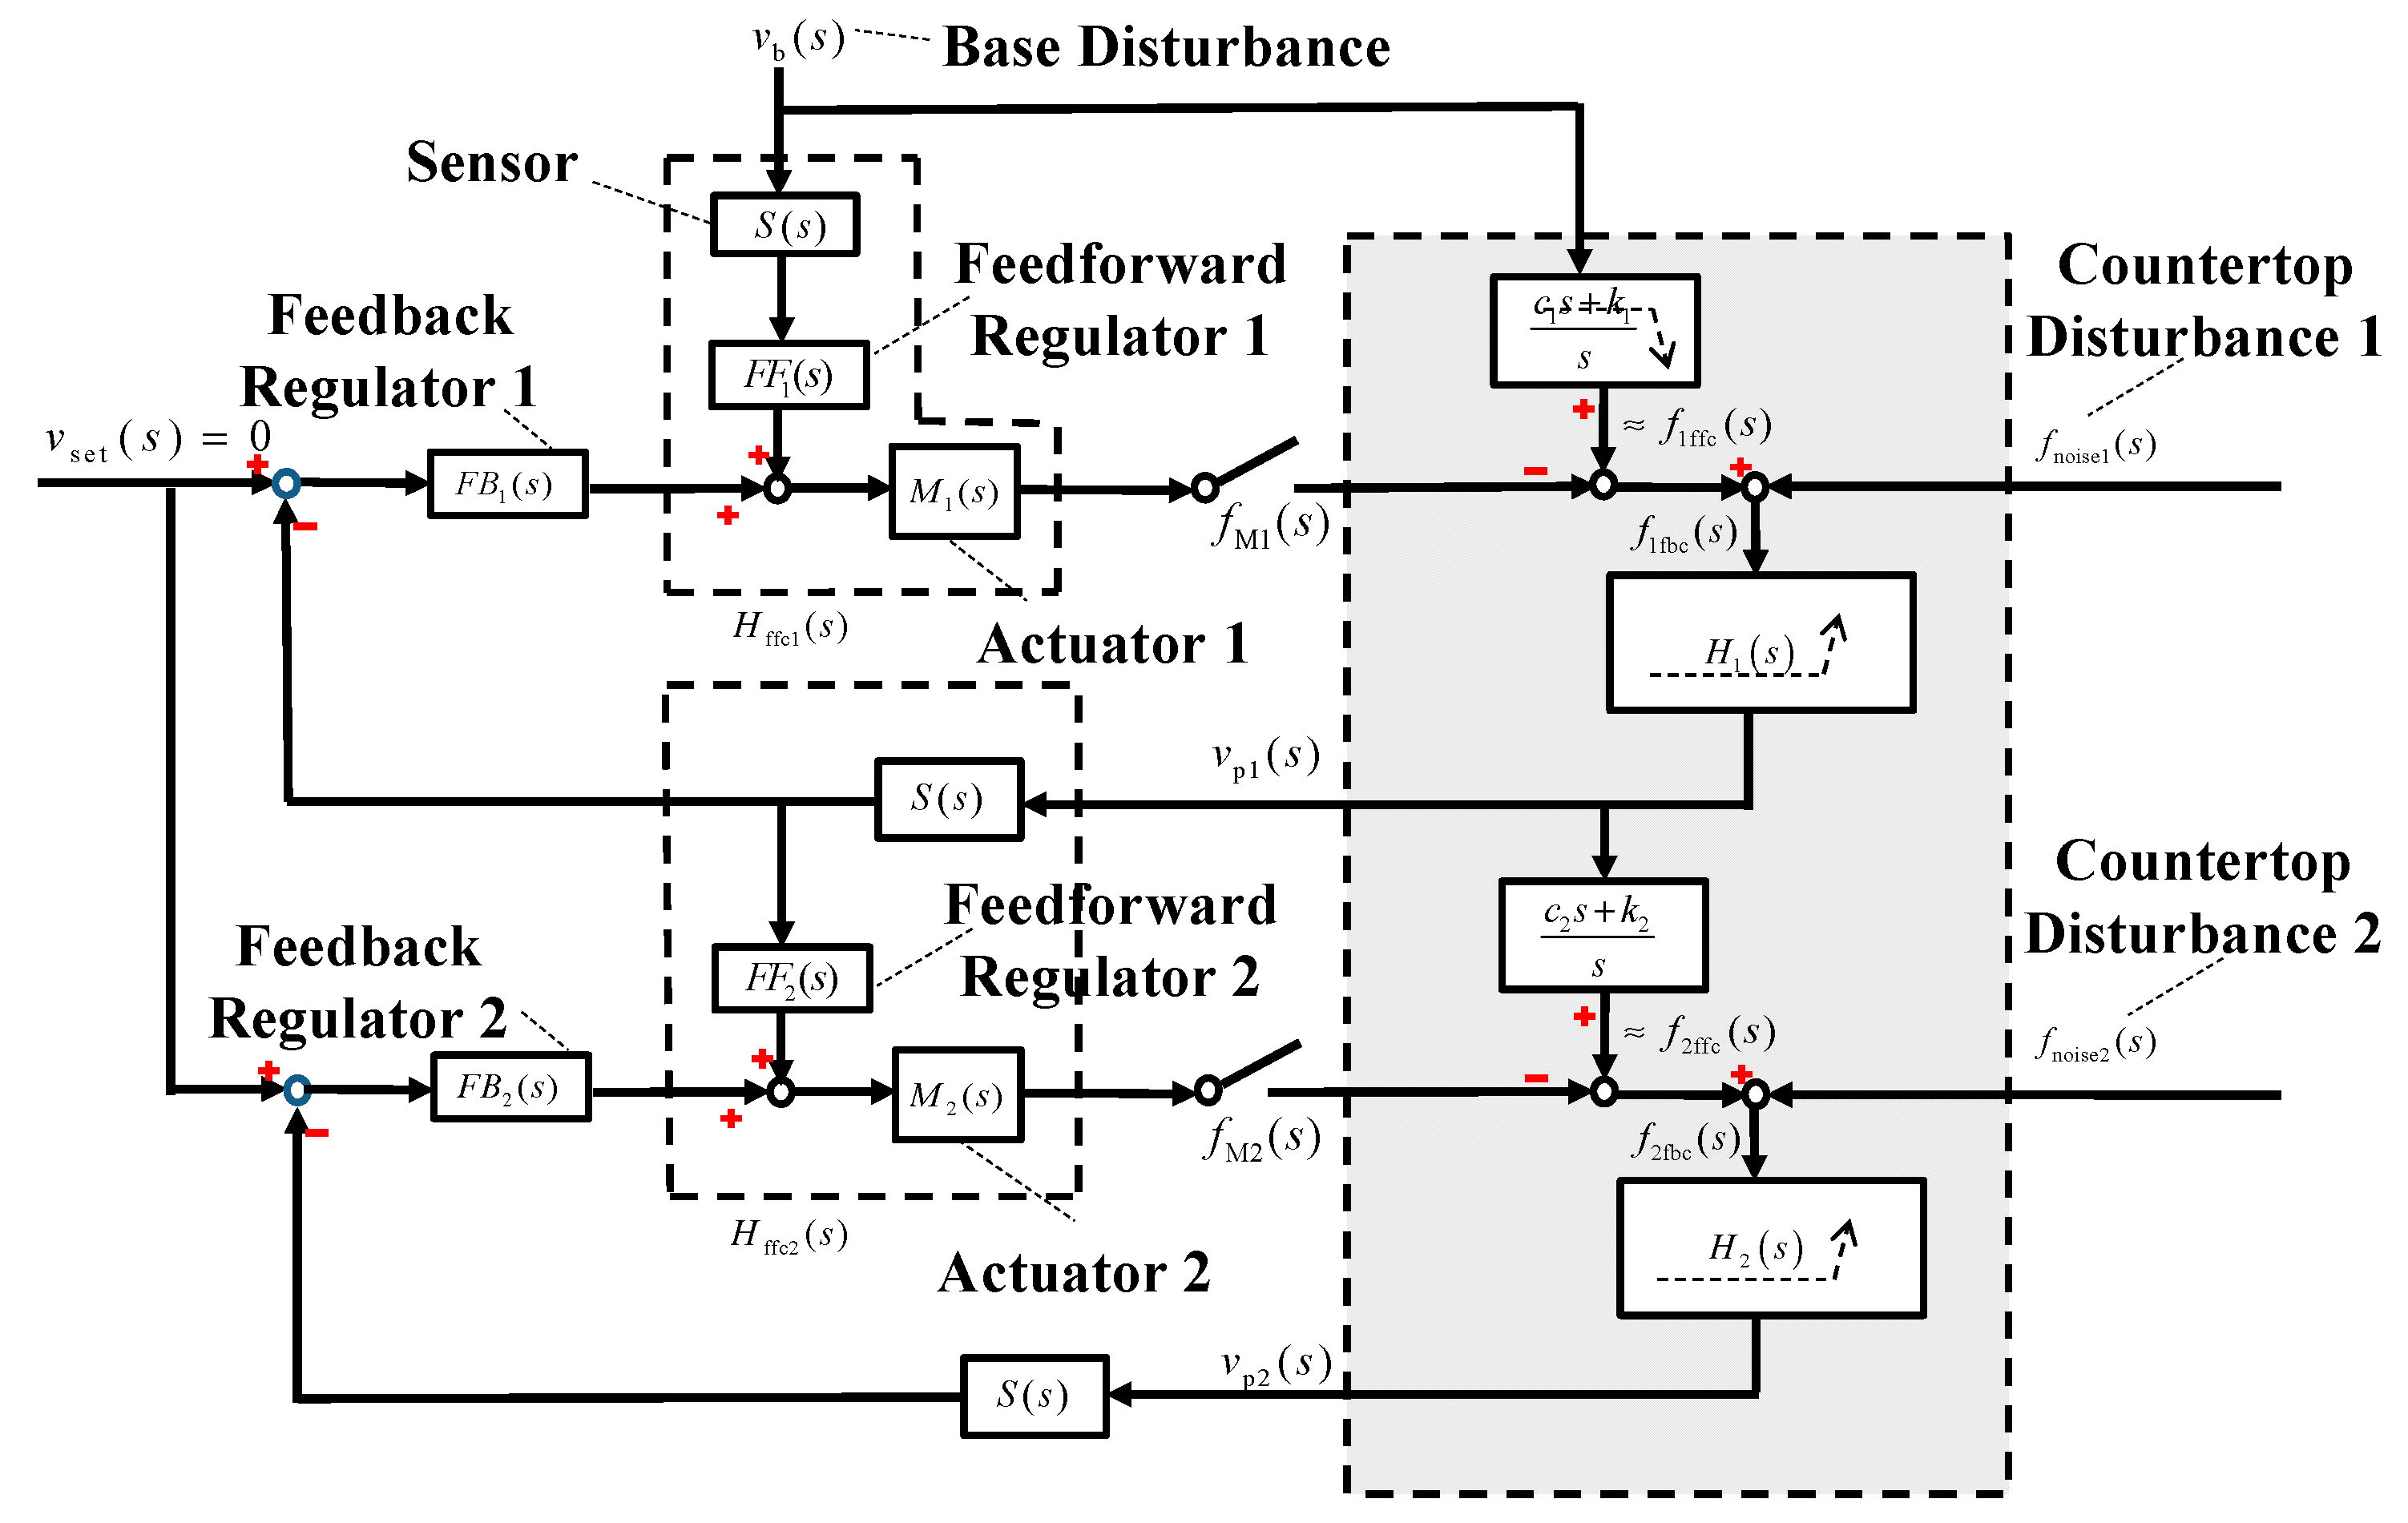
2.4. Analysis of DCSMS Control Characteristics

Although the coupling of natural frequencies may degrade the vibration attenuation performance of the system, this impact can be minimized through the use of active control techniques when the multi-stage vibration isolation system is stacked in cascading. This configuration has been shown to exhibit superior position and attitude-holding characteristics for unbalanced loads.
Air springs and steel springs are passive vibration isolation modules commonly used in commercial high-precision instruments. In these cases, the isolated object is almost entirely decoupled from the surrounding environment, requiring minimal active control in the high-frequency domain. From a dynamic perspective, the air-floating module can be conceptualized as a spring whose stiffness and damping are dependent on the air pressure, vacuum, and bearing design [24].
To streamline the calculations and facilitate simulation, steel springs were employed as the passive module to support the loads in the cascaded structure, disregarding f noise . By analyzing the damping characteristics based on the vibration source propagation path of the cascaded system in Figure 7, it is possible to obtain the velocity transfer function between v p 2 and v b under active control through the kinetic function of each stage:
v p 2 s v b s = c 2 + k 2 s H 2 ffc s c 1 + k 1 s H 1 ffc s m 1 s + c 1 + k 1 s + H 1 fbc s m 2 s + c 2 + k 2 s + H 2 ffc s + m 2 s c 2 + k 2 s H 2 ffc s
For further details on the derivation process of Equation (10), please refer to Discussion B.

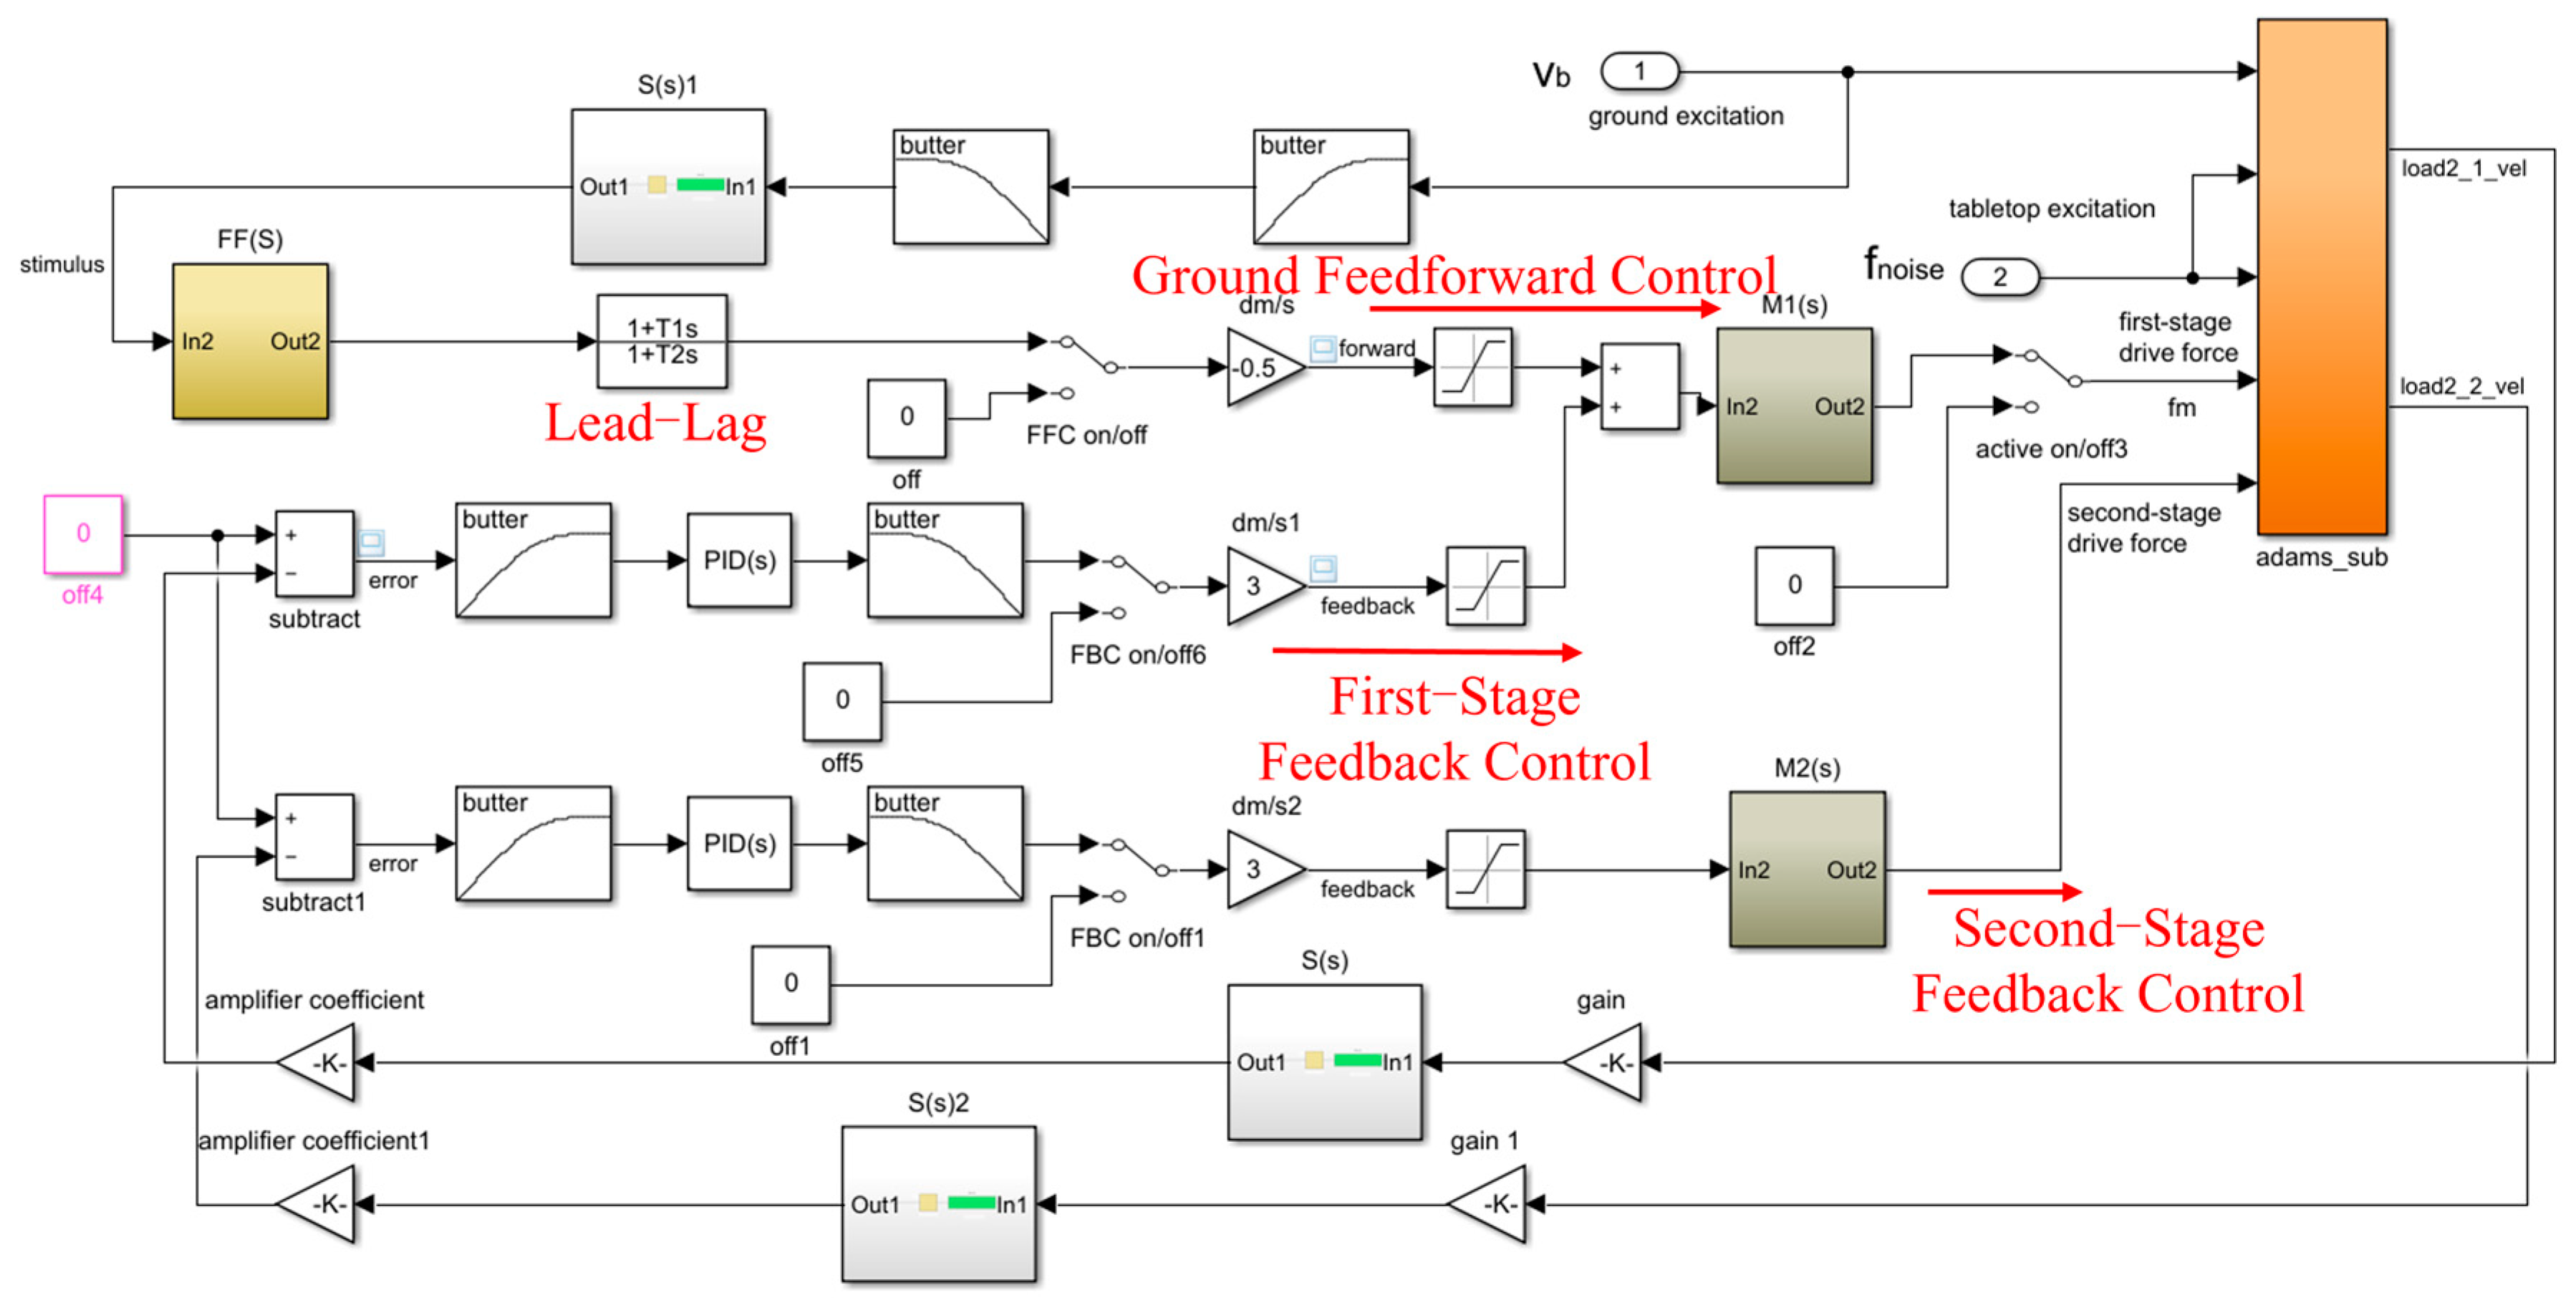
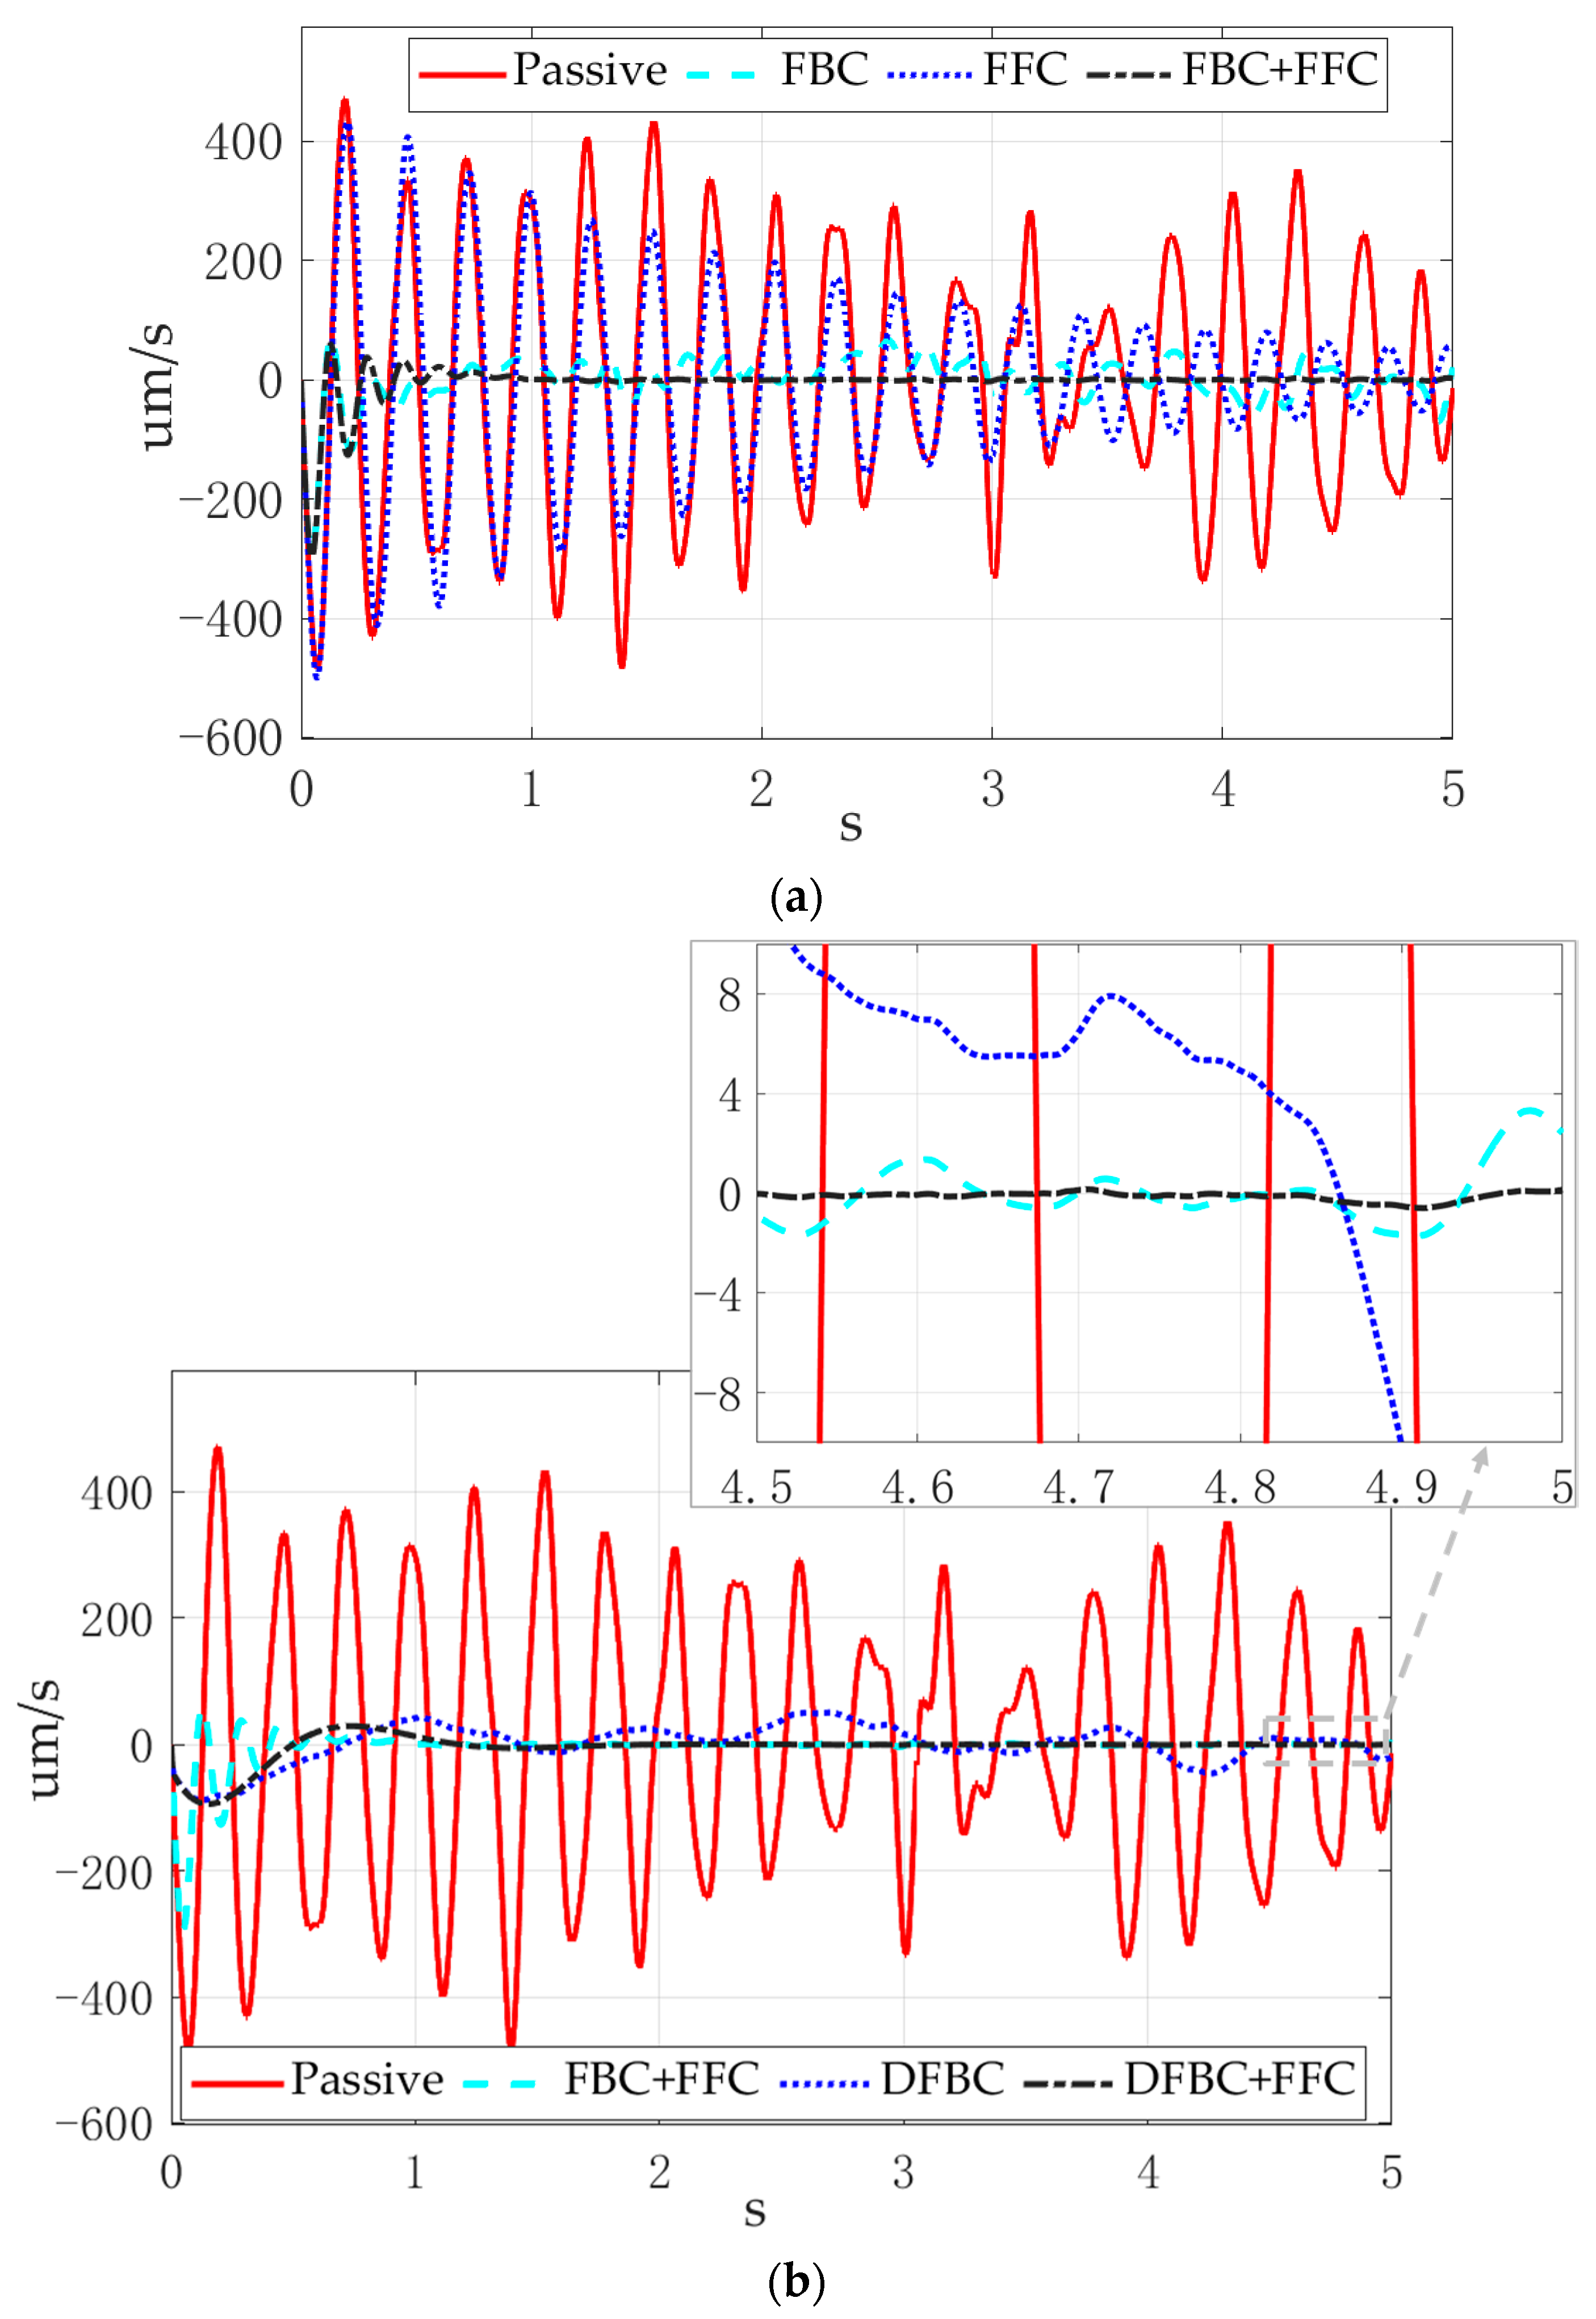
3. Modeling and Simulation of Active Vibration Control in DCSMS

ADAMS and MATLAB DCSMS Co-Simulation

In engineering applications, introducing a high-pass filter in the signal channel is typically employed to eliminate the effects of temperature drift, DC signal offset, and actuator output saturation, among other factors, on the system performance. Concurrently, the isolation of high-frequency noise from the output of the controller is achieved through the design of a notch filter or low-pass filter, which enhances the active control performance of the system. Nevertheless, the introduction of high-pass, low-pass, and other filters may affect the phase margin of the system. Consequently, a lead–lag compensation module is typically incorporated into the feedback loop to enhance the stability of the system.
The control schematic diagram of the DCSMS is shown in Figure 8.
The definitions of H 1 s and H 2 s in Figure 8 are as follows:
H 1 s = m 2 s 2 + c 2 s + k 2 s m 2 s 2 + c 2 s + k 2 m 1 s 2 + c 1 s + k 1 + m 2 s 2 c 2 s + k 2
H 2 s = s m 2 s 2 + c 2 s + k 2
To reduce the system complexity and facilitate DCSMS engineering applications, the second-stage feedforward regulator ( F F 2 s ), which is indicated by a dashed box in Figure 8, is set to 0.
The following analysis and simulations of the DCSMS were based on dual-cascade tabletop feedback control and single ground feedforward control. Figure 9 illustrates the active vibration control model of the DCSMS. A 100-unit velocity white noise was applied to the foundation, while a 20-unit thrust white noise was applied to both stages of the tabletop. Different combinations of control modes can be achieved by varying the state of the single-pole double-throw (SPDT) switch in the model.
To explicitly delineate the distinctions between conventional control methodologies and the proposed approach, supplemental simulations and experimental validations of the traditional vibration attenuation schemes have been incorporated in this paper. Furthermore, comparative analyses were conducted under identical actuator configurations and parametric conditions. As demonstrated in Figure 10, the numerical simulation results conclusively validate the efficacy of our proposed multi-modal vibration control framework.
Figure 10a depicts the real-time simulation curves of v p 2 under traditional ground-based control modes of the DCSMS. The green dashed line represents the first-stage tabletop under feedback control (FBC), which is contrasted with the red solid line under passive conditions. This comparison illustrates that the v p 2 amplitude at the resonance frequency is significantly attenuated in FBC. Ground vibrations and the resonance of the second stage in the passive mode contribute to the persistence of v p 2 in a relatively large value. The blue dashed curve denotes the response profile of the ground-based FFC, demonstrating independence from platform-induced vibration sources and velocity. The black dotted and dashed line represents the v p 2 curve under classical FBC with the additional foundation FFC. The contrast between the green and blue line demonstrates that FFC can effectively isolate the vibration transmission from the first- to second-stage tabletops. Consequently, the combination of first-stage ground feedforward control and tabletop feedback control has the effect of greatly attenuating the v p 2 amplitude.
Figure 10b employs the passive attenuation curve as a baseline reference, with a focused comparative analysis of vibration suppression performance among three control strategies: traditional feedback + feedforward control (FBC + FFC), dual feedback control, and hybrid DFBC + FFC. In the specific local amplification curves shown in Figure 10b, the v p 2 amplitude shown in the black solid line for DFBC + FFC is further suppressed compared to the green dashed line for FFC + FBC indicating that under the same parameters, the second-stage tabletop feedback control can effectively suppress the second-stage resonance. Furthermore, DFBC + FFC can further improve the active vibration attenuation performance than DFBC (blue dotted line) with the same number of actuators.

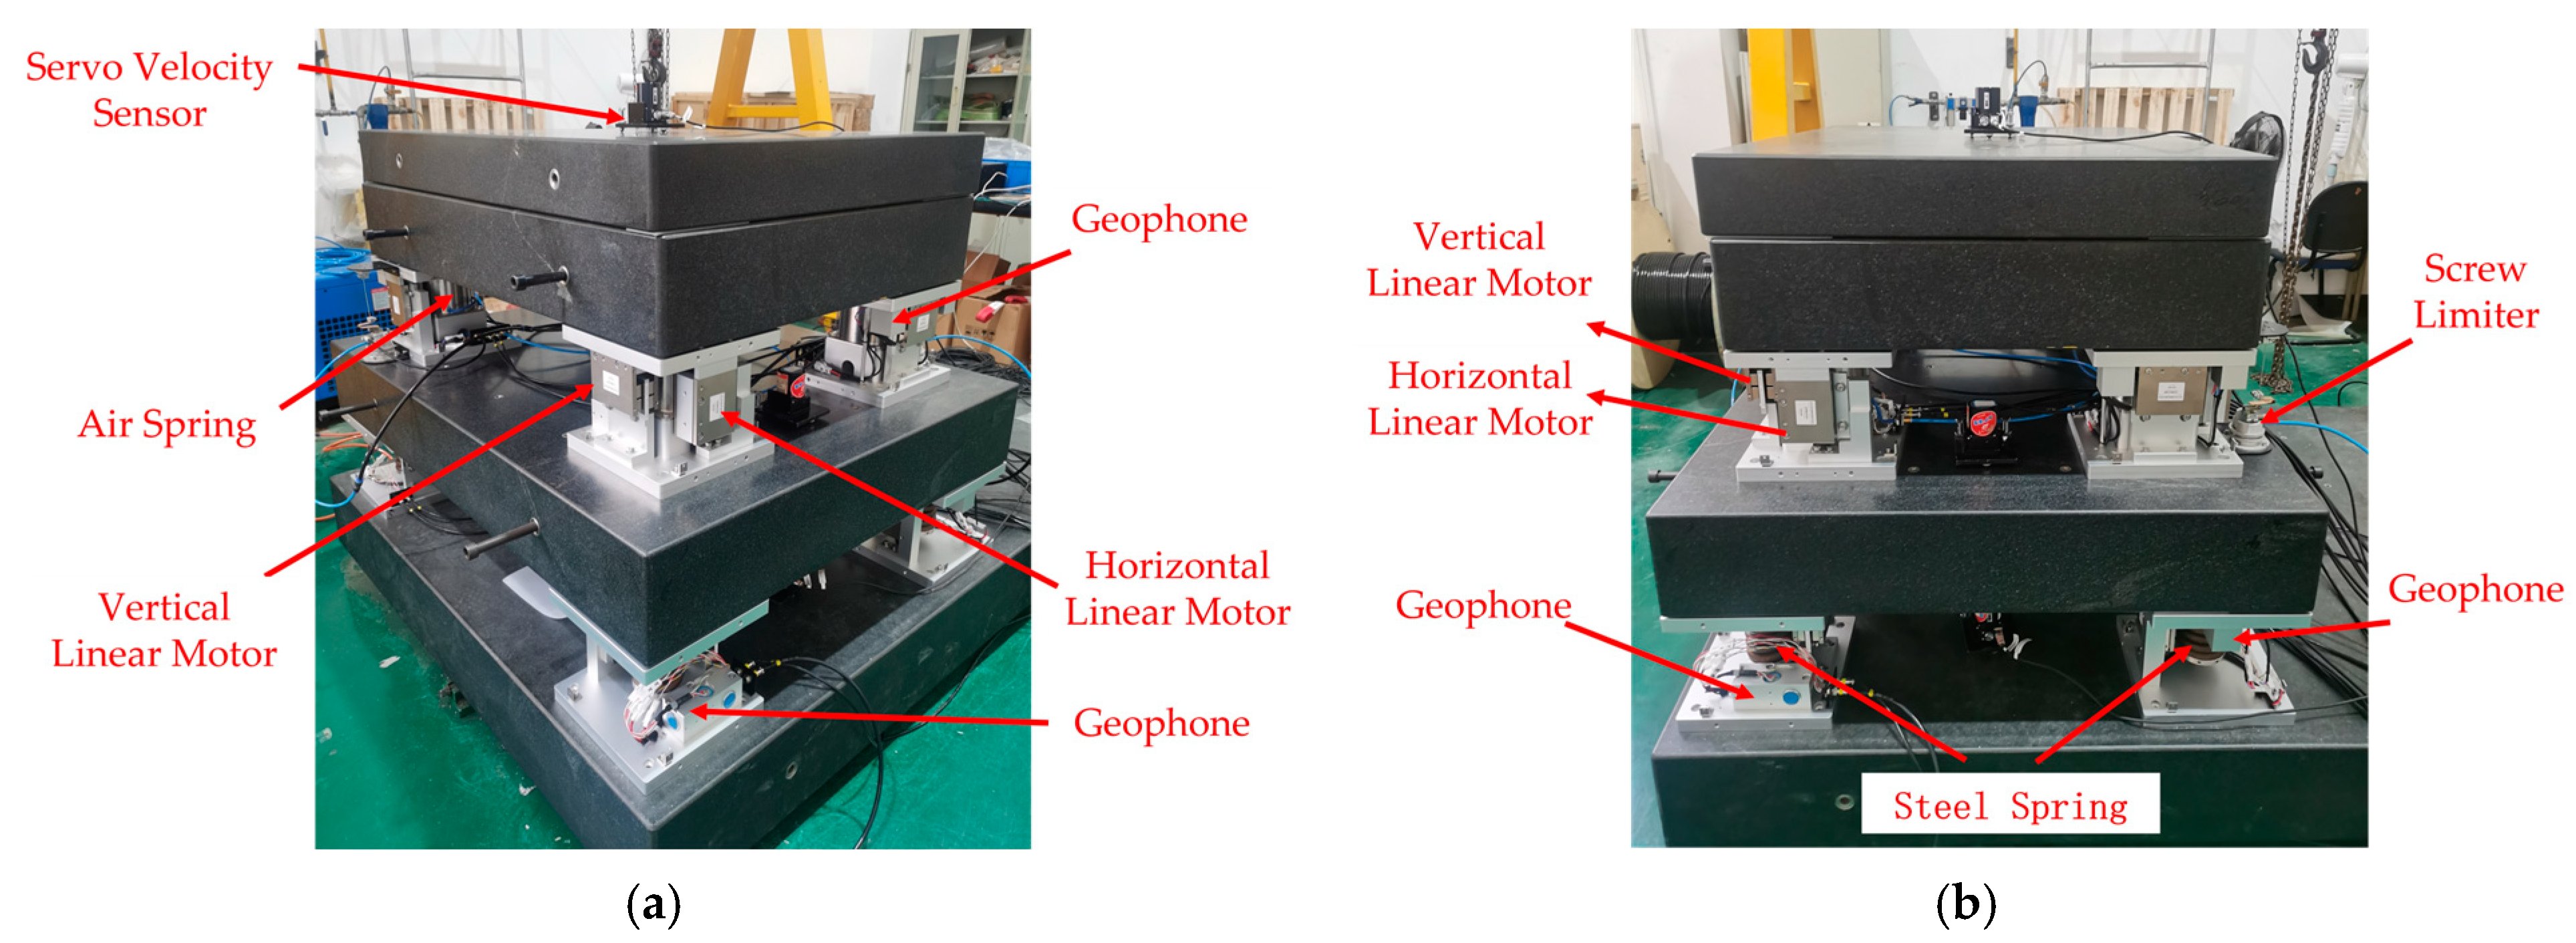
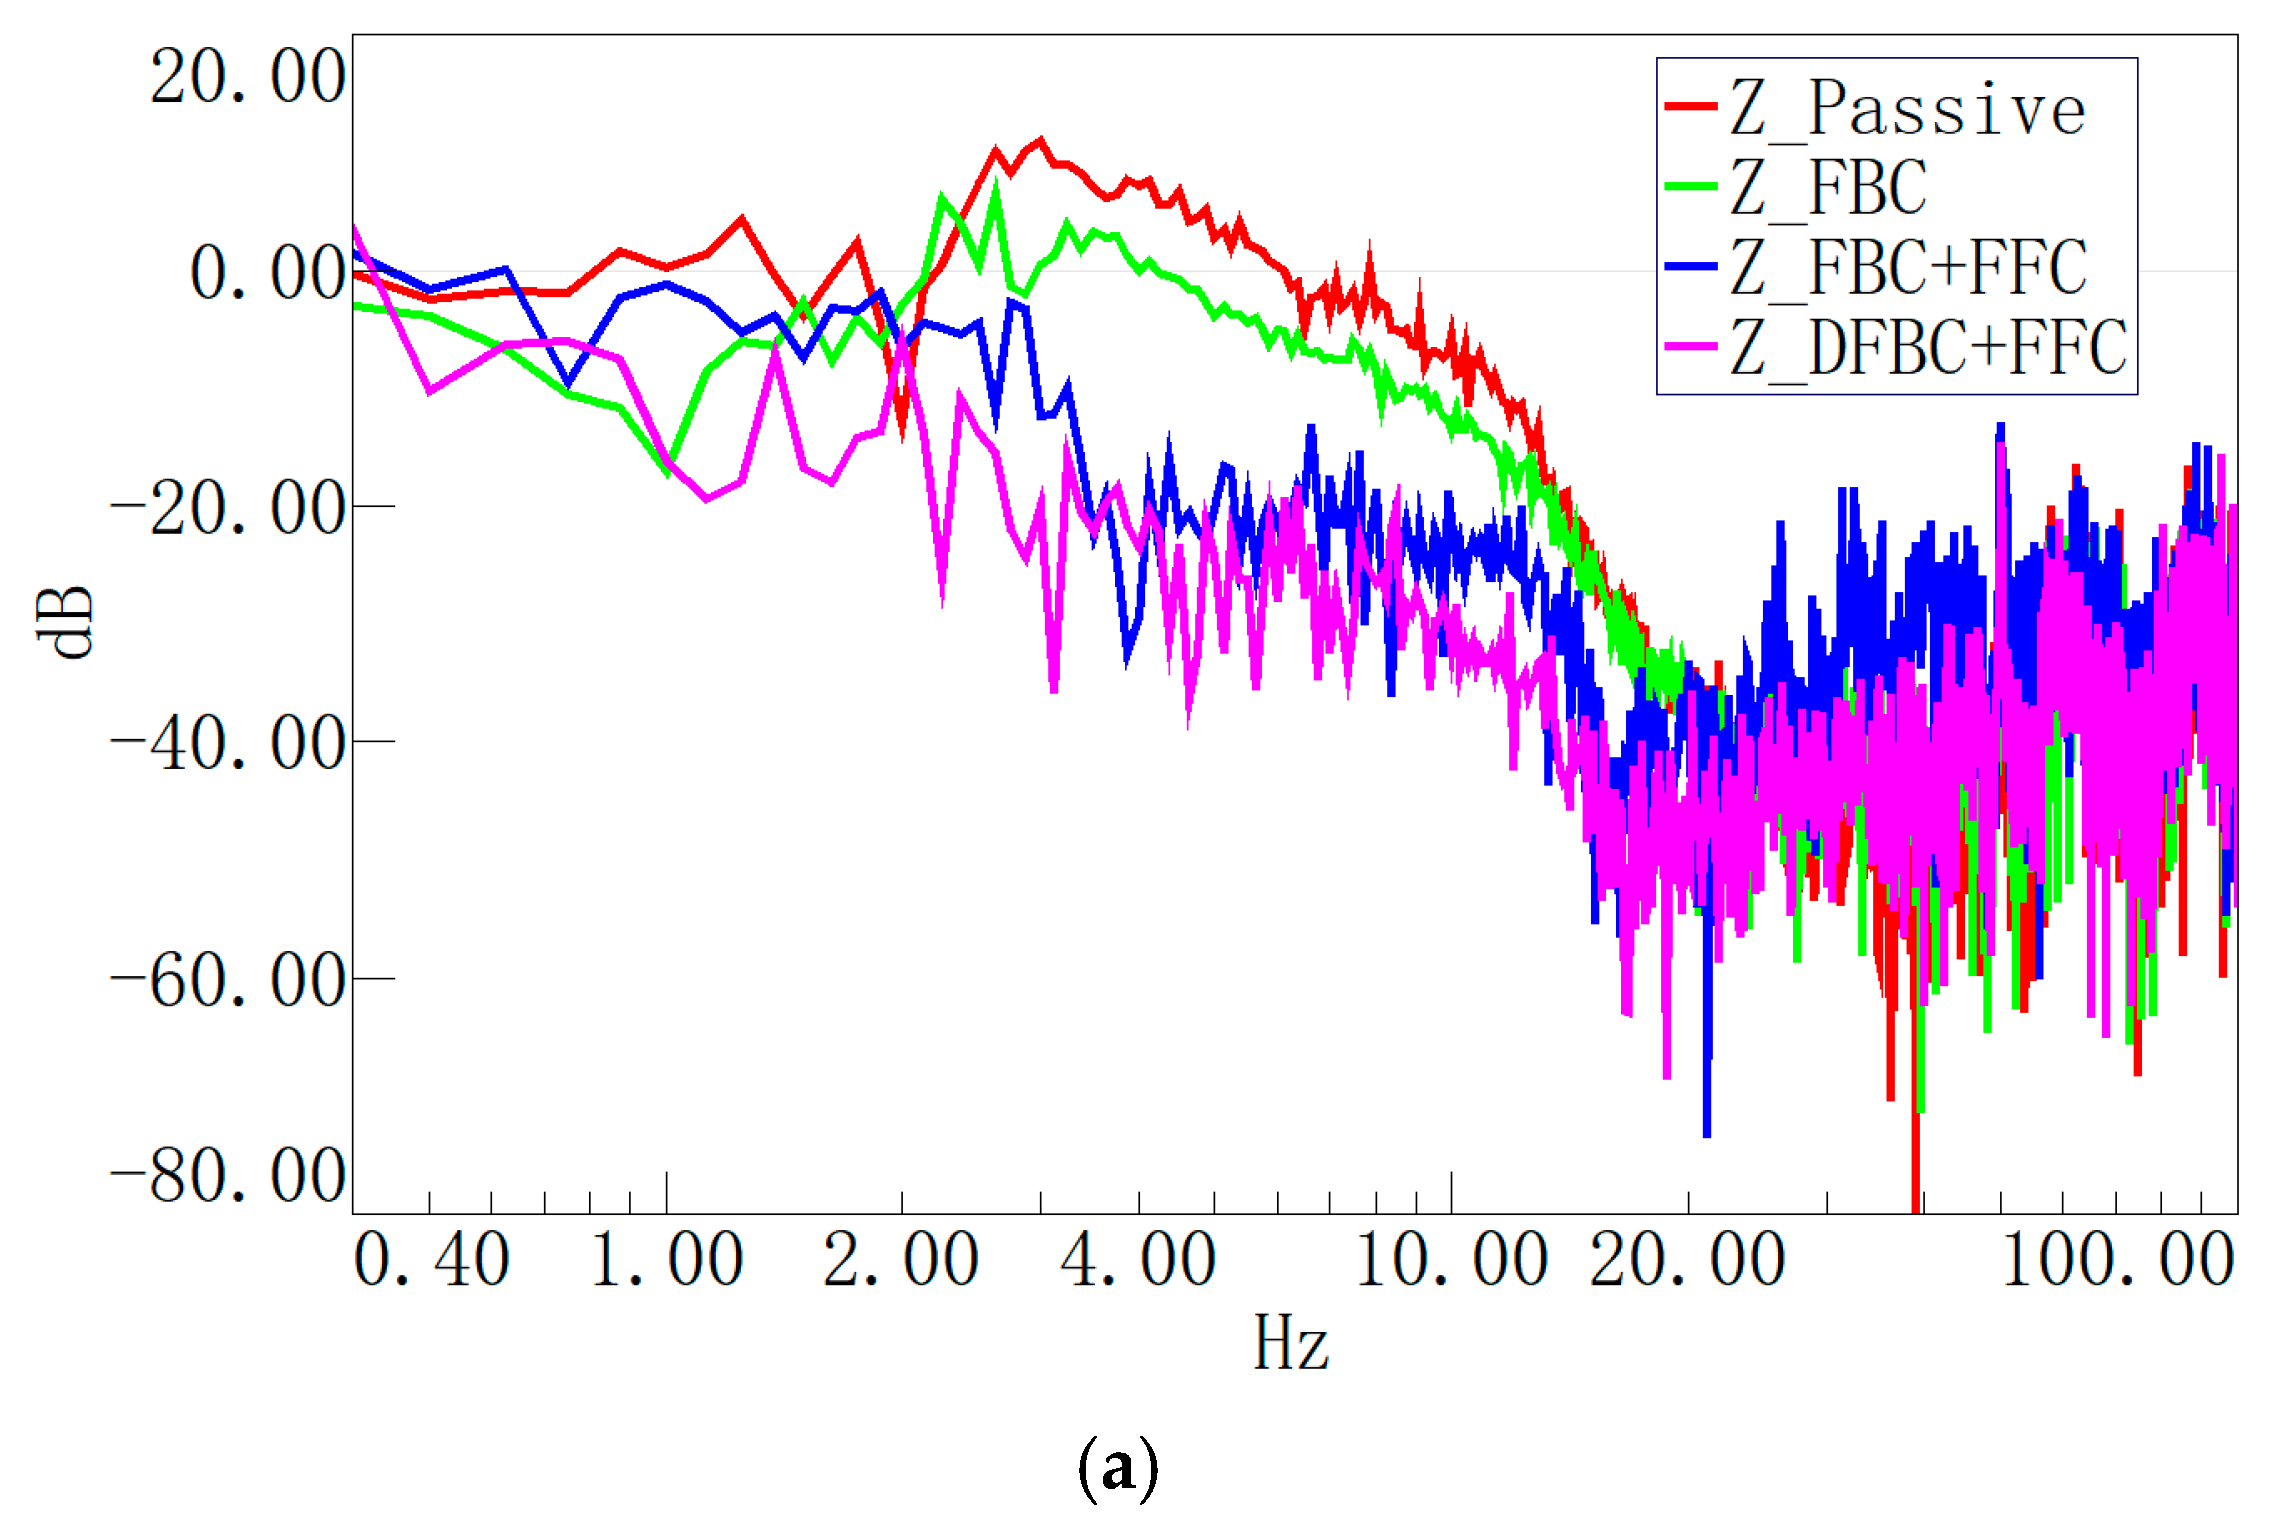
4. Control Experiment and DCSMS Application

4.1. Control Experiment of DCSMS Prototype

A prototype platform of the DCSMS was constructed, as shown in Figure 11. The air springs are considered the load-bearing component of the second stage, with m 2 equal to 750 kg. The first-stage counterweight has a mass of 700 kg and is supported by four separate steel springs. Consequently, the load-bearing capacity of the steel springs is the sum of all the counterweights and air spring modules, reaching 1558 kg. The detailed experimental parameters are comprehensively documented in Table 3. Although minor parametric deviations between the simulation models and the experimental setups are observed, these variations remain within acceptable tolerances and do not affect the scientific validity of the results or the robustness of the conclusions.
In operational implementations, the aerostatic systems are pre-configured by electron microscope manufacturers with fixed parameters (non-user-adjustable), while prototype experiments demand customized design configurations to accommodate specific testing requirements. The ground-based vibration isolation system’s spring stiffness and other critical parameters are primarily determined by the total payload. Current soft-mount vibration isolation systems typically tune the spring system’s vertical resonant frequency to approximately 4.5 Hz based on payload requirements. With fixed spring and aerostatic module configurations, the primary factors influencing system control performance stem from three key aspects:
  • Sensor measurement accuracy and linearity
Industrial-grade geophone sensors lack sufficient low-frequency detection capabilities (below 4.5 Hz). To address this, sensor bandwidth and sensitivity must be calibrated to achieve high precision in low-frequency vibration signal acquisition.
2.
Voice-coil actuator drive capability
The force sensitivity, the peak force, and the response bandwidth of the voice-coil motor govern both the system response speed and achievable vibration suppression levels.
3.
Controller specifications
Factors such as controller processing speed (60 MHz), sampling frequency (2 KHz), drive voltage (±12 V peak), and the choice of control scheme (e.g., open-loop vs. closed-loop) have a critical impact on the stability margin and vibration attenuation performance of DCSMS.
The GS-ONE LF test results with vertical low-frequency extension are presented in Figure 12. The legend descriptions are as follows: Passive: passive mode; FBC: first-stage tabletop single-feedback control; FFC + FBC: first-stage tabletop feedback control plus ground feedforward control; DFBC + FFC: dual-cascade tabletop feedback control plus ground feedforward control.
Figure 12a depicts the vertical velocity transmissibility curves under distinct control modes, while Figure 12b illustrates the v p 2 frequency spectra. The outcomes demonstrate that the DFBC + FFC mode exhibits superior vibration attenuation characteristics in comparison to the FBC + FFC mode, which is consistent with the simulation previously discussed.
Furthermore, the external high-precision velocity sensors (VSE-15D-6) were used to validate the vertical test results to verify the data authenticity of the internal sensors. Figure 13a,b show that the DFBC+FFC control mode had a better vibration attenuation performance in the vertical direction compared to the FBC + FFC and FBC control modes.

4.2. DCSMS Applications

In practical applications, the passive air-floating unit of the transmission electron microscope and other high-precision instruments does not necessarily require the object to be a regular square. Furthermore, the horizontal vibration impact must be considered. Therefore, it is necessary to calculate the sensor matrix and drive matrix according to the actual size to achieve accurate decoupling control. In this study, we employed the three-point air-floating transmission electron microscope as a case study to verify that the proposed method has a superior vibration attenuation performance and broader applicability, as illustrated in Figure 14. The test results of the internal and external sensors in the horizontal and vertical directions under identical control parameters were analyzed to validate the control performance of the DCSMS system.
The vibration velocity at the geometric center point of the tabletop was obtained by calculating the values of the mounted internal sensors.
The velocity curves under different control modes are shown in Figure 15. The test results demonstrate that multi-stage vibration control can further enhance the system’s vibration attenuation performance in comparison to single-stage control and DFBC. As illustrated in Table 4, the vibration attenuation rate of the DFBC + FFC method can reach −34 dB/−13.5 dB/−26.7 dB at the resonance peak in the X (left to right)/Y (front to back)/Z (vertical) directions under the same parameters, representing a more than 13.4% performance improvement compared to that of the traditional FBC + FFC method, while demonstrating a 7.1% enhancement relative to the standalone DFBC method.
External 393B31 accelerometers were utilized at the designated points 1, 2, and 3 to ascertain the vibration characteristics of the apparatus in the X/Y/Z directions, as illustrated in Figure 14. The position marked 1 represents the ground vibration, position 2 reflects the tabletop vibration of the foundation, and position 3 indicates the vibration at the center of the support frame above the air springs.
According to the comparison of the test results in Figure 16, the floating platform vibrations in the X/Y/Z directions are significantly lower than those of the first-stage platform and the ground, which indicates that the dual-cascade vibration control system is capable of overcoming the resonance influence of the second-stage air springs, thereby improving the vibration attenuation performance.

5. Conclusions

To address the performance limitations of conventional parametric tuning methods in suppressing vibrations under extreme operational conditions in practical application, this research proposes a cascaded vibration control architecture targeting low-frequency resonance mitigation (0.5–20 Hz band) based on the structural characteristics of transmission electron microscopes. Through multi-body dynamic modeling (ADAMS 2018–MATLAB /Simulink R2019a co-simulation platform) and parametric sensitivity analysis, we systematically validate the effectiveness of the cascaded topology. Furthermore, a coordinated multi-physics vibration suppression methodology is developed, integrating dual-cascade velocity feedback and ground velocity feedforward control strategies.
Firstly, we investigated the vibration propagation characteristics and stability of a DCSMS through an analysis of the dynamic characteristics in an SLSMS. Theoretical derivations demonstrate that the cascade spring mass structure achieves unconditional stability when practical application constraints are satisfied. A mathematical emulation framework was developed to analyze the key parameters’ influence on the characteristic root distributions in the DCSMS, while ADAMS simulations quantified the parameter-induced variations in the frequency response characteristics (FRCs) and power spectral density (PSD) under dual-disturbance conditions: ground excitation and countertop interference. We further examined the vertical control characteristics of the DCSMS across multiple control modes. An analytical control model incorporating the force superposition principles was formulated for DCSMS dynamics. Through ADAMS–MATLAB co-simulation modeling, a comparative analysis of the vibration attenuation performance was conducted across the control modes under identical parametric conditions. The results conclusively establish that the cascade configuration design significantly improves the vibration control effectiveness within low-frequency (<20 Hz) operational regimes.

Author Contributions

Conceptualization, X.J.; methodology, X.J.; software, X.J.; validation, Z.H.; formal analysis, Z.H.; investigation, X.J.; resources, X.J.; data curation, X.J.; writing—original draft preparation, X.J.; writing—review and editing, Y.K.; visualization, Z.H.; supervision, Y.K.; project administration, Y.K.; funding acquisition, Y.K. All authors have read and agreed to the published version of the manuscript.

Funding

This research was funded by the National Natural Science Foundation of China (NSFC), grant number 51875226.

Data Availability Statement

The raw data supporting the conclusions of this article will be made available by the authors on request.

Conflicts of Interest

The authors declare no conflicts of interest.

References

  1. Kato, T.; Kawashima, K.; Funaki, T.; Tadano, K.; Kagawa, T. A new, high precision, quick response pressure regulator for active control of pneumatic vibration isolation tables. Precis. Eng. 2010, 34, 43–48. [Google Scholar] [CrossRef]
  2. Li, Y.; He, L.; Shuai, C.; Wang, C. Improved hybrid isolator with maglev actuator integrated in air spring for active-passive isolation of ship machinery vibration. J. Sound Vib. 2017, 407, 226–239. [Google Scholar] [CrossRef]
  3. Wu, W.; Chen, X.; Shan, Y. Analysis and experiment of a vibration isolator using a novel magnetic spring with negative stiffness. J. Sound Vib. 2014, 333, 2958–2970. [Google Scholar] [CrossRef]
  4. Shan, J.; Shi, Z.; Gong, N.; Shi, W. Performance improvement of base isolation systems by incorporating eddy current damping and magnetic spring under earthquakes. Struct. Control Health Monit. 2020, 27, e2524. [Google Scholar] [CrossRef]
  5. Karnopp, D.; Crosby, M.J.; Harwood, R.A. Vibration Control Using Semi-Active Force Generators. J. Eng. Ind. 1974, 96, 619–626. [Google Scholar] [CrossRef]
  6. Gordon, C.G. Generic Vibration Criteria or Vibration-Sensitive Equipment. In Proceedings of the SPIE International Symposium on Optical Science, Engineering and Instrumentation, Denver, CO, USA, 18–23 July 1999. [Google Scholar] [CrossRef]
  7. Yang, F.; Sedaghati, R.; Esmailzadeh, E. Vibration suppression of structures using tuned mass damper technology: A state-of-the-art review. J. Vib. Control 2022, 28, 812–836. [Google Scholar] [CrossRef]
  8. Shen, Y.-J.; Wang, L.; Yang, S.-P.; Gao, G.-S. Nonlinear dynamical analysis and parameters optimization of four semi-active on-off dynamic vibration absorbers. J. Vib. Control 2013, 19, 143–160. [Google Scholar] [CrossRef]
  9. Zuo, L.; Slotine, J.-J.E. Robust vibration isolation via frequency-shaped sliding control and modal decomposition. J. Sound Vib. 2005, 285, 1123–1149. [Google Scholar] [CrossRef]
  10. Soubhia, A.L.; Serpa, A.L. Discrete optimization for actuator and sensor positioning for vibration control using genetic algorithms. J. Vib. Control 2018, 24, 4050–4064. [Google Scholar] [CrossRef]
  11. Jin, X.; Ma, H.; Tang, J.; Kang, Y. A Self-Adaptive Vibration Reduction Method Based on Deep Deterministic Policy Gradient (DDPG) Reinforcement Learning Algorithm. Appl. Sci. 2022, 12, 9703. [Google Scholar] [CrossRef]
  12. Yun, H.; Kong, D.; Aoyagi, M. Development of a multi-drive-mode piezoelectric linear actuator with parallel-arrangement dual stator. Precis. Eng. 2022, 77, 127–140. [Google Scholar] [CrossRef]
  13. Ouyang, H.; Zhang, J. Passive modifications for partial assignment of natural frequencies of mass-spring systems. Mech. Syst. Signal Process. 2015, 50–51, 214–226. [Google Scholar] [CrossRef]
  14. Zhu, S.J.; Zheng, Y.F.; Fu, Y.M. Analysis of non-linear dynamics of a two-degree-of-freedom vibration system with non-linear damping and non-linear spring. J. Sound Vib. 2004, 271, 15–24. [Google Scholar] [CrossRef]
  15. Griffin, S.; Gussy, J.; Lane, S.A.; Henderson, B.K.; Sciulli, D. Virtual Skyhook Vibration Isolation System. J. Vib. Acoust. 2002, 124, 63–67. [Google Scholar] [CrossRef]
  16. Wang, Q.; Zhou, J.; Wang, K.; Lin, Q.; Tan, D.; Xu, D.; Wen, G. Design and experimental study of a two-stage nonlinear vibration isolator with quasi-zero stiffness. Commun. Nonlinear Sci. Numer. Simul. 2023, 122, 107246. [Google Scholar] [CrossRef]
  17. Liu, Z.; Xie, Q.; Li, C. Further results on inverse eigenvalue problem for mass-spring-inerter systems. Mech. Syst. Signal Process. 2023, 204, 110719. [Google Scholar] [CrossRef]
  18. Hu, Y.; Chen, M.Z.Q.; Smith, M.C. Natural frequency assignment for mass-chain systems with inerters. Mech. Syst. Signal Process. 2018, 108, 126–139. [Google Scholar] [CrossRef]
  19. Li, H.; Chen, M.Z.Q. Achievable dynamic responses of general damped mass-chain systems. J. Frankl. Inst. 2024, 361, 341–356. [Google Scholar] [CrossRef]
  20. Li, P.; Lam, J.; Cheung, K.C. H  control of periodic piecewise vibration systems with actuator saturation. J. Vib. Control 2017, 23, 3377–3391. [Google Scholar] [CrossRef]
  21. Uyar, M.; Ergün, M. Investigation of vibration performance of pure active single and multi-feedback controls for a tall RC building. Structures 2023, 50, 615–635. [Google Scholar] [CrossRef]
  22. Beijen, M.A.; Heertjes, M.F.; Van Dijk, J.; Hakvoort, W.B.J. Self-tuning MIMO disturbance feedforward control for active hard-mounted vibration isolators. Control Eng. Pract. 2018, 72, 90–103. [Google Scholar] [CrossRef]
  23. Beijen, M.A.; Heertjes, M.F.; Butler, H.; Steinbuch, M. Mixed feedback and feedforward control design for multi-axis vibration isolation systems. Mechatronics 2019, 61, 106–116. [Google Scholar] [CrossRef]
  24. Zheng, Y.; Shangguan, W.-B.; Rakheja, S. Modeling and analysis of time-domain nonlinear characteristics of air spring with an auxiliary chamber. Mech. Syst. Signal Process. 2022, 176, 109161. [Google Scholar] [CrossRef]
Figure 1. Diagram of general DCSMS application structure.
Actuators 14 00179 g001
Figure 2. Schematic diagram of DCSMS in passive configuration.
Actuators 14 00179 g002
Figure 3. The root distribution diagrams of DCSMS under the influence of the following parameters: (a) first-stage payload ( m 1 ); (b) second-stage payload ( m 2 ); (c) first-stage damping ( c 1 ); (d) second-stage damping ( c 2 ); (e) first-stage stiffness ( k 1 ); (f) second-stage stiffness ( k 2 ).
Actuators 14 00179 g003
Figure 4. ADAMS DCSMS simulation model.
Actuators 14 00179 g004
Figure 5. Velocity transmissibility contrast between SLSMS and DCSMS.
Actuators 14 00179 g005
Figure 6. PRC and PSD analyses of DCSMS under different parameter influences: (a,b) first-stage mass ( m 1 ); (c,d) second-stage mass ( m 2 ); (e,f) first-stage equivalent damping ( c 1 ); (g,h) second-stage equivalent damping ( c 2 ); (i,j) first-stage equivalent stiffness ( k 1 ); (k,l) second-stage equivalent stiffness ( k 2 ).
Actuators 14 00179 g006aActuators 14 00179 g006b
Figure 7. Diagrammatic sketch of DCSMS in active control mode.
Actuators 14 00179 g007
Figure 8. Schematic diagram of DCSMS control system.
Actuators 14 00179 g008
Figure 9. DCSMS simulation model under active vibration control.
Actuators 14 00179 g009
Figure 10. Simulation curves of DCSMS under active vibration control: (a) comparison of traditional control methodologies; (b) DFBC + FFC contrasts with the existing hybrid control methods.
Actuators 14 00179 g010
Figure 11. DCSMS prototype platform: (a) 45-degree angled side view; (b) front view.
Actuators 14 00179 g011
Figure 12. Experimental results of DCSMS internal sensors in different control modes: (a) vertical velocity transmissibility curve; (b) vertical velocity spectrum curve.
Actuators 14 00179 g012aActuators 14 00179 g012b
Figure 13. Experimental validation of external sensors in DCSMS under different control modes: (a) vertical velocity transmissibility curve; (b) vertical velocity spectrum curve.
Actuators 14 00179 g013aActuators 14 00179 g013b
Figure 14. Application of DCSMS in transmission electron microscope: (a) partial assembly view; (b) overall machine view.
Actuators 14 00179 g014
Figure 15. Comparison of internal velocity curves in different directions of the computational geometric center under various control modes: (a) left-right direction; (b) front-back direction; (c) vertical direction.
Actuators 14 00179 g015
Figure 16. Contrast in external accelerations between marked points on different axes: (a) left-right axis; (b) front-back axis; (c) vertical axis.
Actuators 14 00179 g016aActuators 14 00179 g016b
Table 1. The fundamental parameters of the DCSMS.
m 1 (kg) m 2 (kg) c 1 c 2 k 1 (N/mm) k 2 (N/mm)
988.8748.80.490.49300300
Table 2. Eigenvalue table of DCSMS exported by ADAMS.
Mode
Number
Undamped Natural
Frequency (Hz)
Damping
Ratio
RealImaginary
23.7646791.931758 × 10−2−7.272447 × 10⁻²+/−3.763976
39.3625504.804175 × 10−2−4.497933 × 10⁻¹+/−9.351740
Table 3. Critical parameters of Prototype platform.
ComponentParameterValue
Air SpringMembrane radius0.03 m
Maximum pressure0.8 MPa
Working pressure0.4 MPa
Maximum working stroke0.075 m
Maximum load (four isolators)2000 kg
Module weight27 kg
Helical SpringStiffness310 N/mm
Maximum load500 kg
Outside diameter88 mm
Inside diameter55 mm
Voice Coil ActuatorForce sensitivity80.3 V/m/s
Peak force100 N
Total stroke2 mm
Response bandwidthDC~200 Hz
Marble 1Weight700 Kg
Marble 2Weight750 Kg
GeophoneNatural frequency4.5 Hz
Sensitivity100.4 V/m/s
Open circuit damping0.42
Table 4. Velocity normalization factor in the resonance frequency.
Normalization FactorX YZ
Passive1.0001.0001.000
FBC0.2431.1820.873
FBC + FFC0.1550.5040.297
DFBC0.0910.7510.144
DFBC + FFC0.0210.2140.052
Disclaimer/Publisher’s Note: The statements, opinions and data contained in all publications are solely those of the individual author(s) and contributor(s) and not of MDPI and/or the editor(s). MDPI and/or the editor(s) disclaim responsibility for any injury to people or property resulting from any ideas, methods, instructions or products referred to in the content.

