Abstract
A non-contact piezoelectric actuator is proposed. The non-contact power transfer between stator and rotor is realized by pneumatic transmission, characterized by fast response, long life, compact structure, and easy miniaturization and control. The structure of the non-contact piezoelectric actuator is designed and its working principle is elucidated. The equation of the relationship between the output displacements of the non-contact piezoelectric actuator’s micro-displacement amplifying mechanism and the input displacements of piezoelectric stack is deduced, and the simulation analysis method of output displacement of the micro-displacement amplifying mechanism is established. Using the equation and the simulation analysis, the output characteristics of micro-displacement amplifying mechanism for the non-contact piezoelectric actuator and their changes along with the system parameters are investigated. The detailed process of optimal design of the micro-displacement amplifying mechanism is given by means of mathematical statistics. The prototype is made and the performance test is carried out. The correctness of the theoretical calculation and simulation analysis is verified by comparing the experimental values with the theoretical and simulated values of the output displacement of the micro-displacement amplifying mechanism. The results show that the initial angle of bridge structure I has an obvious effect on the output characteristics of the micro-displacement amplifying mechanism in the range of 5°–15°. When the lever’s rod length is 13 mm–15 mm, the bridge structure II’s rod length is 6 mm–7 mm, and the power arm length of bridge structure I’s driving lever is 5 mm–7 mm, the bridge structure II’s rod horizontal projection length is 5 mm–6 mm and the output displacement of the micro-displacement amplifying mechanism is larger. Through the optimal design, it is obtained that the bridge structure I’s initial angle is 8°, the lever’s rod length is 15 mm, the bridge structure II’s rod length is 7 mm, and the power arm length of bridge structure I driving lever is 5 mm, the bridge structure II’s rod horizontal projection length is 6 mm, and the simulated output displacement of the micro-displacement amplifying mechanism is 0.1415 mm. The prototype test reveals that as the input excitation displacement decreases, the error increases, while as the input excitation displacement increases, the error decreases. Specifically, when the input excitation displacement is 0.005 mm, the measured output displacement of the micro-displacement amplifying mechanism is 0.1239 mm, resulting in a 19.8% deviation from the theoretical value and a 12.44% deviation from the simulated value. The research work in this paper enriches the research achievements of non-contact piezoelectric actuators, and also provides a reference for designing small structure and large travel micro-displacement amplifying mechanisms of this type of actuator.
1. Introduction
With the rapid development of science and technology, whether in traditional manufacturing or high-tech fields, industrial products are constantly developing towards miniaturization and intelligence. The demands for actuators used in micro rotary machinery, characterized by lightweight, integration, and intelligence, are increasing, Higher requirements are put forward for the performance of the actuators such as fast response, low heat, long service life, etc.
Piezoelectric actuators convert electrical energy into mechanical energy to achieve movement output by exploiting the anti-piezoelectric effect of piezoelectric materials. They are characterized by their small size, rapid response, high displacement resolution, low energy consumption, no magnetic field, easy control, etc. [1,2,3,4,5,6,7,8]. As a result, the industrialization of piezoelectric actuators is developing rapidly. Various types of piezoelectric actuators have been successfully used in fields such as those of precision instruments, biomedical science, micro-robots and lunar probes, etc. [9,10,11,12,13,14,15,16,17,18].
Based on the contact form of the stator and rotor, the piezoelectric actuators include two types: contact type and non-contact type. The contact type of the ultrasonic actuator is the oldest and most famous piezoelectric actuator. It stimulates the stator to generate resonance at the ultrasonic frequency, so that the stator obtains the required amplitude to drive the rotor, and drives the rotor movement through the friction force. Piezoelectric inertia [19] motors use the inertia of a body to drive it in small steps by means of an uninterrupted friction contact. they are especially suited for miniaturization and use in mobile phone cameras due to their simple structure and inherent fine-positioning capability. Sashida et al. [20,21] developed a standing wave ultrasonic motor and a travelling wave ultrasonic motor. Based on travelling wave ultrasonic motor proposed by Sashida et al., Ishe [22,23] proposed a ring-shaped travelling wave ultrasonic motor in which the teeth were manufactured on the vibrator. It enlarged the vibrating amplitudes of the vibrator and the motor efficiency was increased. Delibas et al. [24] proposed a new type of frictional piezoelectric ultrasonic motor of one longitudinal and two bending type (L1B2) by using a rectangular piezoelectric prism as the oscillator. The motor has good controllability and the moving speed ranges from 1.0 micron/s to 1.0 m/s.
However, due to the repeated friction between stator and rotor contact surfaces, the traditional piezoelectric actuator produces material wear and a lot of energy consumption, which reduces the service life. This kind of actuator is not suitable for long-term continuous operation, which limits the application field [25,26]. For it instead, non-contact piezoelectric actuators are proposed and investigated [27,28,29].
As early as 1990, Nakamura et al. [30,31] developed a non-contact piezoelectric ultrasonic motor with liquid as the medium, and carried out theoretical and experimental research. Yamayoshi et al. [32] proposed a non-contact ultrasonic motor in which the fluid between the stator and the rotor is used to transmit torque and a speed of 3000 r/min was obtained under the excitation voltage of 100 V. Stepanenko et al. [33] studied a non-contact rotary piezoelectric motor driven by standing wave which is composed of an annular stator with bending vibration and an asymmetric rotor with blades. Qiu et al. [34] proposed a non-contact piezoelectric rotary motor modulated by giant electrorheological fluid, which has the maximum torque of 1.04 mN·m and speed of 6.98 rad/s. Compared to the motor using traditional electrorheological fluid, the motor performance is significantly improved. Nandi et al. [35] presented a non-contact vibration actuator with electromagnet installed on the piezoelectric stack. The resolution of piezoelectric stack extension is at the nanometer level. Xing et al. [36,37] combined piezoelectric and electromagnetic drives and designed a non-contact rotating piezoelectric motor based on electromagnetic clamping, studying its output torque. It used a flexible magnifying mechanism to amplify the micro-displacement generated by the piezoelectric stack. Shi et al. [38] proposed a non-contact ultrasonic motor based on near-field acoustic levitation and made experimental devices to test its operational performance. Wang et al. [39] proposed a non-contact rotating piezoelectric actuator based on the electromagnetic modulation mechanism and rigid magnification mechanism, investigated its nonlinear dynamics, and determined the conditions for generating chaotic vibration. Chen et al. [40] proposed a non-contact ultrasonic motor based on acoustic streaming, and carried out a theoretical analysis and test. When the drive voltage was 1430 V, the rotor speed could reach 28 r/min.
In order to fully exploit the superiority of piezoelectric actuators and reduce the influence of friction loss between the stator and rotor of the contact actuator on the response speed and service life of the actuator, and also expand the research field of non-contact piezoelectric actuation, the authors propose a non-contact piezoelectric actuator that realizes power transmission between the stator and rotor through pneumatic conveying.
The structure and working principle of the non-contact piezoelectric actuator are introduced. The equation of the relationship between the output displacements of the non-contact piezoelectric actuator’s micro-displacement amplifying mechanism and the input displacements of the piezoelectric stack are deduced, and the simulation analysis method of the output characteristics of the micro-displacement amplifying mechanism is established. The output displacements of the micro-displacement amplifying mechanism and their changes along with the system parameters are investigated by the equation and simulation analysis. The theoretical results are compared with the simulation results. The validity of the theoretical analysis method for the output characteristics of the micro-displacement amplifying mechanism is verified. Based on mathematical statistics, the detailed process of optimal design of the micro-displacement amplifying mechanism is provided. The prototype is made, and the performance test is carried out. The results of the experiment, theory, and simulation are compared and analyzed. The validity of the design of the micro-displacement amplifying mechanism, the correctness of the theoretical calculation method, and the simulation analysis approach for output characteristics are verified.
2. Structure and Operating Principle
The structure of the non-contact piezoelectric actuator is shown in Figure 1. The actuator mainly consists of a driver module and a transmission module.
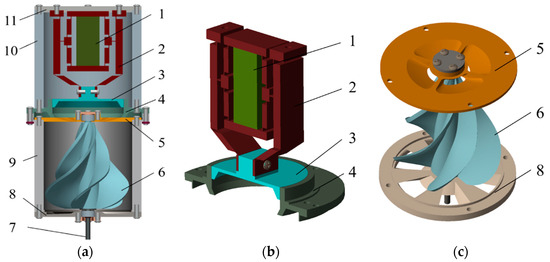
Figure 1.
Structure of the non-contact piezoelectric power actuator. (a) 3D structure; (b) driver module; (c) transmission module; 1—piezoelectric stack; 2—displacement amplifying mechanism; 3—piston; 4—cylinder housing; 5—upper bearing housing; 6—gyrorotor; 7—output shaft; 8—lower bearing housing; 9—lower shell; 10—upper shell; 11—upper cover.
The driver module includes a piezoelectric stack, a displacement amplifying mechanism, a piston, and a cylinder housing. The output displacement of a piezoelectric stack after applying an electrical signal is small, so it is often necessary to enlarge the displacement in practical applications to meet the needs of long-distance precise drive. The matching displacement amplifying mechanism adopts a symmetrical three-stage micro-displacement amplifying structure with flexure hinges. The structure has the advantages of compact structure, no need for assembly, smooth movement, high sensitivity, no mechanical friction, no lubrication, and high reliability, etc. The displacement generated by the piezoelectric stack is amplified to effectively push the piston to move along the axial direction of the inner cavity of the cylinder housing.
The transmission module includes an upper bearing housing, a gyrorotor, an output shaft, and a lower bearing housing. The cylinder root of the upper bearing housing is uniformly arranged with a fan-shaped circular truncated cone hole biased toward the central axis, which is helpful to guide the input and output air current and increase its speed blowing to the top of the gyrorotor.
The gyrorotor is a rotating body with multiple pairs of spiral blades, which is firmly connected to the output shaft. The lower bearing housing is provided with a fan-shaped circular truncated cone hole, which is tangent to the slope of the helical blade at the root of the gyrorotor and distributed uniformly along the central axis, easily accommodating the air that blows to rotate the gyrorotor out and in. The bearings supporting the rotation of the gyrorotor and the output shaft are one-way bearings, to prevent the air into the closed cavity to drive the output shaft reverse rotation.
Figure 2 shows the operation principle of the non-contact piezoelectric actuator. The actuator is powered by a piezoelectric stack embedded in a displacement amplifying mechanism. When the rising saw-tooth wave voltage signal is applied, the piezoelectric stack creates longitudinal deformation. The deformation is amplified by the displacement amplifying mechanism and pushes the piston to move down along the inner cavity of the cylinder housing. The volume of the closed cavity enclosed by the piston, cylinder housing, and upper bearing housing is reduced, the air in the cavity is compressed, and its pressure increases. The compressed air is blown to the top of the gyrorotor through the circular truncated cone hole on the upper bearing housing, which drives the rotor to rotate. The rotor drives the output shaft connected with it to rotate and realize the non-contact transmission of power. Then, after blowing to the top of the gyrorotor, the air will flow to the root of the gyrorotor along the cavities between the spiral blades, and then drains out of the actuator along the circular truncated cone hole in the lower bearing housing to reduce the accumulation of air in the lower shell which would prevent the rotor rotating.
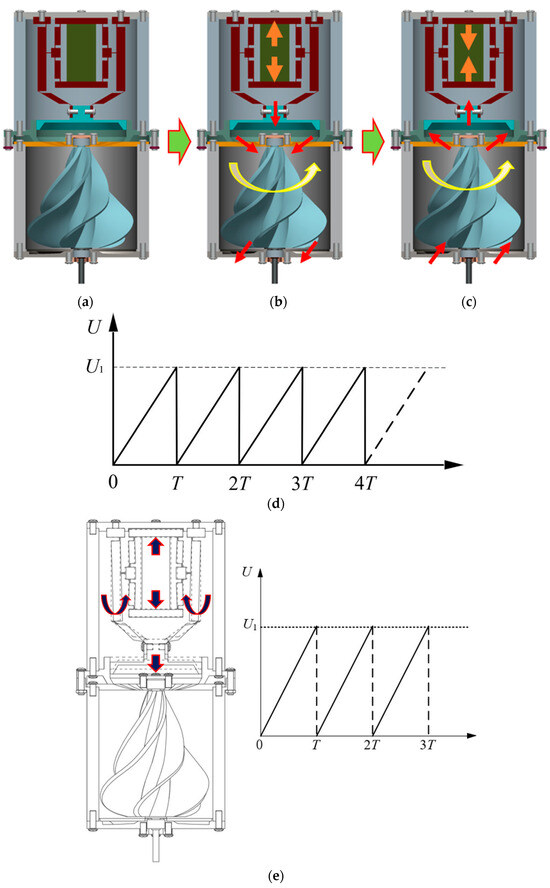
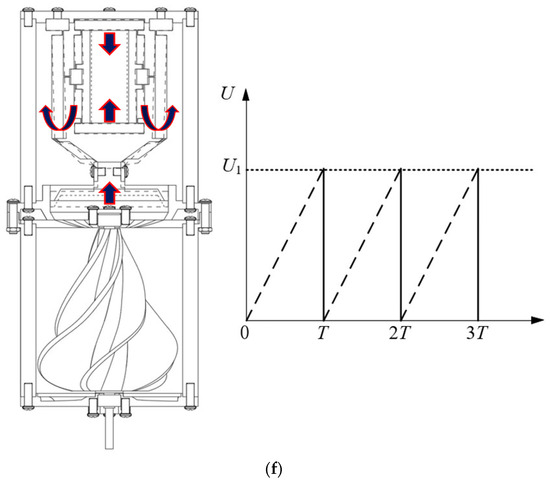
Figure 2.
The operation principle of the non-contact piezoelectric actuator. (a) initial position; (b) rising edge voltage signal; (c) falling edge voltage signal; (d) schematic diagram of periodic saw-tooth wave voltage signal applied to the piezoelectric stack; (e) The motion of the driver module after the actuator has applied the rising saw-tooth wave voltage signal (the solid lines); (f) The motion of the driver module after the actuator has applied the descending saw-tooth wave voltage signal (the solid lines). Note: The arrows in Figure 2 indicate the direction of structural movement at specific locations within the work area.
In order to better understand the driving principle of the actuator, the deformation of the piezoelectric stack, the motion of the amplifying mechanism and the piston after the actuator was applied with saw-tooth wave voltage signal are described in Figure 2e,f. Among them, the dashed lines in the actuator structure diagram represent the position of the piezoelectric stack, the amplifying mechanism, and the piston before the voltage signal is applied, and the solid lines represent the position of the piezoelectric stack, the amplifying mechanism, and the piston after the voltage signal is applied. The dashed and solid lines represent the deformation of the piezoelectric stack, the motion of the amplifying mechanism and the piston. The solid lines in the saw-tooth wave voltage signal diagram indicate the applied saw-tooth signal, while the dashed lines indicate the unapplied saw-tooth signal.
When the electrical signal becomes a descending saw-tooth wave voltage signal, the piezoelectric stack shrinks rapidly and returns to its initial state, and the displacement amplifying mechanism also returns to its original position and pulls the piston to move upward along the axial direction of the inner cavity of the cylinder housing. The volume of the closed cavity enclosed by the piston, the cylinder housing, and the upper bearing housing increases, and a partial vacuum is formed in the cavity. Under the action of atmospheric pressure, the air outside the cavity enters the closed cavity through the circular truncated cone hole on the lower and the upper bearing housing, restores its initial state, and prepares the next operation process. Now, the rotor will continue to rotate because of inertia to the output power.
The electrical signal becomes a rising saw-tooth wave voltage signal again, and the piezoelectric stack repeats the above action; the volume of the closed cavity enclosed by the piston, the cylinder housing and the upper bearing housing is reduced again, the air in the cavity is compressed, and its pressure increases. The compressed air continues to blow to the top of the gyrorotor through the circular truncated cone hole on the upper bearing housing, driving the rotor to rotate, and then driving the output shaft to rotate, continuously outputting power.
3. Output Displacement Equation of Micro-Displacement Amplifying Mechanism
The micro-displacement amplifying mechanism is designed as a compound symmetrical three-stage amplifying structure with flexible hinges, which is composed of bridge structure I, lever structure, and bridge structure II. The flexure hinges adopt a straight beam structure with fillet.
The entire amplifying mechanism can achieve a more precise displacement amplification by coordinating bridge structure I, lever structure, and bridge structure II, to push the piston motion, compress the closed cavity enclosed by the piston, the cylinder housing, and the upper bearing housing, increase the pressure of the air in the closed cavity, drive the rotor to rotate, and then drive the output shaft connected with it to rotate, output power, as shown in Figure 3.
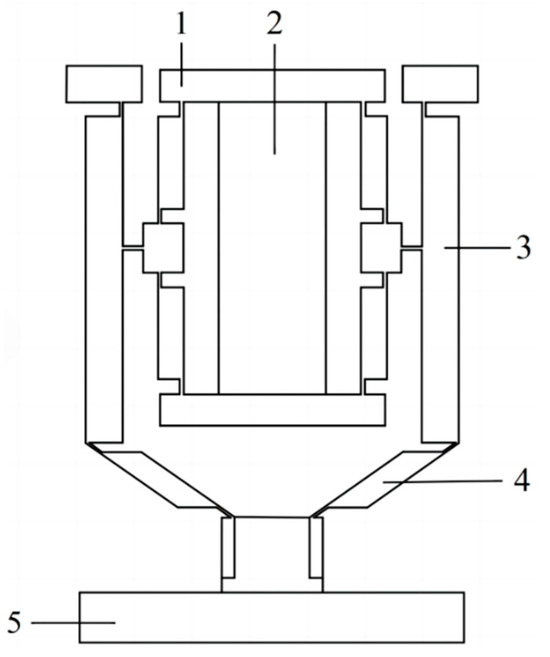
Figure 3.
The micro-displacement amplifying mechanism of the non-contact piezoelectric actuator. 1—bridge structure I; 2—piezoelectric stack; 3—lever structure; 4—bridge structure II; 5—piston.
According to the pseudo-rigid body theory, each straight beam flexure hinge with a fillet of the displacement amplifying mechanism is equivalent to a rigid hinge, its motion is simplified to the rotation of the rigid hinge, and the rigid body connected by the flexure hinge is equivalent to a rigid rod. Figure 3 shows that the displacement amplifying mechanism is a symmetrical structure centered on the piezoelectric stack, and the composite structure composed of bridge structure I, lever structure, and bridge structure II is simplified into two slider-crank mechanisms, respectively. That is to say, bridge structure I is simplified as the first slider-crank mechanism, the composite structure is composed of the lever structure, and bridge structure II is simplified as the second slider-crank mechanism, as shown in Figure 4.
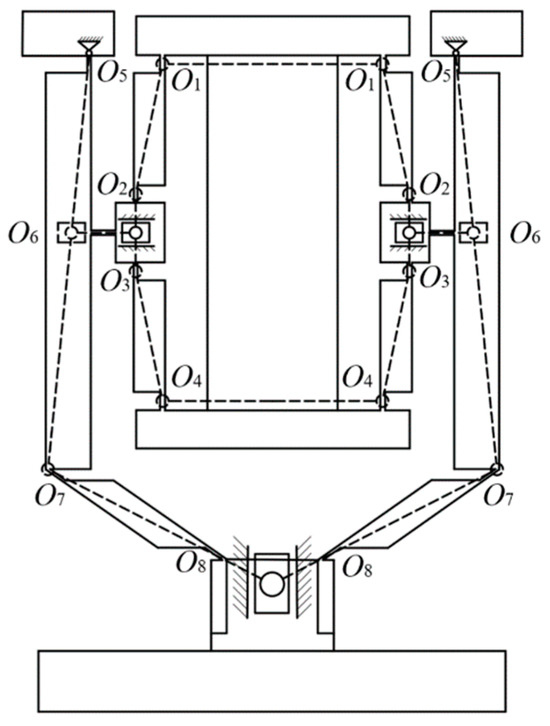
Figure 4.
Simplified model of the micro-displacement amplifying mechanism.
It is assumed that the rotation centers of each straight beam flexure hinges with a fillet of the displacement amplifying mechanism are . The distance between each rotation center in bridge structure I, that is, the bridge structure I’s rod length is , the rod length between the rotation center and in the composite structure is composed of lever, and bridge structure II, that is, the power arm length of bridge structure I driving the lever movement, is . The rod length between and , that is, the lever’s rod length, is , and the rod length between and , that is, the bridge structure II’s rod length, is , and the bridge structure II’s rod horizontal projection length is .
When the rising saw-tooth wave voltage signal is applied to the piezoelectric stack, it generates a micro-deformation displacement , and the bridge structure I will produce an angle variable based on the initial angle . For the bridge structure I, a cartesian coordinate system I is established with as the origin of coordinate, as shown in Figure 5a. The motion equation of the first slider-crank mechanism can be established as follows.
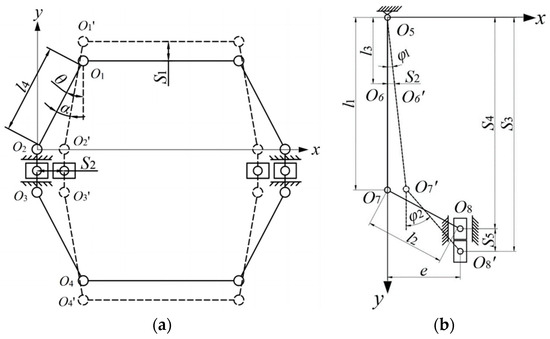
Figure 5.
Mathematical model of the micro-displacement amplifying mechanism. (a) Bridge structure I; (b) composite structure composed of lever and bridge structure II.
By simplifying Equation (1), the ratio of the output displacement of to the micro-deformation displacement of piezoelectric stack can be obtained.
After the piezoelectric stack is applied with the rising saw-tooth wave voltage signal, its micro-deformation displacement is several microns or ten microns. Therefore, after the bridge structure I is driven, the angle variable of the bridge arm is very small. By the equivalent infinitesimal principle in higher mathematics, Equation (2) can be simplified as follows:
From the composite structure composed of lever and bridge structure II, simplified as the second crank slider mechanism, a cartesian coordinate system II is established with as the origin of coordinate, as shown in Figure 5b. Due to the output end of the bridge structure I and the input end of the composite structure being flexibly hinged, the input displacement of point is equal to the output displacement of bridge structure I, which is . When the rising saw-tooth wave voltage signal is applied to the piezoelectric stack, the output displacement of bridge structure I is , and the rod is pulled to rotate relative to ; at this time, there will be an angle change . When the rod moves with , it also rotates with . Now, the angle between the rod and the y-axis direction is . The output displacement driven by the micro-displacement amplifying mechanism pushing the piston movement moves from the initial position of to the maximum position of along the y-axis of the cartesian coordinate system II. The motion equations are established as follows:
By simplifying Equation (4), it can be obtained
When the electrical signal becomes a descending saw-tooth wave voltage signal, the piezoelectric stack shrinks, the output displacement of bridge structure I is zero, and the lever returns to its initial state. At this time, the output end of the micro-displacement amplifying mechanism pulls the piston back to the initial position along the y-axis of the cartesian coordinate system II.
Now, the following equation of motion can be established:
According to the geometric relationship in Figure 5b,
The micro-deformation displacement generated by the piezoelectric stack is still very small after it is amplified by the bridge structure I, so the angle change generated by the composite structure composed of the lever and the bridge structure II under the action of is also very small. According to the equivalent infinitesimal principle in higher mathematics, it can be concluded that
By converting the angle change into angle system, the output displacement equation of the micro-displacement amplifying mechanism driving the piston movement in one period after the piezoelectric stack applied saw-tooth wave voltage signal can be established through Equations (3) and (5)–(8).
4. Result Analysis
4.1. Variation in Output Characteristics of Micro-Displacement Amplifying Mechanism with Parameters
Table 1 shows the structural parameters of the micro-displacement amplifying mechanism of the non-contact piezoelectric actuator. Substituting the data in Table 1 into Equation (9) using MATLAB mathematical software (MATLAB R2021b), driven by piezoelectric stack input displacement, the output displacement of the micro-displacement amplifying mechanism driving the piston motion is analyzed with the bridge structure I’s initial angle , the lever’s rod length , the bridge structure II’s rod length , the power arm length of the bridge structure I driving the lever movement, and the bridge structure II’s rod horizontal projection length . It lays a theoretical foundation for the structural design of the micro-displacement amplifying mechanism of the non-contact piezoelectric actuator.

Table 1.
Structure parameters of the micro-displacement amplifying mechanism.
The analysis in Figure 6 shows the following:
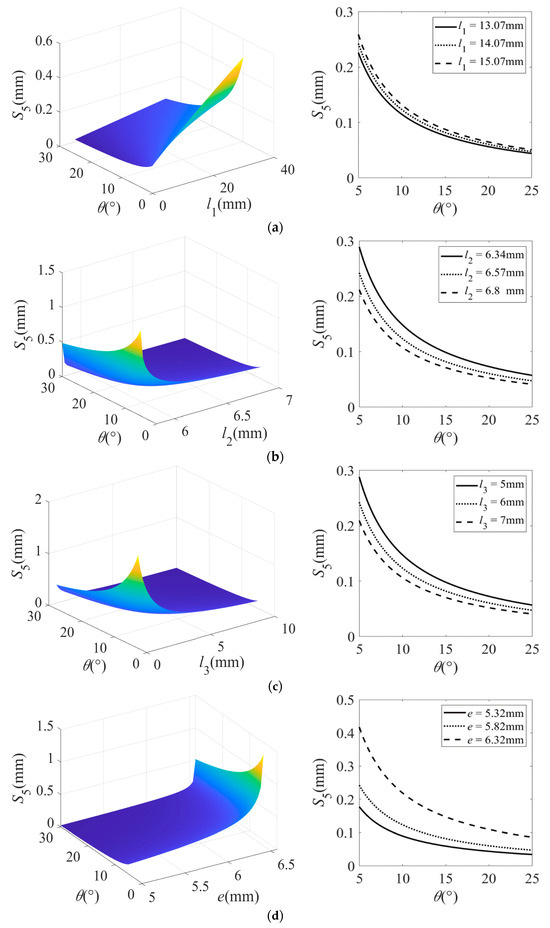
Figure 6.
The output displacements of the micro-displacement amplifying mechanism change with various parameters. (a) The output displacement varies with and ; (b) the output displacement varies with and ; (c) the output displacement varies with and ; (d) the output displacement varies with and .
- (1)
- Under the same lever rod length , bridge structure II rod length , power arm length of bridge structure I driving the lever motion, and bridge structure II’s rod horizontal projection length , the output displacement of the micro-displacement amplifying mechanism decreases nonlinearly with the increase in the bridge structure I’s initial angle , while the decrease rate gradually slows down.
- (2)
- Under the same bridge structure I’s initial angle , the output displacement of the micro-displacement amplifying mechanism increases significantly with the increase in the lever’s rod length and bridge structure II’s rod horizontal projection length . Moreover, the output displacement increases greatly with the increase in horizontal projection length .
- (3)
- Under the same bridge structure I’s initial angle , the output displacement of the micro-displacement amplifying mechanism decreases with the increase in the bridge structure II’s rod length and the power arm length of the bridge structure I driving the lever motion. Furthermore, with the increase in the two parameters, the reduction in the output displacement becomes smaller.
In short, when the above structural parameters change, the bridge structure I’s initial angle, the bridge structure II’s rod length, the power arm length of the bridge structure I driving the lever motion, and the bridge structure II’s rod horizontal projection length have obvious effects. But, the lever’s rod length has little influence. Moreover, when the composite structure composed of the lever and bridge structure II meets the design requirements, the larger the lever’s rod length, and the bridge structure II’s rod horizontal projection length, however, the smaller the bridge structure II’s rod length, and the power arm length of the bridge structure I driving the lever motion, together with the bridge structure I’s initial angle, the larger the output displacement of the micro-displacement amplifying mechanism.
As can be seen from the figure, the bridge structure I’s initial angle is between , and the composite structure’s size composed of the lever and bridge structure II is selected by combining the piezoelectric stack’s size and bridge structure I’s compact structure principle. The lever’s rod length is 13 mm–15 mm, the bridge structure II’s rod length is 6 mm–7 mm, and the power arm length of the bridge structure I driving the lever motion is 5 mm–7 mm, the bridge structure II’s rod horizontal projection length is 5 mm–6 mm, and the output displacement of the micro-displacement amplifying mechanism is larger.
4.2. Simulation Analysis for Output Characteristics of Micro-Displacement Amplifying Mechanism
The parametric design of the proposed non-contact piezoelectric actuator’s micro-displacement amplifying mechanism is carried out using PRO/E 3D design software (PRO/E 5.0). Then, it was imported into ANSYS Workbench analysis software (ANSYS Workbench 2021R2) to set material properties, divide grids, impose boundary constraints and displacement constraints, and simulate calculations. The mechanism is made of structural steel, and its material properties are shown in Table 2.

Table 2.
Material properties of the micro-displacement amplifying mechanism.
Selecting different piezoelectric stack input displacements , bridge structure I initial angles , lever rod lengths , bridge structure II rod lengths , power arm lengths of bridge structure I driving lever motion, and bridge structure II rod horizontal projection lengths , the simulation analysis results corresponding to each parameter are depicted in Figure 7, Figure 8 and Figure 9. The validity of the theoretical analysis is verified by comparing the theoretical, calculated, and simulated values of the output displacement of the micro-displacement amplifying mechanism. The results are useful for further optimization design of the micro-displacement amplifying mechanism of the non-contact piezoelectric actuator.

Figure 7.
Finite element analysis of output displacement of the micro-displacement amplifying mechanism with different piezoelectric stack input displacements. (a) Finite element model; (b) ; (c) ; (d) .
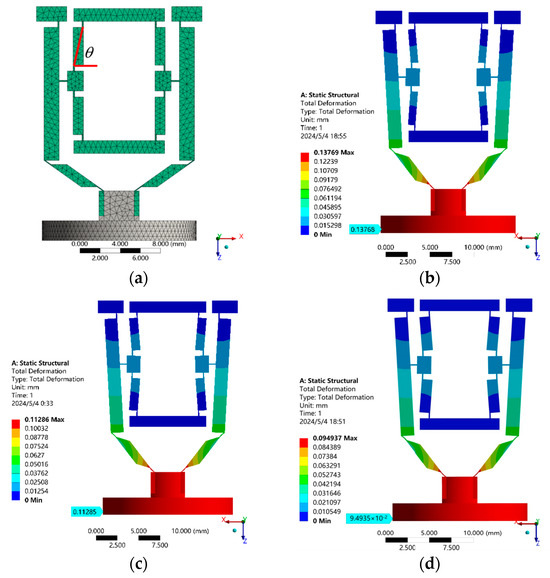
Figure 8.
Finite element analysis of output displacement of the micro-displacement amplifying mechanism at different bridge structure I’s initial angles. (a) Finite element model; (b) ; (c) ; (d) .
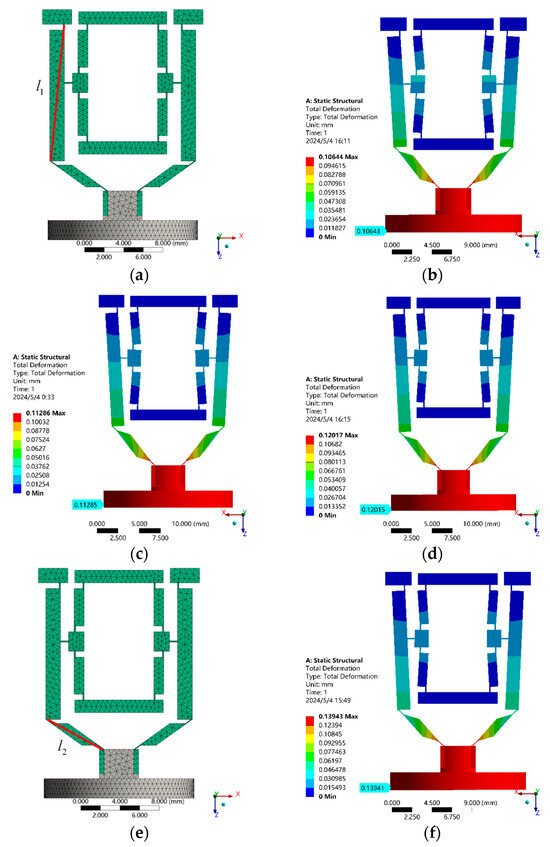
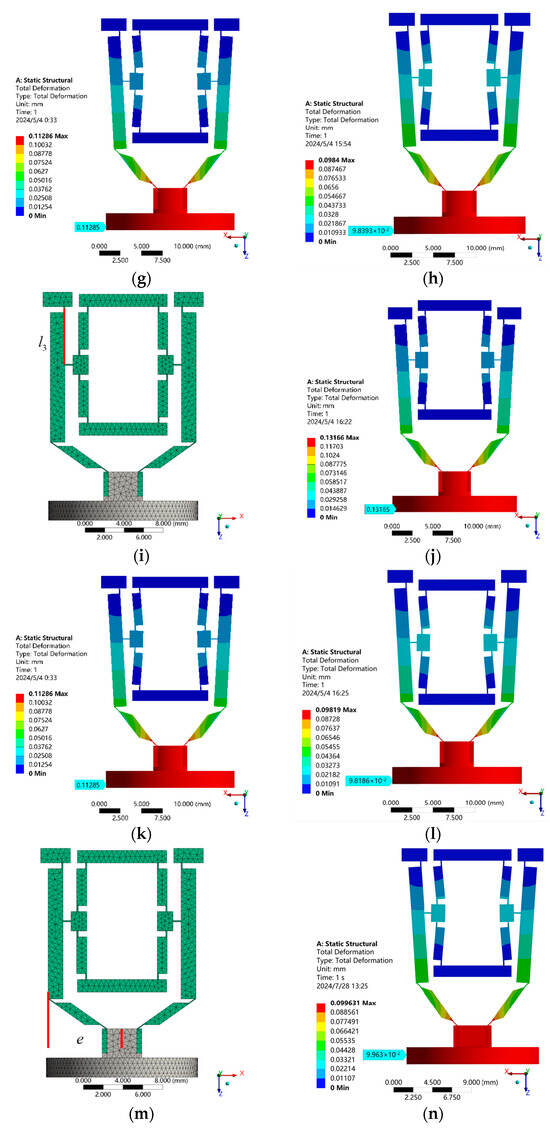
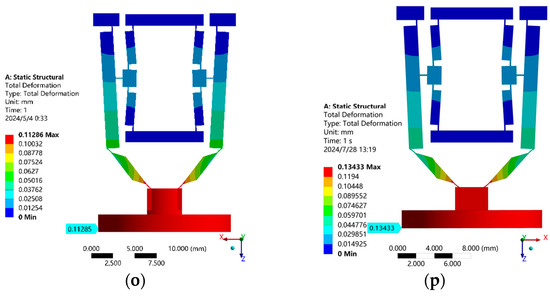
Figure 9.
Finite element analysis of output displacement of the micro-displacement amplifying mechanism at different parameters of composite structure composed of lever and bridge structure II. (a) Finite element model; (b) ; (c) ; (d) ; (e) finite element model; (f) ; (g) ; (h) ; (i) finite element model; (j) ; (k) ; (l) ; (m) finite element model; (n) ; (o) ; (p) .
Table 3 shows the following:

Table 3.
Comparison between theoretical and simulated output displacements of the micro-displacement amplifying mechanism at different piezoelectric stack input displacements.
- (1)
- As the piezoelectric stack’s input displacement increases, the theoretical and simulated output displacements amplified by the micro-displacement amplifying mechanism increase. The theoretical displacement magnification decreases, whereas the simulated displacement magnification remains constant.
- (2)
- Compared with the simulated output displacement, the theoretical output displacement of the micro-displacement amplifying mechanism is slightly larger than the simulated displacement, and there are some errors between them. However, as the input displacement increases, the error gradually decreases. This is because each rod is assumed to be rigid in the theoretical calculation, and the deformation only occurs at the flexible hinge. However, the simulation cloud diagrams show that when each rod’s size is small, there is a slight deformation in each rod in addition to at the flexible hinge. This results in a discrepancy between the theoretical and simulation values, although the error is less than 10%, which still meets the practical requirements. As the input displacement of the micro-displacement amplifying mechanism continues to increase, the simulated value and the theoretical value will tend to be consistent.
Table 4 shows the following:

Table 4.
Comparison between theoretical and simulated output displacements of the micro-displacement amplifying mechanism at different bridge structure I’s initial angles.
- (1)
- As bridge structure I’s initial angle increases, the theoretical and simulated output displacements amplified by the micro-displacement amplifying mechanism are reduced. Moreover, the displacement magnification of both of them also decreased.
- (2)
- Compared with the simulated output displacement, the theoretical output displacement of the micro-displacement amplifying mechanism is slightly larger than the simulated displacement, and there are some errors between them. Furthermore, as bridge structure I’s initial angle increases, the error gradually decreases.
- (3)
- When bridge structure I’s initial angle is small (less than 10°), although the theoretical and simulated output displacements are large, and the displacement magnification is also large, it can be seen from the analysis of cloud images that each rod’s deformation is large, resulting in more invalid energy consumption, leading to a large error between the two.
Table 5 shows the following:

Table 5.
Comparison between theoretical and simulated output displacements of the micro-displacement amplifying mechanism at different parameters of composite structure composed of lever and bridge structure II.
- (1)
- As the lever’s rod length and the bridge structure II’s rod horizontal projection length increase, both the theoretical and simulated displacements amplified by the micro-displacement amplifying mechanism increase, and the displacement magnifications also increase.
- (2)
- As the bridge structure II’s rod length and the power arm length of bridge structure I drive lever motion, the theoretical and simulated displacements amplified by the micro-displacement amplifying mechanism decrease, and the displacement magnifications also decrease.
- (3)
- Compared with the simulated displacement, the theoretical displacement amplified by the micro-displacement amplifying mechanism is slightly larger than the simulated displacement. There is a certain error between the two, and the error is about 10%, which meets the design requirements. The validity of the theoretical analysis method is verified.
5. Optimal Design
Utilizing mathematical statistical methods and Minitab analysis software (Minitab 18), the value range of structural parameters for the micro-displacement amplifying mechanism obtained from the above research is designed through a full factorial experiment. Furthermore, significant factors influencing the output displacement of the micro-displacement amplifying mechanism are identified and the maximum output displacement is predicted.
5.1. Fitting Mathematical Model
Considering the influencing factors on the output displacement of the micro-displacement amplifying mechanism and their interactions, three tests were conducted at the central point, resulting in a total of 35 (25 + 3) tests. The experimental data table for structural optimization of the micro-displacement amplifying mechanism are presented as shown in Table 6.

Table 6.
Experimental data table for structural optimization of the micro-displacement amplifying mechanism.
According to the above experimental data table (See Table 6), the mathematical model is fitted, which includes the main effects of all factors and the second-order interaction effects among all factors. Through analysis and research, the interaction effects of the third-order and above have little influence on the output displacement of the micro-displacement amplifying mechanism, which can be ignored. The calculation results are shown in Figure 10.
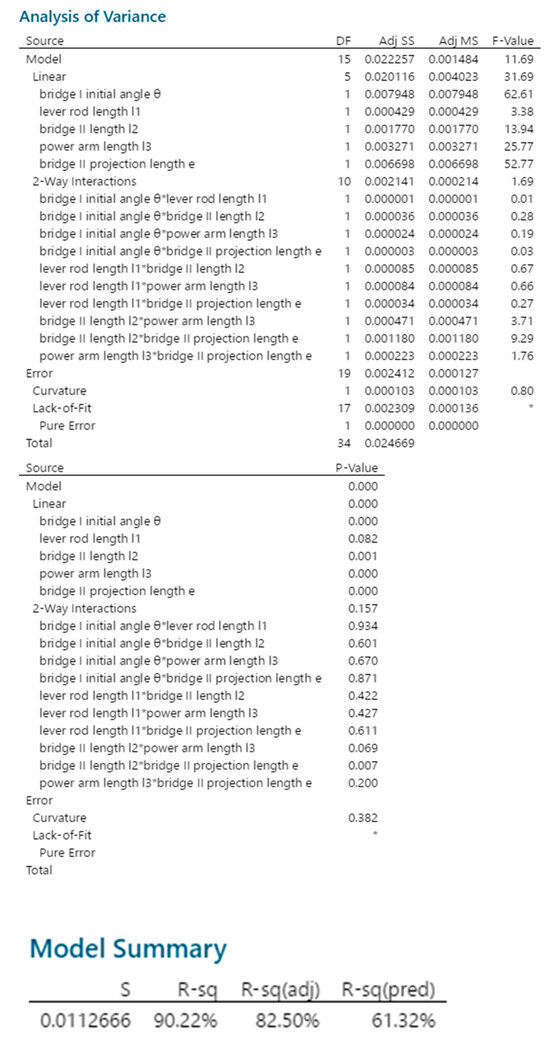
Figure 10.
Analysis of variance of output displacement of the micro-displacement amplifying mechanism. “*” indicates that a fitting model for this experimental data is available.
From Figure 10, it is known that the curvature p-value = 0.382 > 0.05. The model does not display bending, so it can be determined that the test data model does not contain a square term. The index R-sq = 90.22% and R-sq(pred) = 61.32%, which are used to measure the fit degree between regression model and data, have a large gap between them, showing there is still room for improvement in this model.
From Figure 11, it is known that the main factors such as bridge structure I’s initial angle (factor A), bridge structure II’s rod length (factor C), power arm length of bridge structure I driving lever motion (factor D), bridge structure II’s rod horizontal projection length (factor E), and the interaction effects of bridge structure II’s rod length (factor C) *, as well as bridge structure II’s rod horizontal projection length (factor E), have significant influences on the output displacement of the micro-displacement amplifying mechanism. Additionally, the influence of other factor and the interaction between factors on the output displacement of the micro-displacement amplifying mechanism are not significant.
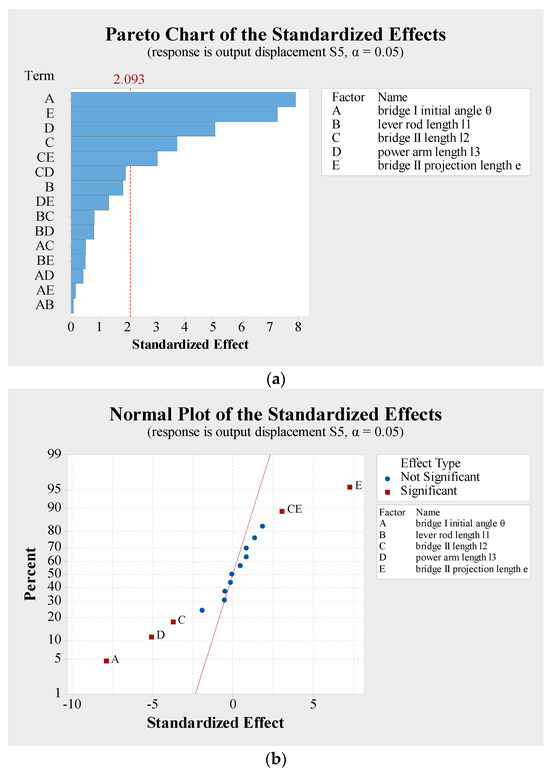
Figure 11.
Pareto chart and normal plot of each factor effect affecting output displacement of the micro-displacement amplifying mechanism. (a) Pareto chart of factor effects; (b) normal plot of factor effects.
5.2. Residual Diagnosis
The residual of the above mathematical model is analyzed to further diagnose the fitting of the model and data, and determine the correctness of the model.
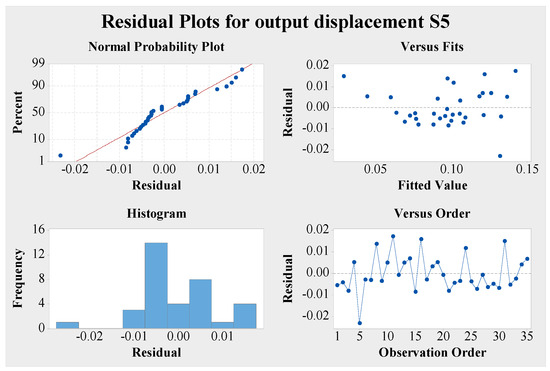
Figure 12.
Four-in-one diagram of residual diagnosis of output displacement of the micro-displacement amplifying mechanism.
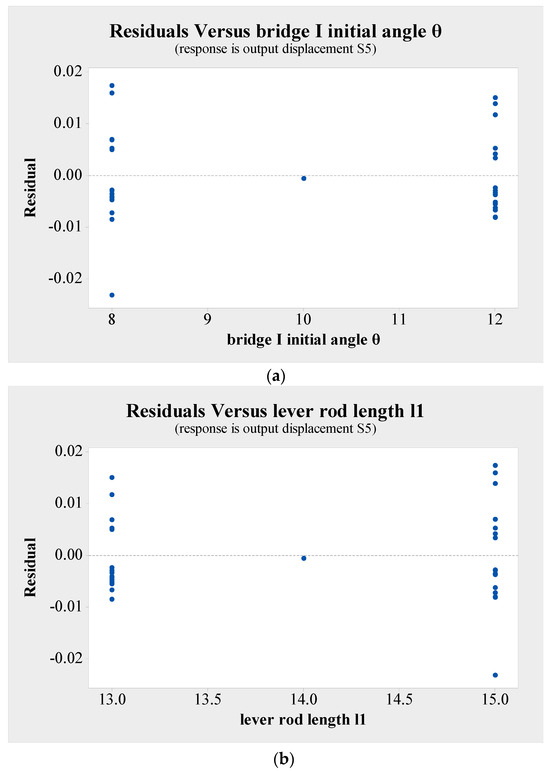
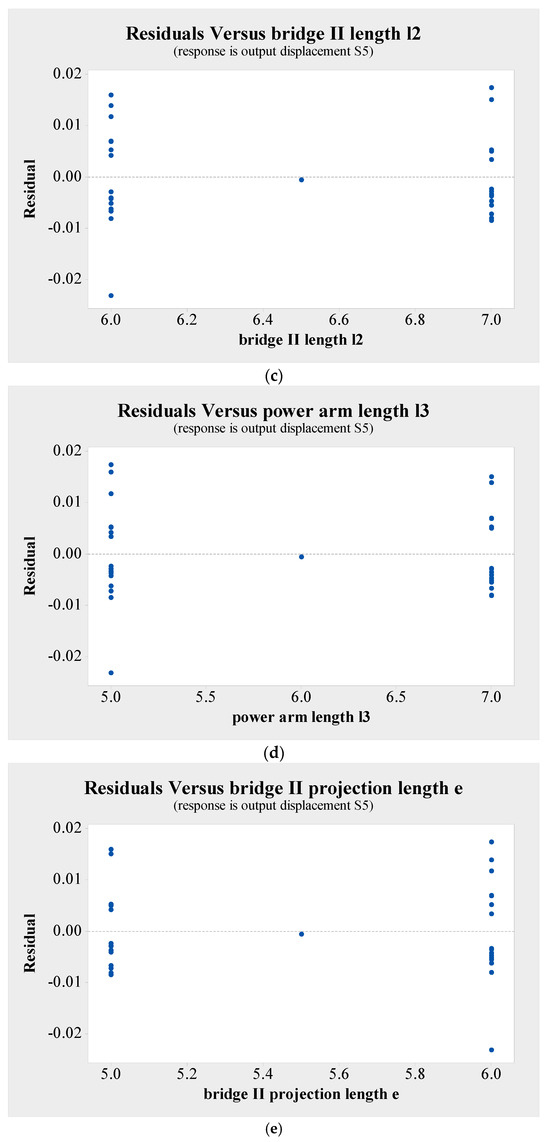
Figure 13.
Residuals of output displacement of the micro-displacement amplifying mechanism on each influence factor. (a) Residuals versus bridge I initial angle θ; (b) Residuals versus lever rod length l1; (c) Residuals versus bridge structure II rod length l2; (d) Residuals versus power arm length l3 of bridge structure I driving the lever motion; (e) Residuals versus bridge structure II rod horizontal projection length e.
- (1)
- In the scatter plot (bottom right) with the observation order as the horizontal axis, each point fluctuates randomly up and down the horizontal axis.
- (2)
- In the scatter plot (top right) with the predicted output displacement as the horizontal axis, there is no funnel type, and the residuals maintain equal variance.
- (3)
- In the normal probability graph on the upper left (or the histogram on the lower left), the residuals basically follow a normal distribution.
- (4)
- There is no bending tendency in the scatter plots with each influence factor as the horizontal axis.
In a word, the above mathematical model fits well with the data, which proves the correctness of the model.
5.3. Mathematical Model Improvement
In the above analysis, the main effects such as lever’s rod length (factor B), interaction effects of bridge structure I’s initial angle * lever’s rod length (factor A*B), bridge structure I’s initial angle * bridge structure II’s rod length (factor A*C), bridge structure I’s initial angle * power arm length of bridge structure I driving lever motion (factor A*D), bridge structure I’s initial angle * bridge structure II’s rod horizontal projection length (factor A*E), lever’s rod length * bridge structure II’s rod length (factor B*C), lever’s rod length * power arm length of bridge structure I driving lever motion (factor B*D), lever’s rod length * bridge structure II’s rod horizontal projection length (factor B*E), bridge structure II’s rod length * power arm length of bridge structure I driving lever motion (factor C*D), and power arm length of bridge structure I driving lever motion * bridge structure II’s rod horizontal projection length (factor D*E) have no significant influence on the output displacement of the micro-displacement amplifying mechanism, so they are deleted. The analysis of the factorial design of the model with the above non-relevant effects deleted is carried out, and the calculation results are shown in Figure 14.
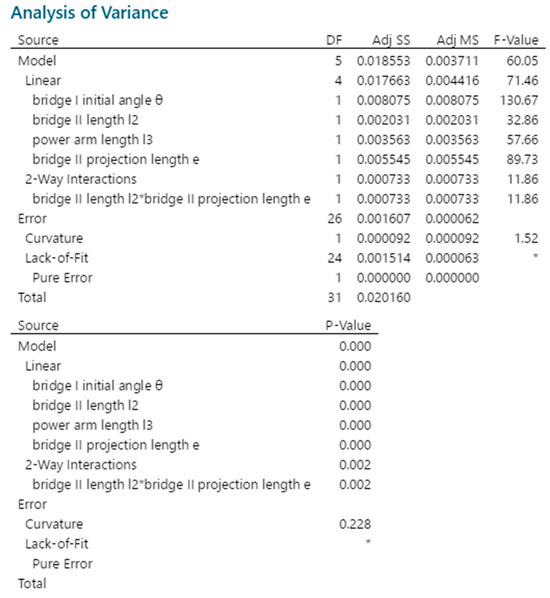

Figure 14.
Analysis of variance about output displacement of the micro-displacement amplifying mechanism after removing non-significant factors. “*” indicates that a fitting model for this experimental data is available.
From Figure 14, the following is known:
- (1)
- The p-values of the main effects and the second-order interaction are 0.000 and 0.002, respectively, and both are less than 0.05, indicating that the deleted model is valid.
- (2)
- R-sq(pred) after deletion = 87.20% > R-sq(pred) before deletion = 61.32%, standard deviation S = 0.0078611 after deletion < S = 0.0112666 before deletion, so the regression effect of the model is better after the deletion of insignificant main factors and interaction terms.
Figure 15 and Figure 16 show that the residual graph of the deleted model has the same variation pattern as the residual graph before deletion, and the residuals follow a normal distribution. So, the deleted model fits well with the data, and all residual plots are normal. This model can be used for optimization design analysis of the micro-displacement amplifying mechanism.
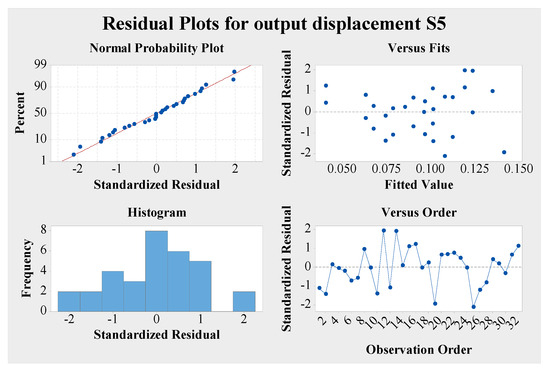
Figure 15.
Four-in-one diagram of residual diagnosis of output displacement of the micro-displacement amplifying mechanism after removing non-significant factors.
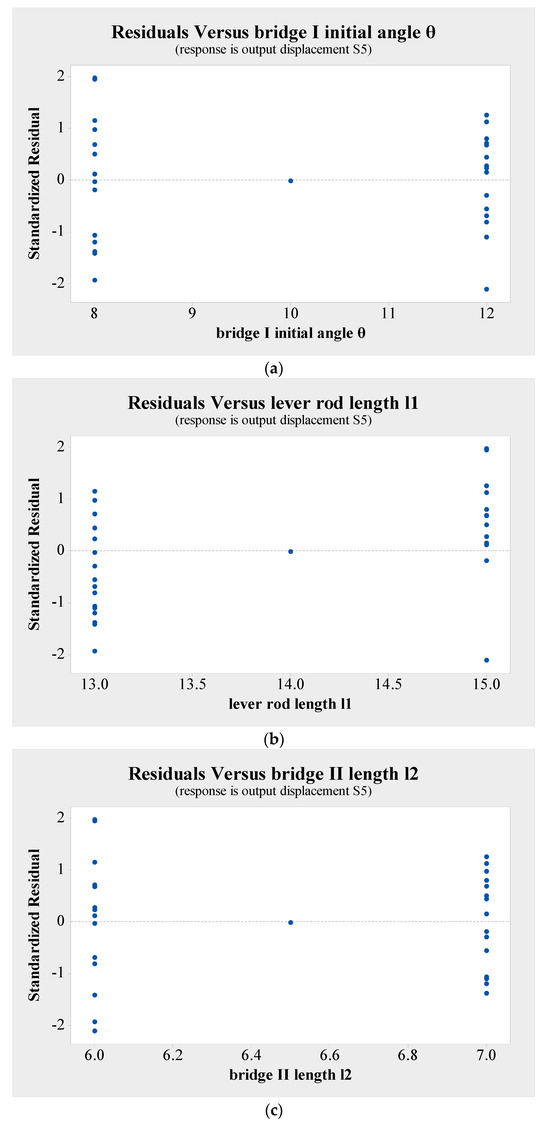
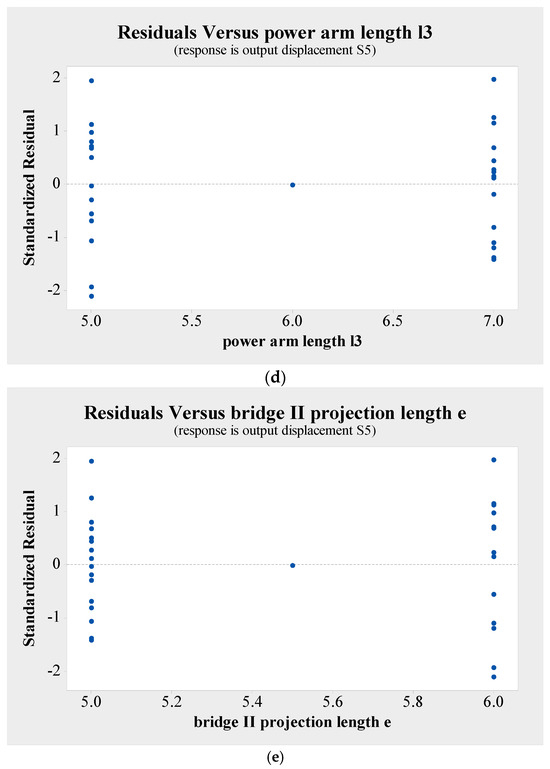
Figure 16.
Residuals of output displacement of the micro-displacement amplifying mechanism on each influence factor after removing non-significant factors. (a) Residuals versus bridge I initial angle θ; (b) Residuals versus lever’s rod length l1; (c) Residuals versus bridge structure II’s rod length l2; (d) Residuals versus power arm length l3 of bridge structure I driving the lever motion; (e) Residuals versus bridge structure II’s rod horizontal projection length e.
5.4. Optimization Analysis
The significant influencing factors and the optimal settings for each factor can be intuitively and specifically determined from the main effects plot and interaction plot that affect the output displacement of the micro-displacement amplifying mechanism.
From Figure 17, the following is known:
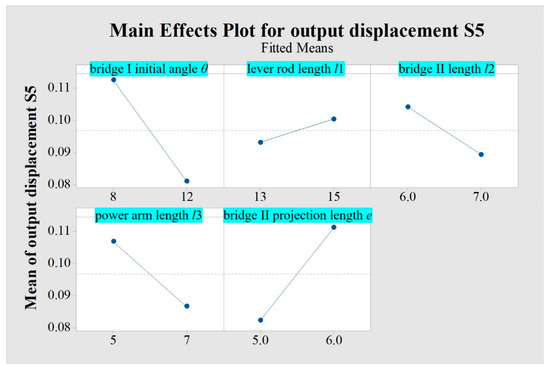
Figure 17.
Main effects plot of output displacement of the micro-displacement amplifying mechanism.
- (1)
- The regression lines of factors such as bridge structure I’s initial angle, bridge structure II’s rod length, the power arm length of bridge structure I driving lever motion, and bridge structure II’s rod horizontal projection length are steep, so the influences of these main effects are indeed significant, while the regression line of a factor such as lever’s rod length is relatively flat, so the influence of that main effect is not significant.
- (2)
- In order to obtain the maximum output displacement of the micro-displacement amplifying mechanism, the smaller the bridge structure II’s rod length, the power arm length of the bridge structure I driving the lever motion, and the bridge structure I’s initial angle, and the larger the lever’s rod length and bridge structure II’s rod horizontal projection length, the better. The correctness of the above theoretical analysis is verified again.
From Figure 18, it is known that the effect lines of the power arm length of the bridge structure I driving the lever motion and the bridge structure II’s rod horizontal projection length are obviously not parallel, indicating a significant interaction effect between the two.
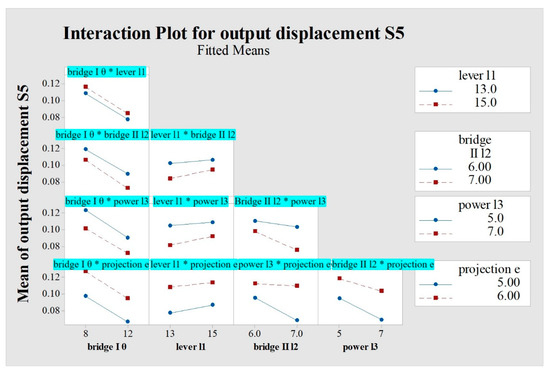
Figure 18.
Interaction plot of output displacement of the micro-displacement amplifying mechanism. “*” represents the interaction of two factors, which is “×”.
From Figure 19, Figure 20 and Figure 21, it is shown that the output displacement of the micro-displacement amplifying mechanism reaches its maximum value of 0.142 mm when the bridge structure I’s initial angle is 8°, the lever’s rod length is 15 mm, the bridge structure II’s rod length is 7 mm, the power arm length of bridge structure I driving lever motion is 5 mm, and the bridge structure II’s rod horizontal projection length is 6 mm (as shown the point in the upper right corner of Figure 19 and Figure 20).
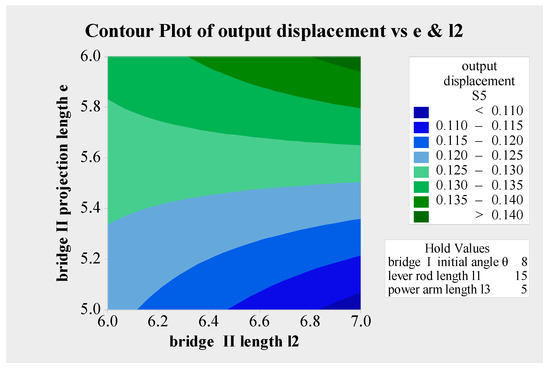
Figure 19.
Contour plot of output displacement of the micro-displacement amplifying mechanism.
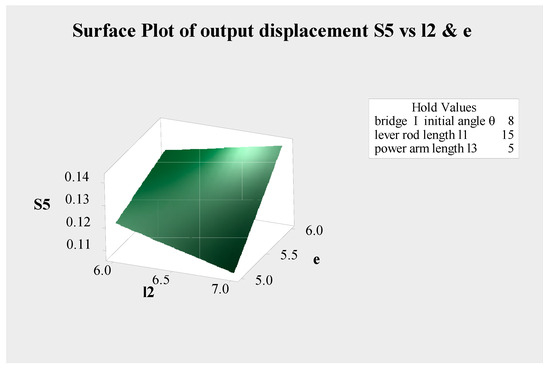
Figure 20.
Surface plot of output displacement of the micro-displacement amplifying mechanism.

Figure 21.
Optimization results of output displacement of the micro-displacement amplifying mechanism. The oblique straight lines in each figure directly show the influence of the change of each influence factor on the output displacement of the micro-displacement amplifying mechanism. The output displacement of the micro-displacement amplifying mechanism is the maximum when the top value of each influence factor is taken respectively.
5.5. Optimization Result Verification
After determining the optimal size of each component in the micro-displacement amplifying mechanism (see Table 7), the mechanism is then modeled. The output displacement of the optimized micro-displacement amplifying mechanism can be obtained using the simulation analysis method described above. The analysis result is shown in Figure 22.

Table 7.
Structure parameters of the optimized micro-displacement amplifying mechanism.
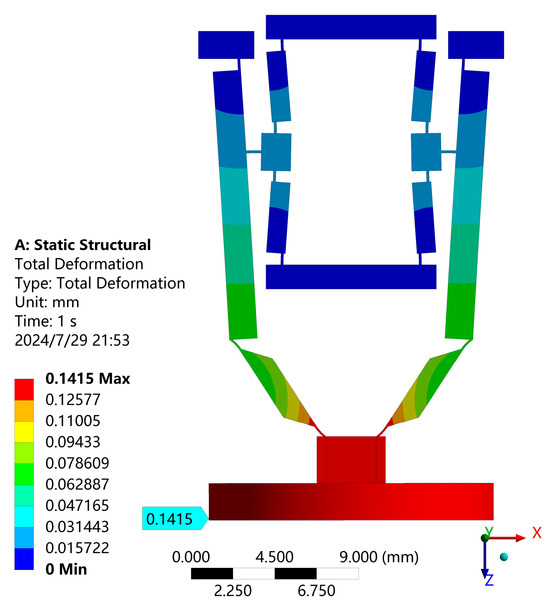
Figure 22.
Output displacement of the optimized micro-displacement amplifying mechanism.
From Figure 22, it is known that the output displacement of the optimized micro-displacement amplifying mechanism is 0.1415 mm, which is consistent with the maximum output displacement of 0.142 mm predicted using the optimal design of the mathematical model. So, the correctness of the optimization design analysis method is proved.
6. Experimental Test
After the prototype is manufactured and assembled, the output characteristics of the prototype are tested through experiments, and the experimental data are compared with the theoretical calculation and simulation results.
During the test, the saw-tooth wave signal generated by the wave generator is amplified by the power amplifier and applied to the piezoelectric stack. The signal voltage ranges from 100 to 150 V, and the signal frequency is 1 Hz. This results in longitudinal deformations of 0.003 mm, 0.004 mm, and 0.005 mm, respectively, which act on the micro-displacement amplifying mechanism that matches with interference. Following multistage amplification, the output end drives piston movement, and this displacement is measured via an inductive displacement sensor for performance testing of the prototype as shown in Figure 23. The test value of the output displacement of the micro-displacement amplifying mechanism is compared with the theoretical value and the simulated value, as shown in Table 8.
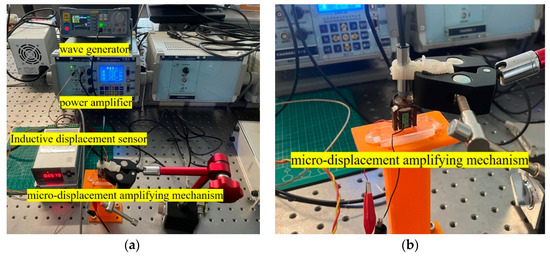
Figure 23.
Prototype output characteristics test of the micro-displacement amplifying mechanism. (a) Test of output performance; (b) test prototype.

Table 8.
Comparison of test data with theoretical and simulated values.
Table 8 shows the following:
- (1)
- Under the same input displacement excitation, the test values of the output displacement of the micro-displacement amplifying mechanism are smaller than the theoretical and simulated values. There are errors, and the error compared with the theoretical values is larger than that with the simulated values.
- (2)
- The smaller the input excitation displacement, the greater the error, and the larger the input excitation displacement, the smaller the error. Compared with the theoretical values, the maximum error is 29.43% and the minimum error is 19.8%, and compared with the simulated values, the maximum error is 21.45% and the minimum error is 12.44%.
The causes of the aforementioned errors are as follows:
- (1)
- Processing factors. Due to the machining accuracy errors of the contact surface matching the piezoelectric stack, flexure hinges, and symmetrical parts in the micro-displacement amplifying mechanism, the partial deformation of the piezoelectric stack is canceled, and the remaining deformation amplified by the micro-displacement amplifying mechanism is small.
- (2)
- Experimental factors. The installation method of the fixed micro-displacement amplifying mechanism and the displacement sensor, the displacement sensor’s accuracy, and the vibration generated by the test instrument on the workbench will all have a certain impact on the test results of the micro-displacement amplifying mechanism, producing small displacements.
To enhance the output displacement of the micro-displacement amplifying mechanism and facilitate the movement of the transmission module, a special tooling for the fixed displacement amplifying mechanism will be designed and processed subsequently. Additionally, a machine tool with higher precision will be employed to process the micro-displacement amplifying mechanism. During testing, the vibration absorbing scheme will be adopted for the test instrument and the fixture of the fixed micro-displacement amplifying mechanism on the workbench. Furthermore, a displacement sensor with higher measurement accuracy will be utilized to test the output displacement of the amplifying mechanism in order to reduce external factors’ influence on testing results for the micro-displacement amplifying mechanism.
In a word, the output displacement test values of the micro-displacement amplifying mechanism are consistent with the changes in the influence of theoretical calculations and simulation analyses on the input displacement, thus confirming the accuracy of the theoretical calculations and simulation analyses.
7. Conclusions
- (1)
- A non-contact piezoelectric actuator is proposed. The non-contact power transmission between the stator and rotor is realized by pneumatic conveying, which has the characteristics of fast response, low heat, long service life, compact structure, and easy miniaturization and control, especially suitable for the field of high-speed and small-load micro-drive. The structure of the non-contact piezoelectric actuator is designed and its operation principle is expounded.
- (2)
- The parametric model of the non-contact piezoelectric actuator is established. The equation of the relationship between the output displacements of the micro-displacement amplifying mechanism for non-contact piezoelectric actuators and the input displacements of the piezoelectric stack is deduced, and the simulation analysis method of output displacements of the micro-displacement amplifying mechanism is established. The output characteristics of the micro-displacement amplifying mechanism for the non-contact piezoelectric actuator and their changes along with the input displacement and size parameters are studied from both theoretical and simulation aspects.
- (3)
- Compared with the parameter changes of bridge structure I, and the composite structure composed of lever and bridge II, the bridge structure I’s initial angle has an obvious effect on the output characteristics of the micro-displacement amplifying mechanism in the range of 5°–15°. Under the condition that the composite structure consisting of the lever and bridge II meets the design requirements, the lever’s rod length is 13 mm–15 mm, the bridge structure II’s rod length is 6 mm–7 mm, the power arm length of the bridge structure I driving lever is 5 mm–7 mm, the bridge structure II’ s rod horizontal projection length is 5 mm–6 mm and the output displacement of the micro-displacement amplifying mechanism is larger. According to the optimal design results, the bridge structure I’s initial angle is 8°, the lever’s rod length is 15 mm, the bridge structure II’s rod length is 7 mm, the power arm length of bridge structure I driving lever is 5 mm, and the bridge structure II’s rod horizontal projection length is 6 mm, the simulated output displacement of the micro-displacement amplifying mechanism is the maximum, which is 0.1415 mm.
- (4)
- When the relevant parameters change, the theoretical output displacement of the micro-displacement amplifying mechanism is slightly larger than the simulated displacement, and the error is about 10%. It can be seen from the prototype test that the smaller the input excitation displacement of the micro-displacement amplifying mechanism, the larger the error, whereas the larger the input excitation displacement, the smaller the error. When the input excitation displacement is 0.005 mm, the test value of the output displacement of the micro-displacement amplifying mechanism is 0.1239 mm, and the error compared with the theoretical value is 19.8% and the error compared with the simulated value is 12.44%. The error causes are analyzed and the improvement measures are put forward. The validity of the micro-displacement amplifying mechanism design, the accuracy of the theoretical calculation method, and the simulation analysis approach for output characteristics have been confirmed.
Author Contributions
Conceptualization, H.L.; investigation, D.Z., Y.L. and Z.S.; validation, Z.C., C.L. and L.Z.; writing—original draft, D.Z.; writing—review and editing, H.L. All authors have read and agreed to the published version of the manuscript.
Funding
This research was funded by the Basic Research Project of Huai’an City of China (HABL 2023009), PhD Research Fund Project of Huaiyin Institute of Technology (Z301B20502), Open Fund for Jiangsu Key Laboratory of Advanced Manufacturing Technology (HGAMTL-2102), and Foundation of the Higher Educations Institutions of Jiangsu Province (23KJB460004).
Data Availability Statement
All relevant data are within the paper.
Conflicts of Interest
The authors declare no conflicts of interest.
References
- Aoyagi, M.; Beeby, S.; White, N. A novel multi-degree-of-freedom thick-film ultrasonic motor. IEEE Trans. Ultrason. Ferroelectr. Freq. Control 2002, 49, 151–158. [Google Scholar] [CrossRef] [PubMed]
- Wang, Y.; Yan, P. A novel bidirectional complementary-type inchworm actuator with parasitic motion based clamping. Mech. Syst. Signal Process. 2019, 134, 106360. [Google Scholar] [CrossRef]
- Li, H.; Tong, Y.; Li, C. Modeling and Control of a Linear Piezoelectric Actuator. Actuators 2024, 13, 55. [Google Scholar] [CrossRef]
- Wang, T.; Xu, L. Chaotic vibrations by a novel non-contact piezoelectric actuator. Appl. Math. Model. 2022, 106, 199–224. [Google Scholar] [CrossRef]
- Li, H.; Gao, S.; Chen, Z.; Yin, Y. Structural design and dynamic characteristic analysis of short-column micro piezoelectric power actuator. Recent Pat. Mech. Eng. 2024, 17, 143–156. [Google Scholar] [CrossRef]
- Wang, R.; Hu, Y.; Shen, D.; Ma, J.; Li, J.; Wen, J. A novel piezoelectric inchworm actuator driven by one channel direct current signal. IEEE Trans. Ind. Electron. 2021, 68, 2015–2023. [Google Scholar] [CrossRef]
- Chen, Z.; Li, X.; Ci, P.; Liu, G.; Dong, S. A standing wave linear ultrasonic motor operating in in-plane expanding and bending modes. Rev. Sci. Instrum. 2015, 86, 035002. [Google Scholar] [CrossRef] [PubMed]
- Wang, T.; Xu, L. A Hybrid Dynamic Model for a Rotary Piezoelectric Motor Without Sliding Friction. J. Vib. Eng. Technol. 2023, 11, 3549–3564. [Google Scholar] [CrossRef]
- Jeong, S.; Park, C.; Park, T. Optimal design of V-type ultrasonic motor. J. Cent. South Univ. Technol. 2010, 17, 1247–1250. [Google Scholar] [CrossRef]
- Ghosh, B.; Jain, R.; Majumder, S.; Roy, S.; Mukhopadhyay, S. Experimental characterizations of bimorph piezoelectric actuator for robotic assembly. J. Intell. Mater. Syst. Struct. 2017, 28, 2095–2109. [Google Scholar] [CrossRef]
- Mohd, R.; Wan, Y.; Mat, P. Increasing the efficiency of traveling wave ultrasonic motor by modifying the stator geometry. Ultrasonics 2016, 64, 177–185. [Google Scholar] [CrossRef] [PubMed]
- Lim, B.; Jang, N.; Hwang, D. Compact stick–slip piezoelectric rotary motor with reduced undesired backward motion. Microsyst. Technol. 2024, 30, 1049–1061. [Google Scholar] [CrossRef]
- Timmermann, E.; Bansemer, R.; Gerling, T.; Hahn, V.; Weltmann, K.; Nettesheim, S.; Puff, M. Piezoelectric-driven plasma pen with multiple nozzles used as a medical device: Risk estimation and antimicrobial efficacy. J. Phys. D Appl. Phys. 2021, 54, 107231. [Google Scholar] [CrossRef]
- Moallemi, A.; Fan, R.; Zhang, Y.; Forughi, A.; Chen, L.; Zhao, Y.; Wu, Z.; Nagamune, R.; Chou, K.; Zeng, H.; et al. Development of a hybrid piezoelectric and pneumatic miniature optical scanner for endoscopic applications. Sens. Actuators A Phys. 2020, 315, 112311. [Google Scholar] [CrossRef]
- Ho, S.; Jan, S. A piezoelectric motor for precision positioning applications. Precis. Eng. 2016, 43, 285–293. [Google Scholar] [CrossRef]
- Saikumar, J.; Kim, J.; Byrns, C.; Hemphill, M.; Meaney, D.; Bonini, N. Inducing different severities of traumatic brain injury in Drosophila using a piezoelectric actuator. Nat. Protoc. 2021, 16, 263–282. [Google Scholar] [CrossRef] [PubMed]
- Lau, J.; Liang, W.; Liaw, H.; Tan, K. Sliding mode disturbance observer-based motion control for a piezoelectric actuator-based surgical device. Asian J. Control 2018, 20, 1194–1203. [Google Scholar] [CrossRef]
- Mashimo, T.; Izuhara, S.; Arai, S.; Zhang, Z.; Oku, H. High-speed visual feedback control of miniature rotating mirror system using a micro ultrasonic motor. IEEE Access 2019, 8, 38546–38553. [Google Scholar] [CrossRef]
- Hunstig, M. Piezoelectric inertia motors—A critical review of history, concepts, design, applications, and perspectives. Actuators 2017, 6, 7. [Google Scholar] [CrossRef]
- Sashida, T. Trial construction and operation of an ultrasonic vibration driven motor. Oyo Butsiuri 1982, 6, 713–718. [Google Scholar]
- Sashida, T. Motor Device Utilizing Ultrasonic Oscillation. U.S. Patent US4562374, 31 December 1985. [Google Scholar]
- Yukihiro, I. Ultrasonic motor. J. Acoust. Soc. Jpn. 1987, 43, 184–188. [Google Scholar]
- Xu, L.; Li, H.; Li, C. Displacements of the flexible ring for an electromechanical integrated harmonic piezodrive system. Struct. Eng. Mech. Int. J. 2016, 60, 1079–1092. [Google Scholar] [CrossRef]
- Delibas, B.; Koc, B. L1B2 Piezo Motor Using D33 Effect. In ACTUATOR 2018, Proceedings of the 16th International Conference on New Actuators, Bremen, Germany, 25–27 June 2018; IEEE: Piscataway, NJ, USA, 2018; pp. 1–4. [Google Scholar]
- Xing, J.; Ren, W.; Qin, Y. Electromagnetic torque analysis for a non-contact piezoelectric motor modulated by an electromagnetic field. Int. J. Appl. Electromagn. Mech. 2020, 62, 383–401. [Google Scholar] [CrossRef]
- Hirose, S.; Yamayoshi, Y.; Ono, H. A small noncontact ultrasonic motor. In Proceedings of the 1993 Proceedings IEEE Ultrasonics Symposium, Baltimore, MD, USA, 31 October–3 November 1993; IEEE: Piscataway, NJ, USA, 1993; Volume 1, pp. 453–456. [Google Scholar]
- Nakamura, K.; Maruyama, M.; Ueha, S. A new ultrasonic motor using electro-rheological fluid and torsional vibration. Ultrasonics 1996, 34, 261–264. [Google Scholar] [CrossRef]
- Ueha, S.; Hashimoto, Y.; Koike, Y. Non-contact transportation using near-field acoustic levitation. Ultrasonics 2000, 38, 26–32. [Google Scholar] [CrossRef]
- Wang, T.; Xu, L.; Xing, J. Torque for non-contact piezoelectric motor modulated by electromagnetic force. Int. J. Appl. Electromagn. Mech. 2021, 67, 409–429. [Google Scholar] [CrossRef]
- Nakamura, K.; Ito, T.; Kurosawa, M.; Ueha, S. A trial construction of an ultrasonic motor with fluid coupling. Jpn. J. Appl. Phys. 1990, 29, 160–161. [Google Scholar] [CrossRef]
- Hu, J.; Yamazaki, T.; Nakamura, K.; Ueha, S. Analyses of an ultrasonic motor driving fluid directly. Jpn. J. Appl. Phys. 1995, 34, 2702–2706. [Google Scholar] [CrossRef]
- Yamayoshi, Y.; Hirose, S. Ultrasonic motor not using mechanical friction force. Int. J. Appl. Electromagn. Mater. 1992, 3, 179–182. [Google Scholar]
- Stepanenko, D.; Minchenya, V. Development and study of novel non-contact ultrasonic motor based on principle of structural asymmetry. Ultrasonics 2012, 52, 866–872. [Google Scholar] [CrossRef]
- Qiu, W.; Hong, Y.; Mizuno, Y.; Wen, W.; Nakamura, K. Non-contact piezoelectric rotary motor modulated by giant electrorheological fluid. Sens. Actuators A Phys. 2014, 217, 124–128. [Google Scholar] [CrossRef]
- Nandi, A.; Neogy, S.; Bhaduri, S. Performance analysis of a non-contact vibration damper made up of a piezoelectric stack and an electromagnet. J. Vib. Eng. Technol. 2015, 3, 401–418. [Google Scholar]
- Xing, J.; Zhao, L. Free vibration analysis for a non-contact piezoelectric motor modulated by electromagnetic field. Int. J. Appl. Electromagn. Mech. 2017, 55, 435–451. [Google Scholar] [CrossRef]
- Xing, J.; Zhao, L.; Li, C. Analysis for forced response of a non-contact piezoelectric driving system modulated by electromagnetic field under coupling excitation. J. Mech. Sci. Technol. 2018, 32, 1529–1537. [Google Scholar] [CrossRef]
- Shi, M.; Liu, X.; Feng, K.; Zhang, K. Experimental and numerical investigation of a self-adapting non-contact ultrasonic motor. Tribol. Int. 2021, 153, 106624. [Google Scholar] [CrossRef]
- Wang, T.; Xing, J.; Xu, L. Coupled Dynamics for Noncontact Piezoelectric Motor Modulated by Electromagnetic Force. J. Comput. Nonlinear Dyn. 2020, 15, 051007. [Google Scholar] [CrossRef]
- Chen, S.; Shi, M.; Zhang, S.; Song, D. Simulation Analysis and Experimental Research of Non-Contact Ultrasonic Motor Based on Acoustic Streaming. Tribology 2024, 44, 10–17. [Google Scholar]
Disclaimer/Publisher’s Note: The statements, opinions and data contained in all publications are solely those of the individual author(s) and contributor(s) and not of MDPI and/or the editor(s). MDPI and/or the editor(s) disclaim responsibility for any injury to people or property resulting from any ideas, methods, instructions or products referred to in the content. |
© 2024 by the authors. Licensee MDPI, Basel, Switzerland. This article is an open access article distributed under the terms and conditions of the Creative Commons Attribution (CC BY) license (https://creativecommons.org/licenses/by/4.0/).