Article

Improved Mass Flow Rate Regulation Methods Based on Variable Frequency Control: A Case Study of Oxidizer Agent Weighing for Solid Propellants

1
Shenyang Institute of Automation, Chinese Academy of Sciences, Shenyang 110016, China
2
University of Chinese Academy of Sciences, Beijing 100049, China
3
Institutes for Robotics and Intelligent Manufacturing, Chinese Academy of Sciences, Shenyang 110016, China
4
Shanghai Aerospace Chemical Engineering Institute, Huzhou 313000, China
5
State Key Laboratory of Robotics, Shenyang Institute of Automation, Chinese Academy of Sciences, Shenyang 110016, China
*
Author to whom correspondence should be addressed.
Actuators 2023, 12(7), 285; https://doi.org/10.3390/act12070285
Submission received: 7 June 2023 / Revised: 28 June 2023 / Accepted: 10 July 2023 / Published: 13 July 2023
(This article belongs to the Section Aerospace Actuators)

Abstract

:
The feeding and weighing of oxidizer agents is the key process of solid rocket motor propellant preparation, and its accuracy directly affects the burning performance of solid rocket motors. At present, the existing multi-batch feeding methods have the problem of low accuracy and high time consumption of the oxidizer agent. In this paper, an improved mass flow rate regulation method based on variable frequency control is proposed to improve accuracy and reduce time consumption. The nonlinear variation process of the mass flow rate during the opening and closing process of the air-operated pinch valve is analyzed. The periodic opening and closing frequency of the air-operated pinch valve is introduced to establish the mathematical model of the mass flow rate and frequency, and then, the model parameters are obtained through the discrete element method. The plan of the method of variable frequency regulation and the frequency parameters were determined using the multi-objective optimization method. The experiments are carried out, and the results show that compared to the existing multi-batch feeding method, optimized with the improved mass flow rate regulation methods based on the variable frequency control method, improved the feeding and weighing accuracy by 0.37% and reduced time consumption by 25.6%.

1. Introduction

A low level of the oxidizer agent and burning rate catalyst needs to be added to the solid propellant, and the oxidizer agent controls the thrust of the rocket and affects the burning performance of the propellant [1]. At present, the hydroxyl-terminated polybutadiene (HTPB) propellant is the most commonly used composite solid propellant, in which the oxidizing agent is ammonium perchlorate (AP), and the total content of AP has an effects on the properties of a composite solid propellant [2]. The feeding and weighing processes involve adding materials to specific containers in batches through the actuator [3]. This process is widely used in various industries, such as aerospace, pharmaceuticals, and food processing [4,5].
At present, the feeding and weighing methods used in industry are mainly batch feeding method of the combination of fast feeding and slow feeding [6,7,8]. This method generally has low accuracy due to a time lag, and there is a nonlinear process of feeding. Some researchers [4,9,10] have considered the relationship between the motor and the feeding weight during the vibration process. A linear model of the feed rate and motor speed is constructed based on the PID controller of generalized-predictive-control (GPC) with the ramp signal as the reference signal [9]. However, a more accurate mathematical model can be obtained by taking into account the nonlinear characteristics of the vibration feeding and weighing. In order to obtain a more accurate mathematical model. Czubak et al. [11,12] mainly studied the vibration behavior of vibration particles and revealed the nonlinear relationship between motor vibration and the feeding rate. Some studies [13] use neural network approximation and other methods to deal with nonlinear problems and use iterative learning control (ILC) and piecewise linearization methods to solve the repeatability and nonlinear problems in the feeding and weighing process [4]. Although the vibration feeder is also used to transfer materials to the weighing hopper through vibration and gravity, due to the nonlinear process of vibration, it is difficult to achieve high-precision feeding and weighing [4,14]. Therefore, in the research process of vibrating feeding and weighing the oxidizer agent using a solenoid valve-driven air-operated pinch valve, the nonlinear problem of the valve’s opening and closing process is taken into consideration. To improve the accuracy of feeding and weighing and reduce the time consumption, the mass flow rate is used as the observation value, and an improved mass flow rate regulation method based on variable frequency control is proposed.
In addition, some researchers [15,16,17] have conducted research and analysis on the change in the mass flow rate of materials during the weighing process, which can achieve the accurate control of weighing by regulating the mass flow rate. Navid et al. [3] used a laser line scanner to measure the mass flow rate of grain flow. Huang et al. [18,19] combined the Euler granular material continuum model, genetic algorithm, and gradient descent method to optimize the hopper geometry parameters, maximizing the mass flow rate and improving the flow mode. For powder materials, the discrete element method (DEM) is usually used in the process of studying the change in the mass flow rate, which can be used to model the granular materials and further explore the influence of particle shape on the mass flow rate [20]. The introduction of particle shape can make the predicted mass flow rate closer to the experimental material flow [21]. Gitiaray et al. [22] reaches an optimal design of a vibratory feeder to obtain higher efficiency. In this paper, gravity feeding and the periodic opening and closing of the air-operated pinch valve are simulated using the DEM. However, in actual production, the volume of the transfer device is generally 50 L, and the size of the particles is about 100 μm. If the simulation is configured according to the actual particle size, the total number of particles weighing 5 kg can reach about 600 million. Even with a small time step and simulation time, it is difficult for current computers to simulate such a large number of particles. Some researchers have suggested that this problem can be solved by adjusting two types of parameters [23,24,25]: (1) to expand the particle diameter by the constant coefficient while maintaining the same particle distribution and shape; (2) to reduce the diameter of the hopper, keeping the size ratios equal to the actual equipment, and through the dimensionless quantitative Ddrum/dp to measure it. Therefore, the expansion of particles based on a proportional relationship is a feasible method to control the presentation of the volume behavior on the basis of controlling the overall calculation time [26]. Therefore, to establish the relationship between the frequency and mass flow rate, the discrete element method is employed. Additionally, in order to reduce the simulation time, the particle size expansion factor is utilized to amplify the AP particles. Through simulation results, the improved mass flow rate regulation methods based on variable frequency control are optimized.
This paper is organized as follows. First, the nonlinear relationship of the change in the mass flow rate during the opening and closing of the air-operated pinch valve was analyzed and deduced in Section 2. The mathematical model of the mass flow rate and frequency was established in Section 3. The model parameters were acquired using the DEM simulation in Section 4, and the improved mass flow rate regulation methods based on the variable frequency control method were proposed to verify the effectiveness of the proposed method through feeding and weighing experiments for AP. Finally, the main findings are concluded in Section 5, to provide some more effective methods for increasing the accuracy and reducing the time consumption of the oxidizer agent.

2. Nonlinear Model

This section introduces the factors that influence the mass flow rate and deduces the nonlinear relationship between the change in the mass flow rate and the opening and closing of the air-operated pinch valve. The proposed improved mass rate regulation methods based on variable frequency control are supported by the establishment of a mathematical model for the mass flow rate and frequency.

2.1. Factors Affecting the Mass Flow Rate

Many factors affect the mass flow rate of materials discharged from the hopper, and it is very difficult to accurately predict the mass flow rate. As a result, many researchers use empirical formulas or quantitative analysis to calculate the mass flow rate. Previous studies have shown that for materials with large particle diameters, the mass flow rate (1) is proportional to the material density ρ, the outlet diameter D, and the adjustment coefficient K for powder particles.
q m ρ , D , K
When particles were discharged from the bottom opening of the cone or the column, Beverloo et al. [27,28] deduced (2).
q m = C ρ g ( D k d ) 2.5
where the parameter C = [0.55,0.65], k = [1.5,3.0], and the value of k is affected by the particle shape, considering the particle-free area at the outlet.
When considering the ultrafine particles or sticky particles, these particles are easy to receive the effects of gas pressure or the pressure gradient dP/dz, so the mass flow rate calculation formula for this type of particle should be as follows:
q m ρ , D , K , d P / d z

2.2. Nonlinear Model of the Mass Flow Rate

When the material is discharged through the air-operated pinch valve, the channel area changes due to the compression of the gas in the air-operated pinch valve (Figure 1), so the mass flow rate is also affected. The air-operated pinch valve is open when there is no airflow, and its axial section can be seen as having a circular shape. As the air flows into the air-operated pinch valve, the rubber material is squeezed inward by the air pressure and the axial section changes from circular to elliptical. Finally, the axial section disappears completely, and the hole is closed. In the stage when the axial section changes from circular to elliptical, the major axis of the ellipse is always equal to the diameter of the circle. Considering the short closing time of the air-operated pinch valve, the short axis change is considered a linear reduction process.
In this paper, a more accurate mathematical model of the mass flow rate is established by considering the nonlinear process caused by the change in the channel area during the opening and closing process of the air-operated pinch valve.
The axial section of the air-operated pinch valve is initially a circle with a radius of R, and its circumference is L 0 = 2 π R . During the air-operated pinch valve ventilation and clamping process, air flow presses the rubber to the center of the axial section, and the axial section of the clamping process can be similar to an ellipse. The section during the clamping process is integrated to calculate the area of the axial section:
S = 4 0 π 2 b sin t ( a sin t ) d t = π a b
where, a is the long half axis length of the ellipse, and b is the short half axis length of the ellipse. According to the parametric equation of the ellipse, and the Cauchy–Schwarz inequality, the approximation of the ellipse circumference is obtained as
L π 2 ( a 2 + b 2 )
Because the section circumference of the air-operated pinch valve is constant, then, there is
π 2 ( a 2 + b 2 ) = 2 π R
Moving a to one side gives the relationship between a and b as
a = 2 R 2 b 2
Substituting (7) to (4) the area of the axial section can be obtained:
S = π b 2 R 2 b 2
Since the solenoid valve controls the opening and closing process of the air-operated pinch valve, when the valve is closed, the axial section b changes from R to 0. The response time of the solenoid valve, denoted as T (20 ms ≤ T ≤ 250 ms), represents the time it takes for b to change. Due to the short response time, it can be approximated that the change in b follows a linear process. For the closing process of the air-operated pinch valve, the short half-axis length b changes from R to 0, resulting in
b 1 = R R T t ( 0 t T )
Similarly, when the air-operated pinch valve opening, b changes from 0 to R:
b 2 = R T t ( 0 t T )
In this paper, the initial axial section radius of the air-operated pinch valve selected is 15 mm, and the response time of the solenoid valve is 100 ms. According to (8), (9) and (10), the area Equations S1 and S2 corresponding to the opening and closing of the air-operated pinch valve are Equations (11) and (12).
S 1 = 10 π R 2 t 2 100 t 2
S 2 = π R 2 1 10 t 1 + 20 t 100 t 2
Take the axial section of the air-operated pinch valve channel as a thin-walled hole, and substitute (11) and (12) into (13), respectively, to obtain the corresponding mass flow rate change Equation Qi when the air-operated pinch valve is opened and closed.
Q i = K S i 2 Δ P / ρ ( i = 1 , 2 )
where, K is the mass flow rate coefficient, Δ P is the pressure difference, S is the axial section area of the air-operated pinch valve channel, and ρ is the particle flow density. Because K, Δ P , and ρ are fixed values in this paper, the change in the mass flow rate is only related to the sectional area of the hose valve channel.

3. Variable Frequency Regulation Methods

In this section, the mathematical model between the mass flow rate and frequency is established, and the improved mass flow rate regulation methods based on variable frequency control are proposed.

3.1. Relationship between the Mass Flow Rate and Frequency

The feeding and weighing device is shown in Figure 2. The air-operated pinch valve is the main device to control the discharge mass flow rate, and the opening and closing of the air-operated pinch valve are controlled by the solenoid drive solenoid valve. The PLC drives the solenoid valve to change direction to control the opening and closing of the air-operated pinch valve. In order to improve the accuracy of feeding and weighing, an improved mass flow rate regulation method based on variable frequency control is proposed. The principle is that the periodic opening and closing of the air-operated pinch valve are realized by setting the frequency of the solenoid valve. On the basis of considering the nonlinear change in the mass flow rate during the opening and closing of the air-operated pinch valve, the mathematical model of the mass flow rate and frequency is established.
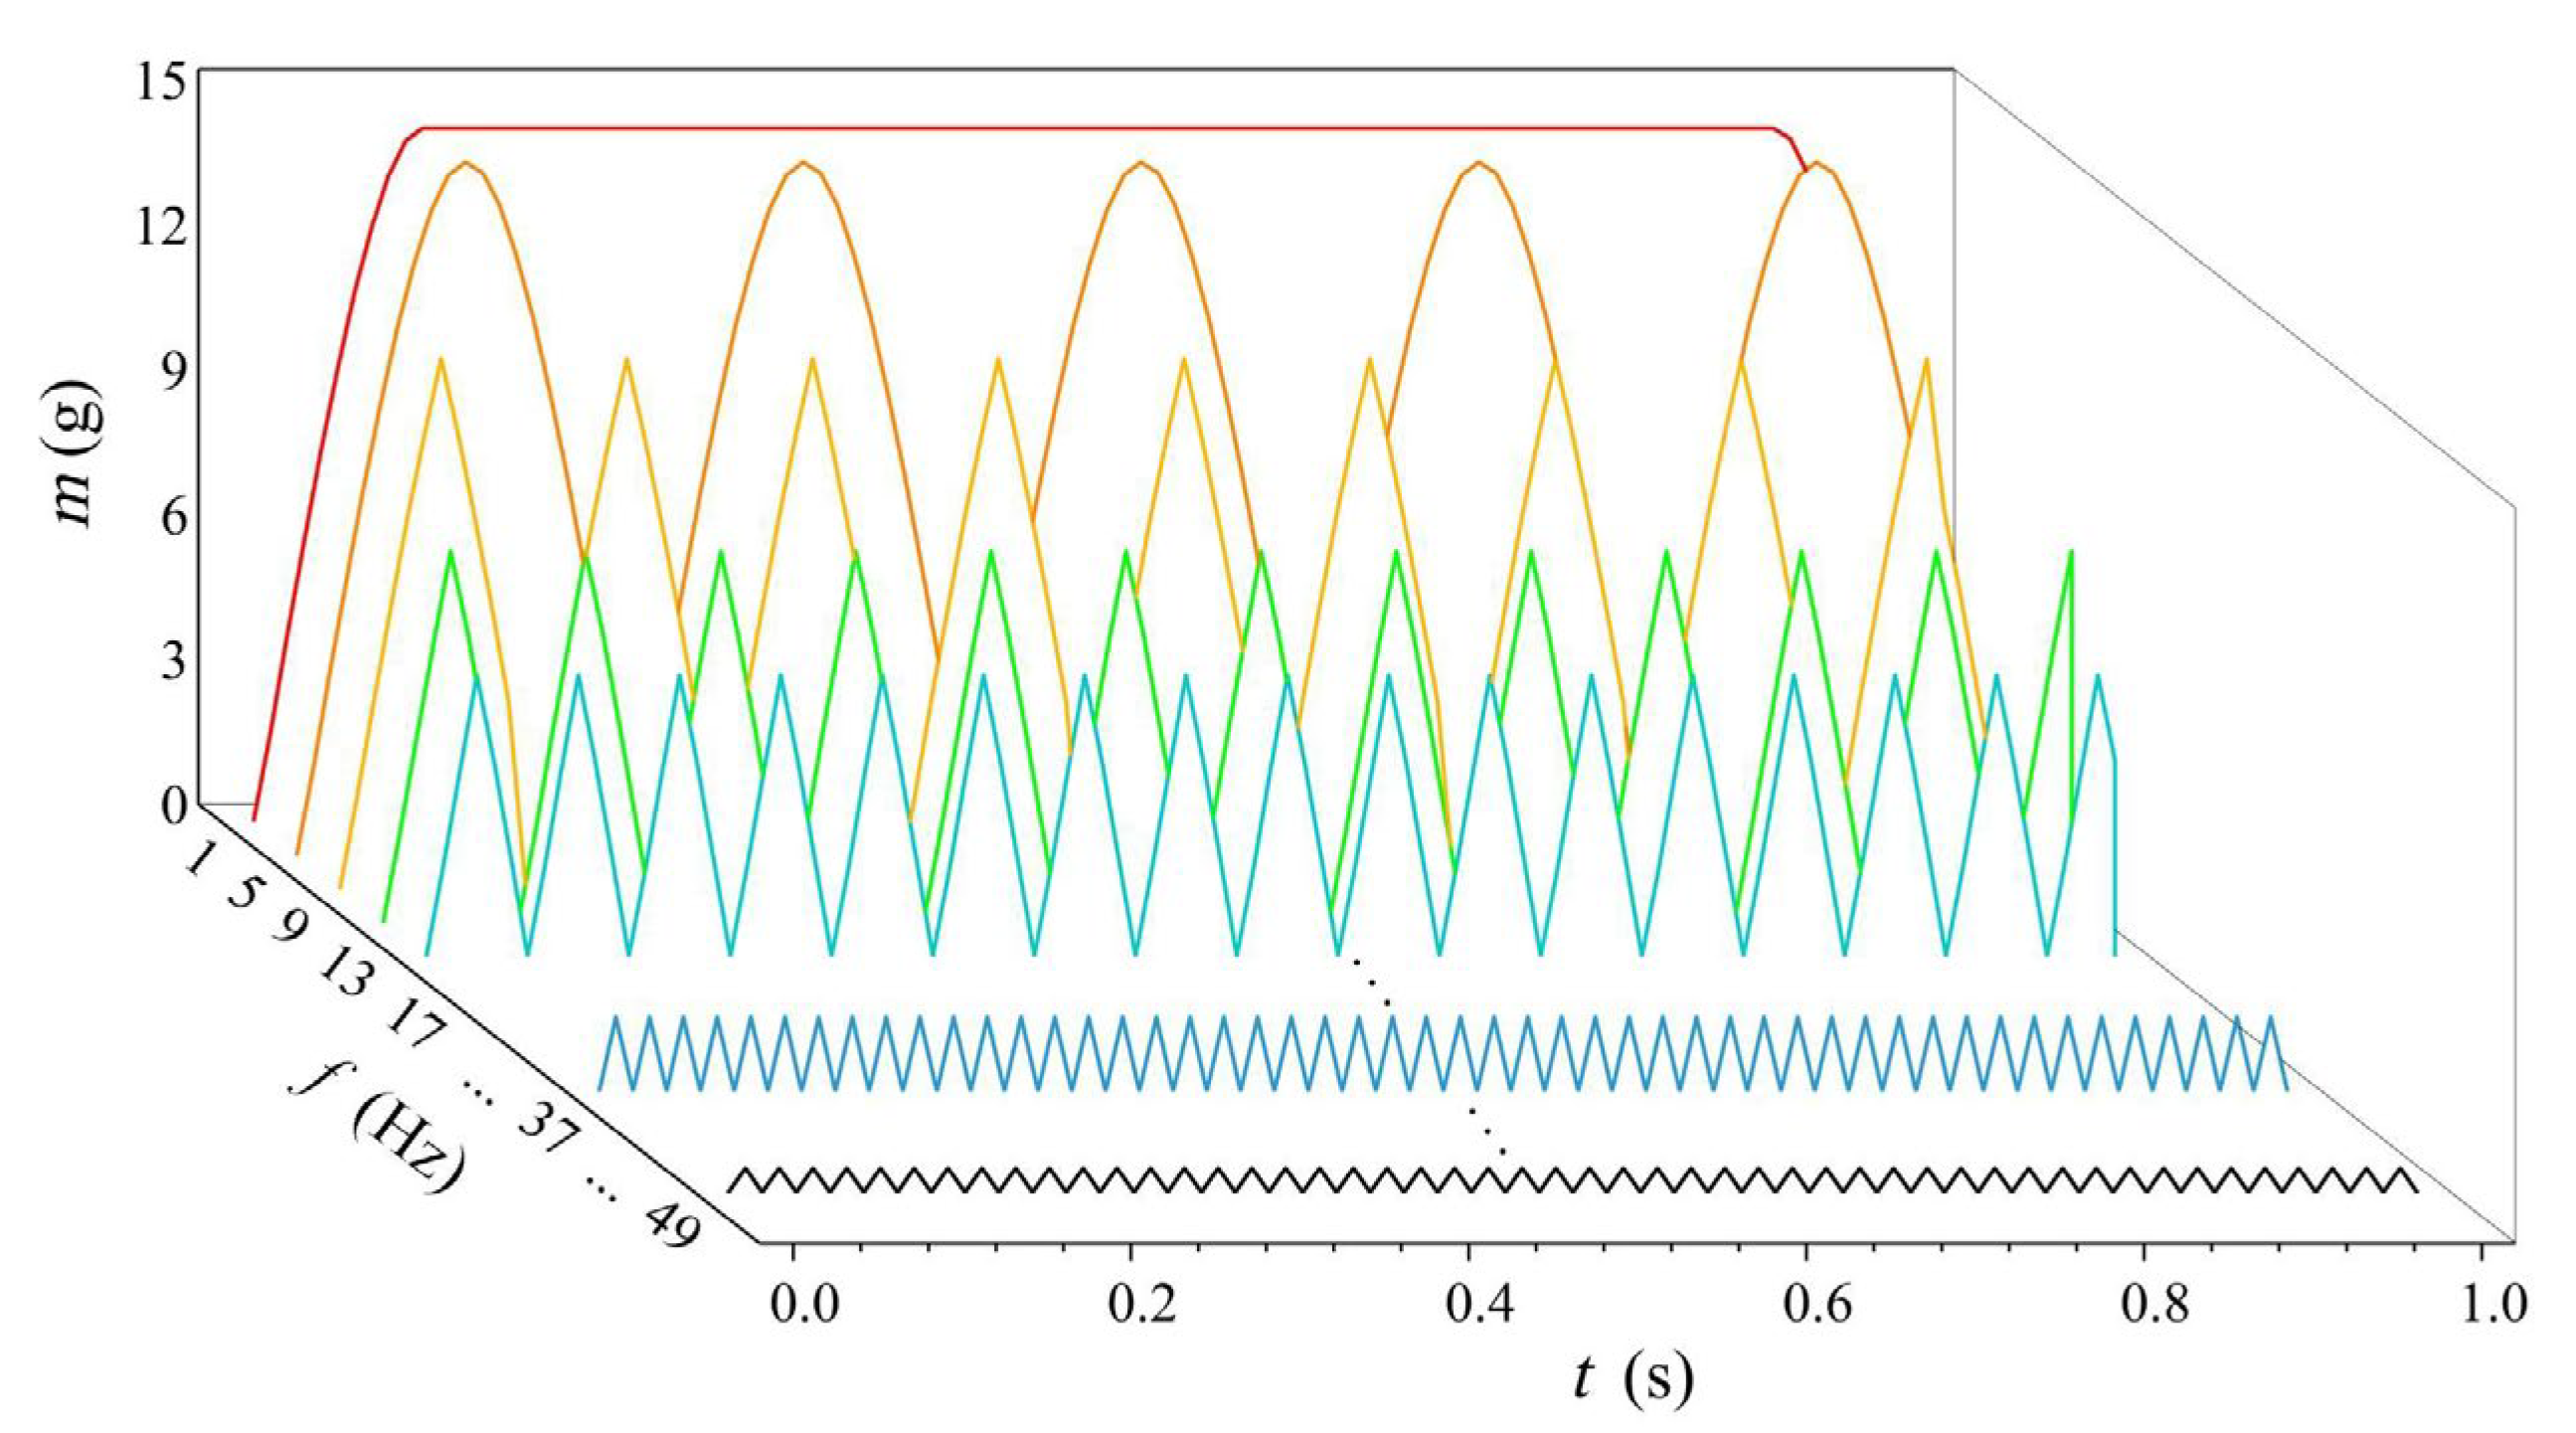
Before model deduction, it is necessary to assume that the outlet of the air-operated pinch valve is close enough to the weighing unit; that is, the discharge weight of the air-operated pinch valve is equal to the weight of the weighed material. Figure 3 shows the discharge weight of the air-operated pinch valve within 1 s at different frequencies. Below, the change in the discharge weight at different frequencies is analyzed, and the relationship between the frequency and mass flow rate is deduced.
For different opening and closing frequencies, the time required for one period varies. To better represent the mass flow rate, it is necessary to normalize the time of the discharge weight for one period. The curve with the frequency of 5 Hz in Figure 3 corresponds to a special case, as the response time of the solenoid valve is 0.1 s. When f = 5 Hz, taking the first period as an example, the sum of the opening time (0–0.1 s) and closing time (0.1–0.2 s) of the air-operated pinch valve is exactly equal to the time required for the solenoid valve to respond twice.
Therefore, at f = 5 Hz, the total discharge weight is accumulated over n periods. In the first period, the lower integral limit for Q1 is 0, and the upper integral limit is 0.1. And the lower integral limit for Q2 is 0.1, and the upper integral limit is 0.2. Due to the time of the period being 0.2 s, the lower integral limit for Q1 in the i-th period is 0 + 0.2 i, the upper integral limit is 0.1 + 0.2 i, the lower integral limit for Q2 is 0.1 + 0.2 i, and the upper integral limit is 0.2 + 0.2 i. Therefore, the mass flow rate at this stage can be expressed as Equation (14).
q m = i = 0 n 0 + 0.2 i 0.1 + 0.2 i Q 1 d τ + 0.1 + 0.2 i 0.2 + 0.2 i Q 2 d τ 0.2 n i = 0 , 1 , 2 , , n
where τ is the time required for a period, τ = 1/f; i is the number of periods, i = 0, 1, 2, ..., n; Q1 is the equation for the change in the mass flow rate during the opening process of the air-operated pinch valve; and Q2 is the Equation for the change in mass flow rate during the closing process of the air-operated pinch valve.
It can also be seen in Figure 3 that for f ≤ 5 Hz (such as f = 1 Hz), a complete air-operated pinch valve opening and closing process and a normally open stage are included in one period. For f > 5 Hz (such as f = 9 Hz), it is only part of the opening and closing process of the air-operated pinch valve in one period, and the air-operated pinch valve enters the closing stage before fully opening. Therefore, the influence of frequency on the mass flow rate is divided into two cases, 0 Hz < f ≤ 5 Hz and f > 5 Hz, and discussed respectively:
(1) When 0 Hz < f ≤ 5 Hz, because the feeding time of one period is greater than the response time of the solenoid valve required to complete the opening and closing of the air-operated pinch valve, the feeding in a period can be divided into the opening stage, normally open stage, and closing stage. Therefore, for the change in the mass flow rate at this stage, it is only related to the discharge time of the normally open stage. With the increase in frequency, the normally open time is accumulated to improve the mass flow rate. For this kind of periodic feeding composed of three stages, the general expression of mass flow rate is
q m = M 1 + M 2 n τ
where, M1 is the total discharge mass during the opening and closing stages of the air-operated pinch valve, M 1 = i = 0 n 0 + τ i 0.1 + τ i Q 1 d τ + τ 0.1 + τ i τ + τ i Q 2 d τ i = 0 , 1 , 2 , , n , M2 is the total discharge mass during the normally opening stage of the air-operated pinch valve, M 2 = m j n τ 0.2 j R , and n is the number of periods; when 0 Hz < f ≤ 5 Hz, because the feeding time of one period is greater than the response time of the solenoid valve required to complete the opening and closing of the air-operated pinch valve, the feeding in a period can be divided into the opening stage, normally open stage, and closing stage.
(2) When f > 5 Hz, because the discharge time of one period is less than the response time of the solenoid valve required to complete the opening and closing of the air-operated pinch valve, the opening stage of the air-operated pinch valve is not fully completed and then enters the closing stage, so the discharge in a period consists of the incomplete opening stage and the incomplete closing stage, and the discharge weight of the incomplete opening stage and the incomplete closing stage is symmetrical at τ/2 position, so there is 0 + τ i 0.5 τ + τ i Q 1 d τ = 0.5 τ + τ i τ + τ i Q 2 d τ . For this kind of periodic feeding composed of two incomplete stages, the general expression of the mass flow rate is
q m = i = 0 n 0 + τ i 0.5 τ + τ i Q 1 d τ + 0.5 τ + τ i τ + τ i Q 2 d τ n τ = 2 i = 0 n 0 + τ i 0.5 τ + τ i Q 1 d τ n τ i = 0 , 1 , 2 , , n
According to the curve change in Figure 3, when the frequency is greater than 25 Hz, the incomplete opening stage and the incomplete closing stage tend to be linear, so in order to simplify the calculation, this kind of mass flow rate can be further simplified as
q m = 0.5 m j τ n n τ = 0.5 m j
To sum up, the mathematical model of the mass flow rate and frequency can be summarized into three cases. When 0 Hz < f ≤ 5 Hz, the relationship between the mass flow rate and frequency meets Equation (15), when 5 Hz < f ≤ 25 Hz, the relationship between mass flow rate and frequency meets Equation (16), and when 25 Hz < f ≤ 50 Hz, the relationship between mass flow rate and frequency meets Equation (17).
Based on this, the improved mass flow rate regulation methods based on variable frequency control is proposed. When the feeding and weighing reaches the final 1000 g, the final target can be accurately weighed using this method.
From the above, when the frequency approaches positive infinity, the mass flow rate is small. The air-operated pinch valve’s single opening and closing weight is small, which can achieve high accuracy. However, due to this reason, the feeding and weighing time consumption is long, resulting in efficiency problems. In addition, switching at short intervals may affect the stability of feeding. Therefore, it is necessary to optimize the frequency of the process.

3.2. Variable Frequency Regulation Methods

For the existing feeding and weighing method [6,7,8], in the actual discharge control process, as long as the weight of the final falling is within the allowable error, it is not concerned about the accurate discharge at every moment in the feeding process. The control strategy is used for two-stage discharge. In the first stage, the large diameter coarse weighing outlet is used for rapid discharge, but there is no requirement for accuracy. In the second stage, a small diameter fine weighing outlet is used to achieve slow and high-precision discharge. When the weighing sensor meets the total weight, the discharge outlet is quickly closed. This method has errors in accuracy and needs to design two sizes of the outlet to achieve accurate weighing. In this paper, only a single outlet is used to complete the feeding, and the final target is accurately weighed using the improved mass flow rate regulation method based on variable frequency control.
The method is to optimize accuracy. When the distance from the target value is 1000 g, the improved mass flow rate regulation method based on variable frequency control is adopted to improve the accuracy through two variable frequency regulation times.
The regulation method is as follows: the improved mass flow rate regulation method based on variable frequency control is used. The first stage is the low-frequency stage (0 Hz < f ≤ 5 Hz), that is, the high mass flow rate stage. At this stage, about 80% of the weighing is completed, and the discharge weight and time consumption are large. The second stage is the middle-frequency stage (5 Hz < f ≤ 25 Hz), that is, the mass flow rate reduction stage; this stage completes about 15% of the weighing. Due to the increase in the frequency but the weight of discharge to be completed decreasing, it takes less time. The third stage is the high-frequency stage (25 Hz < f ≤ 50 Hz), that is, the low mass flow rate stage. This stage completes the final weighing part. In this stage, although the feeding weight is small, the opening and closing times increase, which will increase the time consumption.

4. Simulation and Experiment

In this section, the model parameters of the mass flow rate and frequency mathematical model are obtained using the discrete element method (DEM) simulation method and to optimize the frequency parameters. The experiment is carried out based on variable frequency regulation methods, and the results show that the method improves the accuracy and reduces the time consumption.

4.1. DEM Simulation

The DEM has been successfully applied in many fields, such as agricultural technology, chemical engineering, the pharmaceutical industry, the food industry, and process engineering [29,30,31,32]. The DEM was used to simulate the particle flow during the feeding and weighing process and to calculate the discharge weight at different frequencies.
In this paper, the feeding and weighing process of a solid propellant oxidizer agent was studied. The experimental object was ultrafine AP powder, but in order to facilitate the simulation experiment, the particles are expanded. Although such a setting will reduce the accuracy of the simulation, in the actual production process, considering the influence of coulomb force and viscous force between particles, particles do not fall independently or discretely, in the form of some uneven clusters. Therefore, the cluster composed of ultra-fine particles can be regarded as a whole, in which the Coulomb force and the viscous force among particles are regarded as the internal force of the particles, so the viscosity among particles is ignored in the simulation process.
This paper chose the particle size expansion factor (Fps) to expansion particles. The AP with Fps = 20 is selected for the DEM simulation. In order to more realistically simulate the discharge process of AP particles in the hopper, it is necessary to set the parameters of AP and silo materials in the simulation software. And because the flow of particles depends on gravity, particles and particles, as well as particles and soil, will collide, which will also have an impact on the discharge. Therefore, the parameters need to be set between particles and between particles and hoppers (such as, the restitution coefficient, coefficient of static friction, and coefficient of rolling friction). The gravitational acceleration was 9.81 m/s2, and the time step of the simulation was set to 5 × 10⁻⁶ s. The parameters of the AP required for the simulation are shown in Table 1 [33].
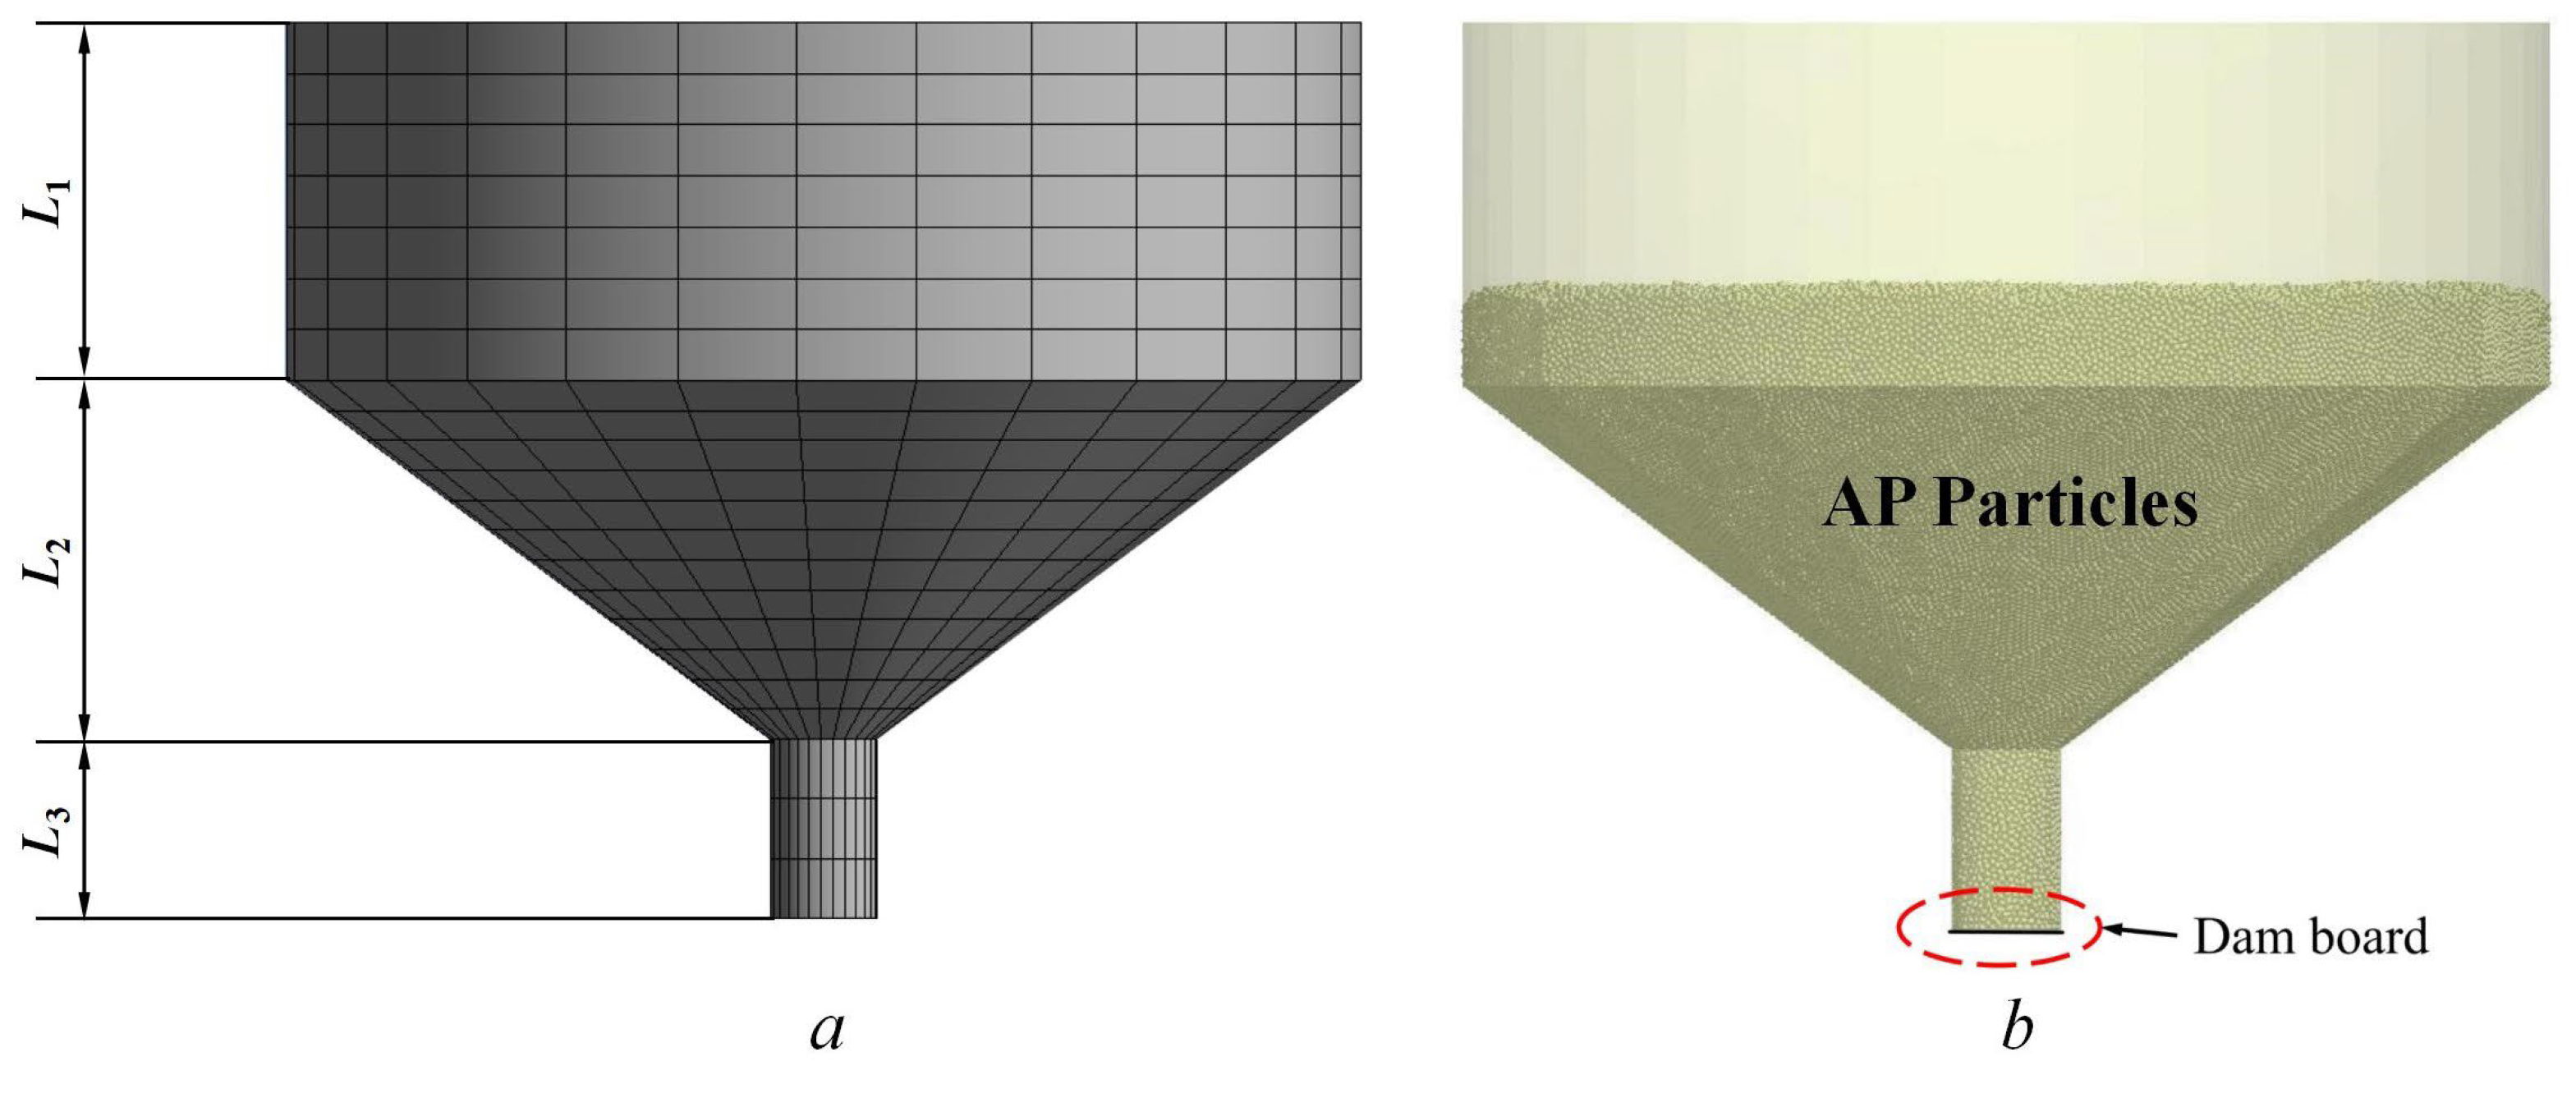
The structure of the simplified hopper is shown in Figure 4a. The composition structure and corresponding sizes of the hopper are shown in Table 2. Before the simulation, a 3D model should be imported into the hopper, and the inlet and outlet are set. Fill the expanded spherical AP particles in the hopper in advance, and the filled results are shown in Figure 4b.
To obtain the parameters of the mathematical model of the opening and closing frequency and mass flow rate of the air-operated pinch valve, a dam board opening and closing at a fixed frequency are set at the outlet to simulate the opening and closing of the air-operated pinch valve. In order to simplify the difficulty of the simulation and reduce the calculation time, the outlet is opening and closing once in a movement period. Therefore, only the discrete element simulation is conducted on one movement period of the outlet at different frequencies, and the simulation results are measured to calculate the mass flow rate corresponding to different frequencies in unit time.
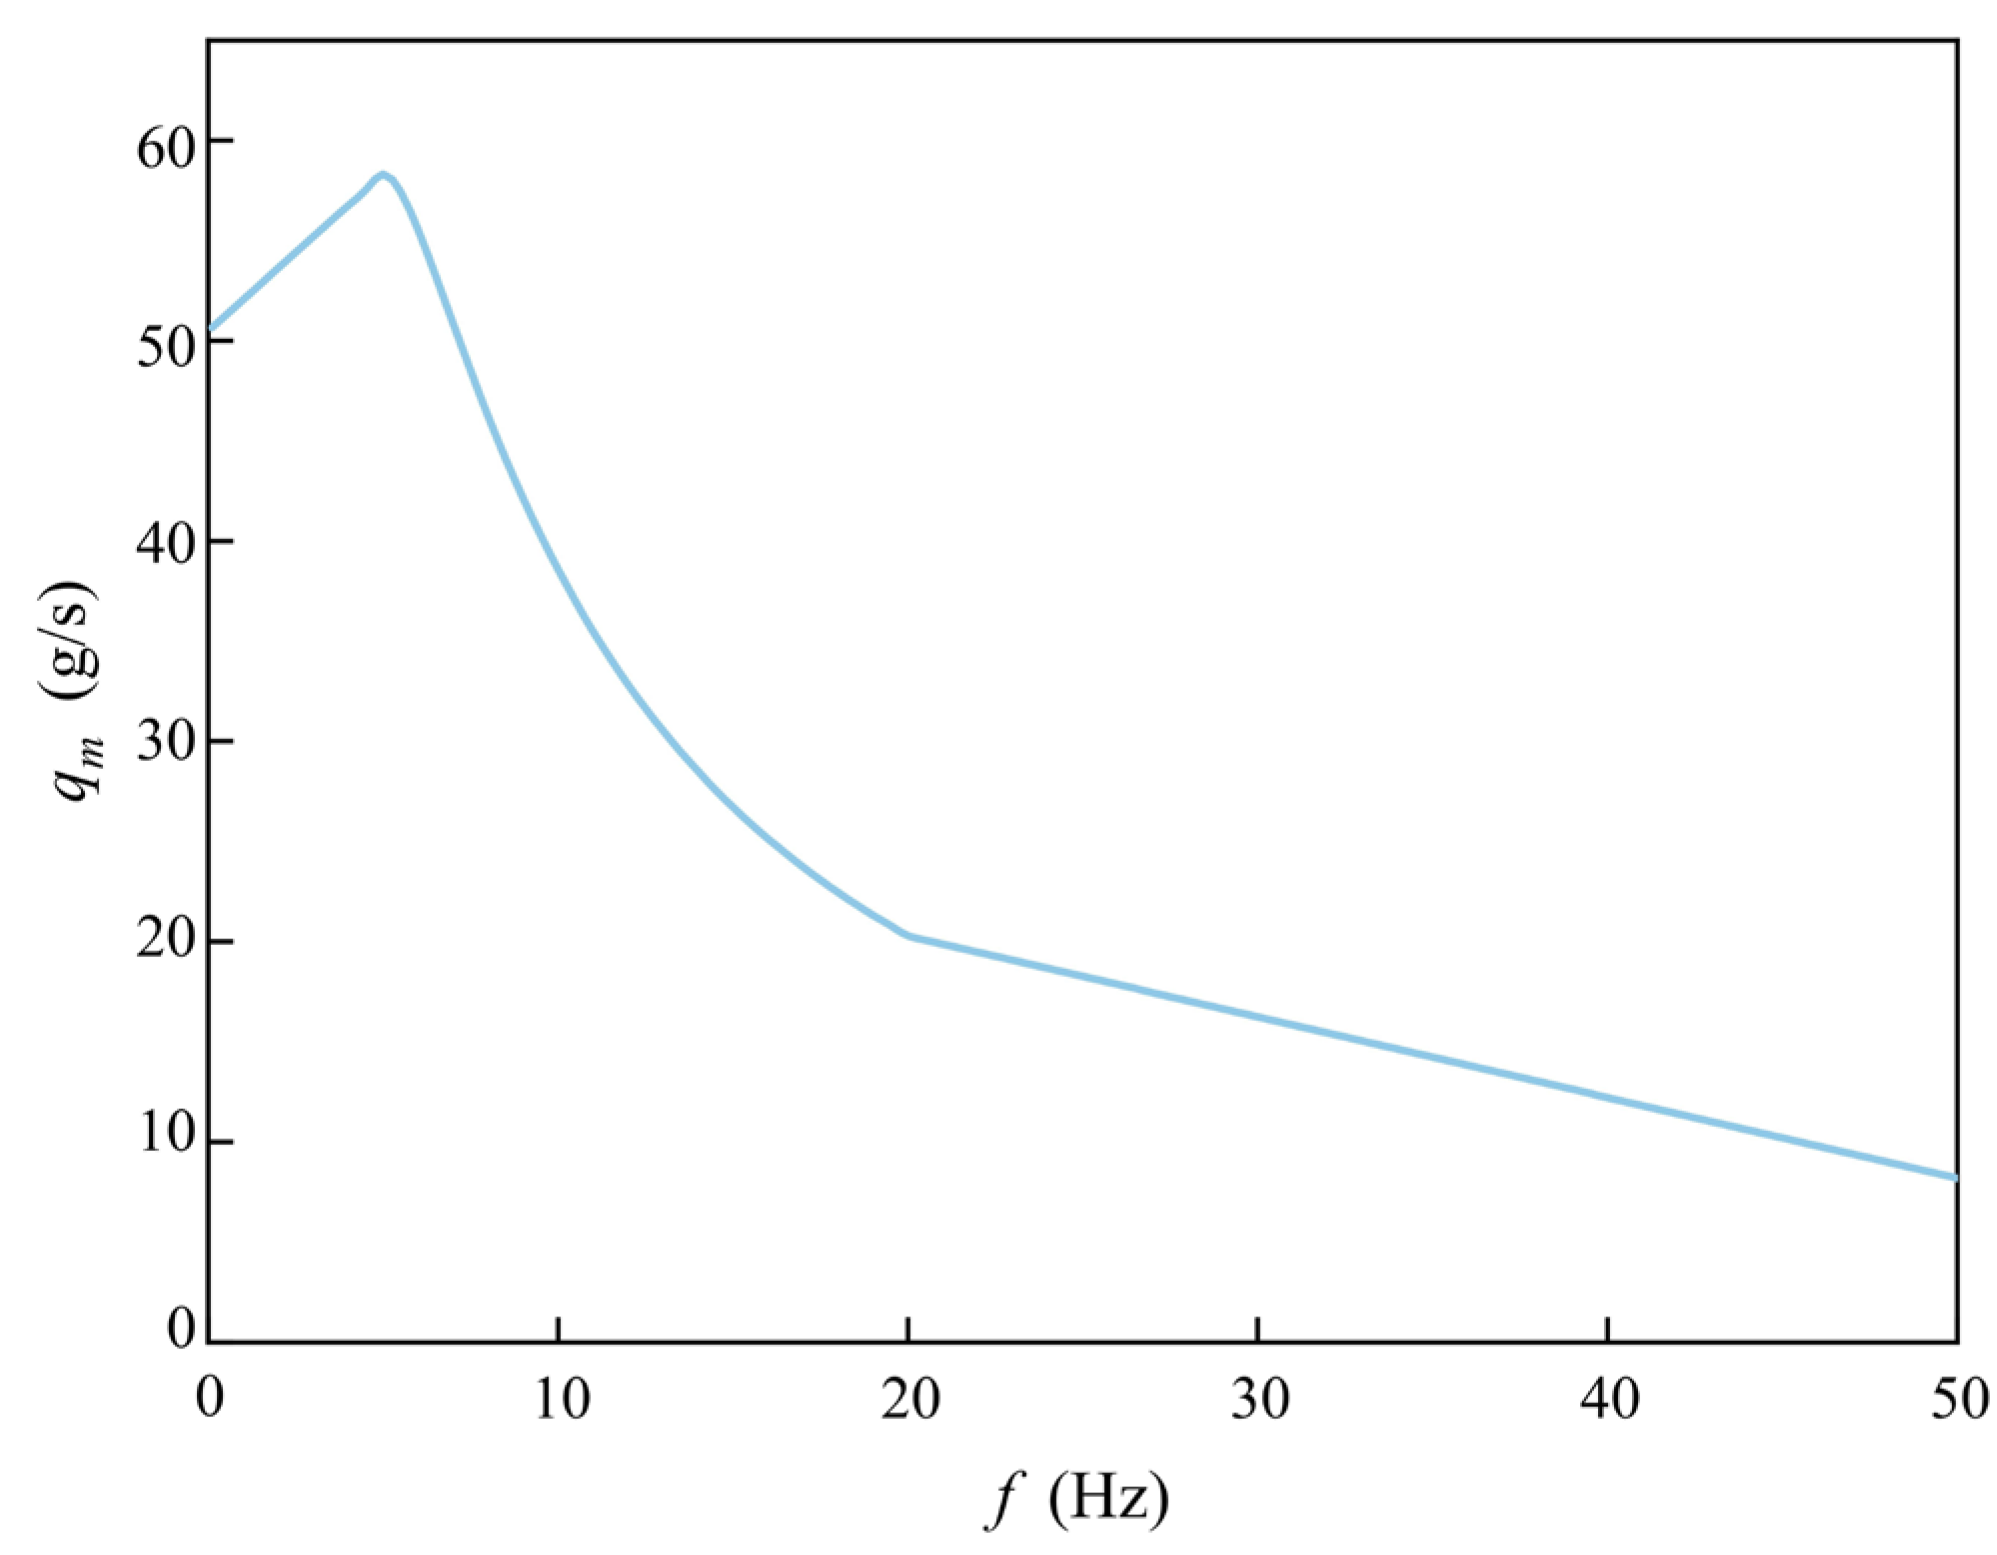
Based on the above analysis of the mass flow rate in different stages, 0–50 Hz is divided into three mass flow change stages, and different frequencies of each stage are selected for simulation to obtain the parameters corresponding to different frequencies, so as to calculate the relationship between the mass flow rate and frequency as Equation (18) and draw the curve of each stage as shown in Figure 5.
q m = 50.490 + 1.567 f , ( 0   Hz < f 5   Hz ) f 0 0.5 f 583.286 t 2 100 t 2 d t , ( 5   Hz < f 2 5   Hz ) 32.157 0.633 f , ( 25   Hz < f 50   Hz )
Figure 5 describes the changes in the mass flow rate for the three frequency cases from 0 to 50 Hz in Equation (18). When the frequency is less than 5 Hz, the opening and closing processes of the air-operated pinch valve are complete within a period. Excluding the opening and closing time of the air-operated pinch valve, the discharge of particles is uniform, so the mass flow rate at this stage meets a linear change. With the increase in frequency, it is difficult to achieve a complete opening and closing process of the air-operated pinch valve within a period, resulting in a nonlinear decreasing trend of the mass flow rate. When the frequency is greater than 25 Hz, due to the short opening and closing time of the air-operated pinch valve, the change rate of the mass flow rate is small, so it is approximately fitted as a linear trend.

4.2. Optimize Frequency Parameters

In order to find the best feeding and weighing parameters, the mathematical model is carried out according to the actual requirements of accuracy and time consumption. According to the above contents, the improved mass flow rate regulation method based on variable frequency control can be described in three stages.
During the experiment, 1000 g of material was fed and weighed. In the first stage, the low-frequency band can quickly approach the target of 80% of the feeding weight. However, due to the low frequency, the mass flow rate changes greatly, resulting in low accuracy. In order to not increase the time for the subsequent two stages, it is necessary to propose the requirement of a minimum weighing error for this stage. The feeding weight of the second stage should meet the expected requirement of 15% and compensate for the error of the first stage, so as to reduce the time consumption of accurate feeding in the third stage. Finally, the cumulative values of the three stages are used to solve the weighing accuracy, so that the final accuracy meets the requirements α ∈ [99.95%, 100.05%], and the cumulative time consumption of the three stages needs to be minimized.
The optimization objectives are as follows:
min M f 1 800 M f 1 + M f 2 + M f 3 1000 1 × 100 % < 0.05 % min ( a f 1 f 1 + b f 2 f 2 + c f 3 f 3 )
The restraint condition are as follows:
s . t . f 1 = 0.1 , 0.2 , 0.3 , , 5.0 f 2 = 5.1 , 5.2 , 5.3 , , 25.0 f 3 = 25.1 , 25.2 , 25.3 , , 50.0
where, M f 1 , M f 2 , and M f 3 are the feeding and weighting mass of the first stage, the second stage, and the third stage, respectively. M f 1 = a f 1 m f 1 , M f 2 = a f 2 m f 2 , and M f 3 = a f 3 m f 3 . a f 1 N + , b f 2 N + , and c f 3 N + are the opening and closing times of each stage, respectively. m f i is the mass of the air-operated pinch valve opening and closing once, and m f i = q m f i f i ( i = 1 , 2 , 3 ) , and i is the number of stages.
Apply the proposed method to the feeding and weighing process, using three stages and two frequency changes to complete the final weighing. Selecting different frequencies for optimization in three stages resulted in the accuracy and time consumption of many groups, as shown in Figure 6. In Section 4.2, three stages are described, and Equation (19) provides evaluation indicators. Relying on optimized results with accuracy α ∈ [99.95%, 100.05%] and minimum time consumption as constraints was used to obtain the optimal five sets of results shown in Table 3.
The frequency of the first stage is close to 5 Hz, and it quickly reaches 80% of the weight with a high mass flow rate. The frequency of the second stage is around 10 Hz, when the slope of the curve changes less and is close to the median mass flow rate, meeting the high speed feeding and completing the target weight with a certain accuracy. The optimization results of the frequency show that in the third stage, the final feeding is not completed with a high frequency. Choosing a medium and high frequency can effectively save time consumption and meet the accuracy requirements.

4.3. Experimental Validation

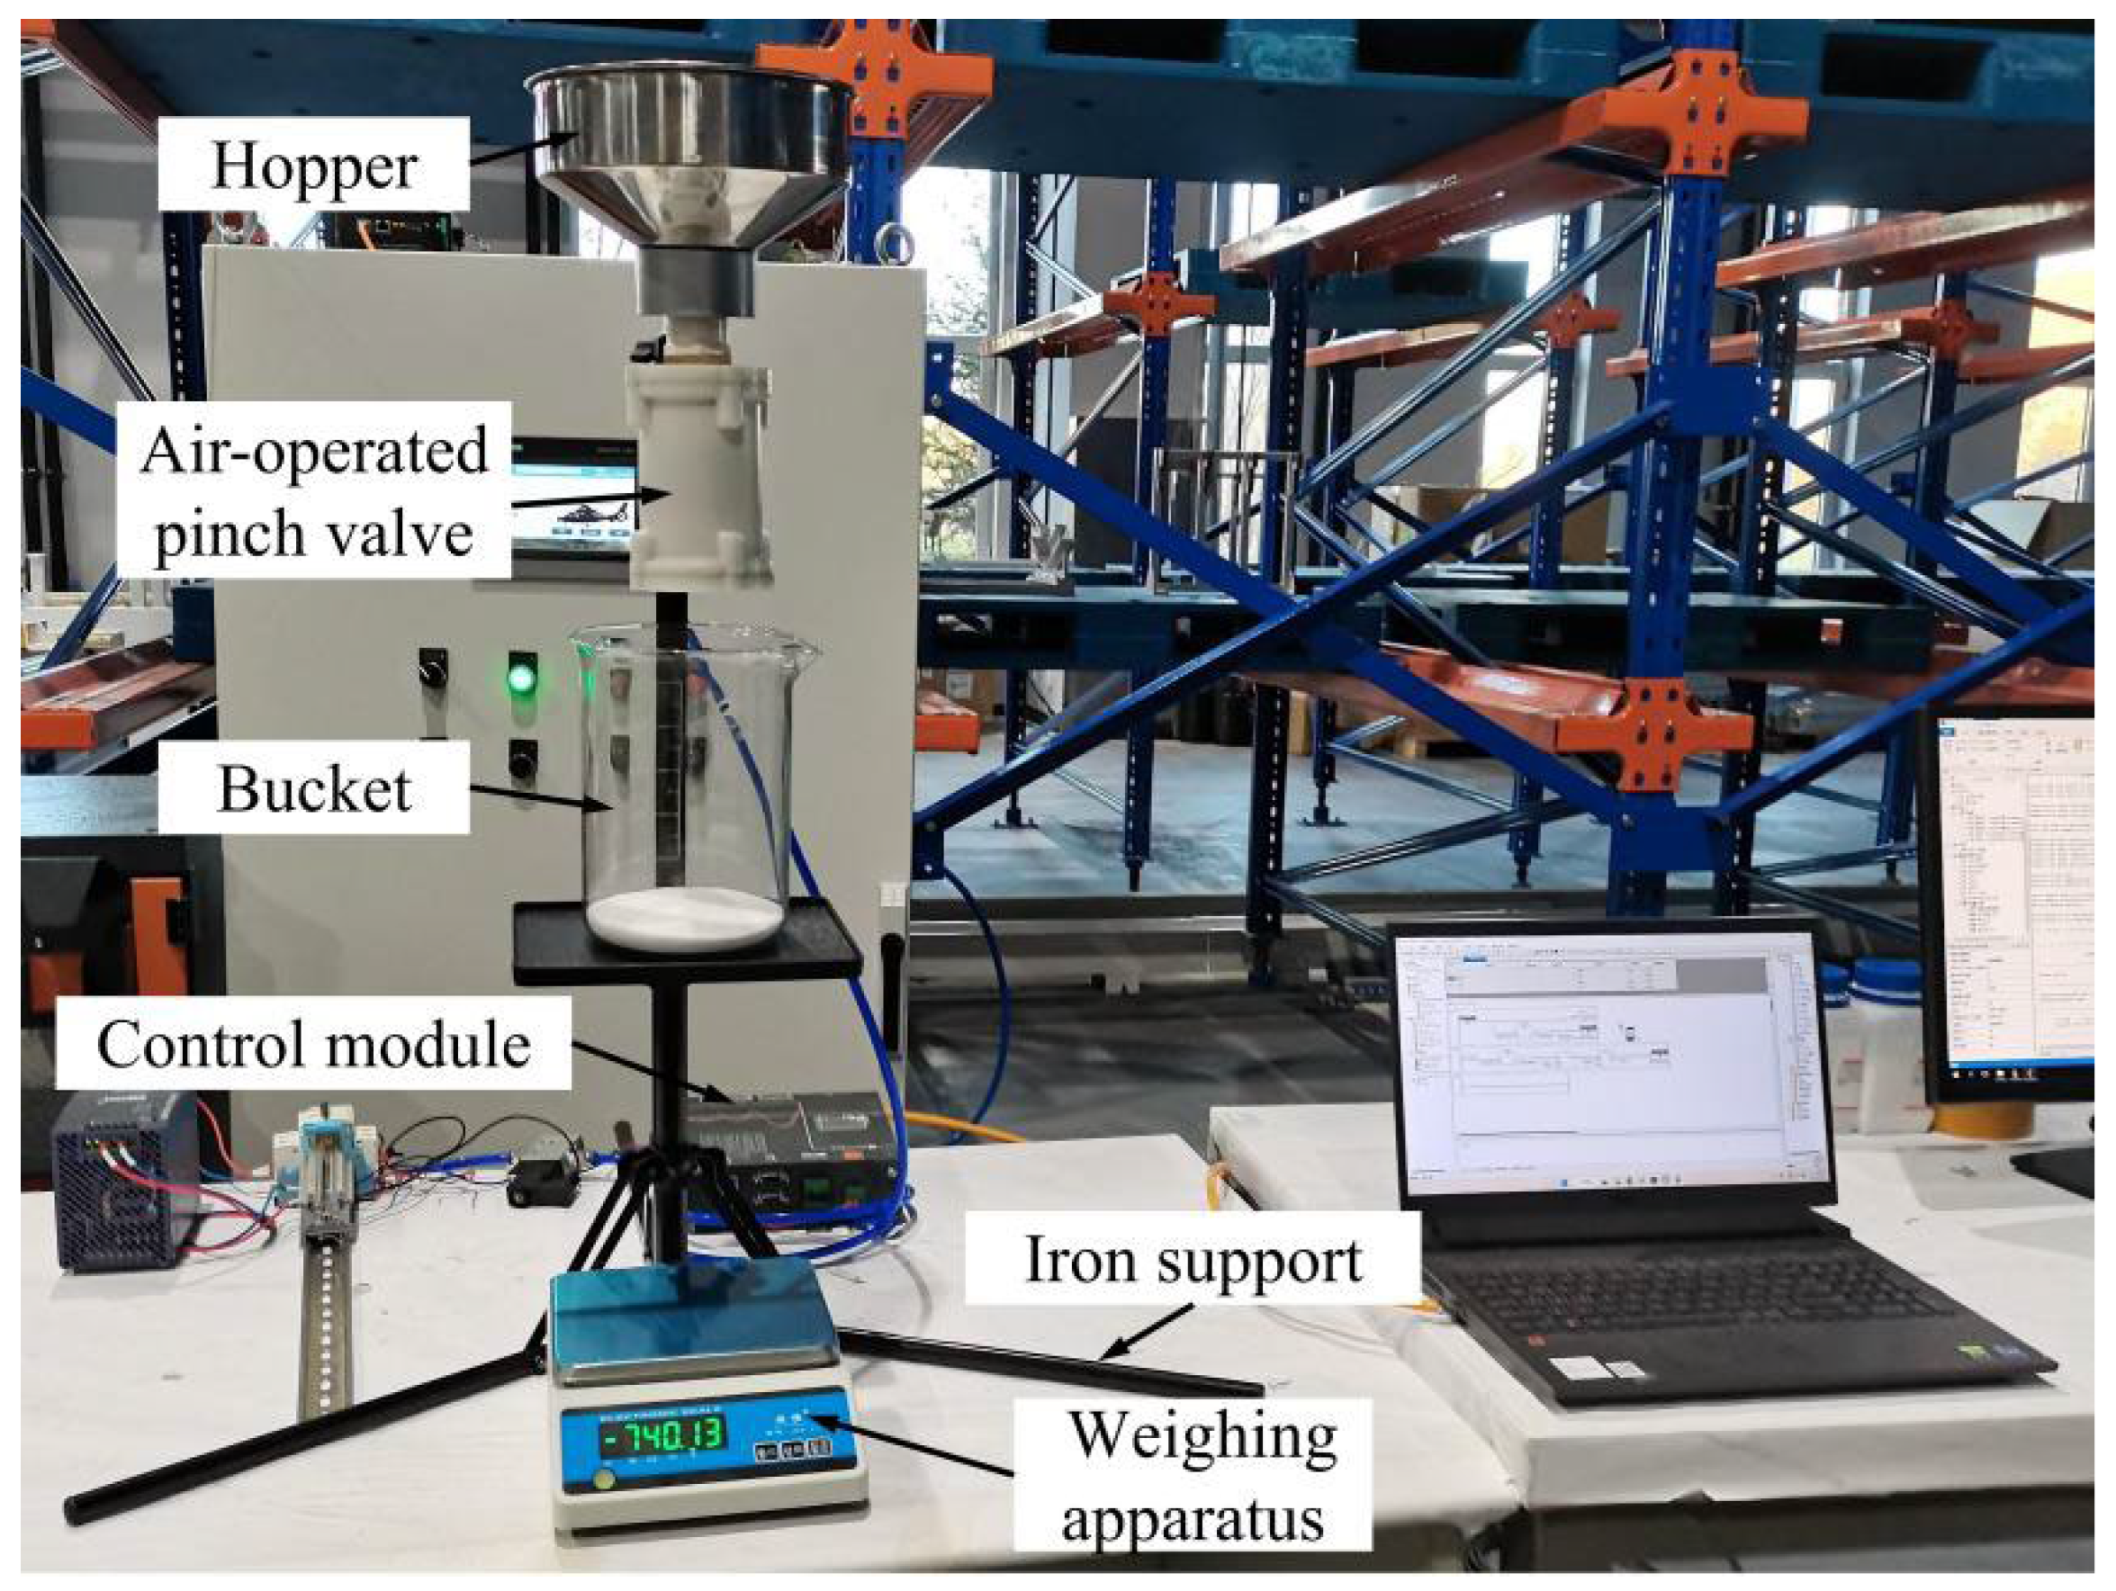
To verify the accuracy of DEM simulation results and the effectiveness of the improved mass flow rate regulation methods based on variable frequency control, based on the above discussion, the feeding and weighing experiment of the last 1000 g of oxidizer agent was carried out with the optimized frequency. The experimental device is shown in Figure 7. The solenoid valve is driven by PLC to control the air-operated pinch valve at the outlet under the hopper to open and close at a certain frequency. The diameter of air-operated pinch valve is D = 30 mm, and the average particle size is d = 150 μm. The feeding and weighing experiment is conducted according to the optimization results provided in Table 3.
Furthermore, in order to verify that the improved mass flow rate regulation methods based on variable frequency control can guarantee the accuracy and save time compared with the existing feeding and weighing method, a contrast experiment was designed according to the existing feeding and weighing method, and two air-operated pinch valve with diameters of 30 mm and 15 mm were selected for two-stage feeding and weighing, of which the first stage completed 80% of feeding, and the second stage completed the rest.
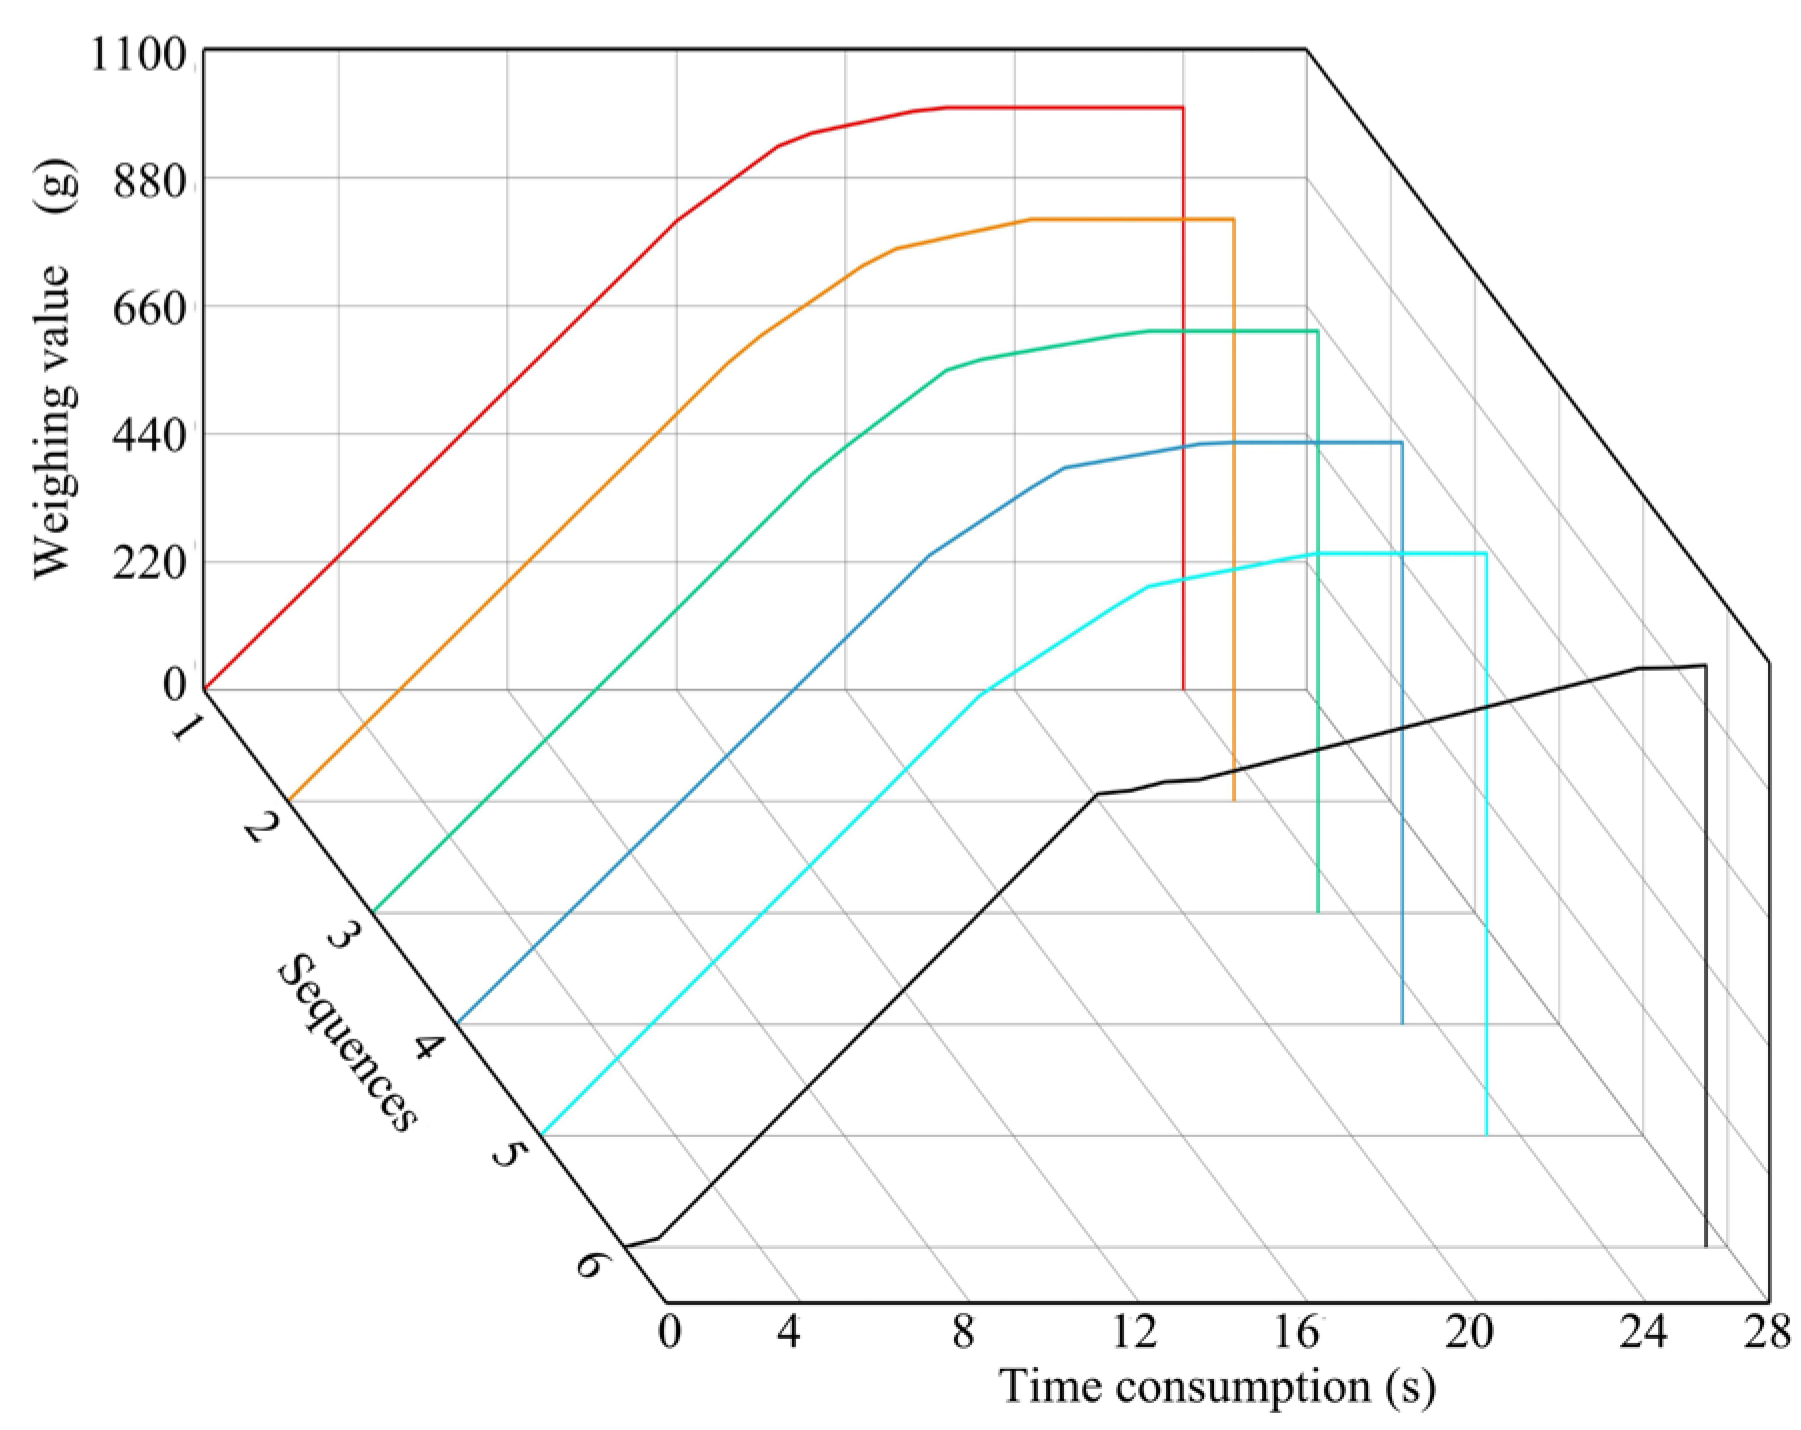
The results of the above six groups of experiments are shown in Figure 8. The existing multi-batch feeding and weighing method (Sequence 6) has changed the outlet, resulting in obvious sudden changes in the process. However, the improved mass flow rate regulation methods based on variable frequency control have no change in the outlet during the feeding and weighing process. It is only the frequency change that changes the mass flow rate at different time stages, so the high accuracy feeding and weighing has been achieved smoothly in the whole process.
It is verified by experiments that the improved mass flow rate regulation methods based on variable frequency control can ensure the accuracy between 99.95% and 100.05%. By using the improved mass flow rate regulation methods based on variable frequency control method, weight fluctuations caused by changes in the outlet size can be effectively avoided, making the feeding and weighing process more stable, in Figure 8. Compared with existing methods, in Figure 9, the accuracy of using the improved mass flow rate regulation methods based on the variable frequency control method has been improved from 99.58% to [99.95%, 100.05%], and the time consumption has been reduced by 25.6%. The advantages of the proposed method in terms of accuracy and time consumption were verified, demonstrating the feasibility of the method.
Within the range of meeting the accuracy and time consumption, the improved mass flow rate regulation methods based on variable frequency control have many different options in the feeding and weighing processes, and the optimization results effectively improve the efficiency of the feeding and weighing. In the future, for higher accuracy requirements, the improved mass flow rate regulation method based on variable frequency control can be further adopted to improve the accuracy by increasing the number of variable frequencies. However, the possible problem of increasing time consumption due to multiple frequency variations needs to be further discussed and optimized. It can be applied in the feeding and weighing of pharmaceutical preparations and food processing industries while meeting the requirements of high accuracy and low time consumption.

5. Conclusions

This paper analyzed the nonlinear process of mass flow rate caused by the axial section area change during the of air-operated pinch valve, introduced the periodic opening and closing frequency of air-operated pinch valve, established a mathematical model of mass flow rate and frequency, and determined the model parameters through DEM simulation. The mass flow rate shows a linear increase with the increase in the frequency and reaches its maximum value at 5 Hz. After the frequency exceeds 5 Hz, the mass flow rate shows a nonlinear decreasing trend with the increase in frequency. When the frequency exceeds 25 Hz, the mass flow rate approximates a linear change, but when the frequency approaches infinity, the mass flow rate should always approach 0 instead of 0.
Based on this model, an improved mass flow rate regulation method based on variable frequency control is proposed, and the feeding and weighing process of this method is optimized. The feeding and weighing experimental device is designed to test the optimized frequency parameters and compare the existing feeding and weighing method. The experimental results show that the improved mass flow rate regulation methods based on variable frequency control can improve the accuracy to 100% ± 0.05% and reduce the time consumption by 25.6% in the process of feeding and weighing.
Our future work will be based on this method, and take into account the parameter changes caused by the model changes during the feeding and weighing process. We plan to develop a control system and apply this method in the actual feeding and weighing process.

Author Contributions

Conceptualization, H.L. and X.B.; methodology, H.L. and X.B.; experiment, H.L., L.F. and X.C.; validation, H.L. and L.F.; resources, Z.X.; data curation, H.L. and L.F.; writing—original draft preparation, H.L. and H.W.; writing—review and editing, Y.W. and L.F.; supervision, Z.X. and X.B.; All authors have read and agreed to the published version of the manuscript.

Funding

This research received no funding.

Data Availability Statement

Not applicable.

Conflicts of Interest

The authors declare no conflict of interest.

References

  1. Frederick, R.A.; Whitehead, J.J.; Knox, L.R.; Moser, M.D. Regression rates study of mixed hybrid propellants. J. Propuls. Power 2007, 23, 175–180. [Google Scholar] [CrossRef]
  2. Park, S.; Choi, S.; Kim, K.; Kim, W.; Park, J. Effects of Ammonium Perchlorate Particle Size, Ratio, and Total Contents on the Properties of a Composite Solid Propellant. Propellants Explos. Pyrotech. 2020, 45, 1376–1381. [Google Scholar] [CrossRef]
  3. Navid, H.; Taylor, R.K.; Yazgi, A.; Wang, N.; Shi, Y.; Weckler, P. Detecting grain flow rate using a laser scanner. Trans. ASABE 2015, 58, 1185–1190. [Google Scholar]
  4. An, J.; You, F.; Wu, M.; She, J. Iterative learning control for nonlinear weighing and feeding process. Math. Probl. Eng. 2018, 2018, 9425902. [Google Scholar] [CrossRef]
  5. Gopireddy, S.R.; Hildebrandt, C.; Urbanetz, N.A. Numerical simulation of powder flow in a pharmaceutical tablet press lab-scale gravity feeder. Powder Technol. 2016, 302, 309–327. [Google Scholar] [CrossRef]
  6. AN, J.Q.; Huang, Y.B.; Wu, M.; She, J.H. Two-Level Data-Based Adjustment of Controller Parameters for Weighing Process of Ladle Furnace. IEEE Trans. Ind. Inform. 2020, 12, 7658–7670. [Google Scholar] [CrossRef]
  7. Mucchi, E.; Gregorio, R.D.; Dalpiaz, G. Elastodynamic analysis of vibratory bowl feeders: Modeling and experimental validation. Mech. Mach. Theory 2013, 60, 60–72. [Google Scholar] [CrossRef]
  8. Yang, S.; Evans, J.R.G. Metering and dispensing of powder; the quest for new solid freeforming techniques. Powder Technol. 2007, 178, 56–72. [Google Scholar] [CrossRef]
  9. Despotovic, Z.V.; Urukalo, D.; Lecic, M.R.; Cosica, A. Mathematical modeling of resonant linear vibratory conveyor with electromagnetic excitation: Simulations and experimental results. Appl. Math. Model. 2017, 41, 1–24. [Google Scholar] [CrossRef]
  10. Sato, T. Design of a gpc-based pid controller for controlling a weigh feeder. Control Eng. Pract. 2010, 18, 105–113. [Google Scholar] [CrossRef]
  11. Czubak, P.; Lis, A. Analysis of a New Vibratory Conveyor Allowing for a Sudden Stopping of the Transport. Teh. Vjesn. 2020, 27, 520–526. [Google Scholar]
  12. Chandravanshi, M.L.; Mukhopadhyay, A.K. Dynamic analysis of vibratory feeder and their effect on feed particle speed on conveying surface. Measurement 2017, 101, 145–156. [Google Scholar] [CrossRef]
  13. Hua, C.; Zhang, L.; Guan, X. Distributed adaptive neural network output tracking of leader-following high-order stochastic nonlinear multiagent systems with unknown dead-zone input. IEEE Trans. Cybern. 2017, 47, 177–185. [Google Scholar] [CrossRef]
  14. Parameswaran, M.A.; Ganapathy, S. Vibratory conveying—Analysis and design: A review. Mech. Mach. Theory 1979, 14, 89–97. [Google Scholar] [CrossRef]
  15. Wang, P.; Zhu, L.; Zhu, X. Flow pattern and normal pressure distribution in flat bottom silo discharged using wall outlet. Powder Technol. 2016, 295, 104–114. [Google Scholar] [CrossRef]
  16. Weinhart, T.; Labra, C.; Luding, S.; Ooi, J.Y. Influence of coarse-graining parameters on the analysis of dem simulations of silo flow. Powder Technol. 2016, 293, 138–148. [Google Scholar] [CrossRef]
  17. Roberts, A.W.; Wensrich, C.M. Flow dynamics or ‘quaking’ in gravity discharge from silos. Chem. Eng. Sci. 2002, 57, 295–305. [Google Scholar] [CrossRef]
  18. Huang, X.J.; Zheng, Q.J.; Yu, A.B.; Yan, W.Y. Optimised curved hoppers with maximum mass discharge rate—An experimental study. Powder Technol. 2021, 377, 350–360. [Google Scholar] [CrossRef]
  19. Huang, X.J.; Zheng, Q.J.; Yu, A.B.; Yan, W.Y. Shape optimization of conical hoppers to increase mass discharging rate. Powder Technol. 2020, 361, 179–189. [Google Scholar] [CrossRef]
  20. Wang, S.Q.; Yan, Y.; Ji, S.Y. Transition of granular flow patterns in a conical hopper based on superquadric DEM simulations. Granul. Matter 2020, 22, 1–16. [Google Scholar] [CrossRef]
  21. Gonzalez-Montellano, C.; Ayuga, F.; Ooi, J.Y. Discrete element modelling of grain flow in a planar silo: Influence of simulation parameters. Granul. Matter 2011, 13, 149–158. [Google Scholar] [CrossRef]
  22. Gitiaray, M.; Taghvaei, S.; Hashemnia, K. DEM Study of the design parameters of a linear vibratory feeder in packaging black pepper seeds. Granul. Matter 2023, 25, 1–13. [Google Scholar] [CrossRef]
  23. Hassanpour, A.; Tan, H.; Bayly, A.; Gopalkrishnan, P.; Ghadiri, M. Analysis of particle motion in a paddle mixer using discrete element method (DEM). Powder Technol. 2011, 206, 189–194. [Google Scholar] [CrossRef]
  24. Sarkar, A.; Wassgren, C.R. Effect of particle size on flow and mixing in a bladed granular mixer. AIChE J. 2015, 60, 46–57. [Google Scholar] [CrossRef]
  25. Dubey, A. Powder Flow and Blending; Woodhead Publishing: Britain, UK, 2017; pp. 36–69. [Google Scholar]
  26. Tanabe, S.; Gopireddy, S.R.; Minami, H.; Ando, S.; Urbanetz, N.A.; Scherließ, R. Influence of particle size and blender size on blending performance of bi-component granular mixing: A DEM and experimental study. Eur. J. Pharm. Sci. 2019, 134, 205–218. [Google Scholar] [CrossRef] [PubMed]
  27. Beverloo, W.A.; Leniger, H.A.; Velde, J. The flow of granular solids through orifices. Chem. Eng. Sci. 1961, 15, 260–269. [Google Scholar] [CrossRef]
  28. Cordero, M.J.; Pugnaloni, L.A. Dynamic transition in conveyor belt driven granular flow. Powder Technol. 2015, 272, 290–294. [Google Scholar] [CrossRef]
  29. Jadidi, B.; Ebrahimi, M.; Ein-Mozaffari, F.; Lohi, A. A comprehensive review of the application of DEM in the investigation of batch solid mixers. Rev. Chem. Eng. 2022, 39, 729–764. [Google Scholar] [CrossRef]
  30. Fransen, M.P.; Langelaar, M.L.; Schott, D.L. Application of dem-based metamodels in bulk handling equipment design: Methodology and DEM case study. Powder Technol. 2021, 393, 205–218. [Google Scholar] [CrossRef]
  31. Emmerink, J.; Hadi, A.; Jovanova, J.; Cleven, C.; Schott, D.L. Parametric Analysis of a Double Shaft, Batch-Type Paddle Mixer Using the Discrete Element Method (DEM). Processes 2023, 11, 738. [Google Scholar] [CrossRef]
  32. Mukherjee, R.; Sansare, S.; Nagarajan, V.; Chaudhuri, B. Discrete element modeling (DEM) based investigation of tribocharging in the pharmaceutical powders during hopper discharge. Int. J. Pharm. 2021, 596, 120284. [Google Scholar] [CrossRef] [PubMed]
  33. Wang, J.; Liu, H.; Zhao, Y.F.; Qiao, X.L.; Li, X.G.; Zhao, H. DEM-CFD Simulation of Twin Screw Extrusion Process of Composite Solid Propellant. Chin. J. Energy Mater. 2022, 30, 138–145. (In Chinese) [Google Scholar]
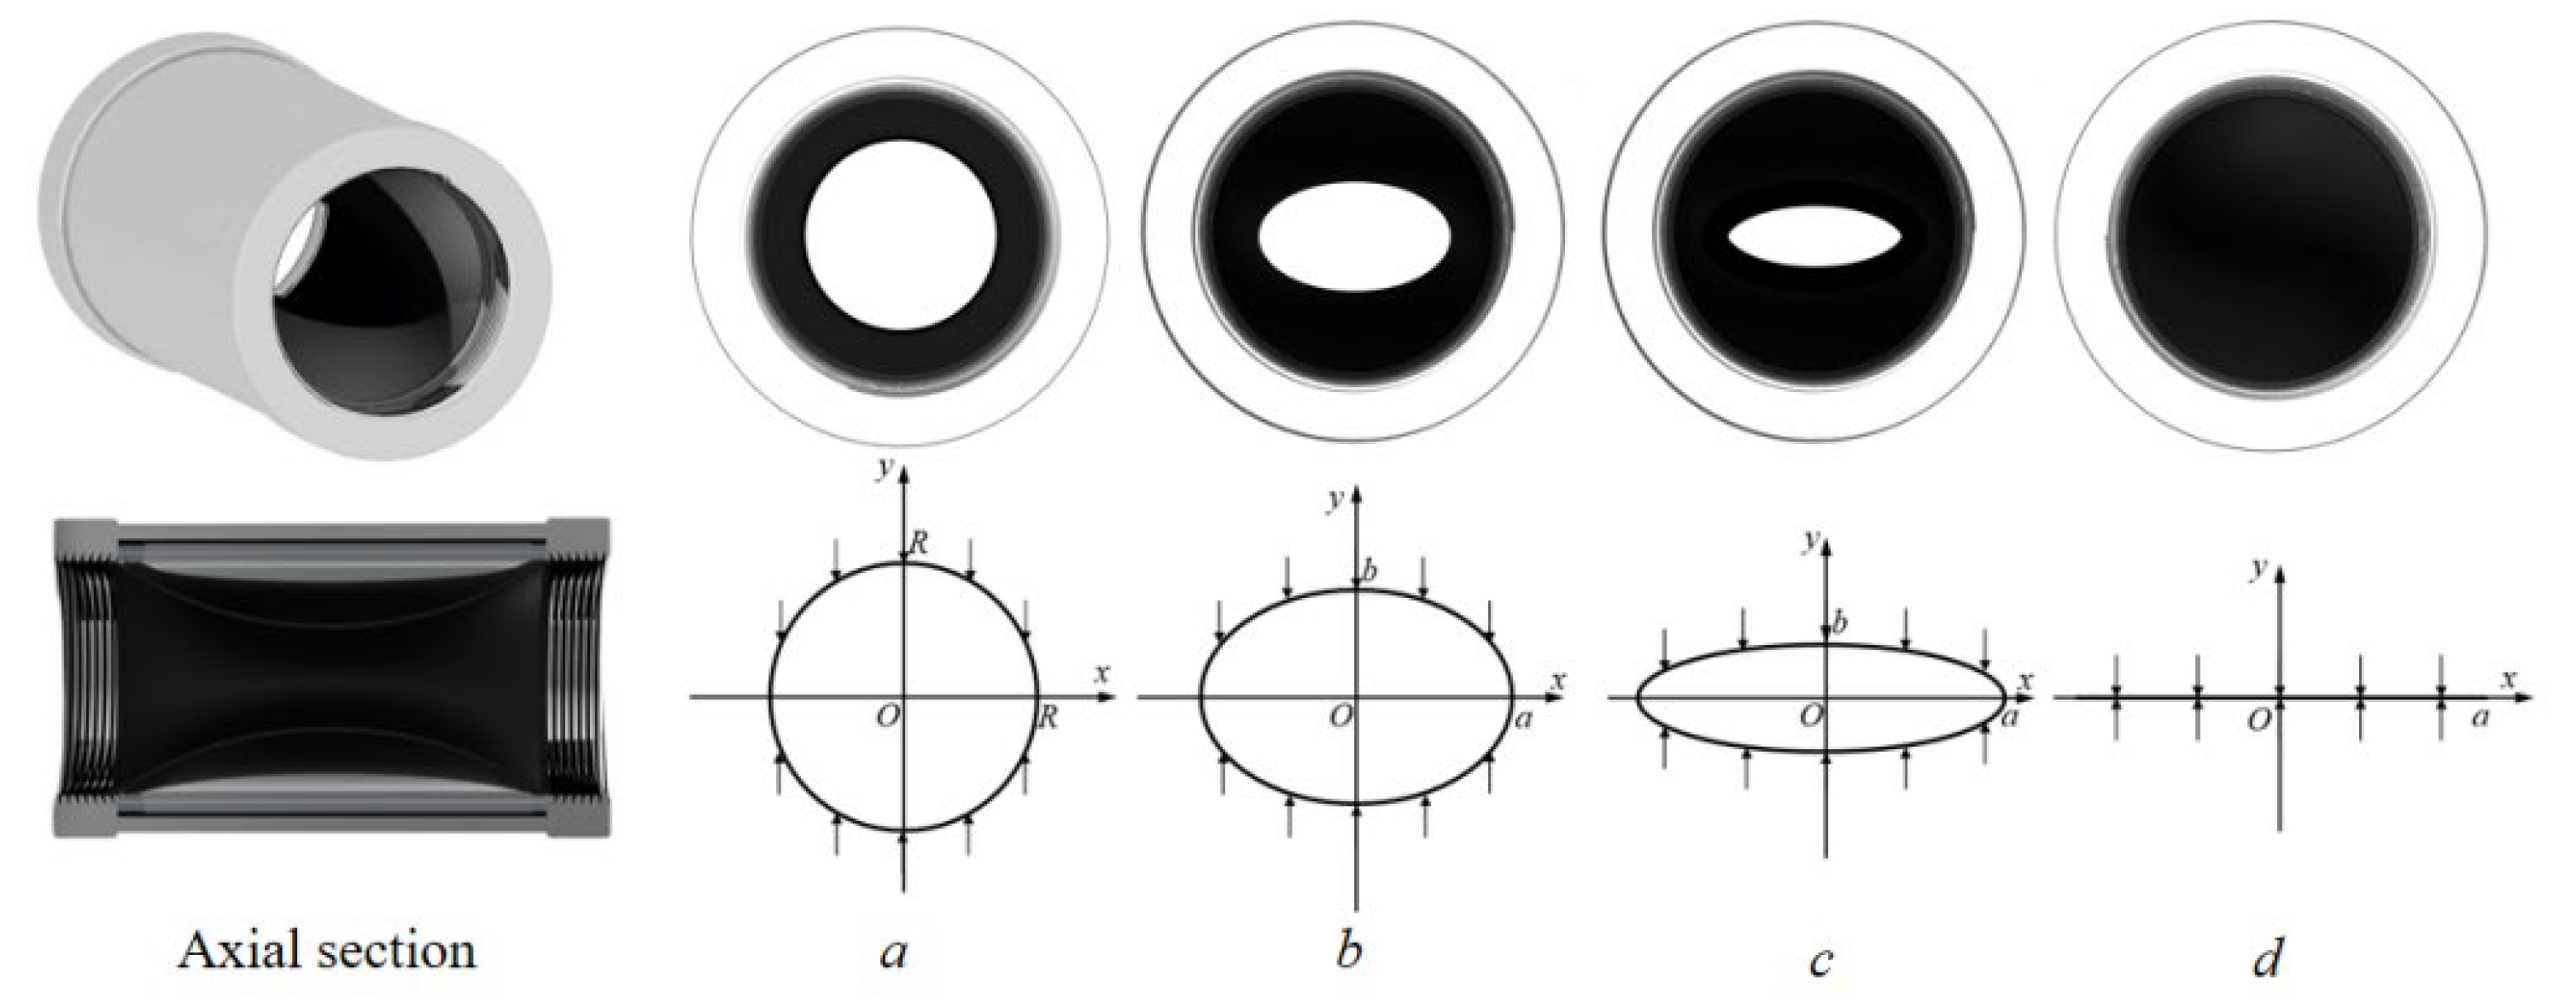
Figure 1. The axial section of the air-operated pinch valve and the change in the section after the air flows into the air-operated pinch valve (from a to d).
Actuators 12 00285 g001
Figure 2. Schematic diagram of the feeding and weighing device.
Actuators 12 00285 g002
Figure 3. Discharge weight in 1 s at different frequencies (color).
Actuators 12 00285 g003
Figure 4. Geometry of the hopper used in the present DEM simulation: (a) 3D mesh and size of the hopper, and (b) particle filling and dam board of the hopper.
Actuators 12 00285 g004
Figure 5. Mass flow rate with the frequency change curve.
Actuators 12 00285 g005
Figure 6. Optimization results for feeding and weighing precision and time consumption.
Actuators 12 00285 g006
Figure 7. Model experiment device diagrams.
Actuators 12 00285 g007
Figure 8. Comparing the optimization method with the existing feeding and weighing method (Sequences 1–5: optimization method, Sequence 6: existing method) (color).
Actuators 12 00285 g008
Figure 9. Experimentally measured data: (a) weighing values; (b) time consumption.
Actuators 12 00285 g009
Table 1. DEM simulation parameters.
TypeParametersValue
AP particleDensity, ρp (kg/m3)1950
Poisson ratio, νp0.4
Shear modulus, Gp (Pa)1 × 10⁸
SiloDensity, ρs (kg/m3)7800
Poisson ratio, νs0.3
Shear modulus, Gs (Pa)7 × 10¹⁰
Particle-particleRestitution coefficient, epp0.35
Coefficient of static friction, μspp0.1
Coefficient of rolling friction, μrpp0.05
Particle-siloRestitution coefficient, eps0.45
Coefficient of static friction, μsps0.1
Coefficient of rolling friction, μrps0.01
SimulationTime step, Δt (s)5 × 10⁻⁶
Gravitational acceleration (m/s2)9.81
Table 2. Composition structure and the corresponding sizes of the hopper used in the present DEM simulation.
Composition Structure
L1L2L3
DefinitionCylindrical SectionConical SectionOutput Section
Size (mm)200200100
Table 3. The parameters for the five groups of optimized sequences.
First Stage Frequency
f1 (Hz)
Second Stage Frequency
f2 (Hz)
Third Stage Frequency
f3 (Hz)
Precision
Value
α (%)
Time Consumption
T (s)
14.508.8031.00100.03720.94
24.709.6031.0099.95421.54
34.708.5034.5099.96422.02
44.5010.0034.50100.00122.16
54.9010.2032.5099.95722.45
Disclaimer/Publisher’s Note: The statements, opinions and data contained in all publications are solely those of the individual author(s) and contributor(s) and not of MDPI and/or the editor(s). MDPI and/or the editor(s) disclaim responsibility for any injury to people or property resulting from any ideas, methods, instructions or products referred to in the content.