Abstract
In order to study pressure fluctuation characteristics of a centrifugal pump as turbine (PAT) in its start-up process, Fluent was used to do numerical simulation of the PAT start-up process. Time and frequency domain analyses were performed on the data acquired at different positions and different heads. The results show that a large number of low-pressure areas and strong vortexes are formed within the impeller at the initial time of start-up. With the increase in rotating speed, the vortexes rapidly decrease and are concentrated on the blade non-working face. The pressure fluctuation amplitude is the maximum at the start-up initial instant; with increase in rotating speed, it reduces rapidly at the volute spiral part. The pressure fluctuation number within one impeller rotation cycle is consistent with blade number, and the dominant frequency of pressure fluctuation is 6 times the impeller rotational frequency. The dominant frequency amplitude of radial pressure fluctuation increases with decrease in radial size in the volute. The pressure fluctuation in the impeller is much more intensive than that in the volute, and its maximum dominant frequency amplitude occurs in the middle of the impeller towards the inner edge. With the increase in head, the number of pressure fluctuation and the amplitude of dominant frequency increase at the same time during the start-up process.
1. Introduction
A centrifugal pump as turbine (PAT) is more and more widely used in hydrocracking, wastewater treatment, seawater desalination and so on. The development of PAT energy recovery technology is of great significance to energy saving and emission reduction and achieving sustainable green development [1,2,3]. Performance parameters such as rotating speed, flow rate and pressure during the PAT start-up process change dramatically in a short time, and the internal fluid is in an unstable transient flow state, which can easily cause huge pressure fluctuation and shock [4]. Generating vibration and noise in the start-up process can result in damage to the PAT itself or failure of the operation normally, so it is particularly important to predict and prevent the pressure fluctuation during PAT start-up.
Some scholars have proposed PAT performance prediction methods under stable working conditions through theoretical analysis, numerical simulation and experimental tests. The different conversion formulas of flow rate and head between pump and PAT were derived and provided reference for performance prediction and selection design of PAT [5,6,7,8]. There were some papers introducing pressure fluctuation characteristics of a centrifugal pump, mixed-flow pump, axial flow pump and PAT under stable working conditions. Yao et al. proposed that the fluctuation behavior at the blade-passing frequency was the most prominent near the volute tongue zone and the pressure waves propagated in both the radial and circumferential directions [9]. Huang et al. indicated that the root cause of low-frequency pressure fluctuation was the eddies generated due to streamline distortion of the centrifugal pump [10]. Jin et al. found that the optimum flow rate conditions of different rotating speed had a similar dominant frequency of pressure fluctuation and the pressure fluctuation amplitude increased with the rotating speed increasing for a mixed flow pump [11]. Zhang et al. proposed that the main frequencies of pressure fluctuations of an axial flow pump in different flow rate conditions were all blade-passing frequency and the amplitudes of harmonic frequency decayed exponentially [12]. Feng et al. developed that the variable inlet guide vane could decrease the angle of attack at the impeller entrance and further descend the amplitude of low-frequency pressure fluctuation when the axial flow pump was operated under off-design conditions [13]. Sun et al. developed the distribution of pressure fluctuations in a prototype pump-turbine under pump mode at different mass flow and guide vane openings [14]. Li et al. found that the amplitude of pressure fluctuations with oscillating guide vanes was higher than with the fixed guide vanes opening [15]. Yang et al. proposed that increasing the number of blades and increasing the radial clearance between the impeller outer diameter and the volute base circle diameter could significantly reduce the pressure fluctuation in the PAT [16,17,18]. Shi et al. proposed that increasing the number of guide vanes and reducing the inlet section of the volute could effectively reduce the pressure pulsation in each flow passage component of a pump turbine [19,20]. Dai et al. and Shi et al. proposed that both the fluctuation amplitude and dominant frequency were the maximal under high flow rate and low gas content [21,22]. Li et al. analyzed the time–frequency characteristics of pressure fluctuation of a mixed-flow pump under different starting times and different flow rates. There was a maximum amplitude of the main frequency caused by the pressure shock at the end of the start under the fast-start condition [23]. Fu et al. investigated the transient characteristics of an axial flow pump during the start-up process experimentally and numerically. The vortex core zones gradually increased and massively appeared at the leading edges of the blade in the process of pump start-up [24].
However, there are few studies on transient characteristics of PAT during the start-up process. Therefore, on the basis of verifying the reliability of CFD simulation and the pressure fluctuation in the flow field during PAT start-up, time and frequency domain analyses were performed on the data acquired at different radial and circumferential positions in the volute, different positions in the impeller and different heads. The study will provide a guideline for improving the stability and reliability of the PAT start-up process.
2. Research Methods
2.1. Rotating Speed Control Equation
PAT speeds up its rotation passively during start-up process, and the relationship between rotating speed and time is usually obtained in order to simulate start-up process of rotating machine. The rotor system rotates because of fluid flow torque, load torque and friction-resisting torque, the rotation equation of rotor is based on the d’Alembert principle [25]:
where ΣMi is the resultant torque on the rotor, J is the rotational inertia of the rotor, ω is the angular speed of the rotor, Mt is the fluid flow torque on the rotor, Ml is the load torque on the rotor, Mf is the frictional resistance torque on the rotor, ρ is the fluid density, g is the acceleration of gravity, H is the head, Q is the flow rate, η is the efficiency.
Formulas (2) and (3) are substituted in Formula (1), and Formula (4) is derived as follows.
where Nl is the load consumption power, Nf is the frictional resistance loss power. When the inlet pressure and outlet pressure are both stable, the H is constant. For fixed valve opening, the η is approximately constant during transient process. The formula of relationship between angular speed and time during PAT start-up is obtained by integrating Equation (4):
2.2. Calculation Method
The interface between PAT impeller and volute or outlet pipe is definite, that is, there are two overlapping surfaces at the interface. The Fluent sliding mesh model allows us to create a problem where different regions move relative to each other, so the sliding mesh can be used instead of dynamic mesh model for transient calculation. On the basis of ensuring better mesh quality, sliding mesh can avoid negative mesh and save calculation time [26]. The UDF program of PAT passive rotating is written from the rotation equation of rotor and compiled in Fluent, and the torque on the blade is calculated by the Compute_Force_And_Moment function, and the angular speed of rotator is obtained by the rotation equation [25]. The angular speed is transferred into the sliding mesh flow field solver by macro DEFINE_ZONE_MOTION, and the impeller domain mesh is being adjusted dynamically. Starting from ω0 = 0, the angular speed ωn+1 is iterated for each time step. As the time step advances, the resultant torque of the impeller gradually decreases, and the rotating speed gradually approaches the rated speed, so as to complete the start-up process. The simulation process of solving the PAT start-up process is shown in Figure 1.
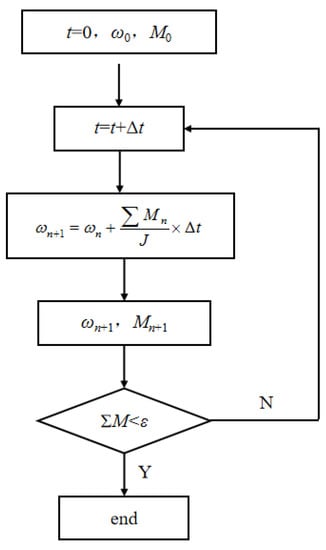
Figure 1.
Simulation process of centrifugal pump as turbine (PAT) during starting period (Δt = 0.0005 s).
3. Numerical Simulation and Verification
3.1. Computational Model
The IS80-50-315 centrifugal pump as turbine (PAT) is taken as the research object. Its main design parameters are: design rate of flow Q = 50 m3/h, design head H = 50 m, rated speed n = 1450 r/min and impeller rotation frequency fn = 24.17 Hz. Its main structural parameters are shown in Table 1. The IS100-65-250 centrifugal pump is selected as the energy dissipation pump, and its rated power is 2.05 kW. The output power of PAT matches the energy dissipation pump well, and rotational inertia of the whole rotor system is 0.35 kg·m2.

Table 1.
Main structure dimensions of PAT.
Figure 2 shows the main strcture and pressure monitoring points of PAT. In order to monitor the pressure fluctuation at each position in the PAT, a series of monitoring points are set up and represent fluid particles at different locations in the PAT. The points 1, 2, 3, 4, 5, 6, 7 and 8 in the volute area are monitored, and the points 9, 10 and 11 in the impeller area are monitored.
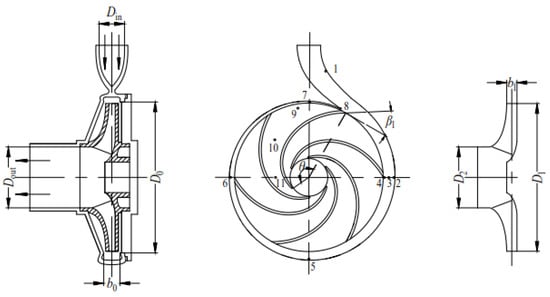
Figure 2.
Structure and pressure monitoring points of PAT.
Figure 3 shows the computational domain and meshing of PAT flow field. The flow field calculation domain of the PAT includes three parts: the volute, the impeller and the draft tube. When the pump is used as PAT, the outlet of pump is the inlet of PAT, and the inlet of pump is the outlet of PAT. The fluid enters into the volute at the inlet of PAT and impacts the impeller to rotate. The entire flow domains are generated using PTC Creo software. The hexahedron structured grids are generated with ICEM CFD [26]. Mesh refinement of near-wall and blade head regions is performed, and most of y+ on the wall is less than 50. Different grid scales are used to perform the grid independence analysis corresponding to 7.16 × 10⁵, 1.14 × 10⁶, 1.90 × 10⁶, 2.82 × 10⁶ and 3.66 × 10⁶ nodes. As shown in Figure 4, when the number of grids reaches 1.90 × 10⁶, the relative change in efficiency and head is less than 1.5%. Therefore, 1.90 × 10⁶ is selected as the number of grids for all simulations in this study.
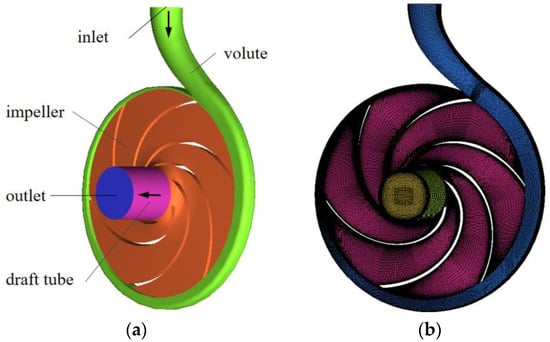
Figure 3.
Computational domain and meshing of PAT flow field: (a) PAT computational domain of flow field; (b) Computational domain meshing of PAT.
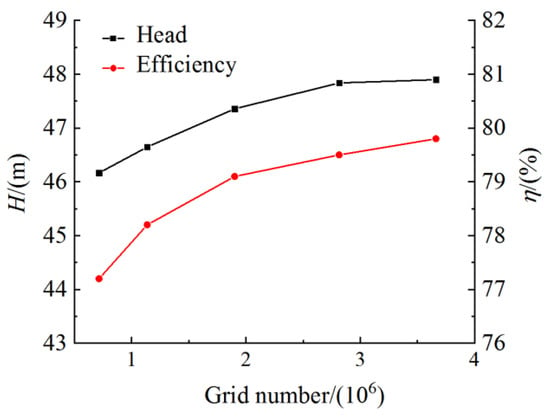
Figure 4.
Check of grid independence (the left y axis represents head and the right y axis represents efficiency).
3.2. Boundary Condition
Fluent is used to simulate the start-up process of PAT. RNG k-ε turbulence model is selected. The coupling mode of pressure and velocity is SIMPLEC. The solid wall is non-slip boundary condition, and the standard wall function is used near the wall. The incoming flow pressure is approximately considered as constant during start-up process, and the inlet and outlet boundary conditions are set by pressure. The inlet pressure is consistent with that under steady condition. To prevent the hydraulic turbine from getting cavitated, the 0.4–0.6 MPa pressure is normally reserved at the outlet of PAT; therefore, the outlet pressure is set at 0.5 MPa [27]. The independence of time step is verified by comparing the rotating speed at the same time in the start-up process. When the time step is 0.0005 s, it basically meets the independence requirement. Therefore, 0.0005 s is selected as the time step of transient calculation in this study. In the calculation process, the residual convergence target is set at 10−4, and the maximum iteration number of each time step is 20. The steady calculation results under design conditions are used as the initial flow field. Starting from the stationary state, when the resultant torque of rotor is less than the calculation residual, the rotating speed meanwhile reaches the rated speed, which indicates the transient calculation of the start-up process is completed.
3.3. Experimental Verification
The PAT performance test experimental device is mainly composed of feed pump, PAT, consume pump, water tank, circulation pipeline system and test system. The NC-3 torque meter with measurement accuracy of 0.2 grade is set between PAT and consume pump to measure speed and torque. The LWGY-100 turbine flowmeter with measurement accuracy of 0.5 grade and rated pressure of 1.6 MPa is set in the inlet pipeline of PAT to measure the inlet flow of PAT [28]. The WT-151 pressure transmitter with measurement accuracy of 0.2 grade is set in the inlet and outlet pipeline of PAT to measure the inlet and outlet pressure. The PAT test principle and test rig are shown in Figure 5 and Figure 6.
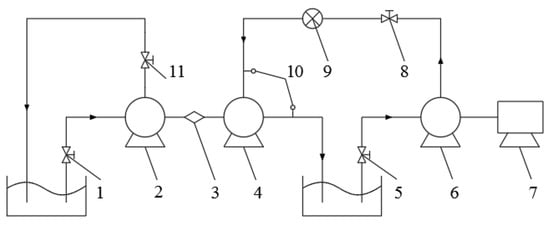
Figure 5.
Experiment schematic diagram of PAT. 1, 5. Gate valve; 2. Consume pump; 3. Torque meter; 4. PAT; 6. Feed pump; 7. Motor; 8, 11. Control valve; 9. Flow meter; 10. Pressure transmitter.
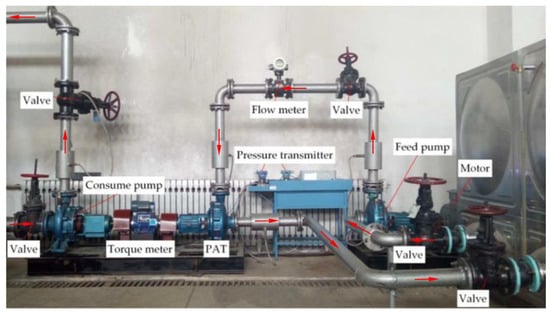
Figure 6.
Test bench for PAT characteristics.
The head and efficiency of PAT at stable operation under different flow rates are tested and compared with the simulation results as shown in Figure 7. The torque and rotating speed signals are collected and processed once every 0.1 s in the start-up process, and the rotating speeds acquired by testing are compared with those by simulation as shown in Figure 8. It can be seen from the diagrams that the simulation results are basically consistent with those of experiments. The hydraulic pulsation characteristics of the turbine are indirectly verified by monitoring the vibration characteristics of the PAT. The FLUKE F802 vibrometer with the accuracy of ±5% is used to measure the horizontal, vertical and axial vibration velocities by setting test points at the base of the PAT pump body, the middle suspension and the bearing box position, respectively. The root mean square of vibration velocity (vu) directly reflects the strength of vibration, which is defined as follows:
where v(t) is the vibration velocity related to time, T is the sampling time, and vu is the root mean square of vibration velocity. The root mean square of vibration velocity for high speed pump is required to vu ≤ 3.0 mm/s according to API610 [28]. The test results meet the allowable range of API610, which shows that the analysis of pressure fluctuation for PAT is reliable in this study.
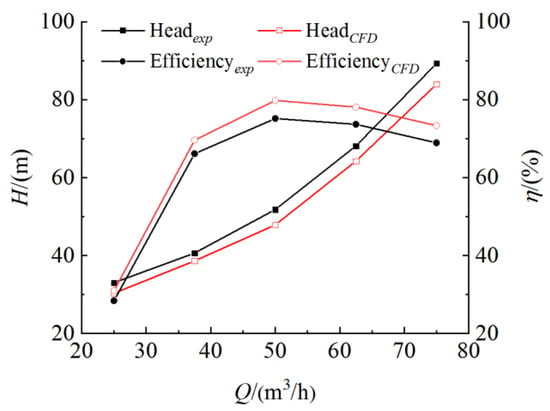
Figure 7.
The comparison of PAT performance starting period by simulation and experiment (the left y axis represents head and the right y axis represents efficiency).
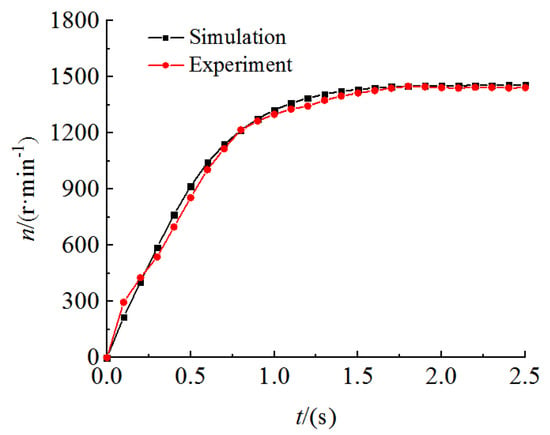
Figure 8.
The comparison of rotating speed during calculation and experiment.
4. Results and Analysis
4.1. Evolution Analysis of Internal Flow Field
The pressure distributions of the vertical axis plane changing over time were investigated in order to explore the evolution law of the internal flow field during the PAT start-up. Figure 9 shows the pressure distributions of the axial vertical plane during the start-up process. It can be observed from Figure 9 that there are a large number of low-pressure areas in the impeller channel at t = 0.5 s. With the increase in rotating speed, the low-pressure areas in the impeller gradually decrease. After t = 1.5 s, the rotating speed tends to be stable and reaches the rated speed, the pressure in the volute decreases gradually along the volute channel, and it has gradient distribution in the impeller. The low-pressure areas are mainly concentrated in the inner edge of the impeller.

Figure 9.
Pressure distributions of axial vertical plane during start-up process. (a) t = 0.5 s; (b) t = 1.0 s; (c) t = 1.5 s; (d) t = 2.0 s.
In order to further understand the transient characteristics of PAT during the start-up process, the velocity streamlines of the axial vertical plane changing over time were investigated. Figure 10 shows velocity streamline distributions of the axial vertical plane during the start-up process. It can be observed from Figure 10 that vast vortexes are formed in the flow passages of the impeller at t = 0.5 s. It indicates that the transient impact can increase the load on the blade surface significantly and cause the vibration and deformation of the blade at the initial startup time. With the increase in the rotating speed, the vortex intensity in the impeller rapidly decreases to the lowest at t = 1.0 s. After t = 1.5 s, there still exist some small vortexes and they are mainly concentrated on the blade non-working face.

Figure 10.
Velocity streamline distributions of axial vertical plane during start-up process. (a) t = 0.5 s; (b) t = 1.0 s; (c) t = 1.5 s; (d) t = 2.0 s.
4.2. Analysis of Pressure Fluctuation at the Volute Radial Location
Figure 11 shows the time domain diagrams of pressure fluctuation at volute radial location monitoring points 2, 3 and 4 during the start-up process (t = 0~2.5 s), the first circle of impeller rotation (t = 0~0.255 s) and a circle of impeller rotation after stable speed (t = 2.458~2.5 s), respectively. Figure 12 shows the frequency domain diagram of pressure fluctuation at radial location of the volute obtained by fast Fourier transform (FFT). The abscissa in the frequency domain diagram is the multiple of the fluctuation frequency f and the impeller rotational frequency fn. It can be observed from the diagrams that the pressure fluctuation law of each radial monitoring point is similar. Under the impact of instantaneous pressure, the pressure fluctuation amplitude is the largest at the initial time of start-up. With the increase in rotating speed, the pressure fluctuation amplitude decreases rapidly, and the time interval between adjacent peaks of the time domain curve decreases gradually. A variation period of radial pressure fluctuation is consistent with rotation period of the impeller, and the number of pressure fluctuation in each variation period is consistent with blade number; in other words, the number of pressure fluctuation is 6 per circle of the impeller rotation. At point 4 near the coupling surface of the impeller and the volute, due to the interference between the rotating impeller and the stationary volute, a slight secondary fluctuation occurs in each fluctuation period. The dominant frequency of pressure fluctuation in each radial position of the volute is 6 times of the impeller rotational frequency. The dominant frequency amplitude and mean pressure of pressure fluctuation are the largest at point 2, followed by point 3, and it is the minimum at point 4. It indicates that the dominant frequency amplitude and mean pressure of radial pressure fluctuation in the volute gradually decrease with the decrease in radial size.
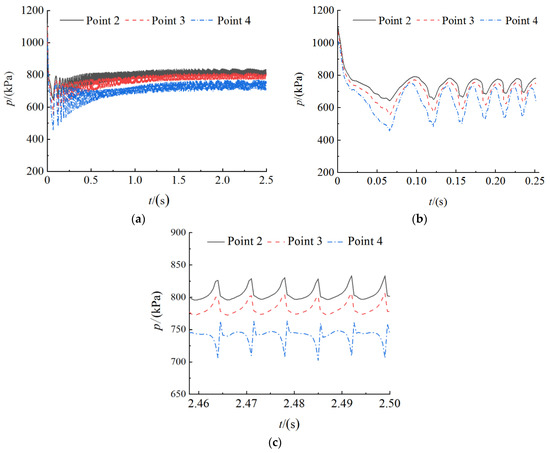
Figure 11.
Time domain of pressure fluctuation at volute radial location. (a) t = 0~2.5 s; (b) t = 0~0.255 s; (c) t = 2.458~2.5 s.
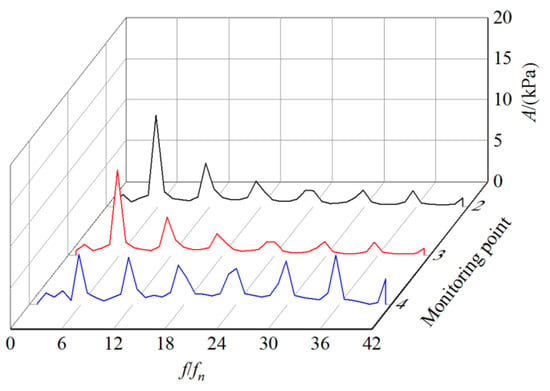
Figure 12.
Frequency domain of pressure fluctuation at volute radial location (curves 2, 3 and 4 represent frequency domain curves at monitoring points 2, 3 and 4 respectively).
4.3. Analysis of Pressure Fluctuation at the Volute Circumferential Location
Figure 13 shows the time domain diagrams of pressure fluctuation at volute circumferential location monitoring points 1, 2, 5, 6, 7 and 8 during the start-up process (t = 0~2.5 s), the first circle of impeller rotation after start-up (t = 0~0.255 s) and a circle of impeller rotation after stable speed (t = 2.458~2.5 s), respectively. Figure 14 shows the frequency domain diagram of pressure fluctuation of the volute circumferential location obtained by FFT. It can be observed from the diagrams that the pressure of volute inlet position at point 1 is relatively stable during start-up, and its pressure fluctuation amplitude is small. The pressure fluctuation amplitude of the volute spiral part at each circumferential position is the largest at the initial time of start-up. With the increase in rotating speed, the pressure fluctuation amplitude decreases rapidly, and the time interval between adjacent peaks of the time domain curve decreases gradually. A variation period of circumferential pressure fluctuation is also consistent with rotation period of the impeller. The number of pressure fluctuation in each variation period is consistent with blade number, but the pressure fluctuation waveform at each circumferential position monitoring point is not the same in one rotation period. The dominant frequency of the pressure fluctuation in each circumferential position of the volute is 6 times the impeller rotational frequency. The dominant frequency amplitude of the pressure fluctuation at point 7 is the largest, followed by point 2 and point 5, and it is smaller at point 6 and point 8. There are obvious secondary fluctuations in one fluctuation period at point 7 and point 8. The main reason is that point 7 is located at the front end of the volute tongue, and point 8 is located at the volute tongue. When the fluid flows along the flow channel to the volute tongue, the cross section of the volute is the smallest and the pressure drop is the largest. In addition, point 7 and point 8 are closest to the coupling surface between the impeller and the volute, and they are affected by the dynamic and static interference between the impeller and the volute. It can be indicated that the pressure fluctuation at the front end of the volute tongue is the largest.
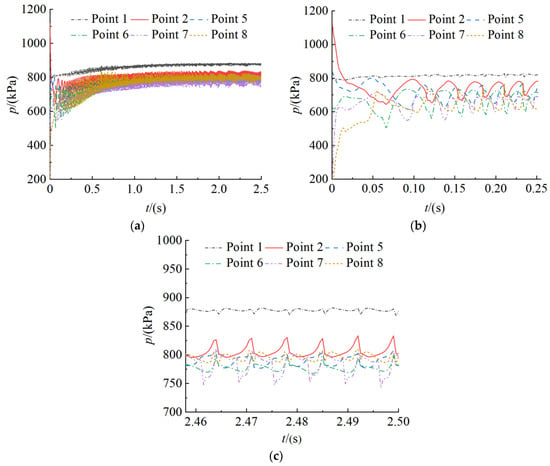
Figure 13.
Time domain of pressure fluctuation at volute circumferential location. (a) t = 0~2.5 s; (b) t = 0~0.255 s; (c) t = 2.458~2.5 s.
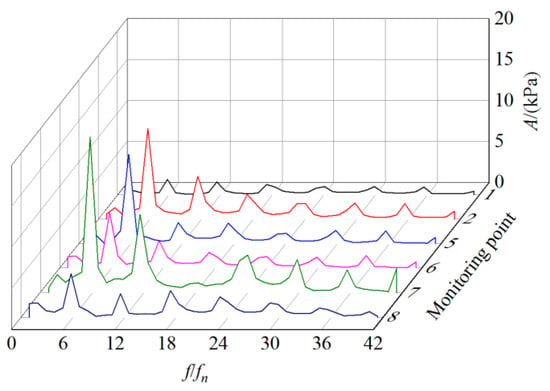
Figure 14.
Frequency domain of pressure fluctuation at volute circumferential location (curves 1, 2 5, 6, 7 and 8 represent frequency domain curves at monitoring points1, 2, 5, 6, 7 and 8 respectively).
4.4. Analysis of Pressure Fluctuation in the Impeller
Figure 15 shows the time domain diagrams of pressure fluctuation at impeller monitoring points 9, 10 and 11 during the start-up process (t = 0~2.5 s), the first circle of impeller rotation after start-up (t = 0~0.255 s) and a circle of impeller rotation after stable speed (t = 2.458~2.5 s), respectively. Figure 16 shows the frequency domain diagram of pressure fluctuation in the impeller obtained by FFT. It can be observed from the figure that the pressure fluctuation in the impeller is a step waveform. With the increase in the rotating speed, the time interval between the adjacent peaks of the time domain curve decreases gradually. The amplitude of the pressure fluctuation attenuates slowly with the increase in the rotating speed, and the amplitude of the secondary dominant frequency and the impeller rotational frequency doubling are still large. One variation period of pressure fluctuation in the impeller is also consistent with the impeller rotation period, and the number of pressure fluctuation in each variation period is consistent with blade number. The dominant frequency of pressure fluctuation in each position of the impeller is 6 times the impeller rotational frequency, and the dominant frequency amplitude and secondary dominant frequency amplitude at point 11 are the largest. It indicates that the pressure fluctuation in the middle part near the inner edge of the impeller is the strongest. Combined with Figure 14, it can be observed that the dominant frequency amplitude of the maximum pressure fluctuation at point 11 in the impeller is 10 times that at point 7 in the volute, which indicates that the pressure fluctuation in the impeller is much larger than that in the volute.
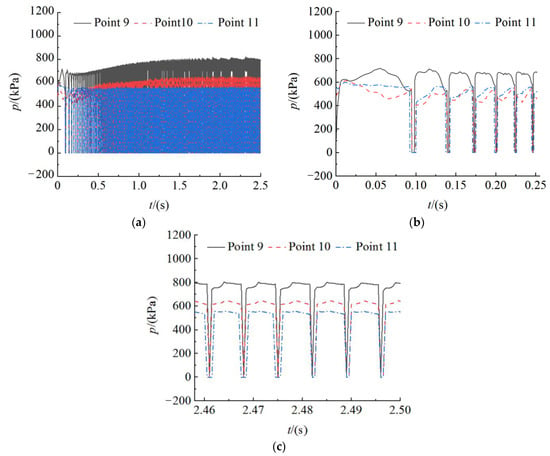
Figure 15.
Time domain of pressure fluctuation in impeller. (a) t = 0~2.5 s; (b) t = 0~0.255 s; (c) t = 2.458~2.5 s.
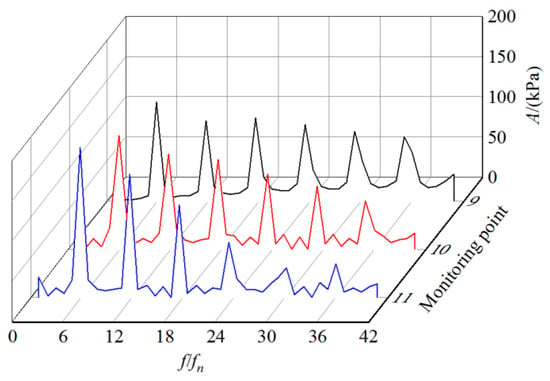
Figure 16.
Frequency domain of pressure fluctuation in impeller (curves 9, 10 and 11 represent frequency domain curves at monitoring points 9, 10 and 11 respectively).
4.5. Analysis of Pressure Fluctuation at Various Head
Since the pressure fluctuation of each monitoring point has the same variation with the head, the monitoring point 7 is taken as an example for analysis. By monitoring the rotating speed of the start-up process, it can be observed that the rotating speed is 495 r/min after the first circle of impeller rotation under the design head, and the rotating speed is 1455 r/min after completing start-up. Under the low-pressure head of 0.8H, the rotating speed is 322 r/min after the first circle of impeller rotation, and the rotating speed is 1168 r/min after completing start-up. Under the high pressure head of 1.2H, the rotating speed is 657 r/min after the first circle of impeller rotation, and the rotating speed is 1631 r/min after completing start-up. Figure 17 shows the time domain diagrams of pressure fluctuation at point 7 during the start-up process (t = 0~2.5 s, t = 0~0.255 s, and t = 2.458~2.5 s) under different heads. Figure 18 shows the frequency domain diagram of pressure fluctuation obtained by FFT. It can be observed from the diagrams that the number of pressure fluctuation under the low head is less than that under the high head at the same time, that is, the impeller needs a longer time to rotate one circle and the rotating speed increases more slowly under the low head during the start-up process. The dominant frequency amplitude at point 7 under the high head 1.2H is 1.34 times that under the design head H, and under the low head 0.8H it is 0.65 times that under the design head H. It can be indicated that the pressure fluctuation degree under the low head is weaker, and the dominant frequency amplitude is smaller. With the increase in the head, the time required to complete the start-up reduces and the rotating speed increases after completing start-up. Meanwhile, the number of pressure fluctuation at the same time, the fluctuation amplitude, the dominant frequency amplitude and the secondary dominant frequency amplitude of pressure fluctuation increase during the start-up process.
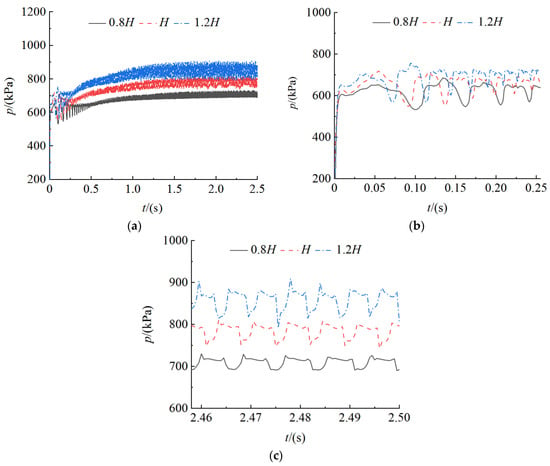
Figure 17.
Time domain of pressure fluctuation at various head in volute. (a) t = 0~2.5 s; (b) t = 0~0.255 s; (c) t = 2.458~2.5 s.
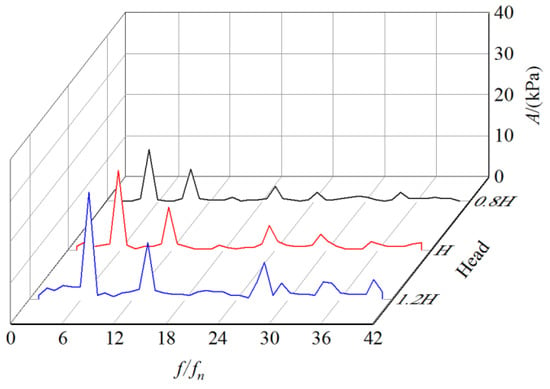
Figure 18.
Frequency domain of pressure fluctuation at various head in volute (curves 0.8H, H and 1.2H represent frequency domain curves when the head is 0.8H, H and 1.2H respectively).
5. Conclusions
In the current paper, the flow field behaviors and pressure fluctuation characteristics of the PAT start-up process were studied using numerical simulation and experiments. The primary conclusions can be summarized as follows:
- (1)
- At the beginning of start-up, there are a large number of low-pressure areas and strong vortexes in the impeller. With the increase in rotating speed, the pressure has a gradient distribution along the flow channel, and the vortexes rapidly decrease and are concentrated on the blade non-working face.
- (2)
- The pressure fluctuation amplitude is the largest at the initial start time. With the increase in rotating speed, the pressure fluctuation amplitude of the spiral part in the volute attenuates rapidly, but it attenuates slowly in the impeller. The number of pressure fluctuation at each position in one impeller rotation cycle is consistent with the blade number, and the dominant frequency of pressure fluctuation is 6 times that of the impeller rotation frequency.
- (3)
- With the decrease in radial dimension, the dominant frequency amplitude and time-averaged pressure of radial pressure fluctuation in the volute decrease gradually. The pressure fluctuation at the front end of the tongue is the largest in the volute. The most intense pressure fluctuation in the impeller occurs in the middle of the impeller towards the inner edge. The pressure fluctuation in the impeller is much larger than that in the volute. Due to the dynamic and static interference between the impeller and the volute, the secondary fluctuation occurs near the coupling surface in a period of pressure fluctuation.
- (4)
- With the increase in the head, the time required to complete the start-up decreases and the rotating speed increases after completing the start-up. Meanwhile, the number of pressure fluctuation at the same time, the fluctuation amplitude and the dominant frequency amplitude of pressure fluctuation increase during the start-up process.
Author Contributions
Conceptualization, B.C. and J.Y.; methodology, J.Y.; software, B.C.; validation, X.W. and B.J.; formal analysis, B.C.; investigation, B.C. and X.W.; writing—original draft preparation, B.C.; writing—review and editing, B.C. and B.J.; project administration, J.Y.; funding acquisition, J.Y. All authors have read and agreed to the published version of the manuscript.
Funding
This research was funded by the National Natural Science Foundation of China (grant number: 52169019); University Industry Support Project of Gansu Province (grant number: 2020C-20).
Institutional Review Board Statement
Not applicable.
Informed Consent Statement
Not applicable.
Data Availability Statement
The data presented in this study are available on request from the corresponding author.
Acknowledgments
The authors would like to express sincere appreciation to the editor and the anonymous reviewers for their valuable comments and suggestions for improving the presentation of the manuscript.
Conflicts of Interest
The authors declare no conflict of interest.
References
- Wang, X.; Yang, J.; Shi, F. Status and prospect of study on energy recovery hydraulic turbines. J. Drain. Irrig. Mach. Eng. 2014, 32, 742–747. [Google Scholar]
- Binama, M.; Su, W.T.; Li, X.B.; Li, F.C.; Wei, X.Z.; An, S. Investigation on pump as turbine (PAT) technical aspects for micro hydropower schemes: A state of the art review. Renew. Sustain. Energy Rev. 2017, 79, 148–179. [Google Scholar] [CrossRef]
- Chen, T.; Zhang, Y.; Li, S. Instability of large-scale prototype Francis turbines of Three Gorges power station at part load. Proc. Inst. Mech. Eng. Part A J. Power Energy 2016, 230, 619–632. [Google Scholar] [CrossRef]
- Sanjay, V.; Rajesh, N. Investigations on pump running in turbine mode: A review of the state-of-the-art. Renew. Sustain. Energy Rev. 2014, 79, 842–868. [Google Scholar]
- Huang, S.; Qiu, G.; Su, X.; Chen, J.; Zou, W. Performance prediction of a centrifugal pump as turbine using rotor volute matching principle. Renew. Energy 2017, 108, 64–71. [Google Scholar] [CrossRef]
- Stefanizzi, M.; Torresi, M.; Fortunato, B. Experimental investigation and performance prediction modeling of a single stage centrifugal pump operating as turbine. Energy Procedia 2017, 126, 589–596. [Google Scholar] [CrossRef]
- Venturini, M.; Manservigi, L.; Alvisi, S.; Simani, S. Development of a physics-based model to predict the performance of pumps as turbines. Appl. Energy 2018, 231, 343–354. [Google Scholar] [CrossRef]
- Daniele, N.; Aonghus, M. A model for the extrapolation of the characteristic curves of pumps as turbines from a datum best efficiency point. Energy Convers. Manag. 2018, 174, 1–7. [Google Scholar]
- Yao, Z.; Wang, F.; Qu, L.; Xiao, R.; He, C.; Wang, M. Experimental investigation of time-frequency characteristics of pressure fluctuations in a double-suction centrifugal pump. ASME J. Fluids Eng. 2011, 133, 101303–101312. [Google Scholar] [CrossRef]
- Huang, X.; Liu, Z. Analysis of low frequency pressure fluctuations in vaneless centrifugal pump volute. J. Mech. Eng. 2014, 50, 170–176. [Google Scholar] [CrossRef]
- Jin, S.; Wang, Y.; Chang, S.; Su, Y. Pressure fluctuation of interior flow in mixed-flow pump. Trans. Chin. Soc. Agric. Mach. 2013, 44, 64–68. [Google Scholar]
- Zhang, D.; Wang, H.; Shi, W.; Pan, D.; Shao, P. Experimental investigation of pressure fluctuation with multiple flow rates in scaled axial flow pump. Trans. Chin. Soc. Agric. Mach. 2014, 45, 139–145. [Google Scholar]
- Feng, W.; Cheng, Q.; Guo, Z.; Pan, J. Characteristics of low frequency pressure fluctuation in axial flow pump with variable inlet guide vane. Trans. Chin. Soc. Agric. Mach. 2015, 46, 62–67. [Google Scholar]
- Sun, Y.; Zuo, Z.; Liu, S.; Wu, Y. Distribution of pressure fluctuations in prototype pump turbine at pump mode. Adv. Mech. Eng. 2014, 6, 923–937. [Google Scholar] [CrossRef]
- Li, D.; Gong, R.; Wang, H.; Xiang, G.; Wei, X.; Liu, Z. Dynamic analysis on pressure fluctuation in vaneless region of a pump turbine. Sci. China Technol. Sci. 2015, 58, 813–824. [Google Scholar] [CrossRef]
- Yang, S.; Kong, F.; Cheng, J.; Huang, Z.P.; Zhang, X.P. Reserch on unsteady pressure field within a hydraulic turbine volute. Eng. Mech. 2013, 30, 388–393. [Google Scholar]
- Yang, S.; Kong, F.; Qu, X.; Jiang, W.M. Influence of blade number on the performance and pressure fluctuations in a pump used as a turbine. J. Fluids Eng. 2012, 134, 124503–124512. [Google Scholar] [CrossRef]
- Yang, S.; Liu, H.; Kong, F.; Xia, B.; Tan, L.W. Effects of the radial gap between impeller tips and volute tongue influencing the performance and pressure fluctuations of pump as turbine. J. Fluids Eng. 2014, 136, 1–8. [Google Scholar] [CrossRef]
- Shi, G.; Yang, J.; Miao, S.; Li, T.L. Calculation of pressure fluctuation within volute of hydraulic turbine under different guide vane numbers. J. Aerosp. Power 2015, 30, 1228–1235. [Google Scholar]
- Shi, G.; Yang, J.; Miao, S.; Wang, X.H. Unsteady calculation of pressure fluctuations within hydraulic turbine under different entrance sections. J. Aerosp. Power 2016, 31, 659–668. [Google Scholar]
- Dai, C.; Kong, F.; Dong, L.; Feng, F. Analysis and experimental investigation of pressure fluctuation in draft tube of pump as turbine. J. Cent. South Univ. (Sci. Technol.) 2015, 46, 3131–3137. [Google Scholar]
- Shi, F.; Yang, J.; Wang, X. Analysis on characteristic of pressure fluctuation in hydraulic turbine with guide vane. Int. J. Fluid Mach. Syst. 2016, 9, 237–244. [Google Scholar] [CrossRef] [Green Version]
- Li, W.; Lu, D.; Ma, L.; Ji, L.; Wu, P. Experimental study on pressure vibration characteristics of mixed-flow pump during start-up. Trans. Chin. Soc. Agric. Eng. 2021, 37, 44–50. [Google Scholar]
- Fu, S.; Zheng, Y.; Kan, K.; Chen, H.; Han, X.; Liang, X.; Liu, H.; Tian, X. Numerical simulation and experimental study of transient characteristics in an axial flow pump during start-up. Renew. Energy 2020, 146, 1879–1887. [Google Scholar] [CrossRef]
- Chen, W.; Liu, Y.; Chen, L. Study on hydrodynamic performance of horizontal tidal turbine rotating passively based on UDF. Ocean Eng. 2018, 36, 119–126. [Google Scholar]
- Sun, K.; Li, Y.; Zhao, J. Transient starting performance analysis of vertical axis tidal turbine. Huazhong Univ. Sci. Technol. (Nat. Sci. Ed.) 2017, 45, 51–56. [Google Scholar]
- Untaroiu, A.; Wood, H.G.; Allaire, P.E.; Ribando, R.J. Investigation of self-starting capability of vertical axis wind turbines using a computational fluid dynamics approach. J. Sol. Energy Eng. 2011, 133, 125–134. [Google Scholar] [CrossRef]
- Su, X. Research on the Variable Rotation Speed and Transient Process of Centrifugal Pump as Turbine System. Ph.D. Thesis, South China University of Technology, Guangzhou, China, 2016. [Google Scholar]
Publisher’s Note: MDPI stays neutral with regard to jurisdictional claims in published maps and institutional affiliations. |
© 2022 by the authors. Licensee MDPI, Basel, Switzerland. This article is an open access article distributed under the terms and conditions of the Creative Commons Attribution (CC BY) license (https://creativecommons.org/licenses/by/4.0/).