
Performance Assessment of a Low-Cost Miniature Electrohydrostatic Actuator

Department of Mechanical Engineering, University of Saskatchewan, Saskatoon, SK S7N 5A9, Canada
*
Author to whom correspondence should be addressed.
Actuators 2022, 11(11), 334; https://doi.org/10.3390/act11110334
Submission received: 25 October 2022
/
Accepted: 11 November 2022
/
Published: 18 November 2022
(This article belongs to the Special Issue 10th Anniversary of Actuators)
Abstract
:Low-cost small-scale (<100 W) electrohydrostatic actuators (EHAs) are not available on the market, largely due to a lack of suitable components. Utilizing plastic 3D printing, a novel inverse shuttle valve has been produced which, when assembled with emerging small-scale hydraulic pumps and cylinders from the radio-controlled hobby industry, forms a low-cost and high-performance miniature EHA. This paper presents experimental test results that characterize such a system and highlight its steady, dynamic, and thermal performance capabilities. The results indicate that the constructed EHA has good hydraulic efficiency downstream of the pump and good dynamic response but is limited by the efficiency of the pump and the associated heat generated from the pump’s losses. The findings presented in this paper validate the use of a 3D printed plastic inverse shuttle valve in the construction of a low-cost miniature EHA system.
1. Introduction
Fluid power (hydraulic) systems are popular for their excellent power and force capabilities relative to their size and weight. An electrohydrostatic actuator (EHA) is a particular hydraulic circuit configuration which directly couples the hydraulic pump to the actuator creating a pump-controlled circuit and eliminates losses from directional and relief valves used in more traditional valve-controlled circuits [1]. An example application of an larger-scale EHA is in the actuation of aerospace flight control surfaces, where EHAs have been chosen over previous centralized hydraulic systems due to their improved efficiency and lower weight [2,3].
While hydraulic systems typically dominate in many large-scale applications, a lack of appropriate small-scale hydraulic components limits the use of hydraulics in smaller applications (<100 W). This lack of components has been noted by others looking to incorporate small-scale hydraulic systems into their prosthetic, orthotic, and exoskeleton designs [4,5,6]. Actuation on this smaller scale is typically achieved by electromechanical screw type actuators which tend to suffer from low power density compared to the small scale EHA introduced by Wiens and Deibert [7] in addition to limited reliability, difficult overload protection, and low force capabilities [3,8]. Furthermore, EHAs can recover energy under assistive loads using the electric motor as a generator to create and store power or share power between other actuators reducing the overall power supply required [9]. Further work is required to create low-power hydraulic cylinder drives in order to be competitive with electro-mechanical drives [1].
Recently there has been a selection of small-scale hydraulic components introduced into the radio-controlled hobby industry intended for the use in model construction equipment. While these small-scale pieces of machinery use traditional valve-controlled circuit designs, some of their components such as pumps and cylinders may be repurposed for the use in more demanding applications. Wiens and Deibert have introduced a very low cost inverse shuttle valve design that can be used to combine these newly available small-scale pumps and cylinders in an EHA configuration [7,10]. The novel shuttle-valve design is entirely 3D printed from polyethylene terephthalate glycol-modified (PETG) and functions to handle the unbalanced cylinder flows occurring with a typical asymmetric hydraulic cylinder in an EHA circuit.
The EHA system can operate in each of four quadrants defined by cylinder force and velocity as shown schematically in Figure 1. Quadrants I and III represent pumping modes where the pump is supplying power to the cylinder. Quadrants II and IV represent motoring modes where the cylinder is supplying power to the pump which acts as a motor. The function of the inverse shuttle valve is also illustrated in Figure 1; the fluid required to balance the cylinder flow can be seen entering or leaving the reservoir through the inverse shuttle valve, which connects the lower pressure pump port to the reservoir. Due to equipment and time limitations, the analysis of the EHA system in the motoring modes (Quadrants II and IV) were left outside the scope of this work.
While Wiens and Deibert have investigated the steady-state performance [7] and simulated dynamic responses [10] of a prototype miniature EHA system utilizing their 3D printed plastic inverse shuttle valve, a wider range of performance capabilities of an improved system are studied here. The preliminary valve design has been improved with less restrictive flow paths (eliminating the need for a charge pump) and better sealing poppet geometry (to reduce power losses). An investigation into 3D printed plastic poppet valve sealing performance and 3D printed plastic pressure vessel strength was performed by Deibert et al. [11]. This paper explores some of the performance capabilities of the EHA system with the improved valve design including steady state pump characteristics, actuator force and speed limitations, system step response, and system thermal performance. These tests highlight the impressive performance that may be obtained for such a low-cost small-scale actuator.
2. Materials and Methods
2.1. Testing Methodology
The objectives of this work include:
- characterizing the performance of the pump and motor combination
- identifying the EHA speed and force limits
- measuring the hydraulic efficiency of the EHA system excluding the pump
- measuring the step response of the EHA system, and
- assessing the thermal limits of the EHA system.
2.1.1. Pump Characterization Methods
Characterizing the pump and motor combination was done to establish a map of the pump’s output fluid power respective to the motor’s input electrical power at various points across its operating range and to provide an assessment of the pump’s performance. By fitting the pump’s pressure and flow output to the motor’s speed and current inputs, a performance map was created. This map facilitated an accurate prediction of pump pressure and flow rate in the EHA system from only motor speed and current removing the requirement of intrusive flow meters and pressure transducers.
The pump was tested by running its flow over a relief valve, varying the pump speed at a number of set relief valve settings. The commanded pump flows were 0 to 0.7 L/min, increasing in 0.1 L/min increments, which was repeated for each of eight relief valve settings. The same ideal flow rates (pump speeds) were commanded for each run, so the decrease in measured flow rates observed at higher pressures is evidence of internal leakage in the pump increasing with pressure.
The data collected from the tests was compiled and processed in MATLAB where the pump characterization maps were created. The pump’s pressure and flow outputs were characterized by fitting several typical pump and motor performance parameter coefficients to the experimental data. The fitted coefficients include the motor speed constant , the pump pressure friction coefficient , the pump viscous damping coefficient , the fluid viscosity , the pump breakaway torque , the pump displacement , and the pump slip leakage coefficient . The equations fitted to the data are derived in Appendix A.
2.1.2. Steady State EHA System Performance Methods
Identifying the speed and force limits of the EHA system was done to define the allowable operating range for the EHA. The actuator speed limits were established by identifying the points at which the relationship between pump speed and cylinder speed became non-linear, indicating the onset of fluid cavitation at the pump inlet. The actuator force limits were determined by extrapolating the relationship between fluid pressure and actuator load to the working pressure rating of the tubing.
Testing the steady state actuator performance involved commanding a series of cylinder velocities with a set load. The process was repeated at various cylinder loads. The pump speed N was set using a basic control algorithm relating the commanded cylinder velocity to the cylinder head end and rod end areas or and pump displacement D based on the sign of the pressure differential across the inverse shuttle valve and as illustrated by Equations (1) and (2).
This assumes no internal or external leakage. A more advanced control algorithm such as a closed loop control scheme could also be implemented to adjust the pump speed based on the cylinder speed to compensate for leakage. This was not performed due to time constraints and in order to simplify testing. High performance control that minimizes error between commanded and actual cylinder velocity was not required as it was not within the focus of this work. The sign convention for the cylinder speeds and forces follows that used in other areas of this work, with positive cylinder forces resisting cylinder extension and positive cylinder speeds during cylinder extension.
The maximum cylinder speed was first found in order to establish an upper cylinder speed limit on the following tests. The maximum cylinder speed is governed by fluid cavitation at the fluid inlet. This occurs when the absolute fluid pressure at the pump inlet drops too low and vapor bubbles form. The pressure at the pump inlet is directly related to the pressure drop across the pump’s supply path between the tank and the pump inlet, which is a function of the flow rate and flow restriction of the flow path. When the cylinder speed, and thus pump flow, increases beyond the allowable threshold, the pressure drop along the pump supply path becomes too large to sustain a pump inlet pressure sufficient to prevent fluid cavitation.
To establish the maximum cylinder speed, a series of increasing commanded cylinder speeds were tested until a plateau in the actual cylinder speed was observed. This was performed without a load applied to the cylinder since the loading mechanism became unstable at very high cylinder speeds. Since the valve connects the lower pump port pressure to the reservoir, it is largely insensitive to loading in pumping quadrants.
The efficiency of the EHA system, including the valve, cylinder, and flow paths, and excluding the pump, was measured to gain an understanding of the efficiency of the pump relative to the remainder of the EHA system. The pump’s electrical and hydraulic efficiencies were of secondary importance since the pump’s design was excluded from the scope of this work. The circuit’s input fluid power from the pump was estimated using the motor’s speed and current in combination with the pump performance map constructed in the first experimental objective. The system’s output power was measured by using a known weight to apply a mechanical load to the cylinder and recording the cylinder’s velocity.
2.1.3. Dynamic Step Response Methods
The EHA system’s dynamic response to a step increase in commanded cylinder velocity (by a commanded pump speed) from a steady initial condition was measured. The output response was assessed by recording the cylinder velocity measured by a linear potentiometer. A known weight functioned as the mechanical load and mass.
Testing of the EHA’s dynamic response was conducted by commanding a step increase in cylinder velocity from −100 mm/s to −150 mm/s. The procedure was repeated multiple times to gain statistical confidence in the results. Three different loads were tested to assess the system’s response over a range of operating points in Quadrant III. The metric used to assess the step response of the system was the time constant of a first order system model fitted to the cylinder velocity response as represented by
where is the cylinder velocity [m/s], is the initial cylinder velocity [m/s], is the elapsed time [s], is the time at which the step occurs [s], is the cylinder velocity step size [m/s], and is the system time constant [s]. The first order model fitted to the system response approximates the EHA system and neglects compliant components such as fluid compressibility, tubing compliance, and printed plastic compliance. This simplification was deemed to be acceptable for the small load masses and pressures experimentally tested but may not be an appropriate model for the system response under all operating conditions.
2.1.4. Thermal Performance Methods
Lastly, the thermal limit of the EHA system was examined. An assessment of the transient temperature of critical areas was made to estimate how long the system may operate at a given power level before overheating occurs. Excessive heat was predicted to cause failure in the printed plastic components and plastic tubing, which have a much lower temperature rating than typical large-scale hydraulic components. Polyamide tubing, such as that used in the construction of this EHA system, has a working pressure that is sensitive to operating temperature and is expected to be the limiting factor in the system [12].
The system was programmed to extend and retract the cylinder just short of the cylinder stroke limits (approximately 45 mm of travel) in a continuous cycle while the temperatures of the critical areas were monitored over time. This was repeated at several power levels to extrapolate the steady state temperature and effective thermal time constant of the system. The commanded extension speed was 100 mm/s, and the commanded retraction speed was 50 mm/s. The mismatch of commanded extension and retraction speeds was used to increase the testing apparatus stability. The system electrical input power was recorded by the motor controller. System output power was calculated by multiplying the cylinder velocity (derived from the recorded cylinder potentiometer signal) with the force of the loading weight applied to the apparatus. The difference between the input electrical power and the output mechanical power yields the heat generated in the system. The time averaged calculated heat generation was used as an equivalent continuous heat generation.
A thermal imaging camera was used during preliminary tests to reveal the areas of the EHA system that may be prone to failure due to thermal effects. The images indicated that the pump and motor were substantially the hottest components, and that the cylinder’s temperature was not likely to be a concern, as shown in Figure 2a,b, respectively. The tubing at the compression fitting on the high-pressure side of the circuit was deemed to be the most likely failure point due to material weakening.
With the point most susceptible to thermal failure identified, the temperatures of the components of concern were instrumented and monitored during testing of the system. A thermocouple probe was attached to the pump housing as opposed to the compression fitting of interest due to practicalities of mounting the probe to the small fitting. This was justified by Figure 2a, as the temperature of the fitting was near that of the pump. Another thermocouple probe was submerged in the reservoir fluid near the reservoir ports of the inverse shuttle valve.
A first-order thermal system model was fit to each of the temperature responses to extrapolate an effective thermal time constant for the system. The model is expressed as
where is the temperature of the component [°C], is the steady temperature of the component before testing (near ambient) [°C], is the steady state temperature of the component during operation [°C], is the elapsed time from the start of the test [s], and is the thermal time constant [s].
2.2. Apparatus and Instrumentation
The apparatus used to characterize the pump and motor combination is shown in Figure 3. The pump [13] supplied Nuto 32 hydraulic fluid from the reservoir through a Vickers relief valve, followed by a Flomec EGM004S511-821 flow meter, and back to the reservoir. The relief valve was used to set the pump pressure and an XIDIBEI XDB303 pressure transducer was installed in line close to the pump outlet to measure the pump pressure. An ODrive motor controller [14] controlled by an Arduino microcontroller powered the pump and an encoder on the motor shaft supplied closed-loop velocity feedback to the motor controller. Motor speed and current data was retrieved and logged from the motor controller.
The apparatus used to test the performance of the EHA system is shown in Figure 4. The same pump and motor combination was used, as well as the same motor control system. The pump was connected to a fully 3D printed hydraulic power unit which enclosed the inverse shuttle valve within a fluid reservoir. Two XIDIBEI XDB303 pressure transducers were used to measure the fluid pressure on either side of the inverse shuttle valve. The power unit was connected to a hobby-grade single-rod hydraulic cylinder with a 10 mm bore diameter, 4 mm rod diameter, and 50 mm stroke. The cylinder was loaded using steel weights and a 2:1 lever arm which could be configured to apply a tensile or compressive load to the cylinder. The potentiometer from an Actuonix L16-P linear actuator was used to measure cylinder position which was differentiated to find cylinder velocity. An Omega HH306A datalogging thermometer (not shown) was used to monitor the temperature of the system and a Flir E60 thermal imaging camera was used to supplement findings.
3. Results and Discussion
3.1. Pump Characterization Results
The range of pump pressures and flows achieved for each run is shown in Figure 5. The nonlinear trend of the data is due to the typical nonlinear flow-pressure curve of the relief valve. Note that multiple runs were taken at the highest and lowest relief valve settings at different points throughout the experiment to ensure consistency. The error bars represent a 95% confidence interval in the measurements.
The characterization maps for the pump’s flow, pressure, and overall efficiency are shown in Figure 6. The black crosses indicate the points at which data was taken, and the color gradient of the plot indicates the flow, pressure, or efficiency quantity. Note that the trend in motor speed and current observations very closely match the trend in measured flow and current shown in Figure 5.
The pump characterization maps presented in Figure 6 appear to be reasonable. Figure 6a shows the flow rate is primarily dependent on motor speed and Figure 6b shows pressure is primarily dependent on current. This is expected since motor speed, and thus flow rate, is ideally linear to motor voltage, and motor torque, and thus pressure, is ideally linear with motor current. Some slight nonlinearities are evident in each of the maps which can be attributed to the real performance of the pump and motor. Figure 6a shows a decrease in flow rate with an increase in motor current at a given motor speed. This is attributed to the increase in internal pump leakage at high pressures. Figure 6b shows a decrease in fluid pressure with an increase in motor speed at a given motor current. This is attributed to increased torque losses due to viscous friction in the pump. Finally, Figure 6c shows an overall energy efficiency of the motor and pump combination over the range of operating points tested. This efficiency represents the combined electrical and mechanical efficiencies of the motor and the mechanical and volumetric efficiencies of the pump. A relatively low efficiency of 35% to 40% is observed for most operating points. Though no datasheets are available for these small hobby-grade pumps, industrial manufacturers are producing external gear pumps 5–10 times the displacement which generally achieve efficiencies of 60% to 80% [15,16,17,18]. The low efficiencies measured for the small pump in this work may be due to poor pump and/or motor design and/or manufacturing tolerances. These small hobby-grade pumps may suffer from increased leakage due to large gear tooth clearances relative to the pump size. Additionally, larger commercial offerings typically employ wear- and pressure-compensating designs to increase efficiency which are not used in these hobby-grade offerings.
The values for each fitted coefficient are presented in Table 1 along with their 95% confidence intervals. The slip leakage coefficient and viscous damping coefficient are presented in terms of fluid viscosity since the fluid viscosity was not directly measured. Utilizing the fitted equations yields smoother pump performance maps compared to the maps generated from the experimental data. The fitted maps agree closely with the experimental data taken, typically with less than 10% error for most operating points.
3.2. Steady State System Performance Results
Figure 7 shows the relationship between commanded cylinder speed and pump speed to the actual steady cylinder speed achieved. The plateau in relationship of cylinder speed to pump speed indicates the onset of pump inlet cavitation. The maximum positive and negative cylinder speeds achieved were approximately 150 mm/s and −187 mm/s, respectively. The maximum cylinder retraction speed is greater than the maximum cylinder extension speed due to the differences in cylinder end areas, and both speeds correspond to a pump speed of approximately 60 rev/s. Although maximum cylinder speed under various cylinder loads was not assessed, those maximum speeds should be close to that of the unloaded cylinder as the systems pressures on the low-pressure pump inlet side of the EHA circuit are largely dependent on cylinder speed and independent of load. This assumption remains a limitation of this work that could be explored in later work.
With the maximum cylinder speed established, attention turned to investigating the maximum cylinder forces in the pumping operating Quadrants I and III. The limiting factor of the maximum cylinder forces is the 4 MPa safe working pressure rating of the polyamide tubing used to connect the pump and cylinder to the power unit. In the pumping quadrants the maximum fluid pressure occurs at the pump outlet, therefore system pressures were evaluated there for a range of cylinder speeds and loads. The cylinder loads tested yielded system pressures close to but below the maximum allowable as a conservative measure to avoid unsafe testing conditions. Loaded cylinder test speeds were below the maximum cylinder speeds due to instability in the lever loading mechanism at high speeds. Results were extrapolated to the remaining range between the testing points and up to the tubing pressure limit and maximum cylinder speeds.
Figure 8 shows the fluid pressures for the high-pressure side of the circuit as a function of cylinder speed and force. The system pressure increases with cylinder load due to the balances of forces at the cylinder’s piston and with increasing cylinder speed due to friction in the fluid flow paths and cylinder seals. The black crosses indicate the operating points at which data was taken. The horizontal shift in the cylinder speed operating points with increasing cylinder load magnitude is attributed to the increase in internal leakage in the pump, poppets, and cylinder with increasing fluid pressure. The bold black lines indicate the maximum allowable cylinder force due to the tubing pressure rating and the bold red lines indicate the maximum cylinder speed to avoid pump cavitation.
The hydraulic efficiency of the system was measured for both pumping quadrants. These efficiencies are defined as the of the ratio of load power to pump output power and represent the efficiency of the flow paths, inverse shuttle valve, and cylinder. The pump’s efficiency is excluded here since it was outside the scope of the system design. Figure 9 shows the hydraulic efficiency of the EHA system excluding the pump over a range of tested operating points in operating Quadrants I and III. Again, the black crosses indicate the operating points tested and the bold black and red lines represent the maximum cylinder force and speed, respectively. Peak efficiencies of approximately 70% occur within a region near cylinder speeds of 50 mm/s and for both quadrants. Most operating points in the high-pressure regions of either quadrant achieve a 60% to 70% hydraulic efficiency.
Although the hydraulic power losses due to each component were not specifically measured, they were estimated to give a better understanding of where improvements to system efficiency may be made. The power loss due to the tubing connecting the HPU to the cylinder was calculated using the cylinder flows and measured tubing and fitting flow resistances. The power loss due to internal leakage was calculated from the difference in pump flow and cylinder flow on the high-pressure side of the circuit multiplied by the pressure of the high-pressure side of the circuit. The power loss due to cylinder friction was calculated by finding the effective friction force using a summation of forces on the piston and multiplying that friction force by the cylinder speed. Plots of the calculated power loss contributions are shown in Figure 10 for operating Quadrants I and III.
Several observations may be made from the power loss contributions shown in Figure 10. The sum of the losses due to tubing resistance, internal leakage, and cylinder friction approximately equals that of the difference in total input and output hydraulic power, suggesting the significant power losses are accounted for. The internal leakage resistances were close to the poppet leakage resistances reported in the poppet leakage investigation performed by Deibert et al. [11], indicating that the poppet leakage is likely the dominating internal leakage. The losses due to tubing resistance were independent of fluid pressure (cylinder load) whereas the losses due to internal leakage were largely independent of flow rate (cylinder speed) and the losses due to cylinder friction were dependent on both cylinder force and speed. For most operating points the losses due to the tubing resistance are the largest, closely followed by cylinder friction. This is a reasonable outcome because 600 mm of 4.0 mm (outer diameter) × 2.5 mm (inner diameter) tubing was used to connect each side of the HPU circuit to the cylinder. Applications allowing mounting of the cylinder closer to the HPU or the use of larger internal diameter tubing would significantly reduce the power lost due the tubing restrictions. A couple of cases in Figure 10 indicate that the internal leakage is the dominating power loss, likely due to poor poppet sealing. More careful lapping of the poppets could be used to reduce the power loss in those cases.
Finally, the EHA output power capabilities for both pumping quadrants can be established. This power output is limited by the combination of limits on tubing pressure and cylinder speed before pump cavitation. Figure 11 shows the EHA’s power output capabilities in operating Quadrants I and III. The maximum power output in Quadrant I is 32 W and the maximum power output in Quadrant III is 30 W. The output power capability in the two quadrants are similar but occur at significantly different operating points. The highest power operating point in Quadrant I is slower but at a higher force than that in Quadrant III. This is attributed to the difference in cylinder end areas, where operating in Quadrant I pressurizes the head end of the cylinder, requiring a higher flow rate but less pressure for a given cylinder speed and load than an equivalent operating point in Quadrant III pressurizing the rod end of the cylinder.
3.3. Dynamic Step Response Results
Samples of the system’s response to step changes in commanded velocity are shown in Figure 12 for three different load masses. As previously observed in the steady state EHA performance testing, the steady state cylinder velocity achieved by the system was less than the commanded speed due to internal leakage, mainly in the pump and shuttle valve poppets. Ten step responses were measured for each load mass, and the average time constants and standard deviations are presented in Table 2.
The results shown in Figure 12 and Table 2 indicate that the response of the system is fast. The effect of the load mass on the system’s time constant is as expected, where doubling the mass approximately doubles the time constant. This is a reasonable result as the mass attached to the cylinder is likely the dominant inertia of the system when compared to the relatively lightweight electric motor rotor and small fluid inertance. The approximation of a first order system for the velocity response is a good fit, especially with small load masses. With larger masses the cylinder velocity begins to have a small amount of overshoot, indicating the compliance in the compressible volumes, tubing, and printed plastics may be becoming significant, which could be modelled as a second order system if desired.
3.4. Thermal Performance Results
Figure 13 shows a sample of the recorded and calculated powers of the EHA system running at steady state during the thermal performance testing. The solid black line indicates the time-averaged heat generation level for the system.
The system was run with several different loads applied creating different levels of heat input to the system, and the thermocouple temperatures were logged over the duration of the tests and the results are shown in Figure 14. It was observed that the temperatures of the two thermocouples were very similar to each other for every power level, indicating a high rate of heat transfer from the pump housing to the fluid being pumped. Ketelsen et al. [19] used a similar approach which lumped the thermal capacitances of multiple components including the pump, motor, and oil to predict the temperature of a larger EHA system with accuracy suitable for design purposes. The metal compression fitting conducts heat from the pump housing very well and appears to reach temperatures near that of the pump housing, as shown in Figure 2a. Parker Hannifin Corp. Ref. [12] shows that the working pressure of their 4 × 2.5 mm polyamide tubing reduces from 5.2 MPa at 20 °C to just 3.0 MPa at 60 °C. Overheating of the compression fitting attaching the tubing to the pump would cause excessive softening of the plastic fluid tubing which would likely lead to failure of either the mechanical connection between the fitting and the tubing or in the tubing itself. Furthermore, the temperature of the fluid within the shuttle valve and reservoir is of concern, as excessive fluid temperatures in those locations may cause failure of the plastic printed parts. The heat deflection temperature of the Prusa PETG material used for these printed parts is 68 °C [20]. The investigation in this work neglects any thermal related failure that may occur in the cylinder, pump, or electric motor since the design of these components were not in the scope of this work, and their temperature limits are expected to be higher than the plastic components.
As shown in Figure 14, the thermal models follow the measured temperatures closely. The results of the fitted coefficients for the pump housing temperature are provided in Table 3. There are some discrepancies between the thermal time constants of the tests at the lower two and higher two power levels. These differences may be attributed to uncertainty in the system thermal response much past one time constant which was not measured since the tests at high power levels were stopped at a conservative temperature to avoid potentially destructive failure of the system. In general, the fitted parameters provide a good estimate of the system temperatures of concern.
Video captured by the FLIR thermal imaging camera provided further insight to the heat transfers occurring within the EHA system. Still frames from the thermal video were taken at one-minute intervals during the 184 N test and are shown in Figure 15. The measurement callouts in Figure 15 show the temperature of the pump, reservoir, and cylinder as measured by the thermal camera. The pump temperature measured by the thermal camera closely agreed with that measured by the thermocouple shown in Figure 14. The reservoir temperature measured by the thermal camera was typically lower than that measured by the thermocouples since the thermal imaging camera was measuring the plastic reservoir surface temperature whereas the thermocouple was measuring the actual fluid temperature. Observing the still frames in Figure 15, the majority of the heat appears to build first in the pump housing which then transfers to the fluid and finally to the other components including the tubing, reservoir, and cylinder. Since the cylinder load was applied only in one direction, the pressure differential between the two sides of the circuit would not have been changing sign, thus the inverse shuttle valve would not have been switching the sides of the circuit connected to reservoir. This explains the temperature of one of the tubes supplying the cylinder being higher than the other. The fluid in the high-pressure side of the circuit would have been isolated from the reservoir fluid (neglecting leakage), whereas the low-pressure side was able to exchange fluid, and thus heat, with the reservoir.
The results shown in Figure 14 and Table 3 above are expressed in terms of heat generated, or useful power lost by the system. This is a simplification made to exploit the fact that a given amount of heat may be generated across a range of different operating points. Estimations of the power losses of the EHA system including the pump and motor were created from data obtained during the steady state EHA testing performed and are shown in Figure 16 for operating Quadrants I and III. Though not experimentally verified in this work, the system temperature responses for any heat generation level should be similar regardless at which cylinder speed and load combination it occurs at. This is an estimation and simplification of other factors that would affect the steady and transient heat transfers within the system but provides an estimate of the thermal limitations of the EHA system developed thus far. Future work is required to determine how much of the generated heat is absorbed by the fluid relative to the amount of heat dissipated directly to atmosphere from the motor and pump housing.
The data shown in Table 3, and Figure 16 may be used to interpolate a safe equivalent continuous heat generation level and permissible EHA operating points. For example, if a reduction in tubing working pressure to 3.0 MPa at 60 °C was permissible, the maximum equivalent continuous heat generation would be approximately 18.4 W. Note that this implies that at a 50% actuator duty cycle the permissible heat generation would be approximately 36.8 W. With the maximum equivalent continuous heat generation established, Figure 16 may be used to identify the permissible EHA operating points that would not exceed that heat generation level at that duty cycle. Concluding the example given here, the actuator would be able to run with a 50% duty cycle at either 90 mm/s and 150 N or 130 mm/s and 50 N. Alternatively, the data in Table 3 may be used with Equation (4) to predict the maximum time the actuator may operate at a higher heat generation level continuously before exceeding temperature limits.
Several opportunities for improvement of the thermal performance of the system were recognized. Perhaps the largest improvement in thermal performance may be increasing the energy efficiency of the pump and motor package, which was identified as the dominant source of heat during testing of the EHA system. Utilizing the design freedom of 3D printing, many creative elements may be employed in the reservoir design, including cooling fins or internal baffles, which may improve heat dissipation from the reservoir fluid. External methods of cooling such as a liquid-cooled heat exchanger or air fans may be added to the high temperature components like the pump and motor to allow continuous high-power operation. Finally, the strength of the polyamide tubing is again identified as a major limiting factor in the design of the EHA system. A tubing that can withstand higher pressures at higher temperatures would allow the system to operate at a higher power level for a longer duration. These considerations are left for future development of the small-scale EHA due to time constraints.
4. Conclusions
This paper summarizes the performance capabilities of a low-cost small-scale EHA system constructed using a hobby-grade pump and cylinder and a 3D-printed plastic inverse shuttle valve. Combined, these components form an actuator which has been shown in preliminary work to rival comparable electromechanical actuators in terms of cost, force density, and power density. This work extends that preliminary work and further explores the steady and dynamic limitations of the EHA system and identifies areas which may require further development.
The pump’s performance was characterized and the EHA’s force and speed limitations, hydraulic efficiency, step response, and thermal performance were assessed. The pump had a relatively low efficiency of 35% to 40% for most operating points, resulting in considerable power loss and corresponding heat generation within the EHA system. Maximum actuator extension and retraction speeds were found to be 150 mm/s and −187 mm/s, respectively. Maximum actuator extension and retraction forces were determined to be approximately 250 N and −220 N, respectively. The hydraulic efficiency of the 3D printed inverse shuttle valve, tubing, and cylinder (excluding pump) was satisfactory at 60% to 70%, with potential for improvement with the selection of less restrictive tubing to the cylinder. The step response of the EHA system was fast with time constants between 4 ms and 13 ms for the loads tested, confirming the applicability of the EHA in high bandwidth applications. Limitations of the current tubing’s working pressure at elevated temperatures combined with the low pump efficiency restrict the system’s capabilities to handle high loads (>10 W) for extended periods (> 5 min), though the actuator is capable of approximately 30 W output power for short duty cycles. These results indicate that the low-cost EHA system presented has the potential for impressive performance especially with continued development of other small-scale components such as pumps and tubing.
Author Contributions
Conceptualization, B.D. and T.W.; methodology, B.D. and T.W.; validation, B.D. and T.W.; formal analysis, B.D.; investigation, B.D.; writing—original draft preparation, B.D.; writing—review and editing, B.D. and T.W.; visualization, B.D.; supervision, T.W.; project administration, T.W.; funding acquisition, T.W. All authors have read and agreed to the published version of the manuscript.
Funding
This research and APC were funded by Natural Sciences and Engineering Research Council of Canada, grant number 2017-05906.
Data Availability Statement
Not applicable.
Acknowledgments
The authors wish to thank Doug Bitner for his support and suggestions during the experiments.
Conflicts of Interest
The authors declare no conflict of interest.
Appendix A
This appendix develops the equations used to characterize the pump and motor combination. The pump’s pressure and flow outputs were characterized by fitting several typical pump performance parameter coefficients to the experimental data. The torque produced by the pump [Nm] is expressed as
where is the pump displacement [m3/rev], is the pressure friction coefficient [-], is the fluid pressure increase across the pump [Pa], is the viscous damping coefficient [-], is the fluid viscosity [Pa∙s], is the pump’s rotational speed [rev/s] (assumed to be positive), and is the breakaway torque [Nm].
The flow produced by the pump [m3/s] is expressed as
where is the slip leakage coefficient [-]. The brushless electric motor was assumed to follow the standard equation relating motor torque to current [amps] given as
where is the motor speed constant [RPM/V].
Combining Equations (A1) through (A3) and rearranging gives the expressions relating pump flow and pressure to motor speed and current as
and
Equations (A4) and (A5) were fit to the experimental data to characterize the pump’s flow and pressure in terms of motor speed and current.
References
- Ketelsen, S.; Padovani, D.; Andersen, T.O.; Ebbesen, M.K.; Schmidt, L. Classification and Review of Pump-Controlled Differential Cylinder Drives. Energies 2019, 12, 1293. [Google Scholar] [CrossRef] [Green Version]
- Alle, N.; Hiremath, S.S.; Makaram, S.; Subramaniam, K.; Talukdar, A. Review on Electro Hydrostatic Actuator for Flight Control. Int. J. Fluid Power 2016, 17, 125–145. [Google Scholar] [CrossRef]
- Van den Bossche, D. The A380 flight control electrohydrostatic actuators, achievements and lessons learnt. In Proceedings of the ICAS 25TH International Congress of the Aeronautical Sciences, Hamburg, Germany, 3 September 2006. [Google Scholar]
- Xia, J.; Durfee, W.K. Analysis of Small-Scale Hydraulic Actuation Systems. J. Mech. Des. 2013, 135, 091001. [Google Scholar] [CrossRef] [Green Version]
- Houle, K.L. A Power Transmission Design for an Untethered Hydraulic Ankle Orthosis. Master’s Thesis, University of Minnesota, Minnesota, MN, USA, 2012. [Google Scholar]
- Neubauer, B.C. Principles of Small-Scale Hydraulic Systems for Human Assistive Machines. Ph.D. Thesis, University of Minnesota, Minnesota, MN, USA, 2017. [Google Scholar]
- Wiens, T.; Deibert, B. A Low-Cost Miniature Electrohydrostatic Actuator System. Actuators 2020, 9, 130. [Google Scholar] [CrossRef]
- Hagen, D.; Pawlus, W.; Ebbesen, M.K.; Andersen, T.O. Feasibility Study of Electromechanical Cylinder Drivetrain for Offshore Mechatronic Systems. Model. Identif. Control. A Nor. Res. Bull. 2017, 38, 59–77. [Google Scholar] [CrossRef] [Green Version]
- Ristic, M.; Whaler, M. Electrification of hydraulics opens new ways for intelligent energy-optimized systems. In Proceedings of the 11th International Fluid Power Conference, Aachen, Germany, 19 March 2018. [Google Scholar]
- Wiens, T.; Deibert, B. A Low-cost miniature electrohydrostatic actuator. In Proceedings of the 1st International Electronic Conference on Actuator Technology: Materials, Devices and Applications MDPI, Online, 20 November 2020. [Google Scholar]
- Deibert, B.; Scott, S.; Dolovich, A.; Wiens, T. The use of additive manufactured plastic in small-scale poppet valves and pressure vessels (Accepted). In Proceedings of the BATH/ASME 2022 Symposium on Fluid Power and Motion Control, American Society of Mechanical Engineers, Bath, UK, 14–16 September 2020. [Google Scholar]
- Parker Hannifin Corp. Parker Legris Technical Tubing & Hose. 2014. Available online: https://www.farnell.com/datasheets/1905436.pdf (accessed on 25 July 2022).
- AliExpress Brushless Hydraulic Lift Oil Pump for 1/14 Tamiya RC Truck Trailer Tipper Scania Actros Volvo MAN LESU JDM Excavator DIY Parts|Parts & Accessories|. Available online: //www.aliexpress.com/item/1005003462607936.html?src=ibdm_d03p0558e02r02&sk=&aff_platform=&aff_trace_key=&af=&cv=&cn=&dp= (accessed on 25 May 2022).
- ODrive. Available online: https://odriverobotics.com (accessed on 3 February 2022).
- Parker Hannifin Corp. Fixed Displacement Gear Pumps D/H/HD Series. 2002. Available online: https://www.parker.com/Literature/Pump%20&%20Motor%20Division/Catalogs/PDFs/DHHD_0910.pdf (accessed on 5 October 2022).
- Parker Hannifin Corp. Gear Pumps/Motors Series PGP/PGM. 2017. Available online: https://www.parker.com/literature/PMDE/Catalogs/Gear_Units/PGP_PGM/HY30-3300-UK.pdf (accessed on 4 October 2022).
- Duplomatic MS S.p.A GP External Gear Pumps Series 20. 2020. Available online: https://duplomaticmotionsolutions.com/docs/2020/11100-ed_4d72e112c3.pdf (accessed on 4 October 2022).
- Bucher Hydraulics S.p.A Gear Pumps AP100. 2015. Available online: https://www.bucherhydraulics.com/datacat/files/Katalog/Pumpen/Aussenzahnradpumpen/Aussenzahnradpumpen%20AP100/AP100_200-P-991218-en.pdf (accessed on 5 October 2022).
- Ketelsen, S.; Michel, S.; Andersen, T.O.; Ebbesen, M.K.; Weber, J.; Schmidt, L. Thermo-Hydraulic Modelling and Experimental Validation of an Electro-Hydraulic Compact Drive. Energies 2021, 14, 2375. [Google Scholar] [CrossRef]
- Technical Data Sheet Prusament PETG by Prusa Polymers. Available online: https://prusament.com/media/2020/01/PETG_TechSheet_ENG.pdf (accessed on 1 March 2022).
Figure 1.
The EHA may operate in any of four quadrants based on the cylinder force F and velocity . Each quadrant has a unique valve position and flow direction combination. Red indicates high pressure and blue indicates low pressure.
Figure 1.
The EHA may operate in any of four quadrants based on the cylinder force F and velocity . Each quadrant has a unique valve position and flow direction combination. Red indicates high pressure and blue indicates low pressure.
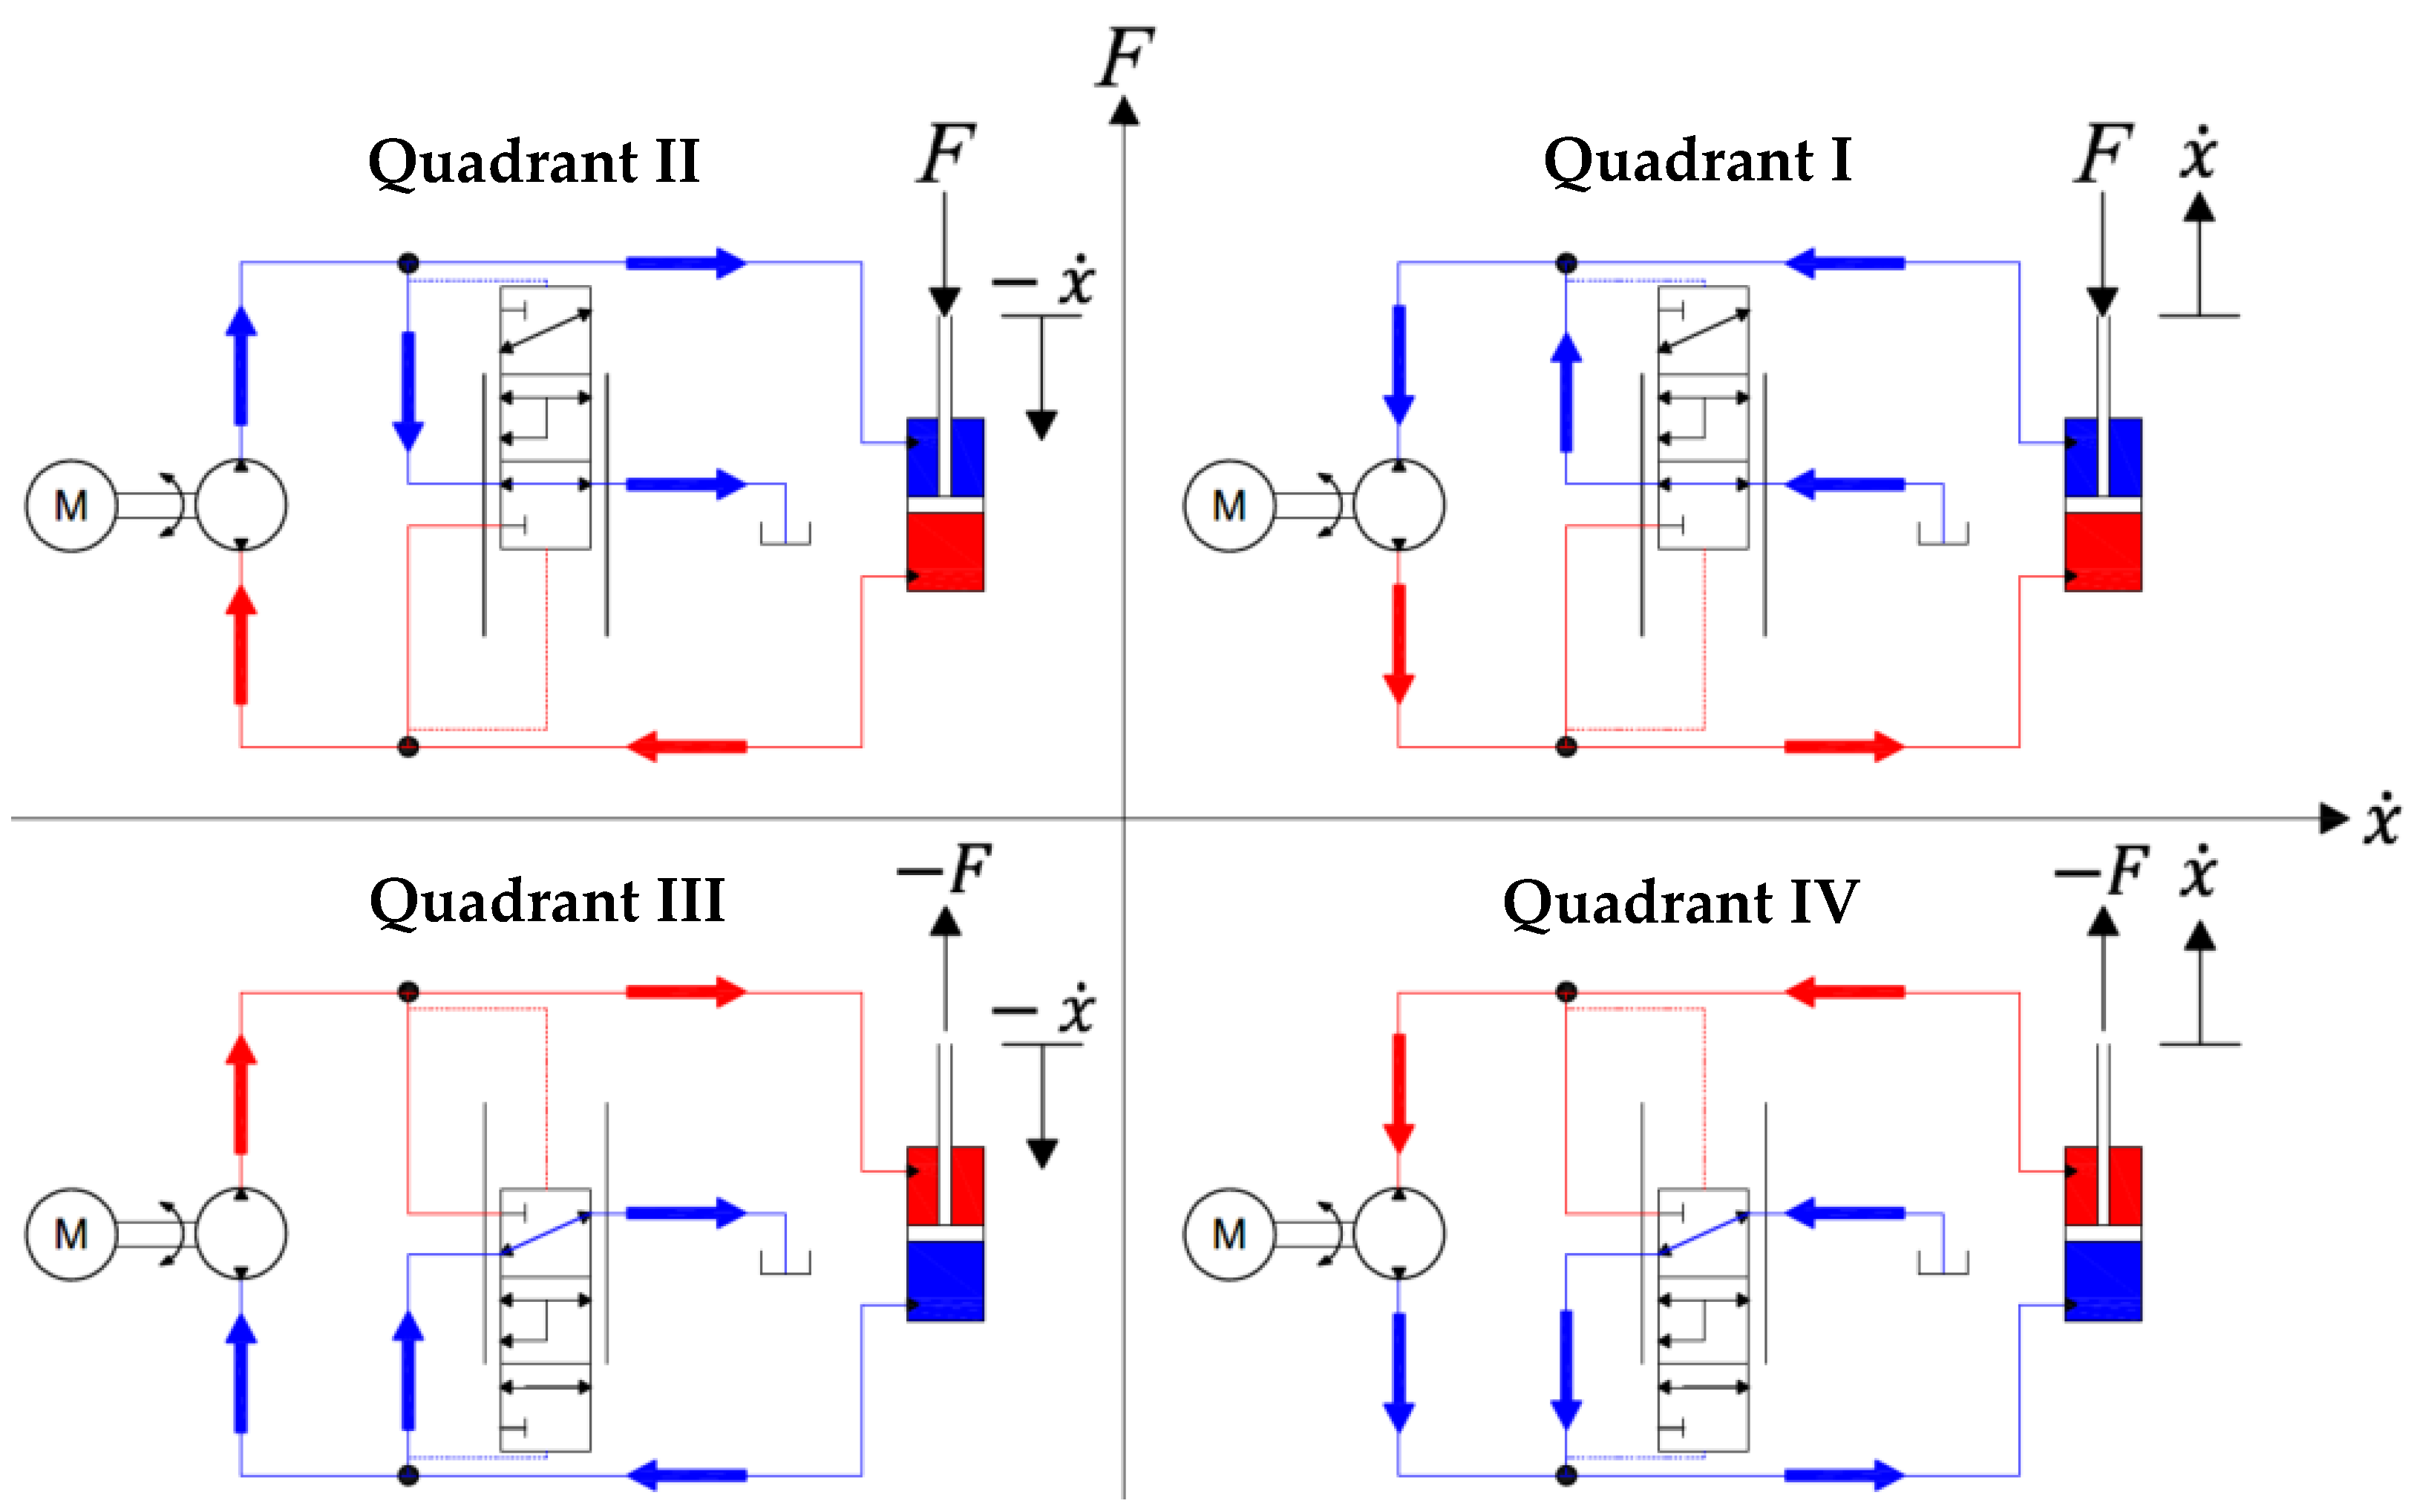
Figure 2.
(a) The temperature of the (1) compression fitting on the high-pressure side of the circuit was close to that of the (2) pump housing. (b) The temperature of the (3) cylinder and (4) fittings was low relative to that of the pump and (5) motor.
Figure 2.
(a) The temperature of the (1) compression fitting on the high-pressure side of the circuit was close to that of the (2) pump housing. (b) The temperature of the (3) cylinder and (4) fittings was low relative to that of the pump and (5) motor.
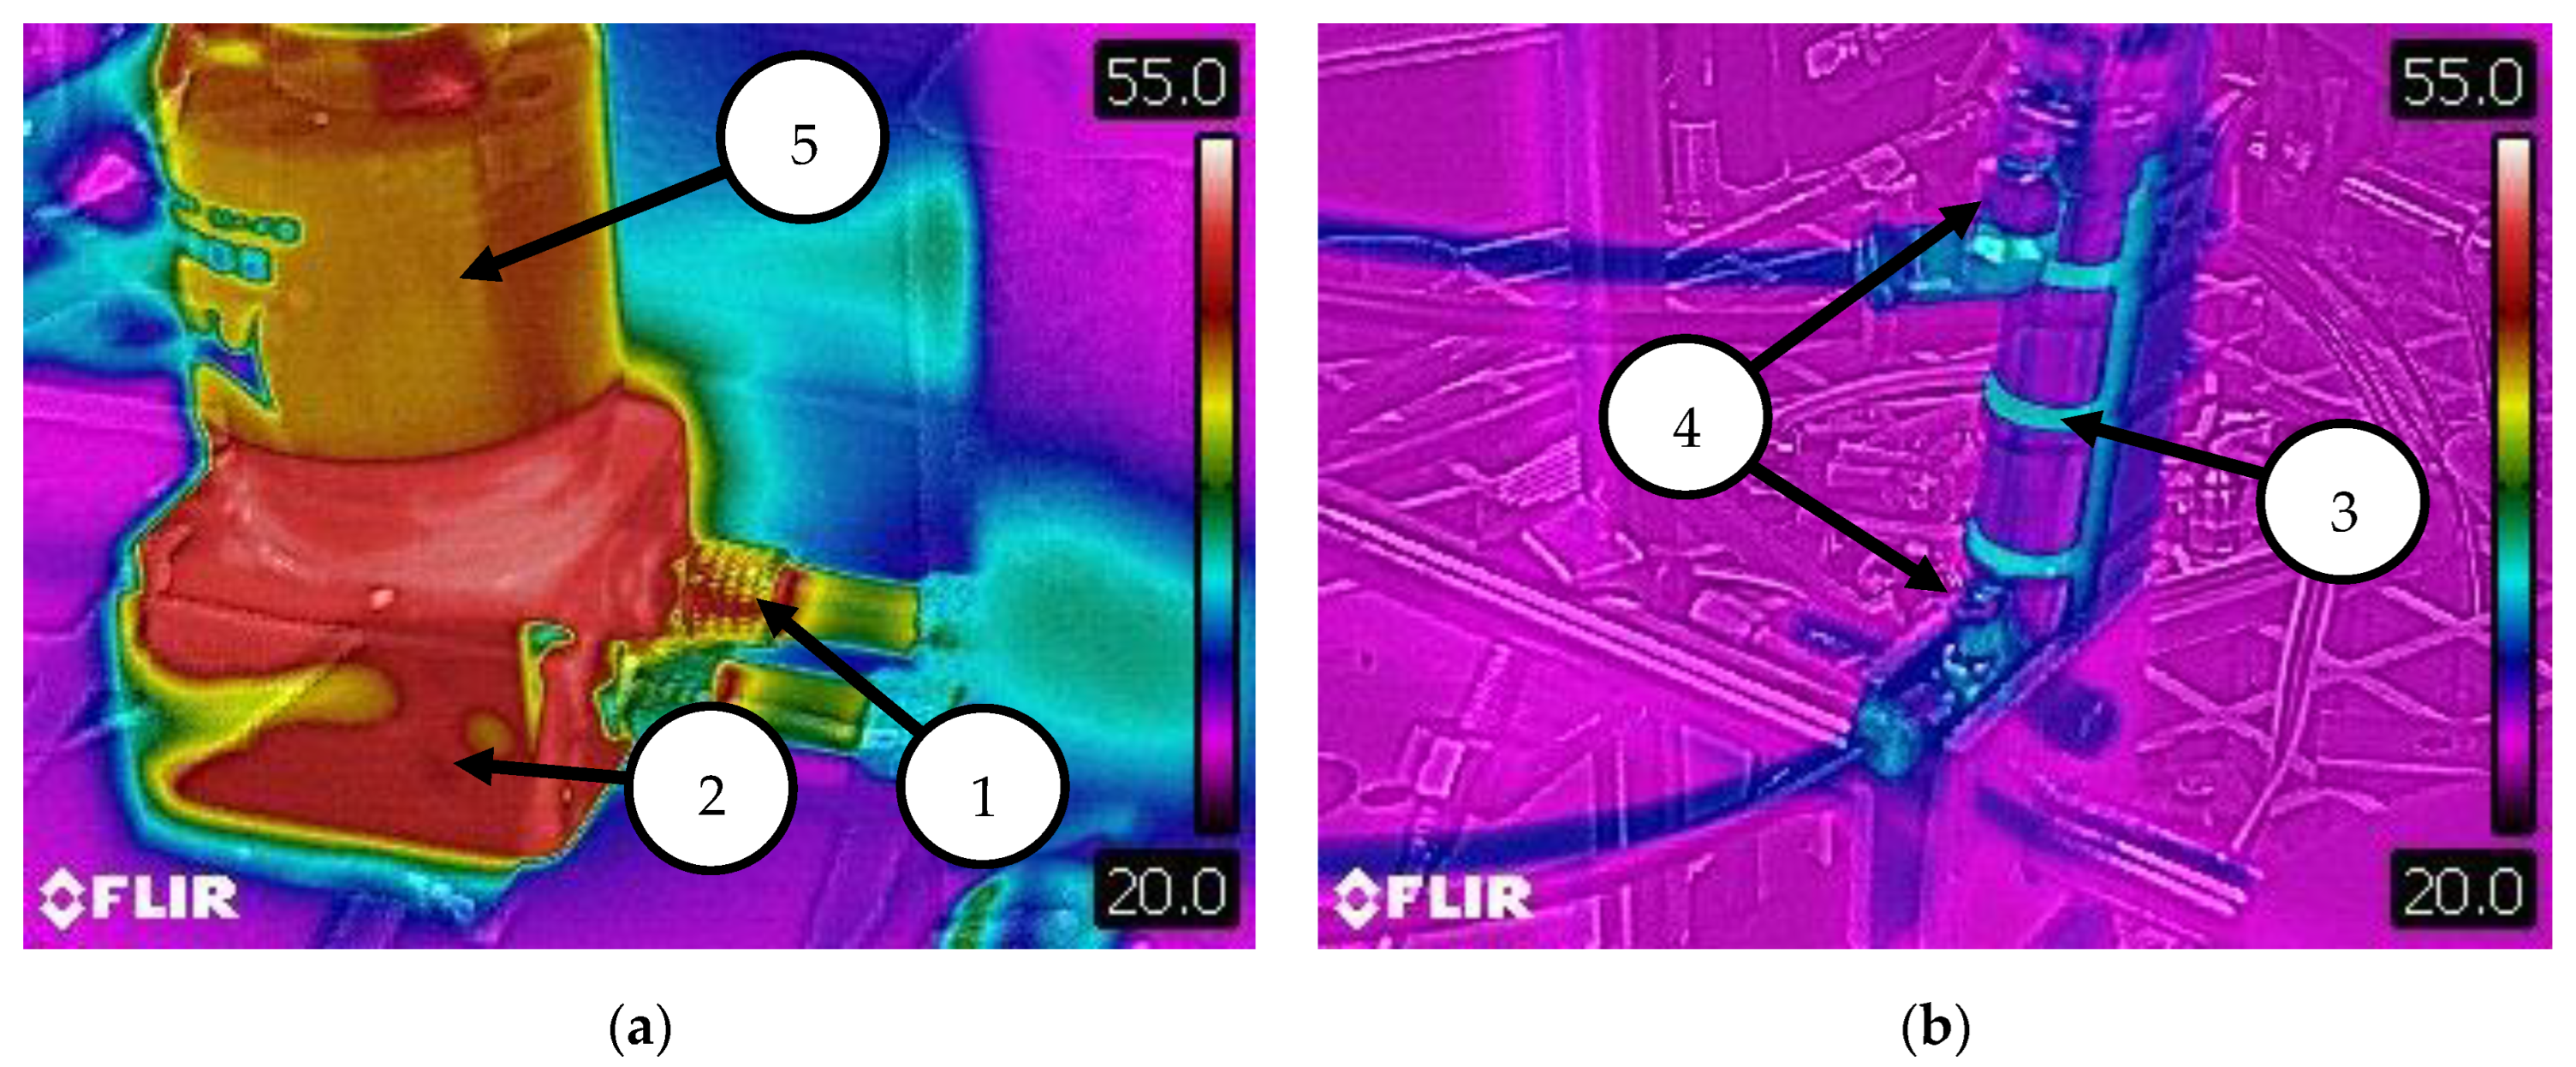
Figure 3.
(a) Experimental apparatus and (b) schematic used for characterizing the pump and motor combination. Notable components include the (1) pump and motor, (2) pressure transducer, (3) relief valve, (4) flow meter, (5) fluid reservoir.
Figure 3.
(a) Experimental apparatus and (b) schematic used for characterizing the pump and motor combination. Notable components include the (1) pump and motor, (2) pressure transducer, (3) relief valve, (4) flow meter, (5) fluid reservoir.

Figure 4.
(a) Experimental apparatus and (b) schematic used testing the EHA system. Notable components include the (1) pump and motor, (2) pressure transducer, (3) 3D printed hydraulic power unit, (4) loading weights, (5) 2:1 lever arm, and (6) hydraulic cylinder.
Figure 4.
(a) Experimental apparatus and (b) schematic used testing the EHA system. Notable components include the (1) pump and motor, (2) pressure transducer, (3) 3D printed hydraulic power unit, (4) loading weights, (5) 2:1 lever arm, and (6) hydraulic cylinder.
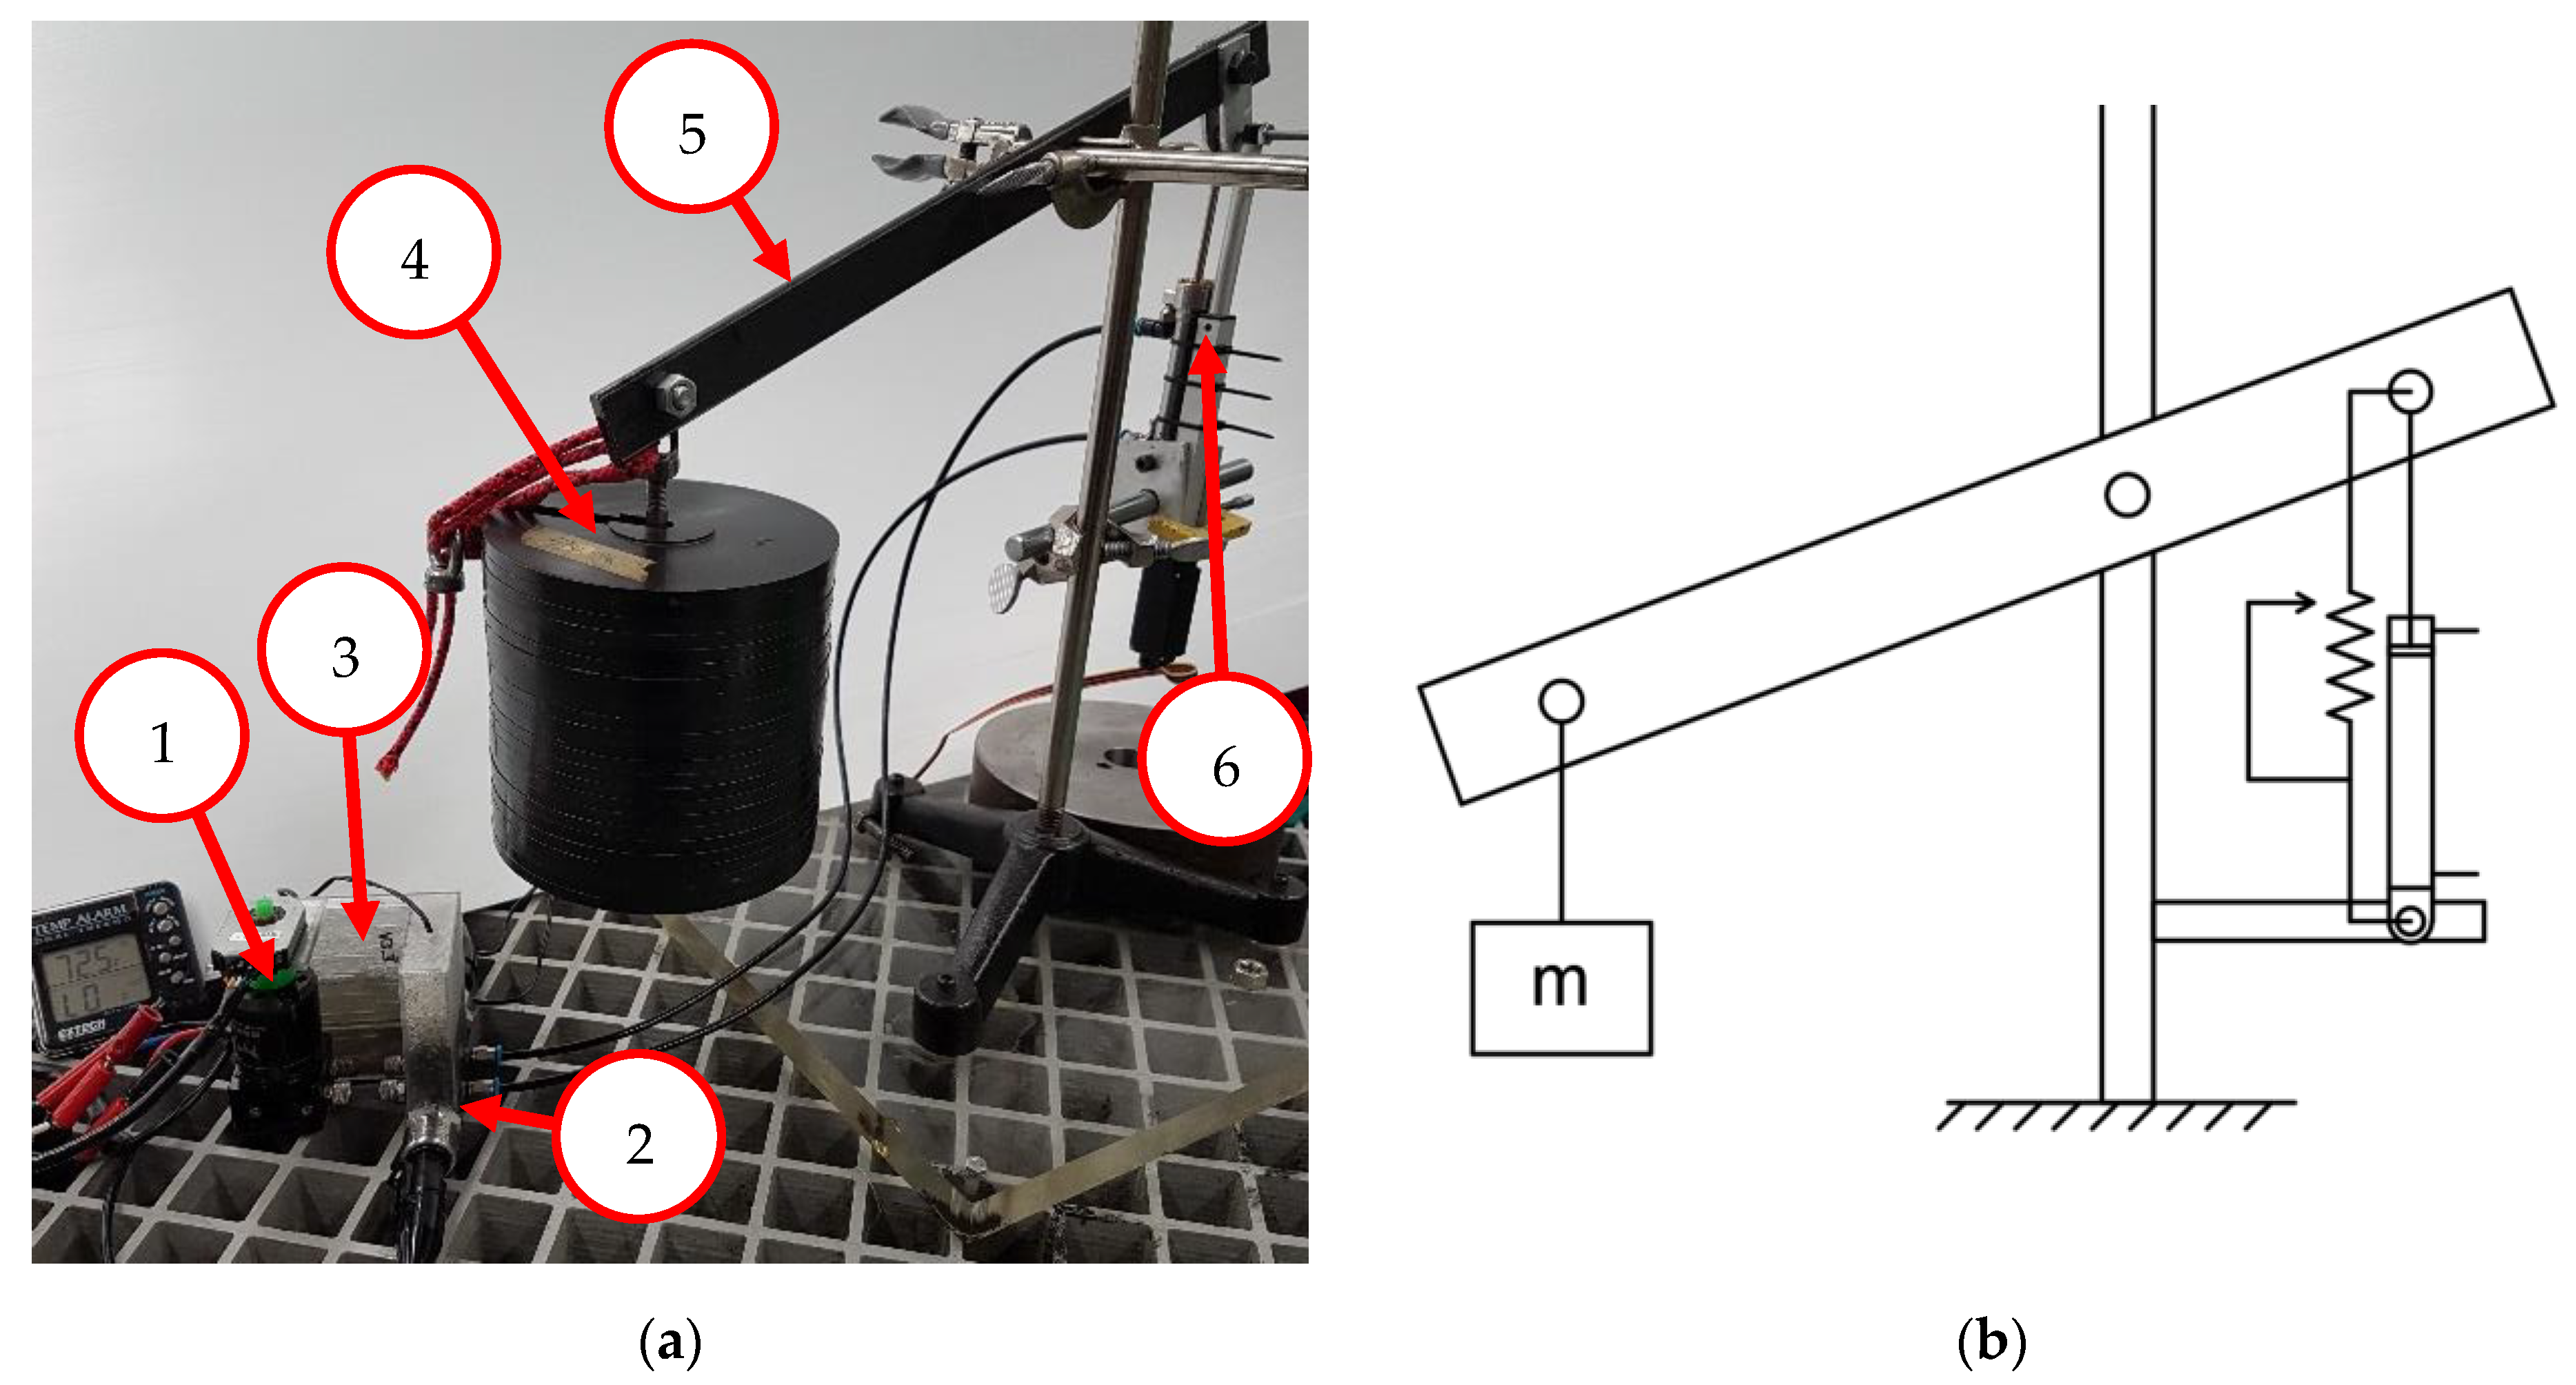
Figure 5.
Pump flows and pressures measured for each run during the pump characterization tests. Line color represents the relief set pressure at 0.3 L/min. Black lines indicate constant pump speed.
Figure 5.
Pump flows and pressures measured for each run during the pump characterization tests. Line color represents the relief set pressure at 0.3 L/min. Black lines indicate constant pump speed.
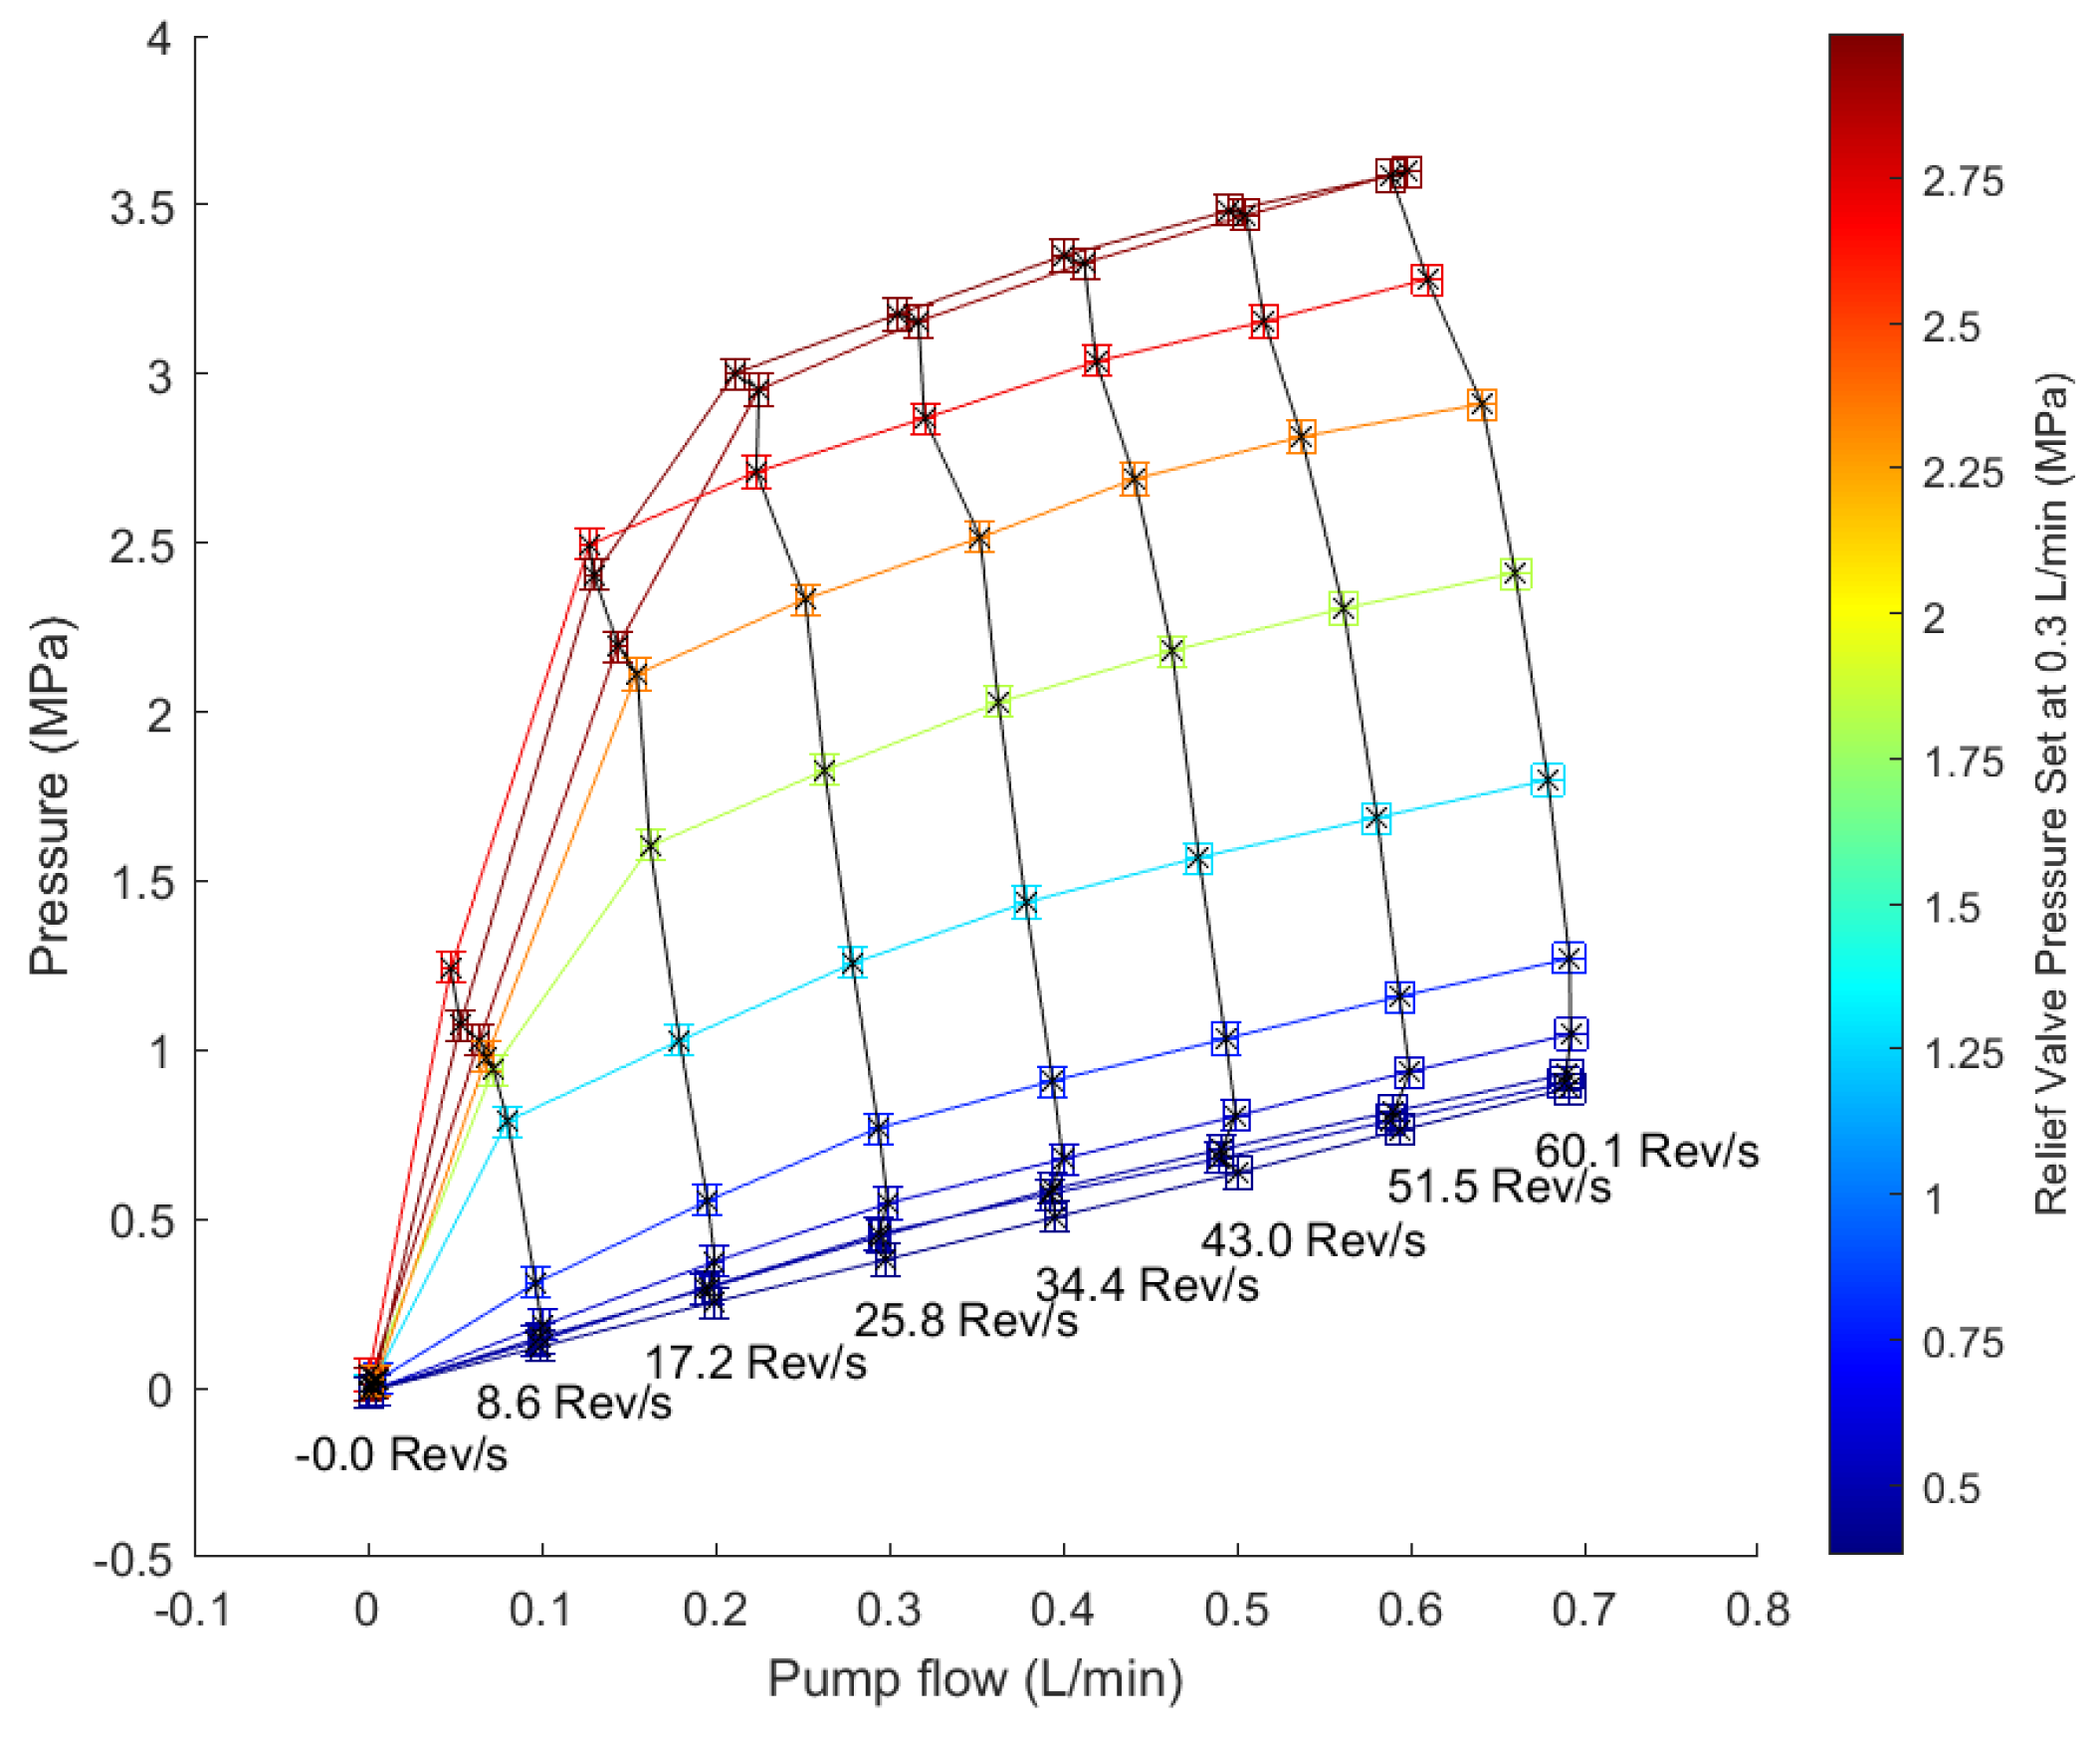
Figure 6.
Pump characterization map relating pump (a) flow, (b) pressure, and (c) combined pump and motor efficiency to motor current and speed.
Figure 6.
Pump characterization map relating pump (a) flow, (b) pressure, and (c) combined pump and motor efficiency to motor current and speed.

Figure 7.
Actual cylinder speed versus the commanded cylinder speed or pump speed revealing the pump speed at the onset of cavitation.
Figure 7.
Actual cylinder speed versus the commanded cylinder speed or pump speed revealing the pump speed at the onset of cavitation.

Figure 8.
Fluid pressure on the (a) “A” and (b) “B” side of the circuit over a range of cylinder speeds and loads in (a) operating Quadrant I and (b) operating Quadrant III.
Figure 8.
Fluid pressure on the (a) “A” and (b) “B” side of the circuit over a range of cylinder speeds and loads in (a) operating Quadrant I and (b) operating Quadrant III.
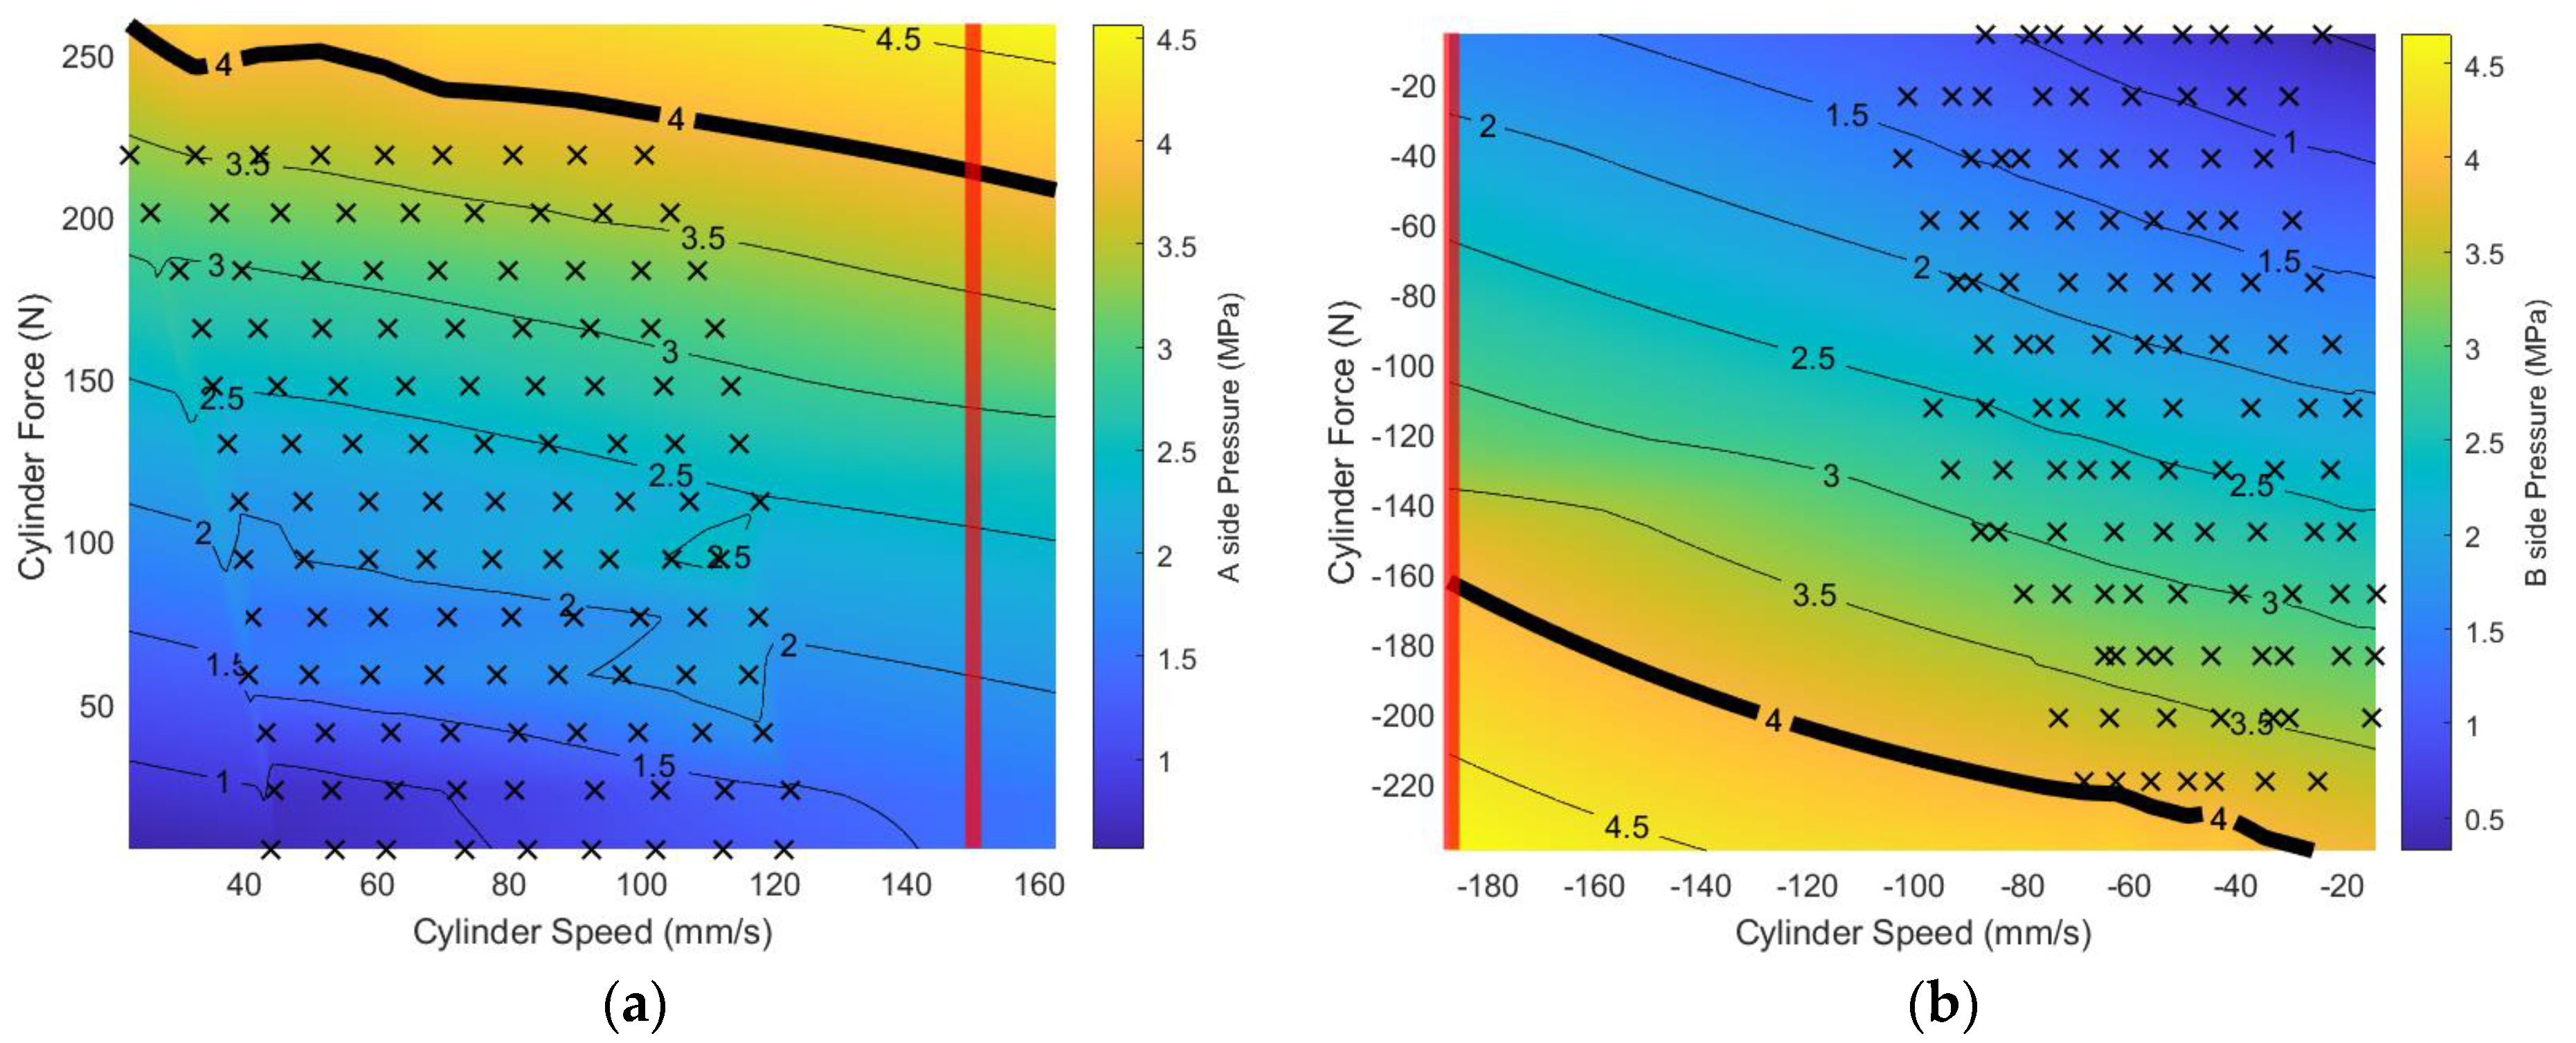
Figure 9.
Hydraulic efficiency of the system (excluding the pump) for (a) operating Quadrant I and (b) operating Quadrant III.
Figure 9.
Hydraulic efficiency of the system (excluding the pump) for (a) operating Quadrant I and (b) operating Quadrant III.
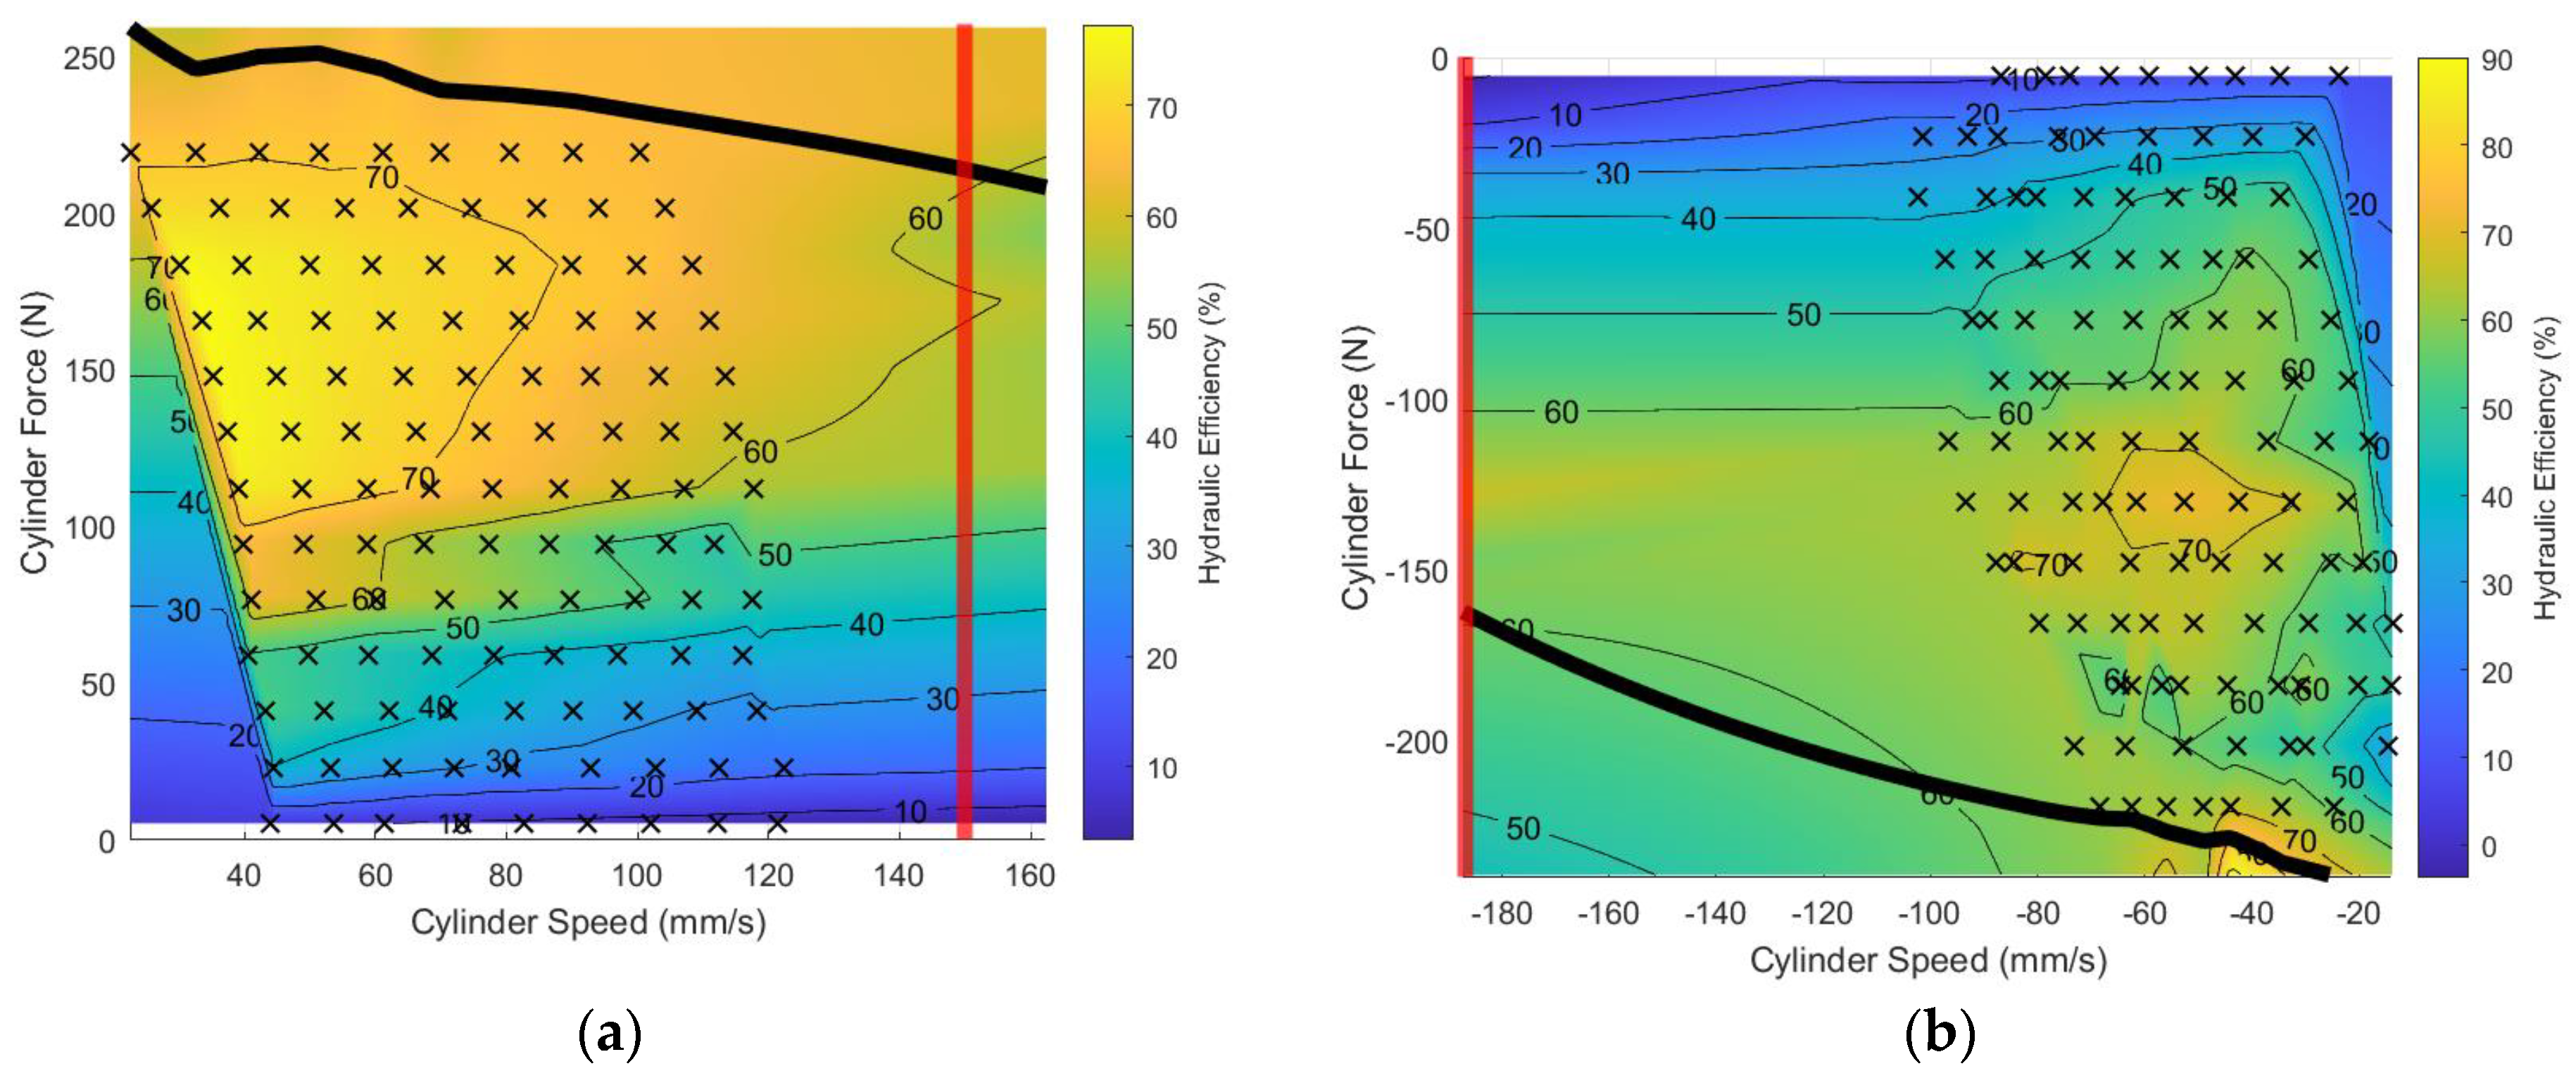
Figure 10.
Estimations of the power losses due to the tubing restrictions, poppet leakage, and cylinder friction for (a) operating Quadrant I and (b) operating Quadrant III.
Figure 10.
Estimations of the power losses due to the tubing restrictions, poppet leakage, and cylinder friction for (a) operating Quadrant I and (b) operating Quadrant III.
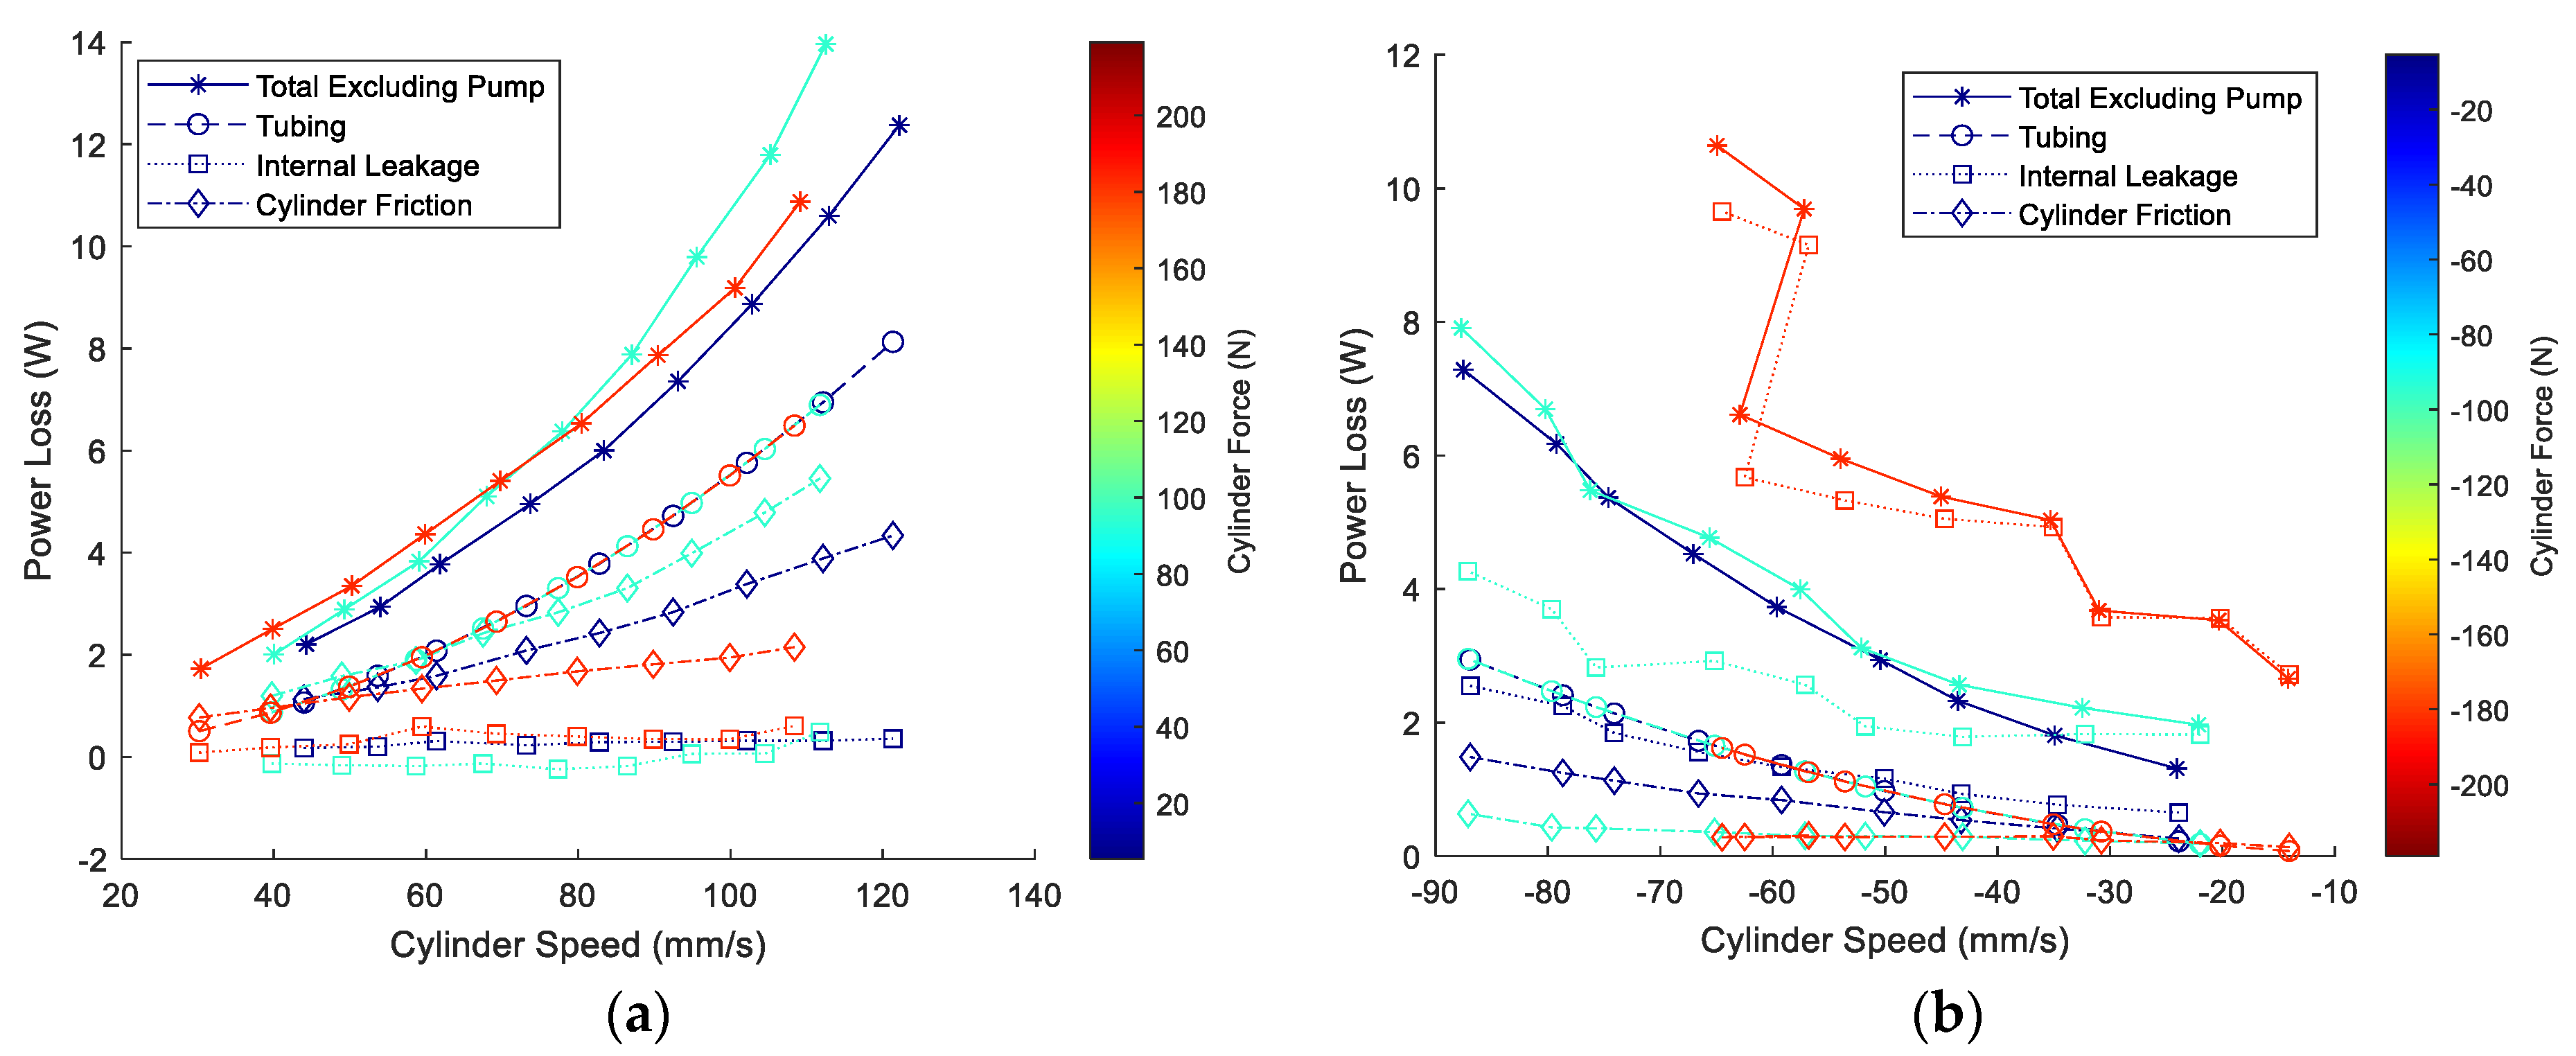
Figure 11.
Output power in (a) operating Quadrant I and (b) operating Quadrant III is limited by maximum system pressure (black line) and pump cavitation (red line).
Figure 11.
Output power in (a) operating Quadrant I and (b) operating Quadrant III is limited by maximum system pressure (black line) and pump cavitation (red line).
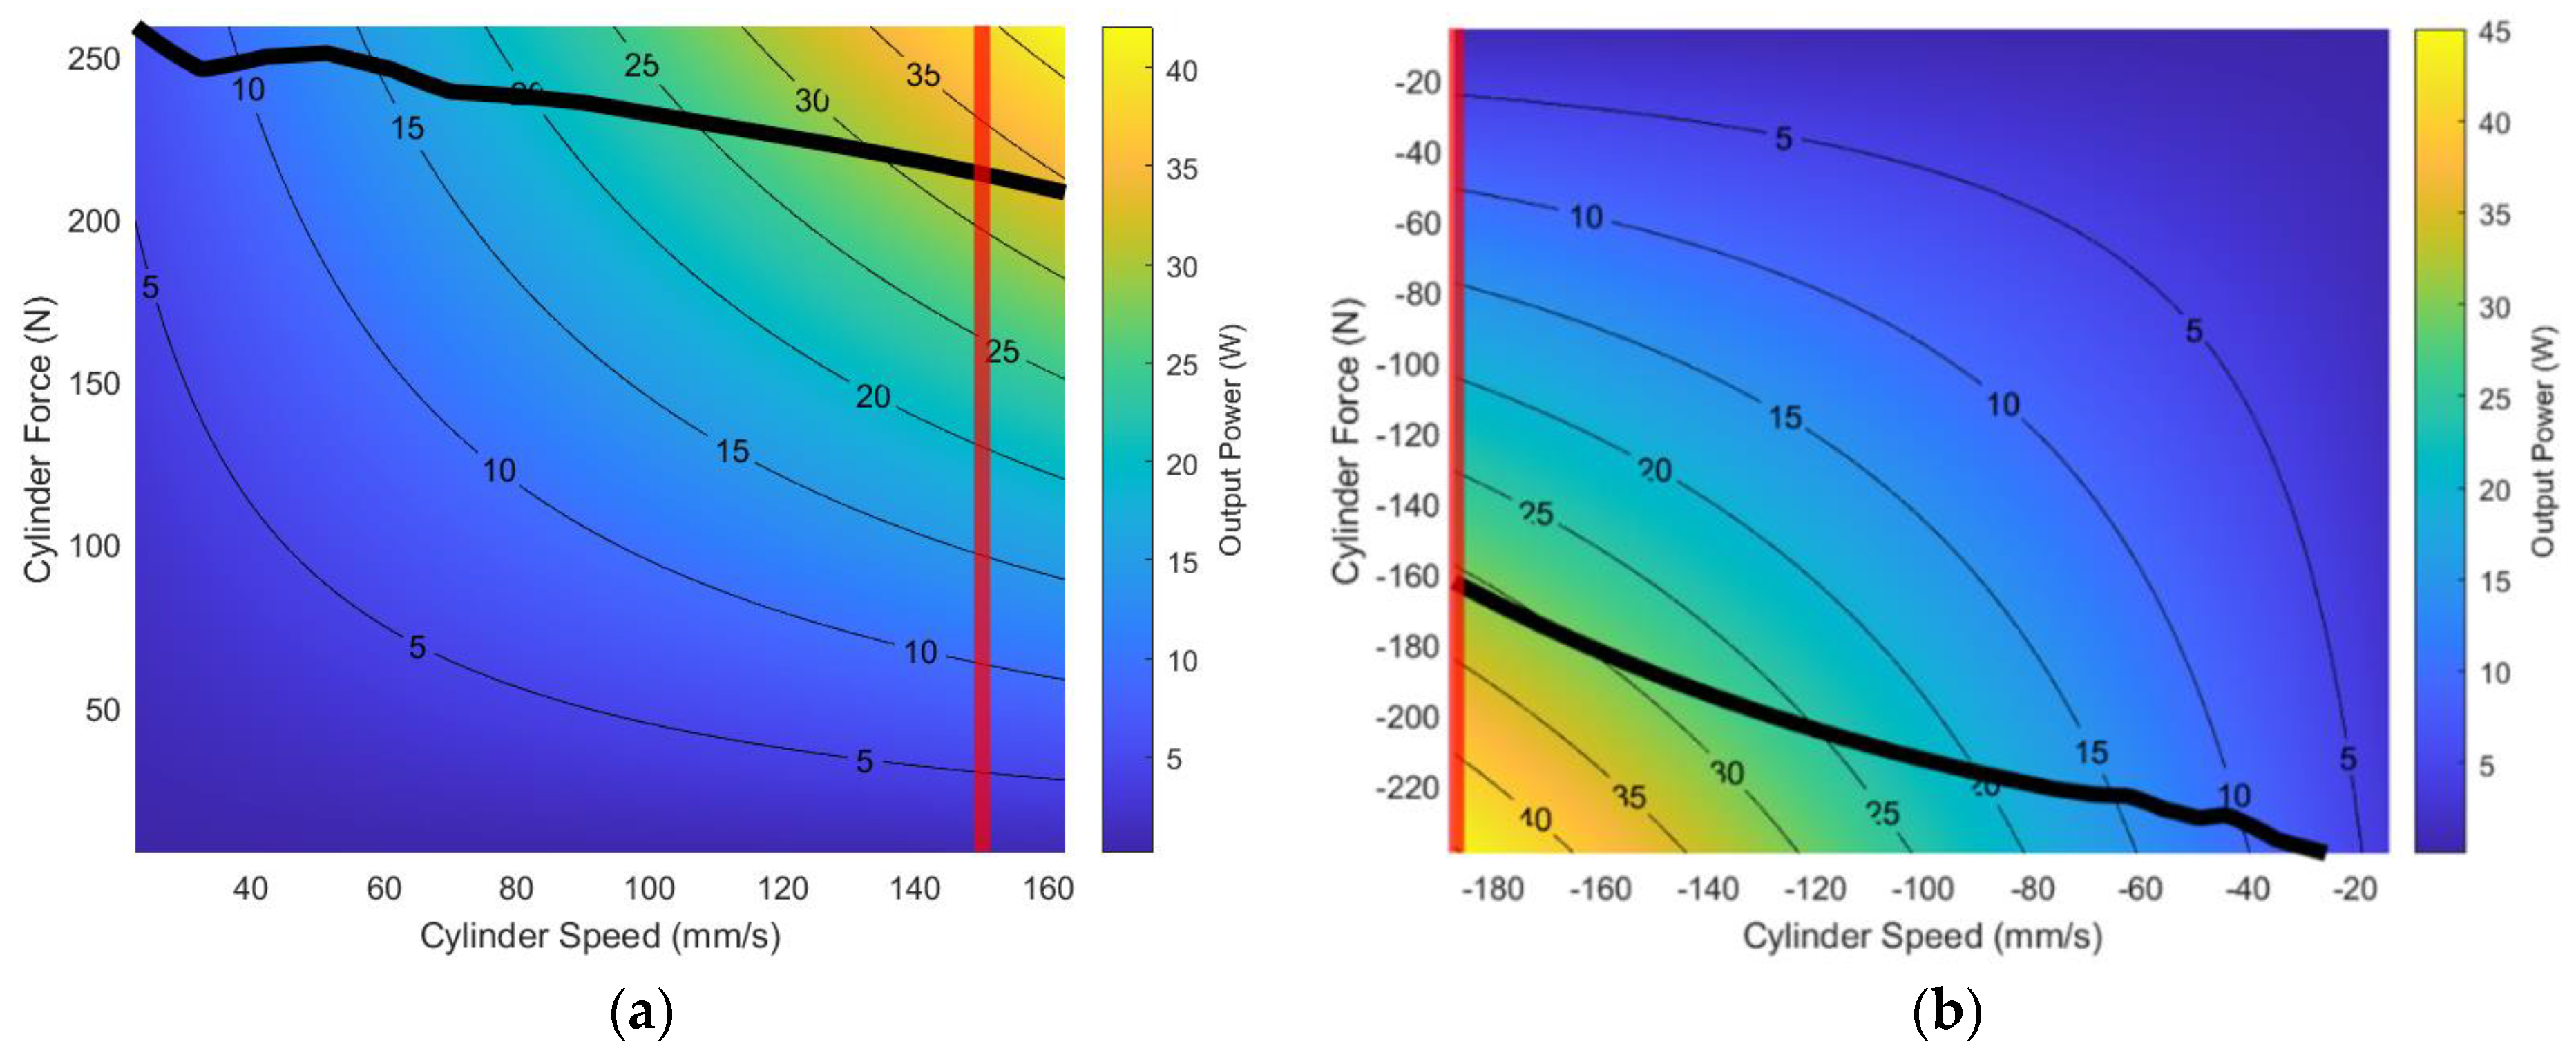
Figure 12.
Sample experimental EHA system response to a step increase in commanded speed from −100 mm/s to −150 mm/s with load masses of (a) 0 kg, (b) 4.8 kg, and (c) 9.4 kg.
Figure 12.
Sample experimental EHA system response to a step increase in commanded speed from −100 mm/s to −150 mm/s with load masses of (a) 0 kg, (b) 4.8 kg, and (c) 9.4 kg.

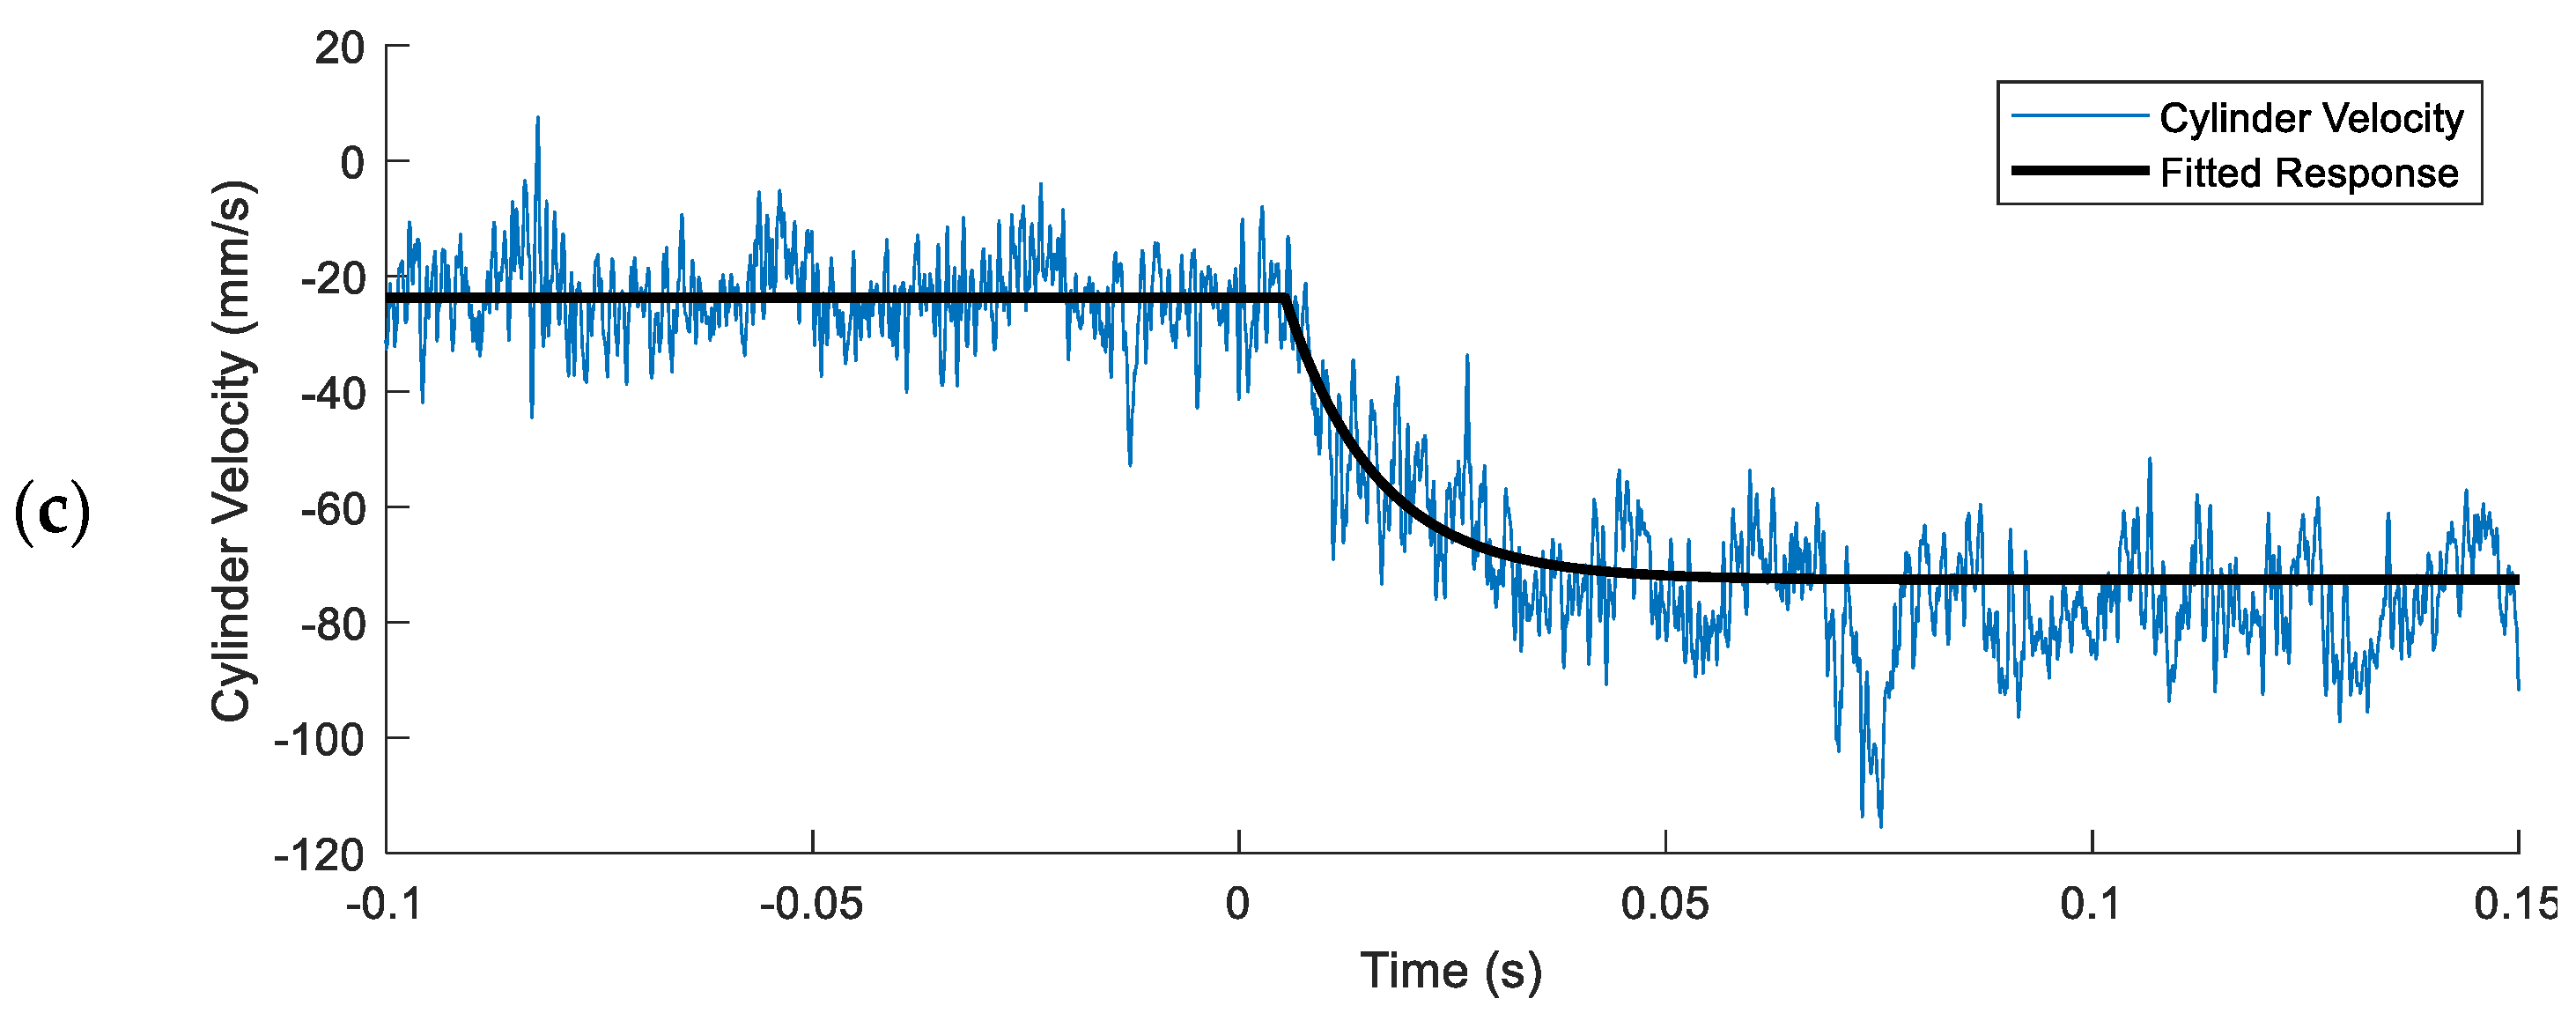
Figure 13.
Sample of cylinder and electrical power measured which was used to calculate system heat generation.
Figure 13.
Sample of cylinder and electrical power measured which was used to calculate system heat generation.

Figure 14.
Pump case and reservoir fluid temperature over time at four different heat generation levels. Solid lines indicate measured data and dashed lines indicate the fitted first order model.
Figure 14.
Pump case and reservoir fluid temperature over time at four different heat generation levels. Solid lines indicate measured data and dashed lines indicate the fitted first order model.

Figure 15.
Thermal images of the EHA system at one-minute intervals during the first five minutes of the 184 N load test. The three measurement locations in each frame show the pump housing, reservoir surface, and cylinder temperatures.
Figure 15.
Thermal images of the EHA system at one-minute intervals during the first five minutes of the 184 N load test. The three measurement locations in each frame show the pump housing, reservoir surface, and cylinder temperatures.
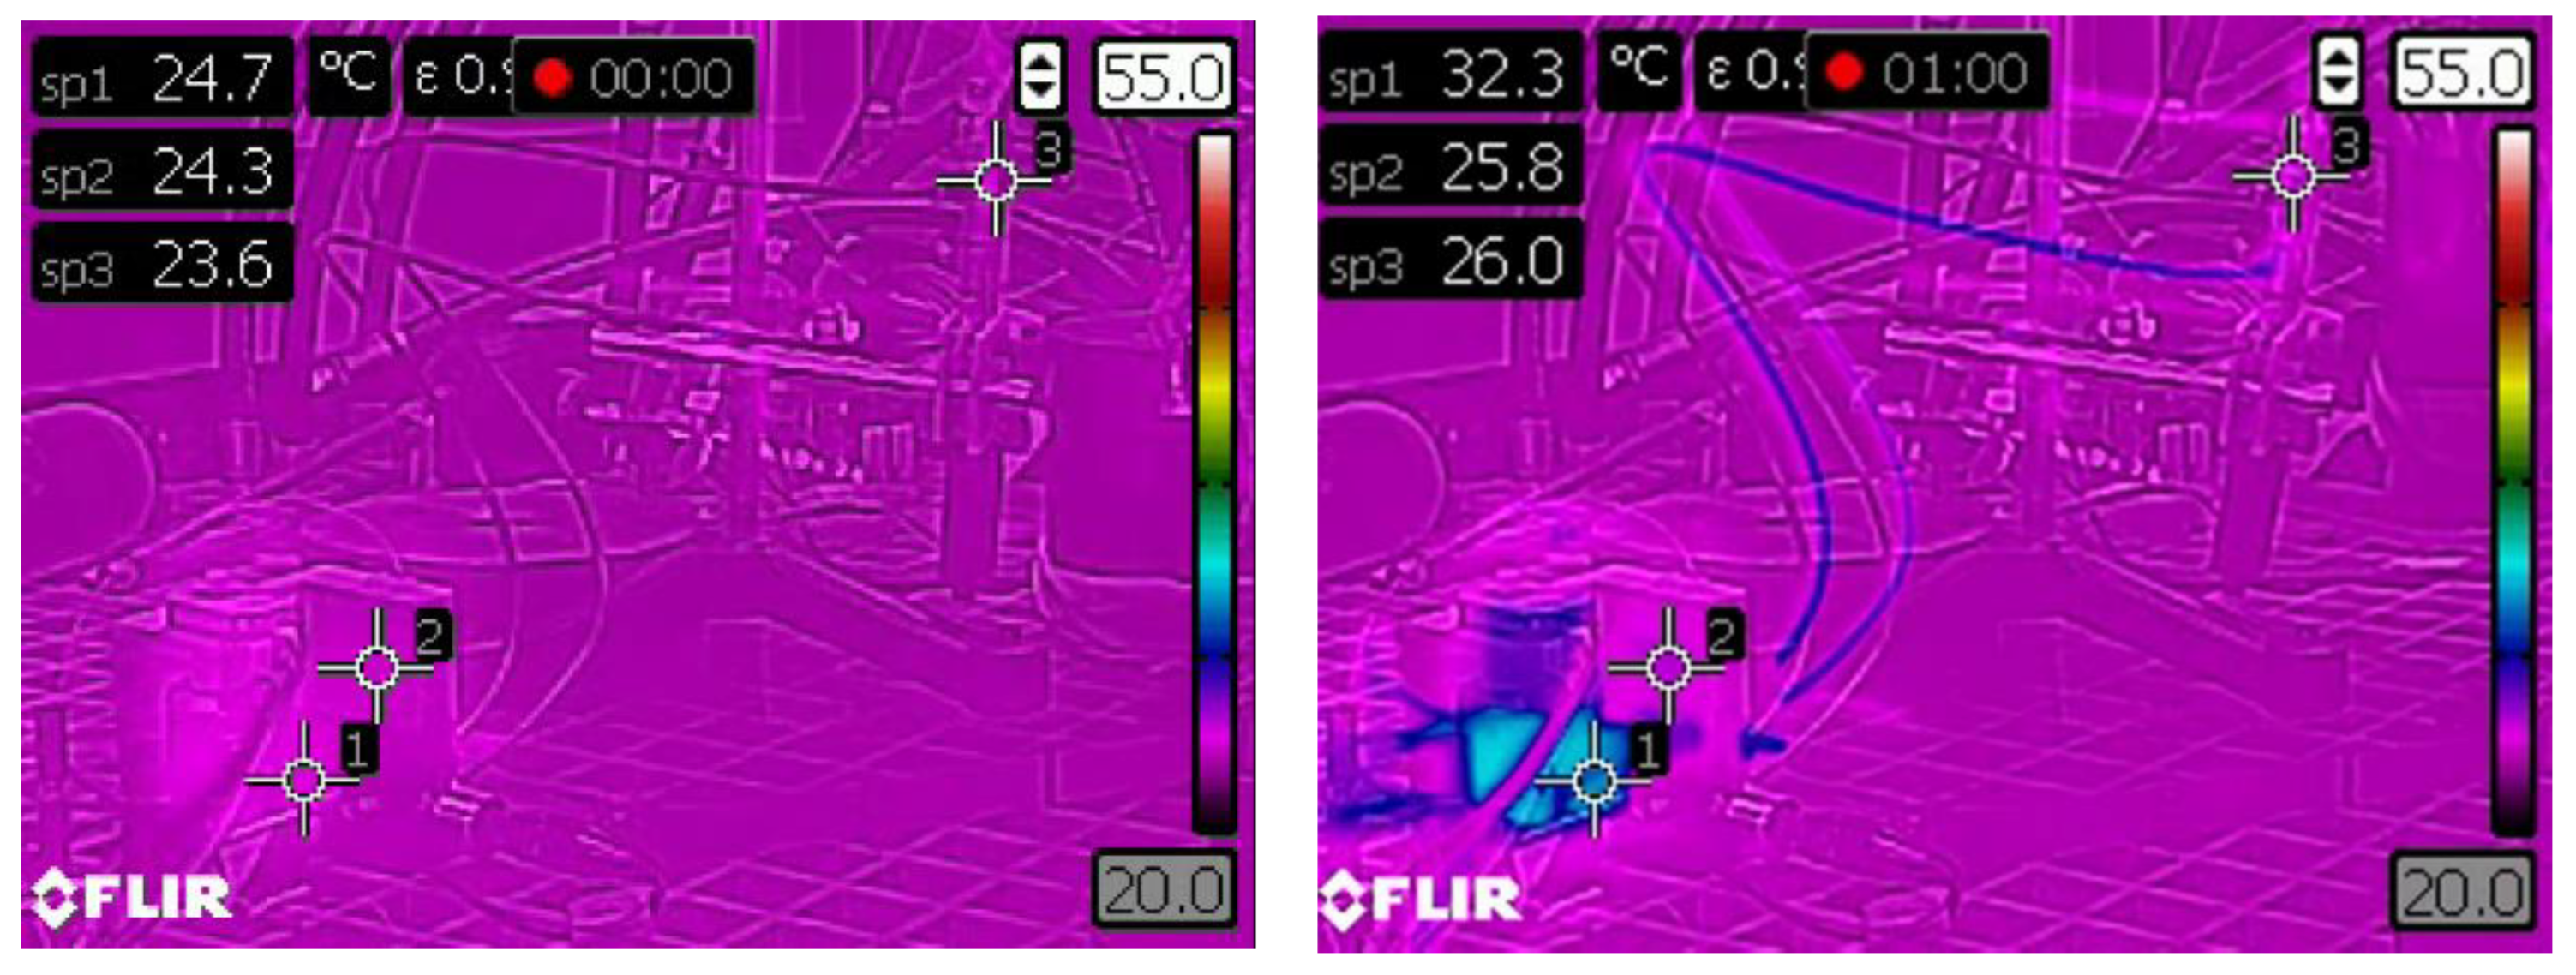
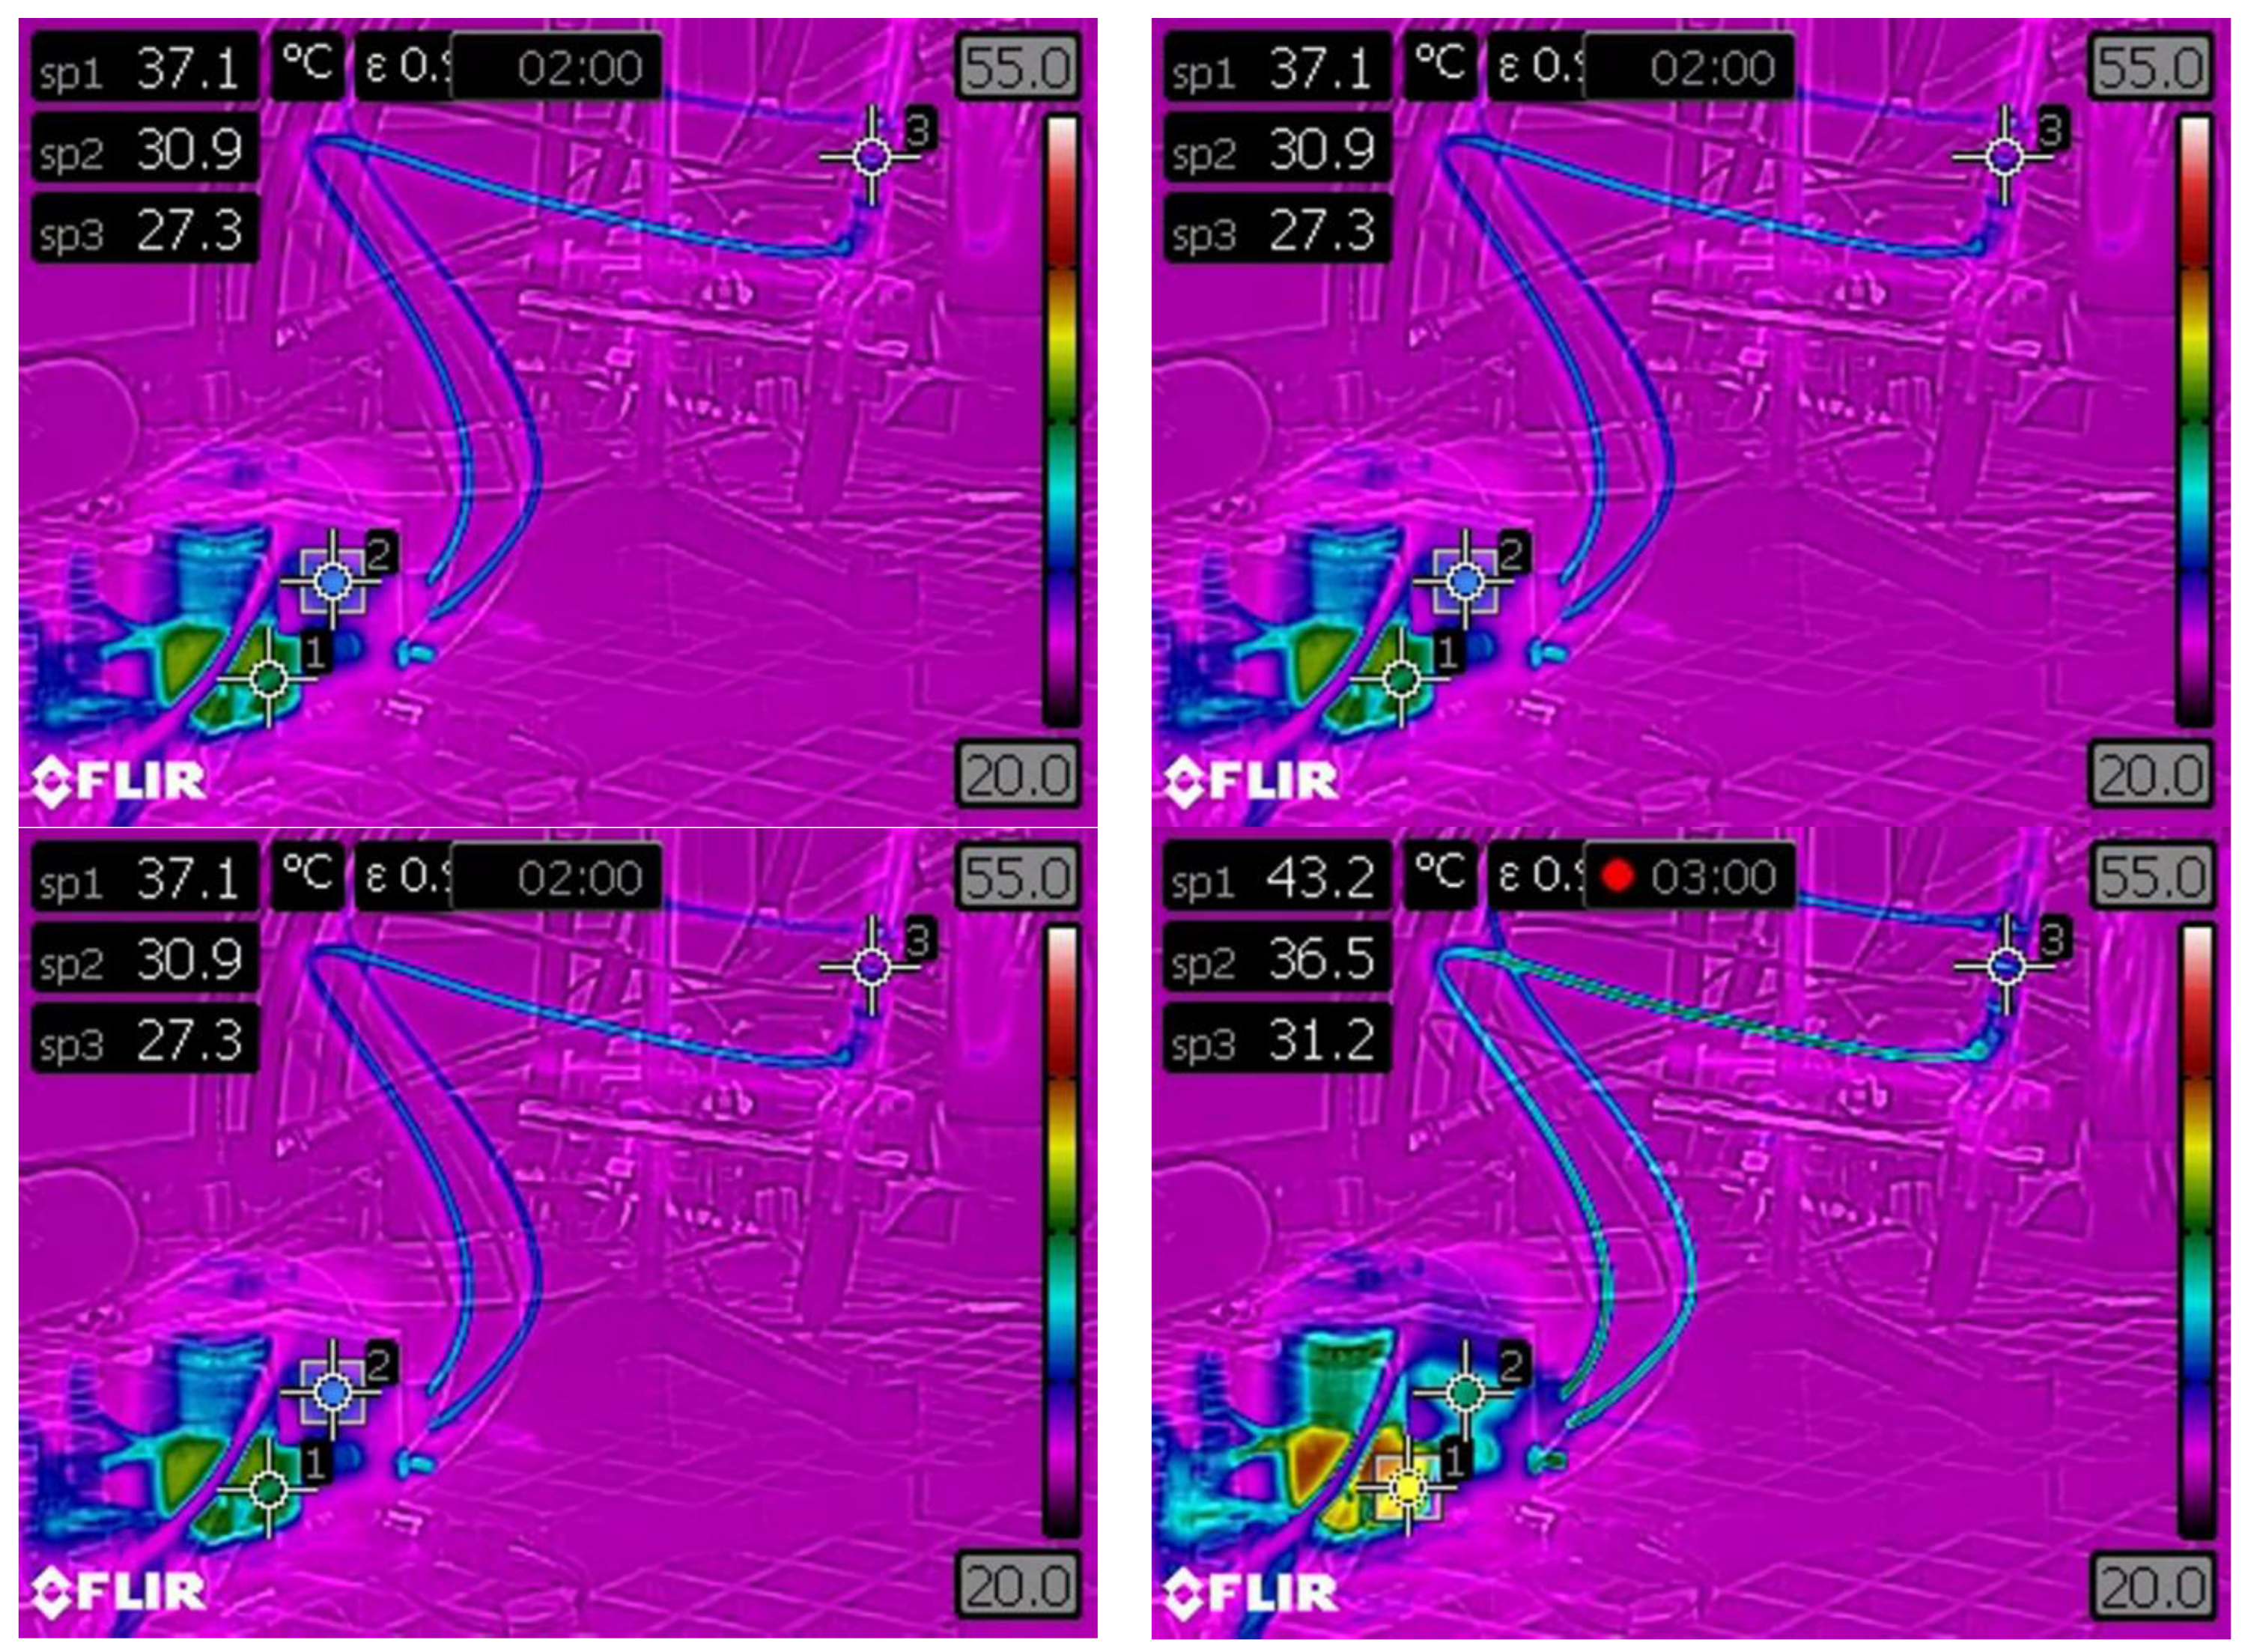
Figure 16.
EHA system power losses (heat generation) in (a) operating Quadrant I and (b) operating Quadrant III. Operating limits exist as maximum system pressure (black line) and pump cavitation (red line).
Figure 16.
EHA system power losses (heat generation) in (a) operating Quadrant I and (b) operating Quadrant III. Operating limits exist as maximum system pressure (black line) and pump cavitation (red line).


Table 1.
Summary of pump performance characteristics fitted to the experimental data.
| Parameter | Fitted Value |
|---|---|
| [RPM/V] | 1108 (1088–1128) |
| [-] | 0.98 (0.94–1.03) |
| [Pa∙s] | 885 (678–1093) |
| [Nm] | 1.91 × 10⁻³ (0.66 × 10⁻³–3.2 × 10⁻³) |
| [m3/rev] | 2.02 × 10⁻⁷ (2.01 × 10⁻⁷–2.04 × 10⁻⁷) |
| [1/(Pa∙s)] | 2.65 × 10⁻⁶ (2.49 × 10⁻⁶–2.80 × 10⁻⁶) |
Table 2.
First-order time constants fitted to the system response for various load masses tested, averaged over ten trials.
Table 2.
First-order time constants fitted to the system response for various load masses tested, averaged over ten trials.
| Fitted Time Constant τvel (ms) | ||
|---|---|---|
| Load Mass (kg) | Average | Standard Deviation |
| 0 | 3.89 | 1.72 |
| 4.8 | 7.65 | 1.34 |
| 9.4 | 12.5 | 1.01 |
Table 3.
Fitted thermal model parameters for the temperature of the pump housing at four different heat generation levels.
Table 3.
Fitted thermal model parameters for the temperature of the pump housing at four different heat generation levels.
| Cylinder Load, F (N) | Heat Generated, Q (W) | (s) | Steady Temperature, T∞ (°C) |
|---|---|---|---|
| 50 | 8.6 | 242 | 36.3 |
| 94 | 13.8 | 246 | 43.6 |
| 139 | 20.4 | 440 | 67.1 |
| 184 | 26.4 | 459 | 84.1 |
Publisher’s Note: MDPI stays neutral with regard to jurisdictional claims in published maps and institutional affiliations. |
© 2022 by the authors. Licensee MDPI, Basel, Switzerland. This article is an open access article distributed under the terms and conditions of the Creative Commons Attribution (CC BY) license (https://creativecommons.org/licenses/by/4.0/).
Share and Cite
MDPI and ACS Style
Deibert, B.; Wiens, T. Performance Assessment of a Low-Cost Miniature Electrohydrostatic Actuator. Actuators 2022, 11, 334. https://doi.org/10.3390/act11110334
AMA Style
Deibert B, Wiens T. Performance Assessment of a Low-Cost Miniature Electrohydrostatic Actuator. Actuators. 2022; 11(11):334. https://doi.org/10.3390/act11110334
Chicago/Turabian StyleDeibert, Brendan, and Travis Wiens. 2022. "Performance Assessment of a Low-Cost Miniature Electrohydrostatic Actuator" Actuators 11, no. 11: 334. https://doi.org/10.3390/act11110334
Note that from the first issue of 2016, this journal uses article numbers instead of page numbers. See further details here.