Article

Experimental Study on the Working Characteristics of Tri-Electrode Plasma Actuator Utilizing a Combination of Corona and Barrier Discharges

1
Department of Mechanical Systems Engineering, Tokyo University of Agriculture and Technology, Koganei 184-8588, Tokyo, Japan
2
Department of Energy and Environment, National Institute of Advanced Industrial Science and Technology, Tsukuba 305-8564, Ibaraki, Japan
*
Author to whom correspondence should be addressed.
Actuators 2022, 11(11), 322; https://doi.org/10.3390/act11110322
Submission received: 30 September 2022 / Revised: 2 November 2022 / Accepted: 3 November 2022 / Published: 7 November 2022
(This article belongs to the Special Issue Dielectric Barrier Discharge Plasma Actuator for Active Flow Control)

Abstract

:
A tri-electrode plasma actuator (TED-PA), which has an additional electrode with a DC voltage, induces jets from two facing electrodes and achieves larger thrust and higher efficiency than a conventional dielectric barrier discharge plasma actuator. However, there are problems such as the large potential difference between the exposed electrodes, which can cause sparks and device destruction. Therefore, it is necessary to clarify the working mechanism of TED-PAs and optimize their configuration and applied voltage. In this study, we obtained the discharge photograph, the thrust, and the flow velocity field and investigated the characteristics of the DC voltage and the frequency of the AC voltage. To isolate the effects of the discharge from the potential variation, a corona discharge plasma actuator and a TED-PA were compared. As a result, increasing the frequency of the AC voltage induced stronger jets from the AC and DC electrodes. This result indicates that the barrier discharge enhances the jet from the DC electrode without changing the potential difference between the electrodes.

1. Introduction

Dielectric barrier discharge plasma actuators (DBDPAs) are promising active flow control devices [1,2,3,4,5,6,7,8]. As shown in Figure 1, a DBDPA consists of two electrodes separated by a dielectric, where the AC electrode is exposed to the air, and the other electrode is encapsulated by a dielectric and is electrically grounded. When a high AC voltage of several kV and several kHz are applied to the AC electrode, a barrier discharge appears, and the plasma particles generated in the discharge are accelerated by the electric field and collide with the neutral molecules. The momentum transfer from the plasma to neutral molecules leads to electrohydrodynamic (EHD) force generation, which induces a jet normal to the wall surface. DBDPAs have many advantages such as being thin and light, and having no mechanical moving parts, and excellent rapid controllability. Although the performance of the DBDPA is adversely affected by weather conditions such as rain and wind gust, recent studies suggested that this problem could be overcome. Lilley et al. investigated the effects of water droplet adhesion directly sprayed on a plasma actuator and showed that the actuator was durable enough even when completely wet, and gradually recovers to its performance in dry air by continued driving [9]. Although the induced flow velocity and thrust are decreased when the relative humidity is above 70%, this detrimental effect can be compensated for by increasing the applied voltage [10,11]. For overcoming time-varying wind and wind gusts, the feedback control, which changes the DBDPA actuation in real-time, has been intensively studied and was shown to be significantly effective [8,12,13]. However, the velocity of the induced jet is typically only a few meters per second, and enhancement of the flow control capability of DBDPAs is required because it drastically reduces in high-speed flows.
Various electrode configurations have been investigated to improve the performance of the DBDPA [14,15,16,17,18,19]. The use of a tri-electrode plasma actuator (TED-PA) is one approach to improving the fluid control capability. As shown in Figure 2, a TED-PA has an additional DC electrode downstream of the AC electrode. The DC electrode is added in order to increase the discharge area and induce a faster airflow from the AC electrode [20,21,22]. In the flow separation control around circular cylinders, higher drag reduction and energy efficiency have been achieved compared to conventional DBDPAs [23,24]. In addition, Zheng et al. reported that when a pulsed voltage is applied to the AC electrode, the DC electrode affects the unsteady vortex generation by the induced jet, and the generated vortex effectively controls the sectional lateral force caused by the asymmetric vortices on a slender body [25,26,27].
However, the flow visualization in a previous study reported that applying a high voltage to the DC electrode induces a jet from the DC electrode that collides with the jet from the AC electrode, and the induced jet is vertically deflected [22,28,29]. Jukes et al. demonstrated that a DBDPA placed at a yaw angle to the main flow effectively worked for flow separation control because of the interaction between the induced jet and the main flow generated vortices [30]. In recent years, plasma vortex generators such as two DBDPAs facing each other [31,32,33,34,35] and curved actuators with circular or triangular-shaped electrodes [36,37,38] have been particularly studied and shown to be efficient for airflow control. The plasma vortex generator induces a deflected jet against the aerodynamic surface, as in a TED-PA. Such a jet deflected against the wall surface may promote the transition to a turbulent flow through disturbance input or generate a large-scale vortex; this leads to the suppression of flow separation. TED-PAs are superior to DBDPAs because of their larger thrust and higher efficiency. Matsuno et al. showed that when the DC voltage was 23 kV, the thrust of the jet induced by the TED-PA was 10.6 times greater and the electrical efficiency was six times higher compared to those with a 0 kV DC voltage [28]. Arrayed microscale plasma actuators also generate stronger thrust than the conventional DBDPA due to higher force density [39,40]. However, the TED-PA could achieve higher power efficiency than microscale plasma actuators because the DC discharge can generate force with higher efficiency. The performance improves with larger DC voltages; however, there are problems to be addressed. For example, the deflection angle of the jet changes depending on the applied voltage, and the large potential difference between the exposed electrodes causes sparks and device destruction. Therefore, it is required to understand the working mechanism of TED-PAs and to optimize their configuration and applied voltage for engineering applications.
Previously, we have numerically investigated the mechanism of TED-PA actuation [41,42,43,44,45]. The TED-PA generates a corona discharge at the DC electrode and barrier discharges at the AC electrode, and the discharges interact with each other. The numerical plasma simulations in the previous studies showed that the volume force around the AC electrode increased when the DC voltage increased in the TED-PA, suggesting that the DC electrode accelerates the plasma around the AC electrode [41]. Furthermore, numerical calculations showed that the electron supply from the barrier discharge at the AC electrode enhanced the corona discharge at the DC electrode [42]. The corona discharge generated continuous body force, contributing to the stronger thrust and higher efficiency of the TED-PA [43].
The objective of this study was to experimentally investigate plasma discharge and jet generation in a TED-PA and to clarify the working mechanism. To isolate the effects of the barrier discharge from the potential variation caused by the application of the AC voltage, we compared a corona discharge plasma actuator (CD-PA) with a TED-PA. As shown in Figure 3, a CD-PA consists of two facing electrodes. A high DC voltage is applied to one electrode, and the other electrode is typically grounded. When the electrodes are plates, corona discharges occur at both electrodes, inducing a deflected jet as in the TED-PA. In this study, an AC voltage was applied to the electrode opposite the DC electrode for comparison with the TED-PA. In the experiments, discharge photographs were taken to investigate the discharge conditions, the thrusts of the induced jet were measured, and flow velocity distributions were obtained using the PIV (particle image velocimetry) method.

2. Materials and Methods

2.1. Setups for Discharge Photograph Imaging and Method for Discharge Strength Calculation

A discharge photograph was taken to investigate the form of the discharge and evaluate the discharge strength. As shown in Figure 4, the photograph was taken from the top of the actuator using a single-lens reflex camera (Nikon, Tokyo, Japan, D3200) with a 105 mm-focal-length lens (Nikon, Tokyo, Japan, AI Micro-Nikkor 105 mm f/2.8S). The imaging conditions were as follows: exposure time of 6 s, ISO 100, and f-number 2.8, and the distance from the camera to the plasma actuator was about 450 mm. The size of the photograph was 6016 × 4000 pixels, and the resolution was about 0.01 mm per pixel.
The photoemission strength was calculated from the sum of the luminance of the discharge photograph to quantitively evaluate the strength of the discharge. We converted the discharge photo to 256 step grayscale, and the step value in grayscale was defined as the luminance value at each pixel. The luminance l ranged from 0 to 255. Defining the DC and AC discharge regions separated by the center line, as shown in Figure 5, the averaged photoemission strength P of each electrode can be obtained as
P = 1 S S l .
where S is half the area between the AC and DC electrodes.

2.2. Setups for Thrust Measurements

The thrust was measured using an electrical scale (SHIMADZU, Kyoto, Japan, UW620H) to evaluate the total force induced by the actuator. As shown in Figure 6, the horizontal and vertical thrusts were measured separately. In the horizontal thrust measurement, the plasma actuators were placed so that the DC electrode was at the lower position, and the force from the DC electrode was measured as positive thrust. To prevent electromagnetic noise, the actuators were mounted on a wooden stand about 1 m in height, and the measurement was conducted in the center of a 1.0 × 1.5 m space surrounded by a blackout curtain. Briefly, the maximum capacity of the electrical scale is 620 g, the minimum weight is 0.001 g, the repeatability is 0.001 g, and the linearity is 0.002 g. The time resolution of the measurement was about 0.4 s, and the thrust was obtained from the time-averaged data for more than 120 s.

2.3. Setups for Flow Field Measurement and Method for Calculating the Body Force

The flow velocity field of the jet induced by the actuator was measured using a PIV system. As shown in Figure 7a,b, the velocity was measured from the side of the actuator. The actuation was conducted in a φ600 × 1000 mm chamber to fill up the tracer particles. The laser was a double-pulse Nd-YAG laser (Litron Lasers, Rugby, UK, Nano S 30-15 PIV; wavelength of 532 nm), the camera was an sCMOS camera (Andor, Belfast, UK, Neo 5.5), and the tracer particle was incense smoke. The lens (Nikon, Tokyo, Japan, AI Micro-Nikkor 105 mm f/2.8S) was attached to the camera, and a bandpass filter (central wavelength of 532 nm, the same as the wavelength of the laser; blocking tendency of 400–900 nm) was attached to the lens to remove the spectrum caused by the discharge. The size of the image captured by the sCMOS camera was 2560 × 2160 pixels, and the resolution of the velocity field was about 0.23 mm per pixel. To calculate the velocity field from the images, Koncerto II software (SEIKA Digital Image Co., Tokyo, Japan) was used. The window size for the interrogation was 32 × 32 pixels, and 50% of the window size was overlapped. The time resolution of the measurement was 9 Hz, and the velocity field was obtained by averaging 200 images. The velocity vector outliers were removed, and the number of outliers was less than 5% of the total number of vectors.
The body force around the DC and AC electrodes was separately estimated from the velocity field [46]. As shown in Figure 8, the body force F can be estimated from the flow momentum conservation in the inspection area of 2 × 3 mm. Assuming that the pressure gradient was sufficiently small, the length in the span direction was 1 m, the density ρ of the fluid was 1.18 kg/m3, and the viscosity μ was 1.84 Pa·s. The x-direction component of the volume force F x , y-direction component F y , and magnitude value F a were calculated according to the following equations:
F 1 x = ρ u 1 2 d y ,
F 1 y = ρ u 1 v 1 d y ,
F 2 x = ρ u 2 2 d y ,
F 2 y = ρ u 2 v 2 d y ,
F 3 x = ρ u 3 v 3 d x ,
F 3 y = ρ v 3 2 d y ,
F 4 x = μ u 4 y ,
F x = F 1 x + F 2 x + F 3 x + F 4 x ,
F y = F 1 y + F 2 y + F 3 y ,
F a = F x 2 + F y 2 .
The direction of the body force around the AC electrode was defined as opposed to that around the DC electrode, as shown in Figure 8.

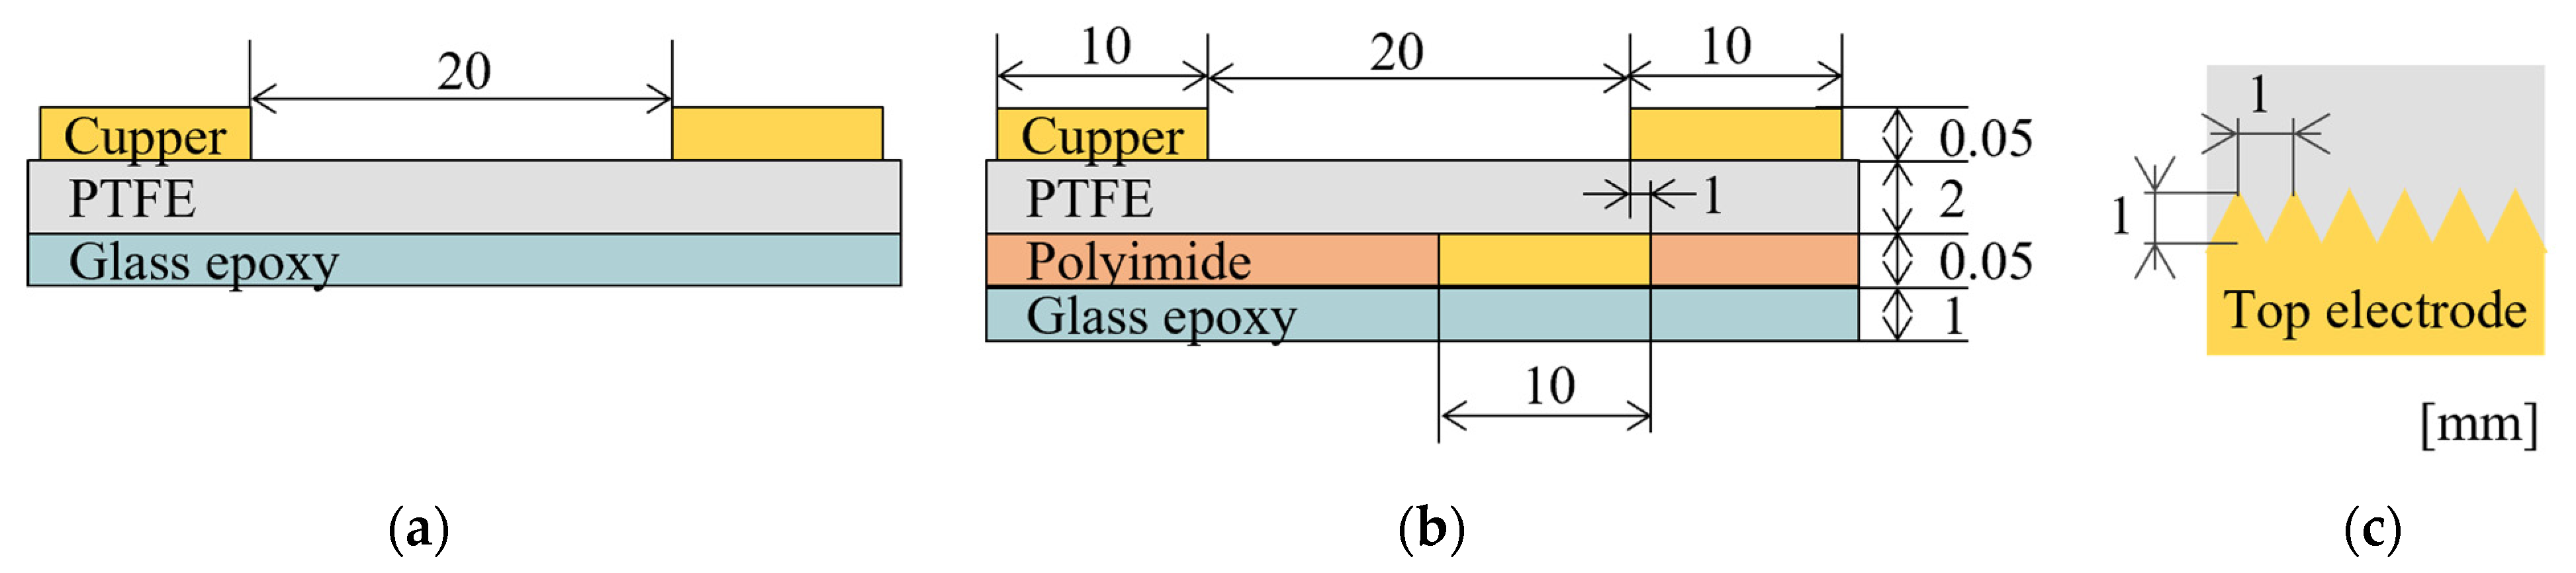
2.4. Configurations for Plasma Actuators and Experimental Conditions

The configurations of the plasma actuators are shown in Figure 9. The CD-PA and TED-PA were made of the same material: the electrode was copper tape, the dielectric was PTFE, and the insulator was polyimide tape. The PA was mounted on a glass epoxy plate to prevent the PTFE from bending. The top electrode edge was cut in a sawtooth shape to ensure the discharge was uniform, as shown in Figure 9c [28,47,48], and the overlap between the vertex of the sawtooth of the top electrode and the bottom electrode was 1 mm in the case of the TED-PA. A conventional TED-PA usually has a wide ground electrode covering the whole gap between the two top electrodes; however, our previous numerical survey showed that the electrostatic surface charge from the bottom ground electrode near the DC electrode disturbed the jet generation from the DC electrode [44]. Therefore, in this study, the bottom electrode of the TED-PA was installed only near to the AC electrode to evaluate the effect of the discharge at the AC electrode on the discharge at the DC electrode by comparing it to the CD-PA which does not have a bottom electrode. With this configuration, it was expected that the discharge around the DC electrode would not be affected by the ground electrode, and that only the effect of the barrier discharge at the AC electrode could be investigated.
The high DC voltage was supplied by an amplifier (Advanced Energy, Denver, CO, USA, Trek 20/20C-HS) by amplifying the voltage from the controller, which consisted of a battery and a variable resistor, and the applied voltage was monitored with an oscilloscope (Teledyne LeCroy, Chestnut Ridge, NY, USA, HDO4034) using a high-voltage probe (Tektronix, Beaverton, OR, USA, P6015A). The high AC voltage was supplied by an amplifier (Advanced Energy, Denver, CO, USA, Trek 10/40A-HS) by amplifying the voltage from the function generator (Tektronix, Beaverton, OR, USA, AFG2021), and the applied voltage was monitored with an oscilloscope using a high-voltage probe (IWATSU, Tokyo, Japan, PHV4002-3-RO). The waveform of the AC voltage was sinusoidal, and the amplitude was 10 kVpp. The experiment was conducted by varying the DC voltage and the frequency of the AC voltage.

3. Results and Discussion

3.1. Characteristics of DC Voltage

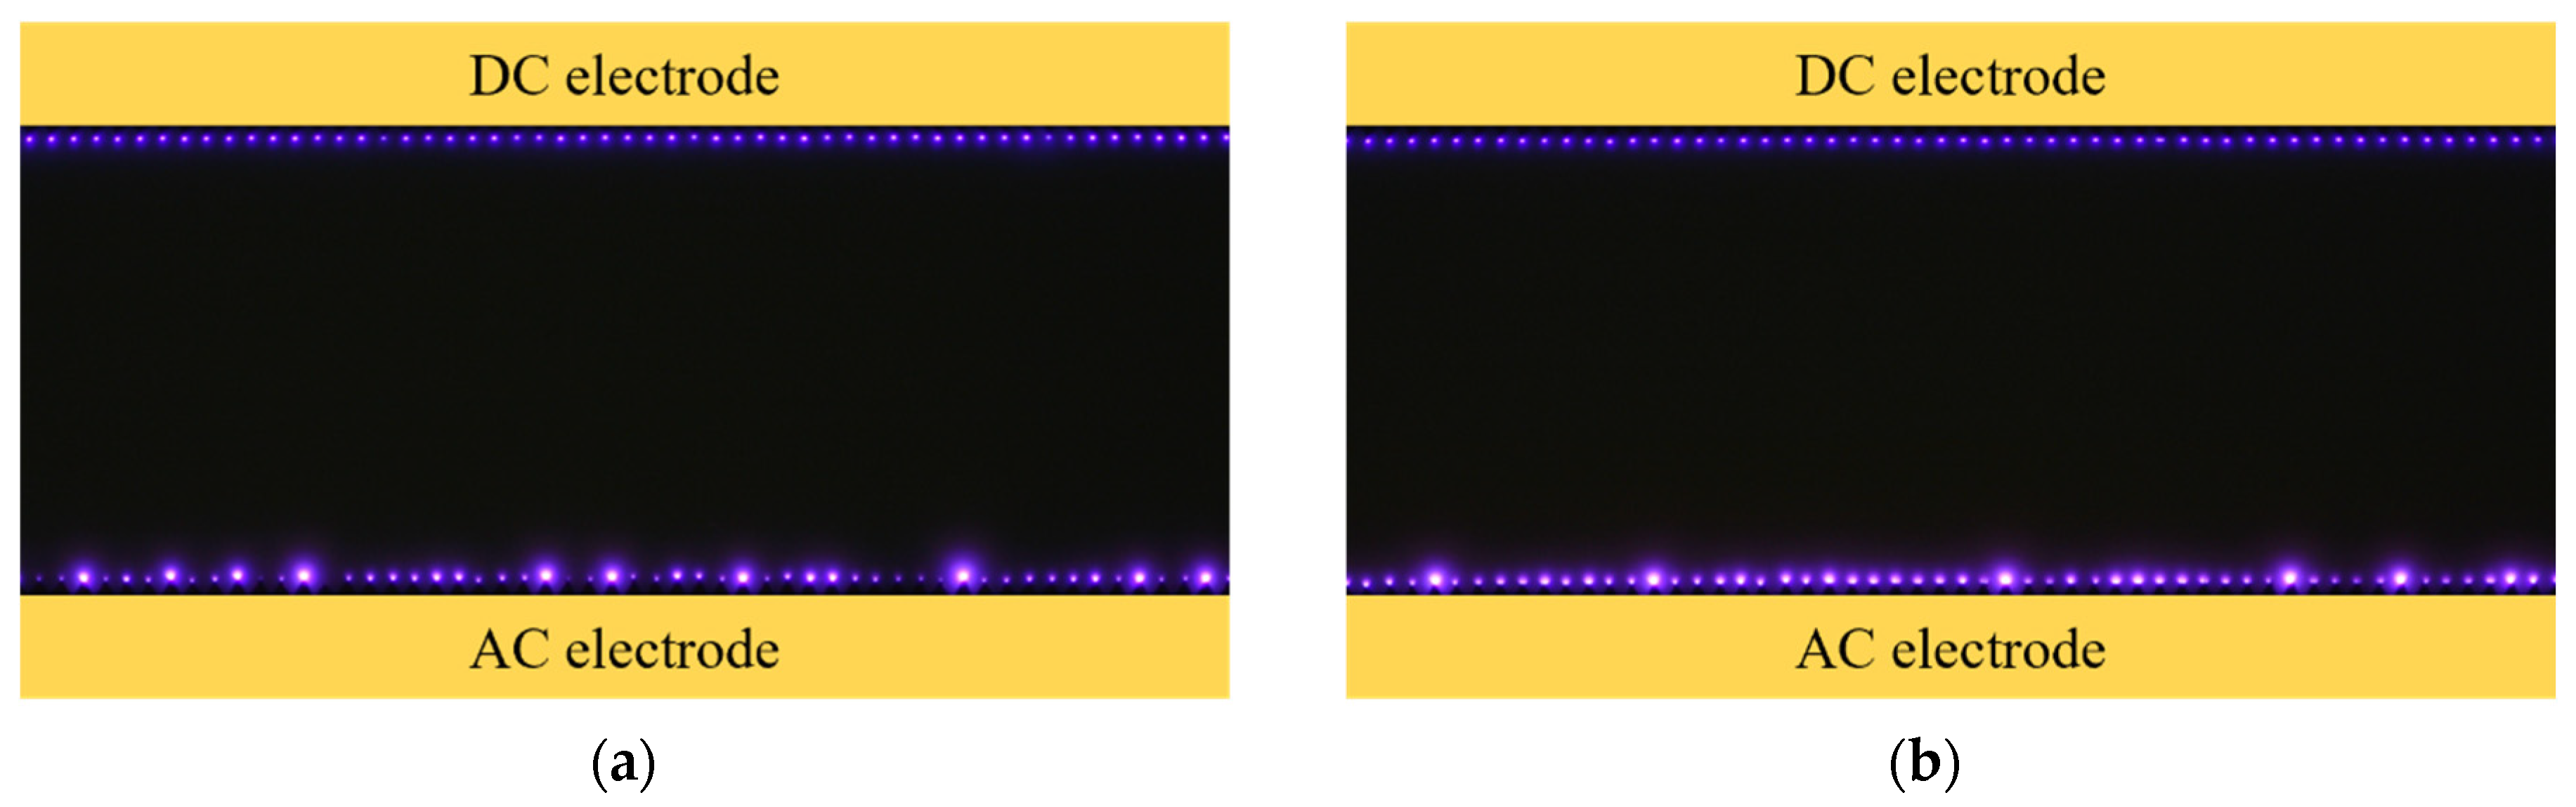
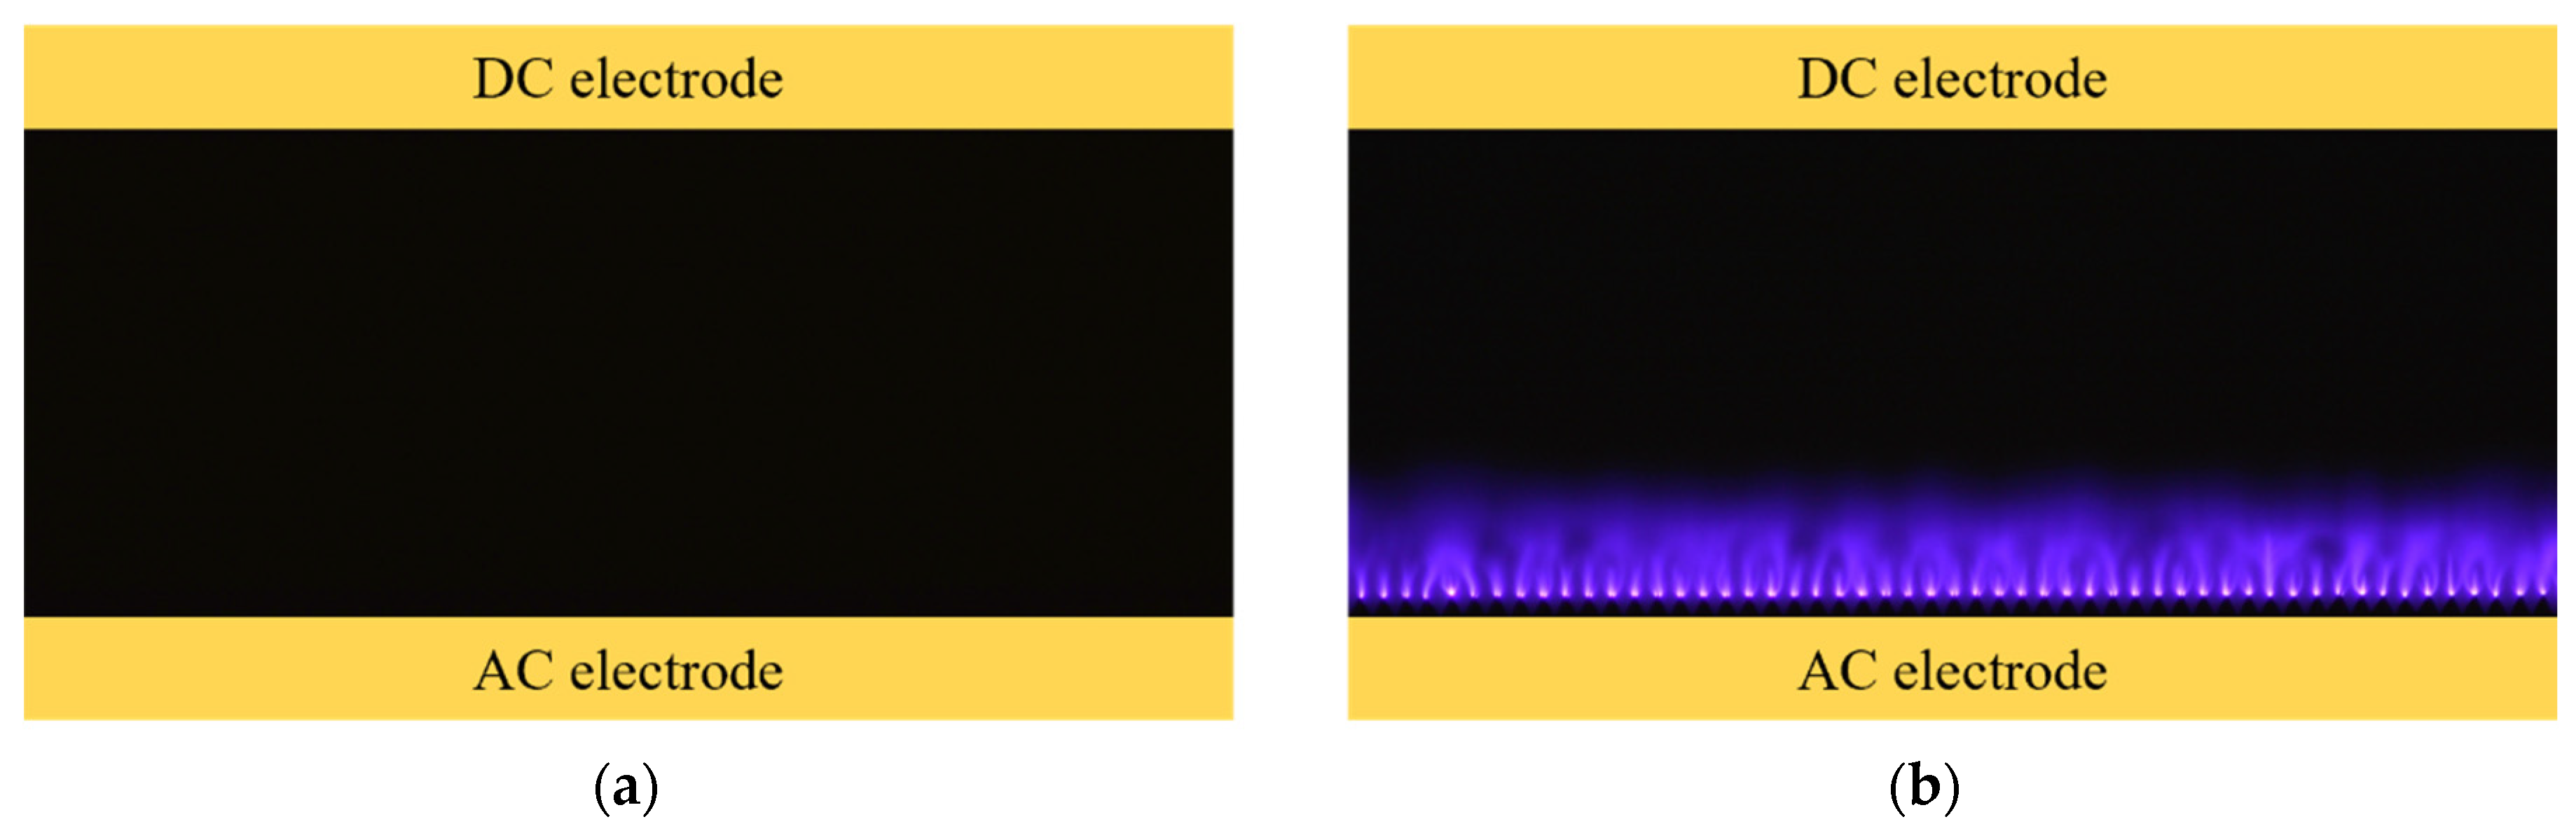
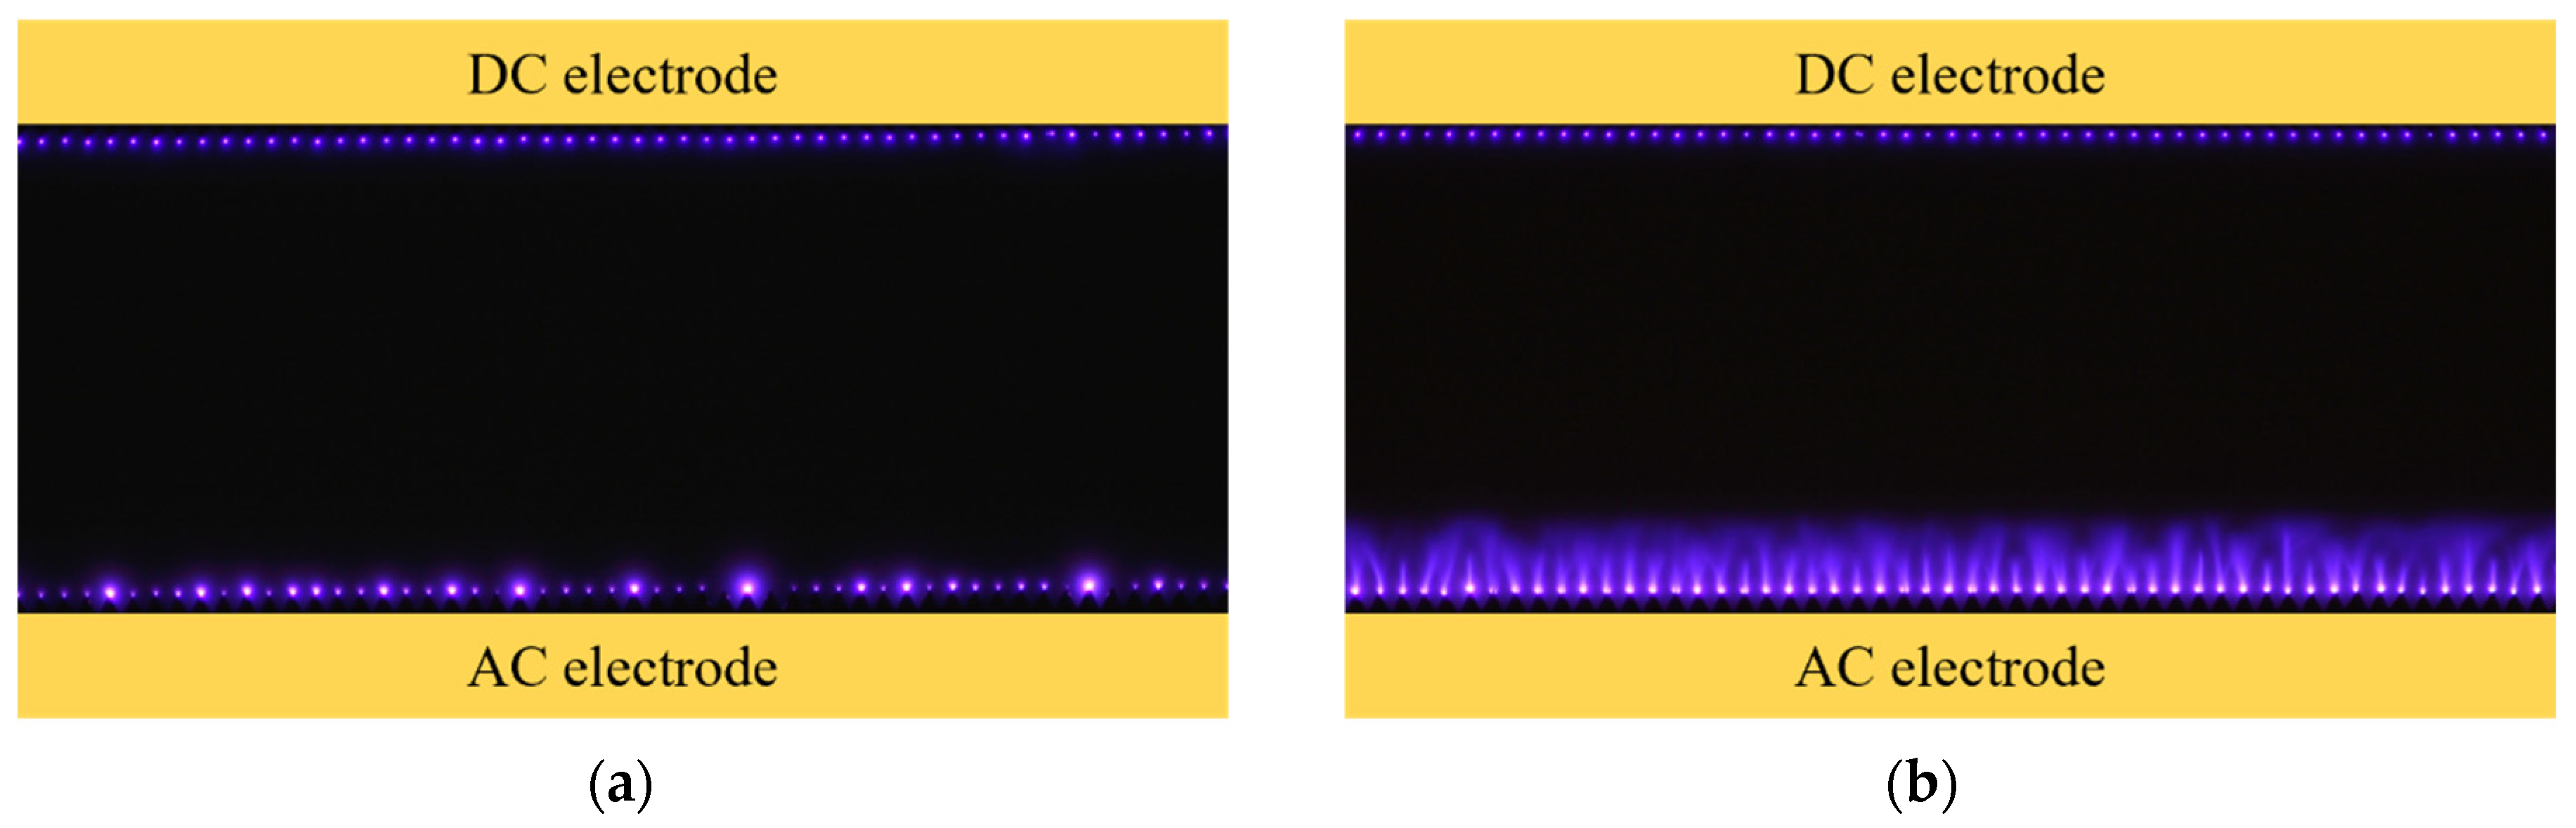
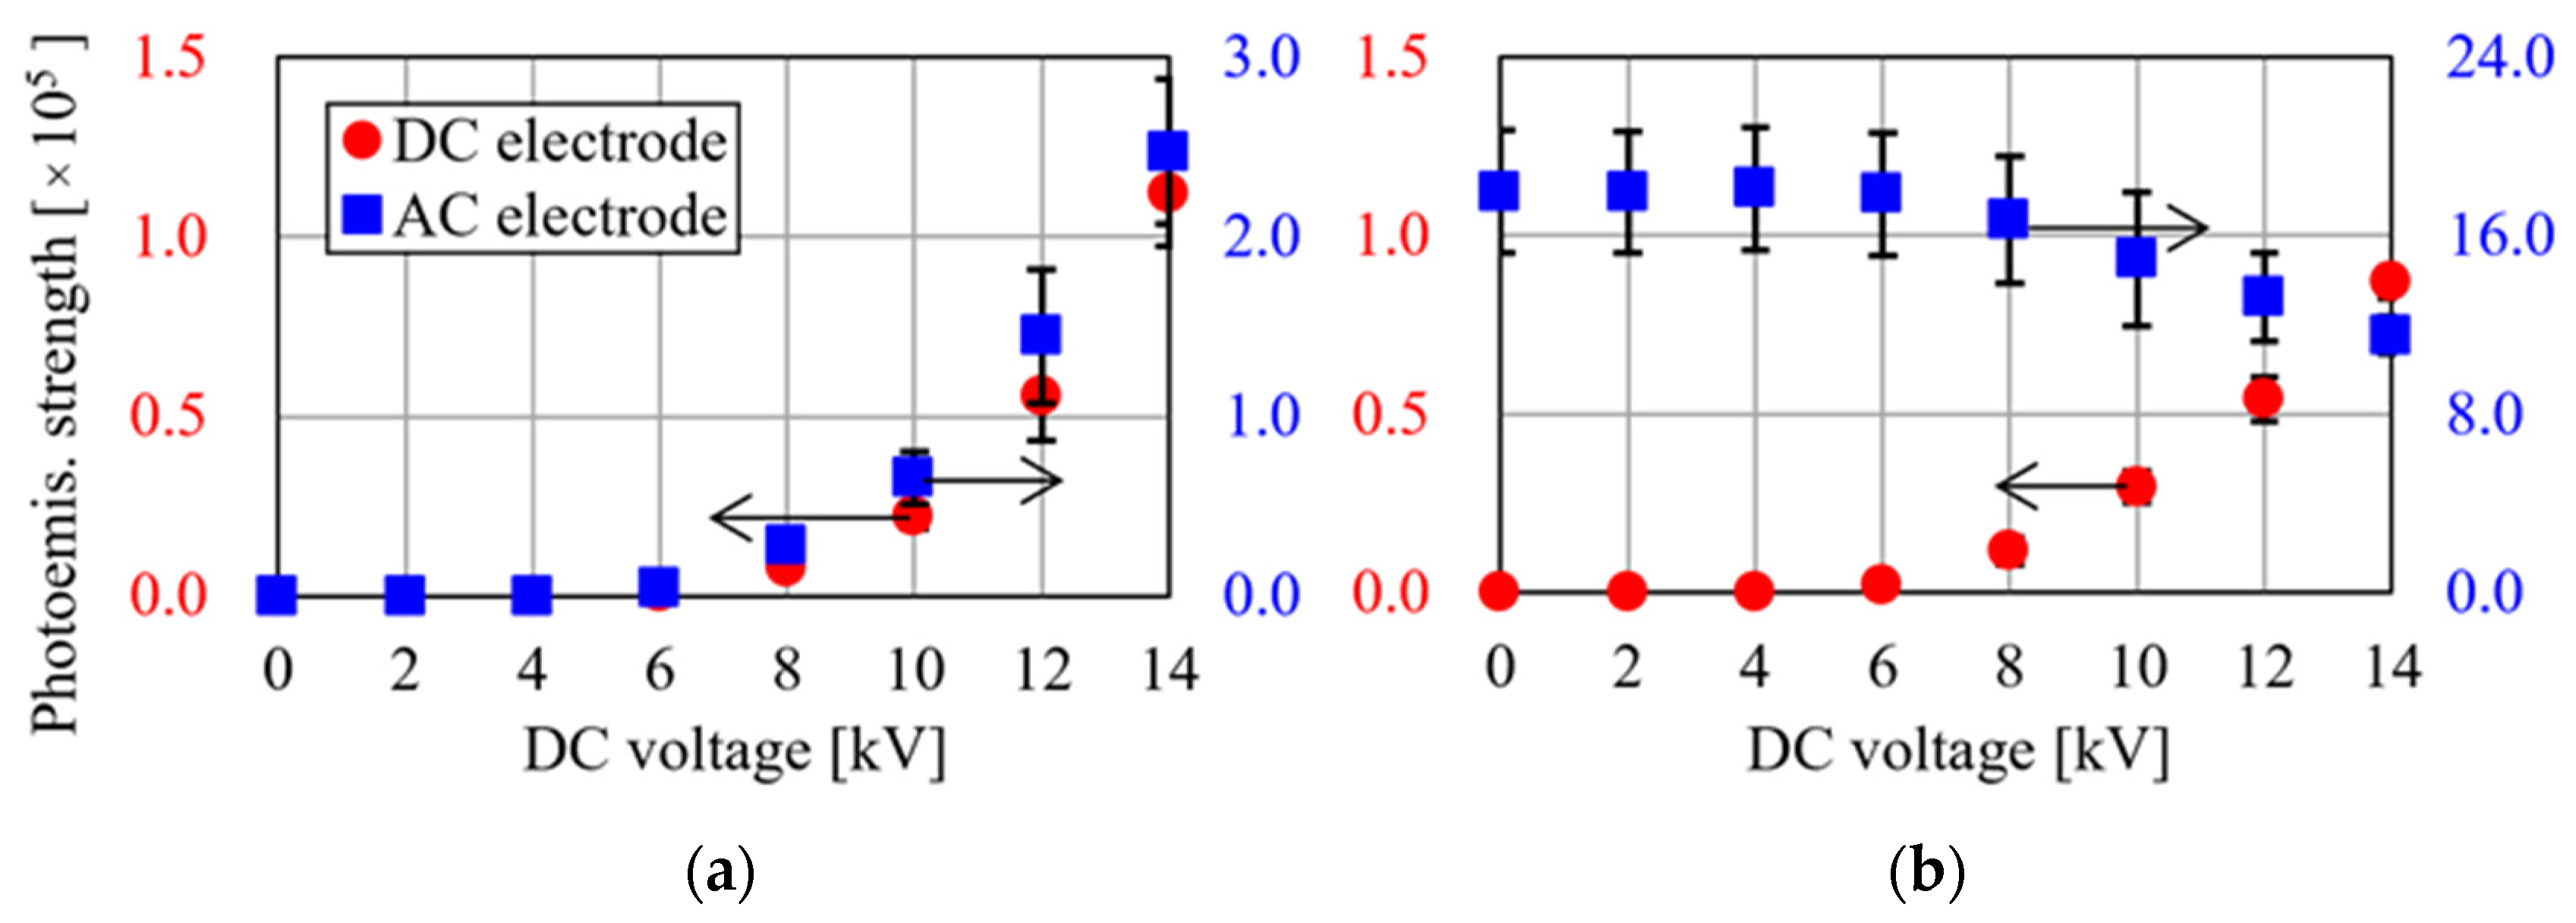
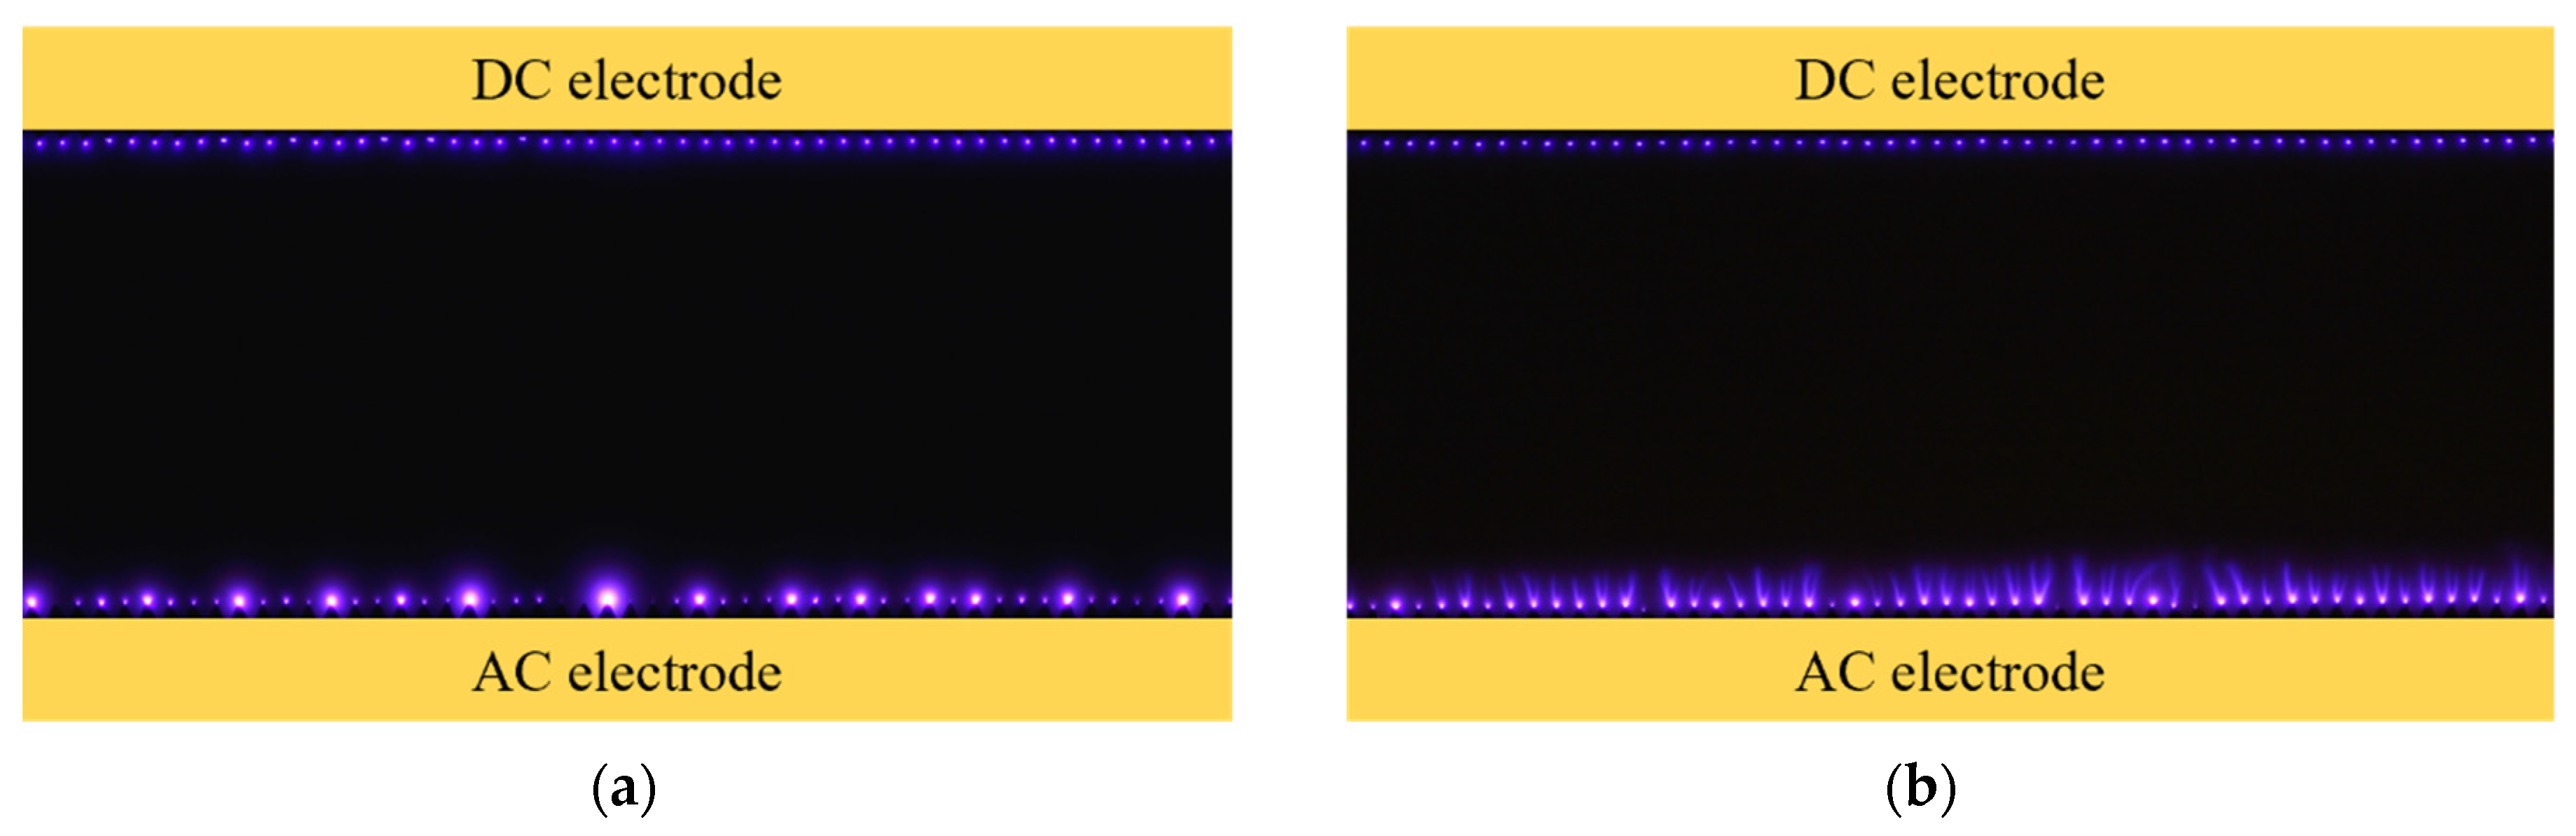
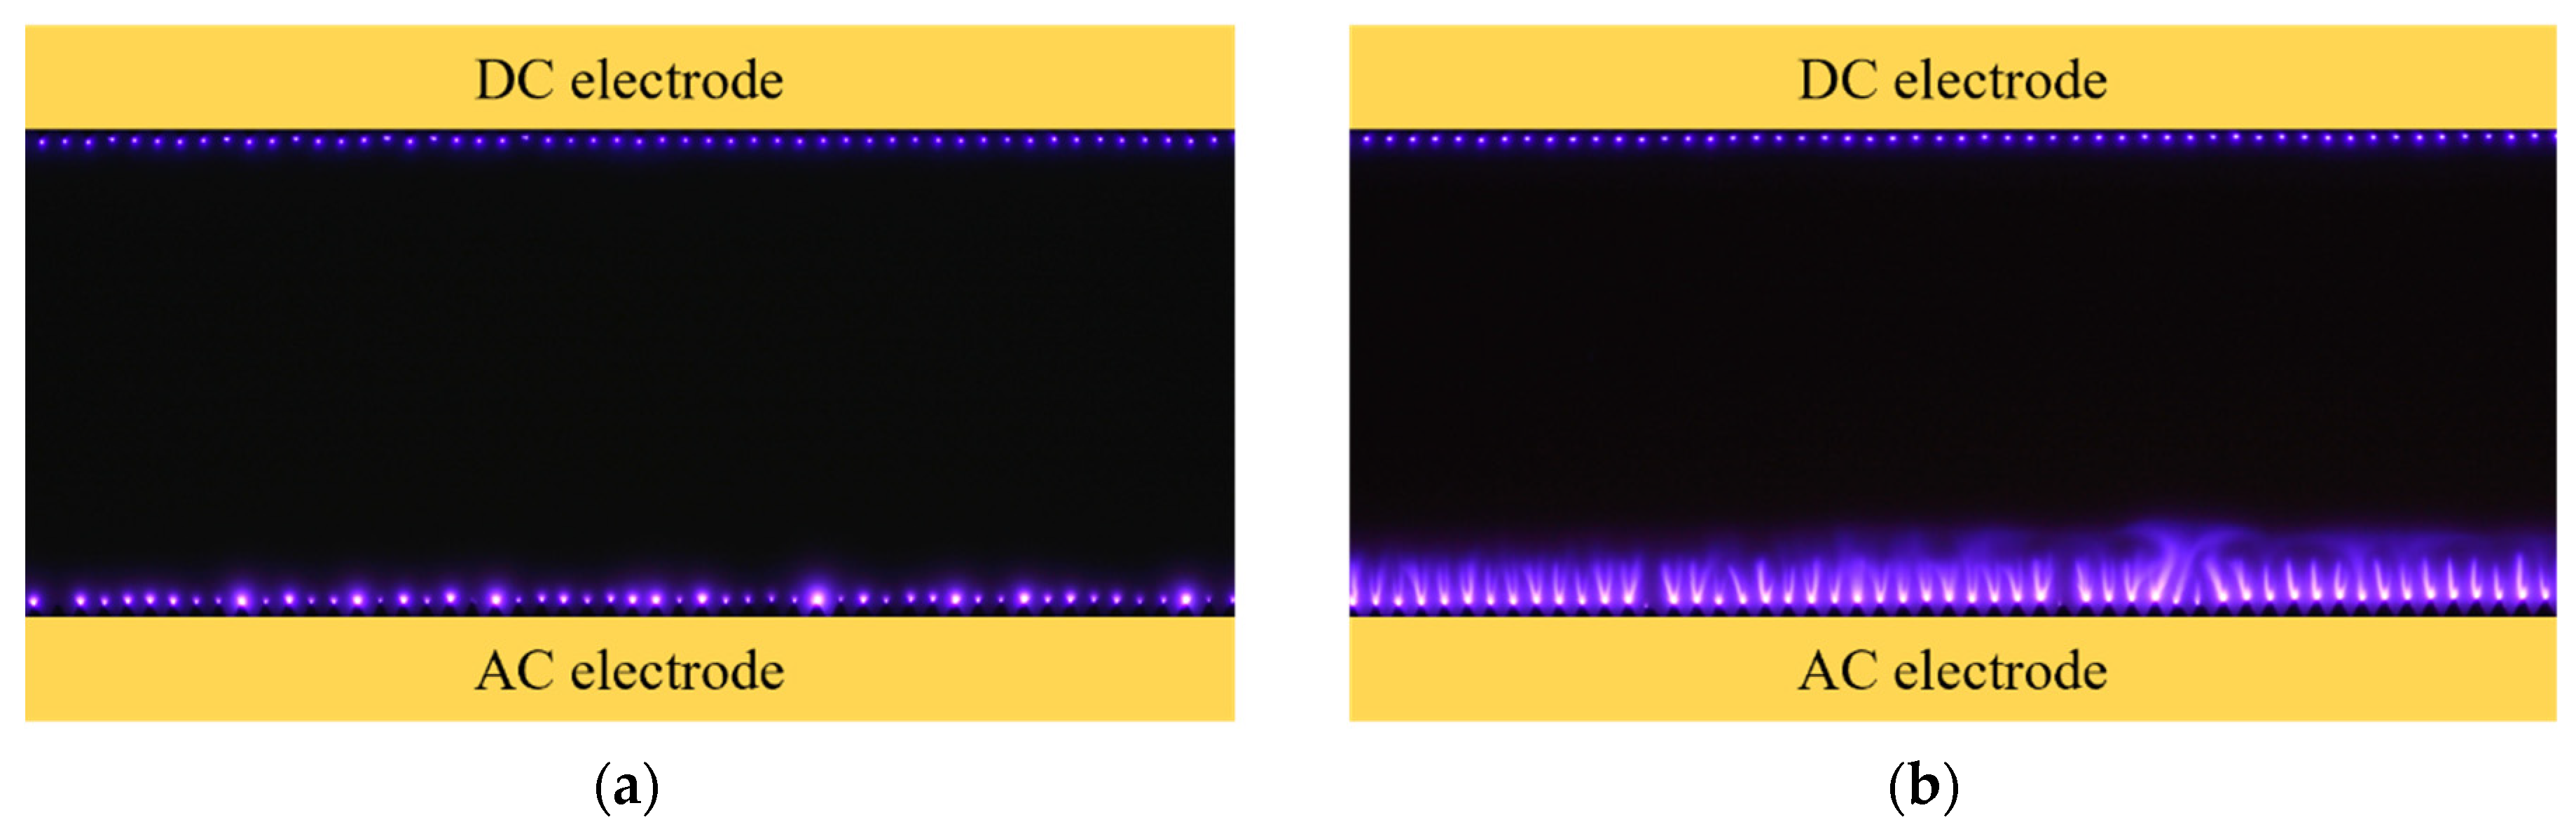
3.1.1. Plasma Discharge

First, we compared the discharge characteristics between the CD-PA and the TED-PA. Figure 10a,b show the discharge photographs of the CD-PA and TED-PA when only the DC voltage was applied and the AC electrode (and ground electrode in the case of the TED-PA) was grounded. In both actuators, a corona discharge occurred at the DC and AC electrodes due to the electric field between the DC and grounded AC electrodes. The variation in the plasma spot sizes may have been due to variations in the sawtooth shape of the electrode caused by the machining accuracy. Figure 11 shows the discharge photographs when only the AC voltage was applied and the DC electrode was grounded. As shown in Figure 11b, in the TED-PA, a barrier discharge occurred at the AC electrode due to the electric field between the AC and ground electrode. The plasma spot sizes were more uniform than those presented in Figure 10b. This is probably because the electric field between the AC electrode and ground electrode in Figure 11b was stronger than that between the DC electrode and grounded AC electrode in Figure 10b. On the other hand, in the CD-PA, a discharge did not occur because there was no ground electrode under the dielectric, and the electric field strength between the AC and grounded DC electrodes was insufficient. Figure 12 shows the discharge photographs when both the DC and AC voltages were applied. As shown in Figure 12a, in the CD-PA, only a corona discharge occurred at the top electrodes. In contrast, in the TED-PA, a corona discharge occurred at the DC electrode, and a barrier discharge occurred at the AC electrode, as shown in Figure 12b. The discharge formed at the AC electrode largely changes depending on the presence or absence of a ground electrode under the dielectric.
Figure 13 shows the DC voltage characteristics of the photoemission strength. Note that at 0 kV in the graph, the DC electrode is grounded. In the case of the CD-PA, the discharge at both the DC and AC electrodes became stronger at a higher DC voltage, as shown in Figure 13a. The DC voltage of the discharge ignition was 8 kV, and it was higher than the AC voltage amplitude (5 kVp), meaning the DC electrode was the anode. The discharge became stronger as the DC voltage increased because the electric field between the DC and AC electrodes became stronger. The photoemission strength of the AC electrode was higher than that of the DC electrode because of the difference in discharge polarity. As shown in Figure 13b, in the TED-PA, the discharge at the DC electrode became stronger at a higher DC voltage, as was the case in the CD-PA. In contrast, the discharge at the AC electrode became weaker when the DC voltage increased. The extension length of the barrier discharge at the DC voltage of 14 kV shown in Figure 12b became shorter than that at the DC voltage of 0 V shown in Figure 11b, and the shorter extension length led to a weaker photoemission strength. This is because when the DC voltage is much higher than the AC voltage amplitude, the electric field strength between the DC and AC electrodes becomes stronger, and the line of electric force is directed rather from the AC electrode to the DC electrode than from the ground electrode.

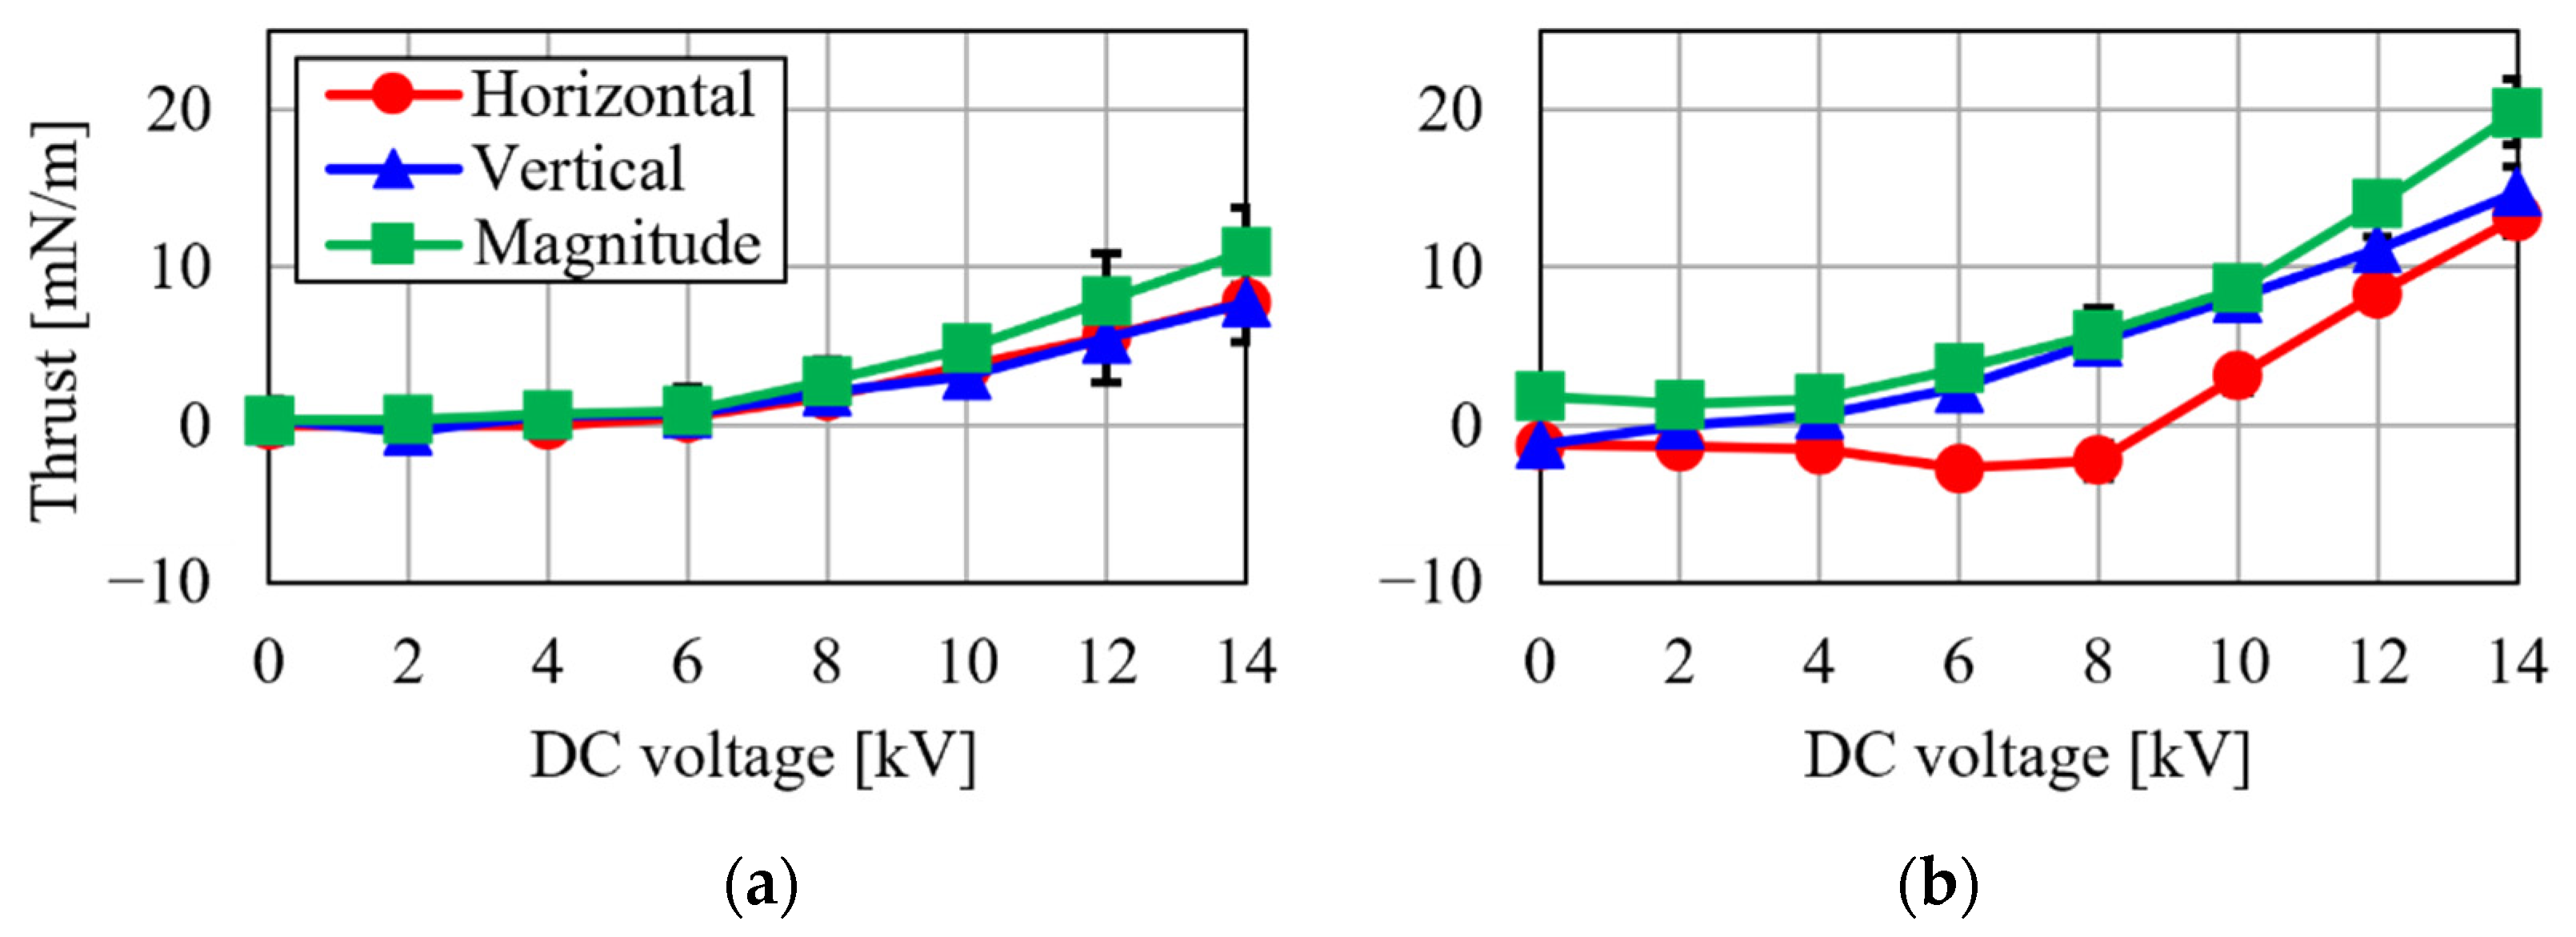
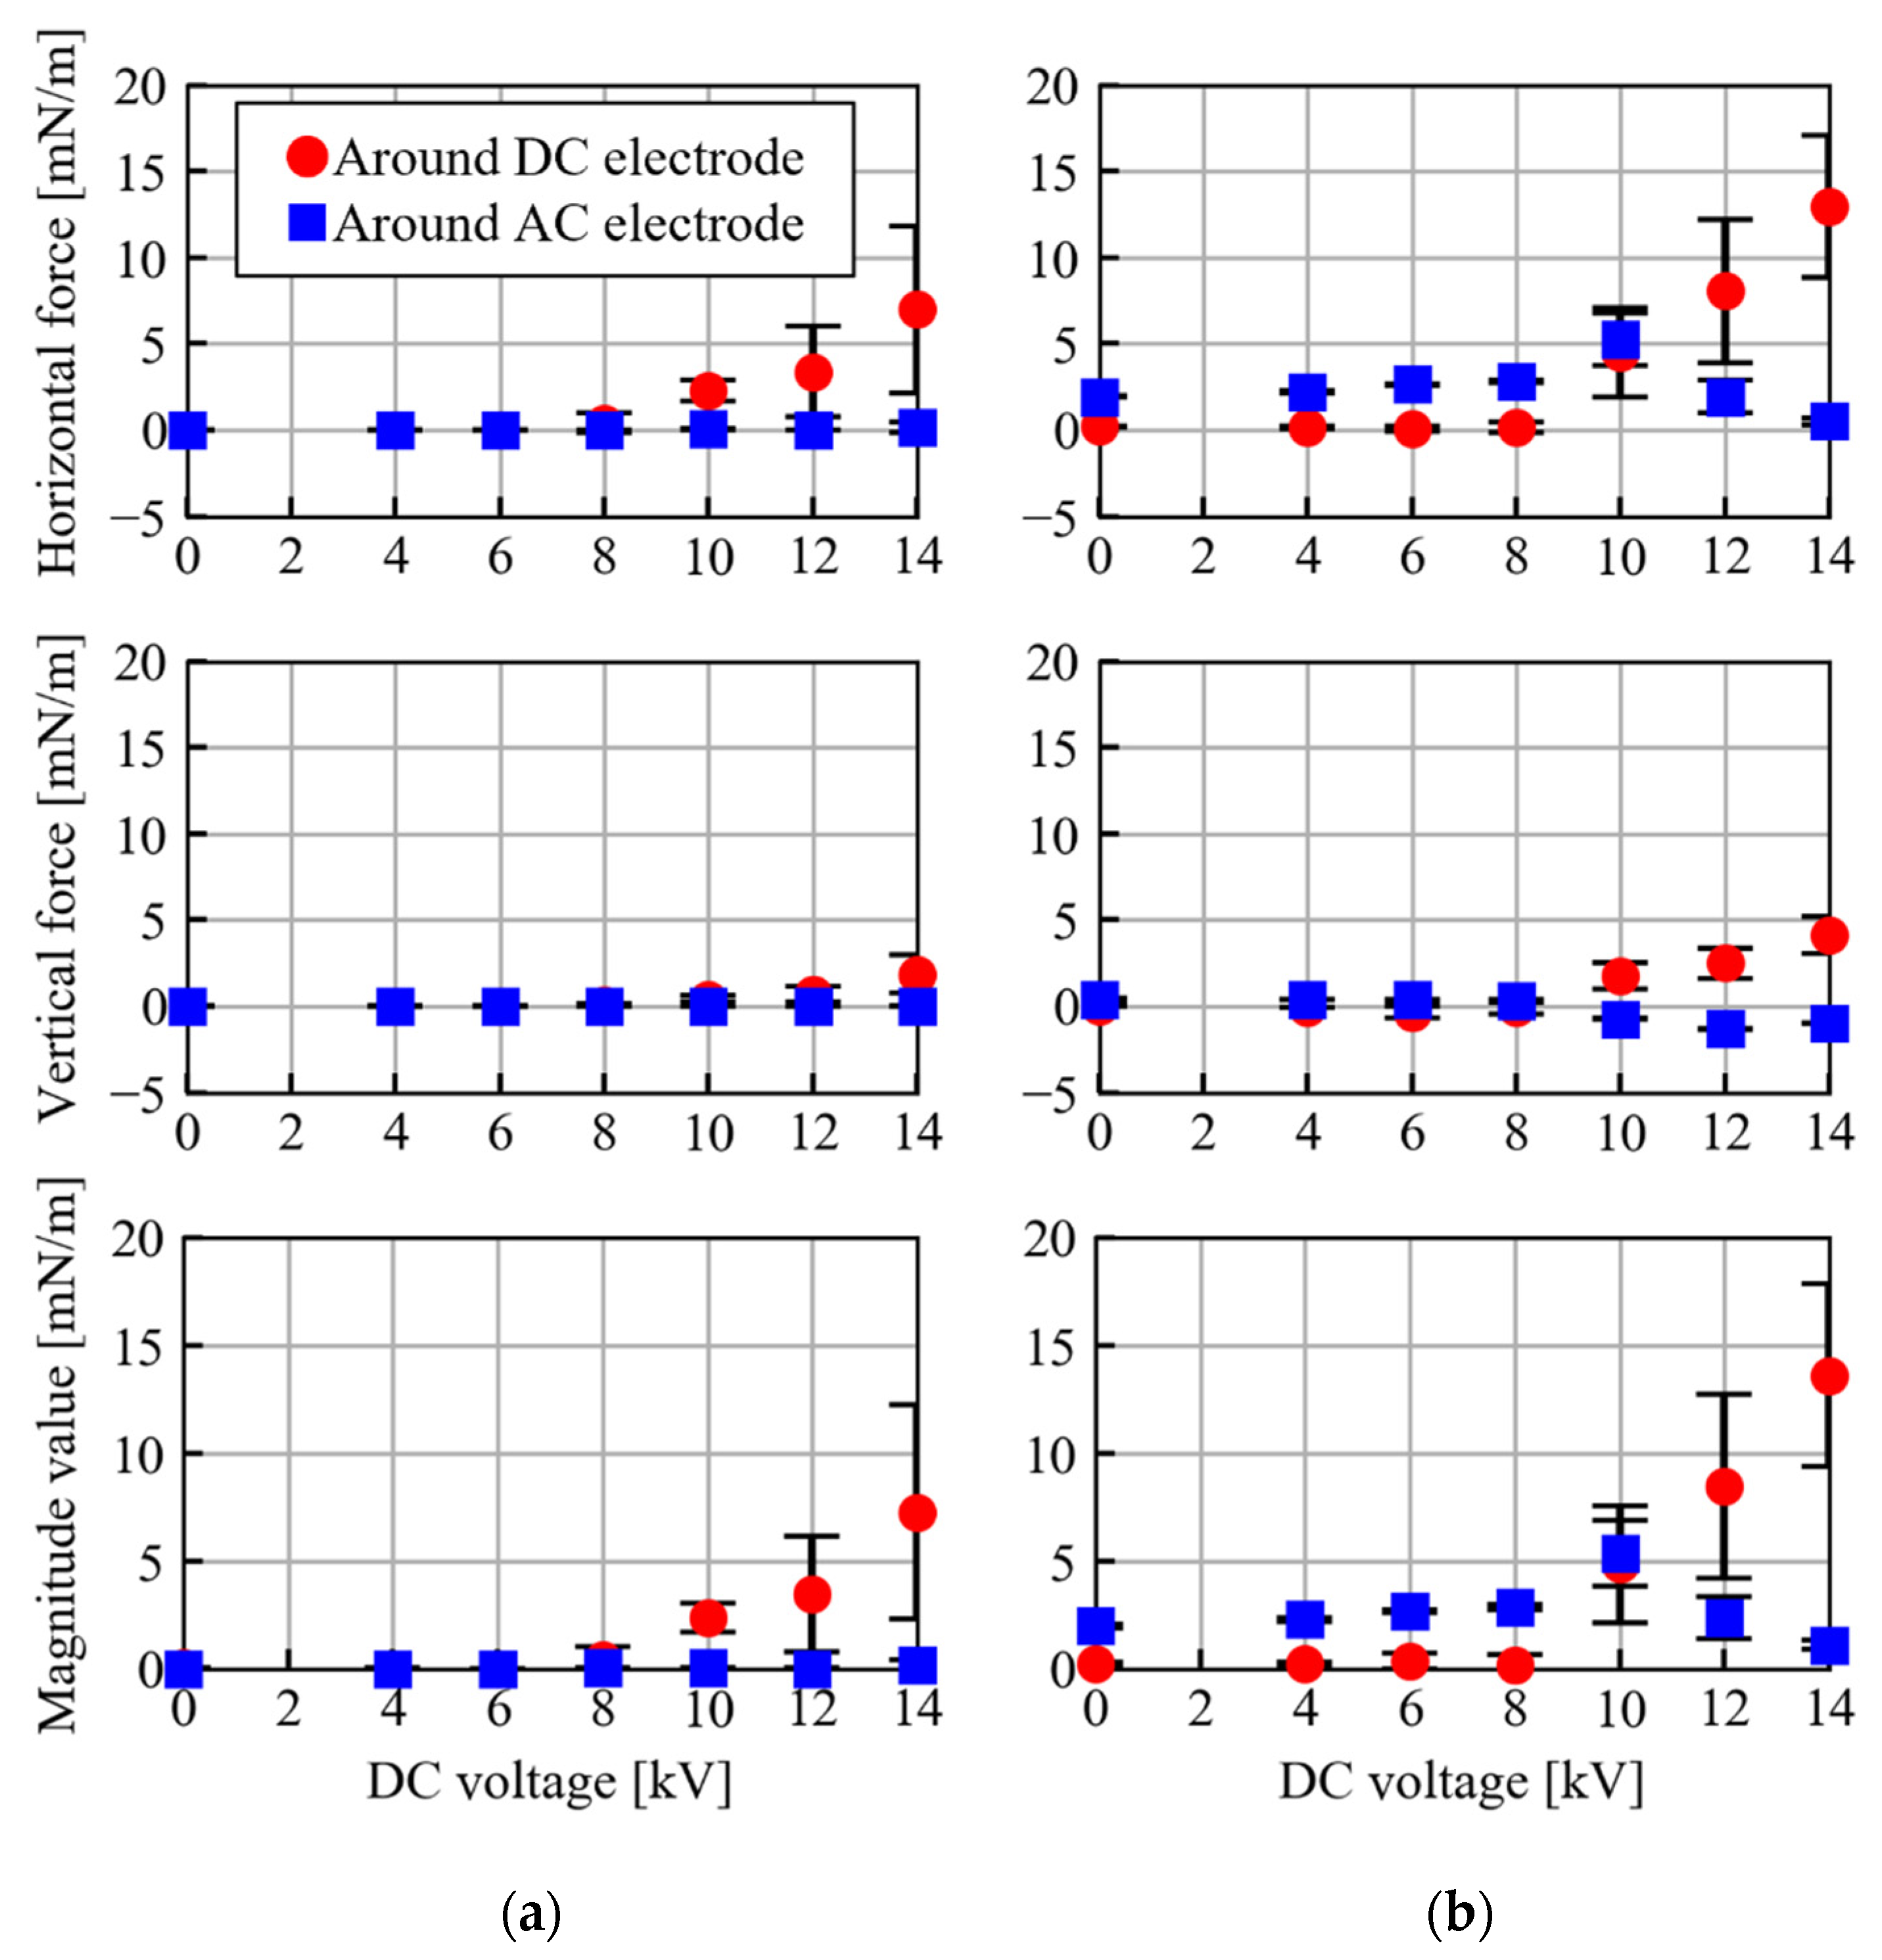
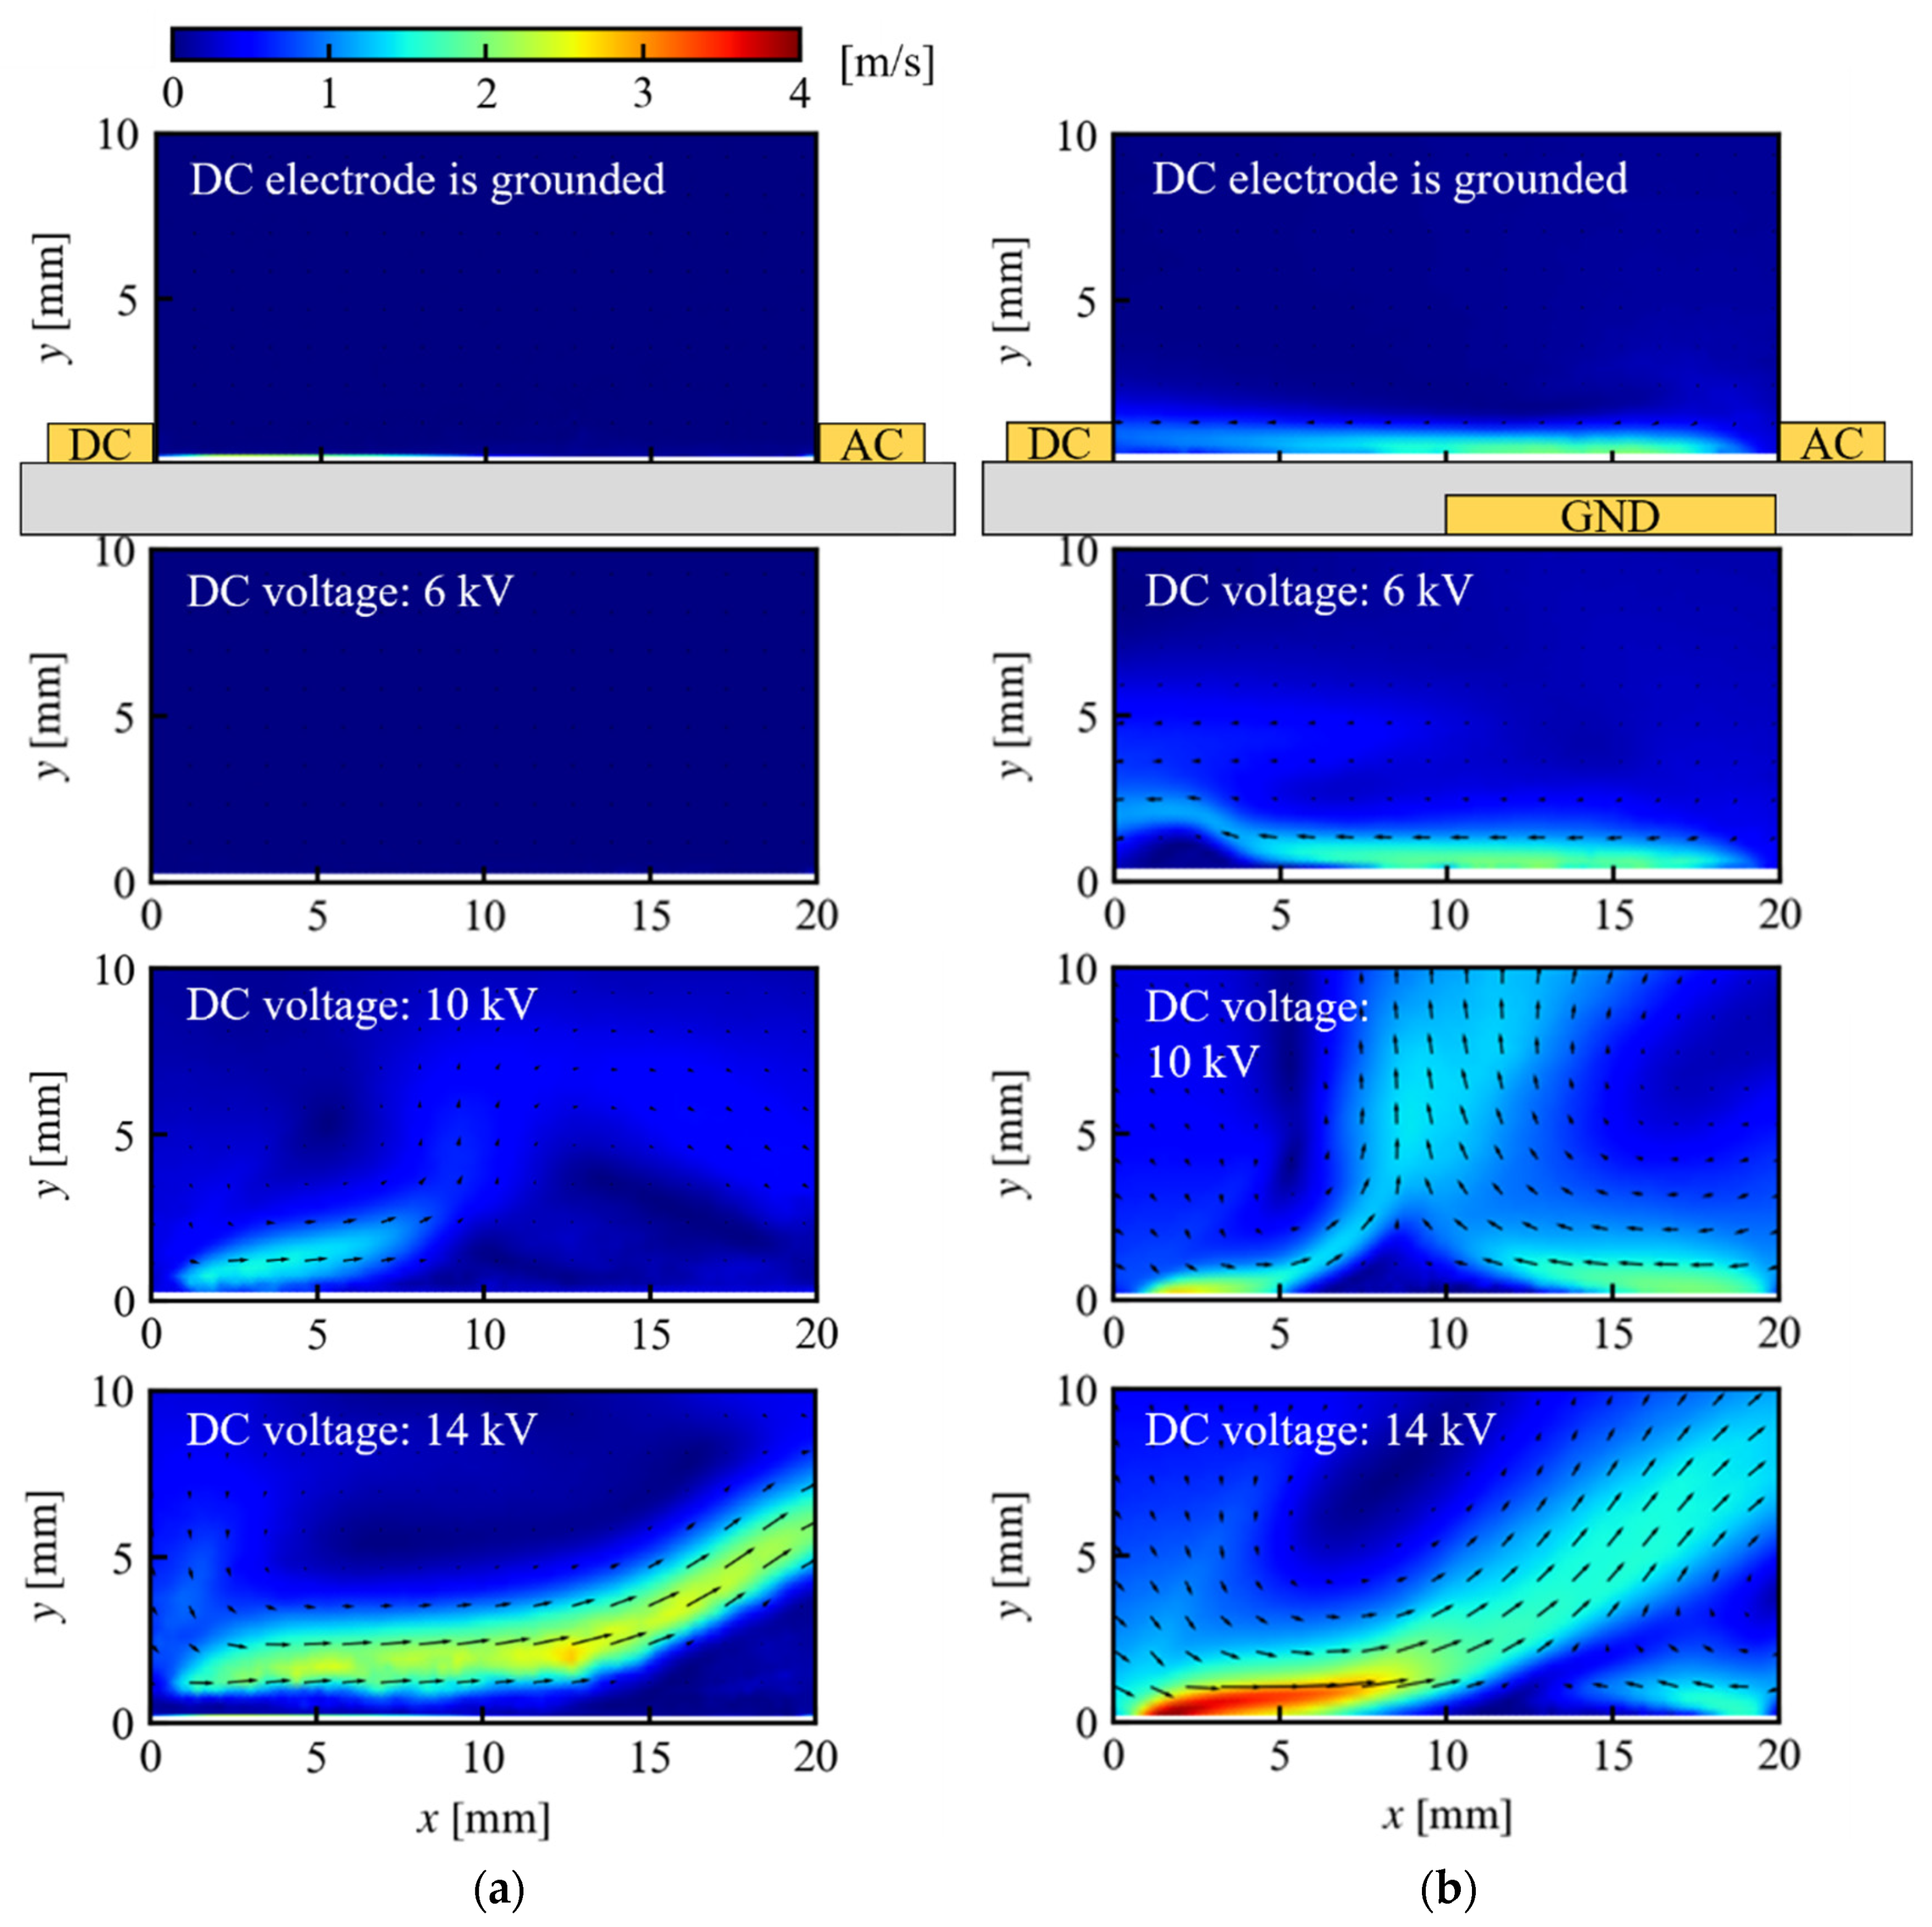
3.1.2. Thrust, Flow Velocity Field, and Body Force

Figure 14 and Figure 15 show the DC voltage characteristics of the thrust and the flow velocity field. In Figure 14, the jet from the DC to the AC electrode leads to positive horizontal thrust, and the absolute thrust is calculated from the horizontal and vertical thrusts. In Figure 15, the left end of the velocity field is the edge of the DC electrode, and the right end is the edge of the AC electrode. As shown in Figure 14a, in the CD-PA, the horizontal and vertical thrusts increased with the DC voltage. The jet was induced from both the DC and AC electrodes, and the jet from the DC discharge was stronger than that from the AC discharge, as shown in Figure 15a. This is because positive ions are more likely to be generated than negative ions in the air [49,50,51]. In the TED-PA, as shown in Figure 14b, the horizontal thrust was negative when the DC voltage was 8 kV or lower; therefore, in this range, the jet from the barrier discharge at the AC electrode was stronger than that from the DC electrode. This result is consistent with the flow field, as shown in Figure 15b. Moreover, the negative horizontal thrust amplitude became larger in the range of 4 kV to 6 kV, indicating the additional acceleration of negative ions from the barrier discharge by the DC voltage. The DC voltage contributed to plasma acceleration from the barrier discharge, and a stronger jet from the AC electrode was induced compared to the case of 0 kV (where the DC electrode was grounded). However, the vertical thrust increased from 6 kV, and the horizontal thrust became positive at 10 kV. As shown in Figure 15b, the jet from the DC electrode started to be generated at 6 kV. At 14 kV, the jet from the DC electrode was much stronger than the jet from the barrier discharge at the AC electrode. Comparing Figure 14a,b, the absolute thrust of the TED-PA at 14 kV was about double that of the CD-PA despite the same voltage being applied, and both the horizontal and vertical thrusts were stronger than those of the CD-PA. Hence, in the TED-PA, it can be considered that the interaction of the discharge between the AC and DC electrodes produces a stronger jet.
Figure 16 shows the body force estimated from the flow velocity field. Note that the body force became positive when it was directed towards the opposite electrode, as shown in Figure 8. As shown in Figure 16a, in the CD-PA, the vertical body force around the DC electrode was clearly smaller than the horizontal force, and the body force increased with the DC voltage. This result is consistent with the thrust measurement results. Around the AC electrode, Figure 16a shows that body force was not generated; however, the jet was vertically deflected around the AC electrode, as shown in Figure 15a, and the vertical thrust increased with the DC voltage, as shown in Figure 14a. Therefore, although the flow velocity around the AC electrode cannot be captured due to the insufficient flow velocity or particle shedding by the jet from the DC electrode, the body forces generated by the AC electrodes might also increase with the DC voltage. In view of the above, the jets are generated horizontally from the DC and AC electrodes, and vertical thrust is generated by the collision of these jets. Additionally, the increase in both body forces around the DC and AC electrodes indicates that there is a correlation between the photoemission strength and the body force. In the TED-PA, as shown in Figure 16b, the increase in the body force around the DC electrode and the decrease in that around the AC electrode in the voltage range of 10 to 14 kV were correlated with the characteristics of the photoemission strength. However, the temporary increase in the body force around the AC electrode is not explained by the discharge strength. This is because the jet from the AC electrode is accelerated by the electric field due to the DC electrode [41]. This result is consistent with the thrust measurement result.

3.2. Characteristics of the Frequency of the AC Voltage

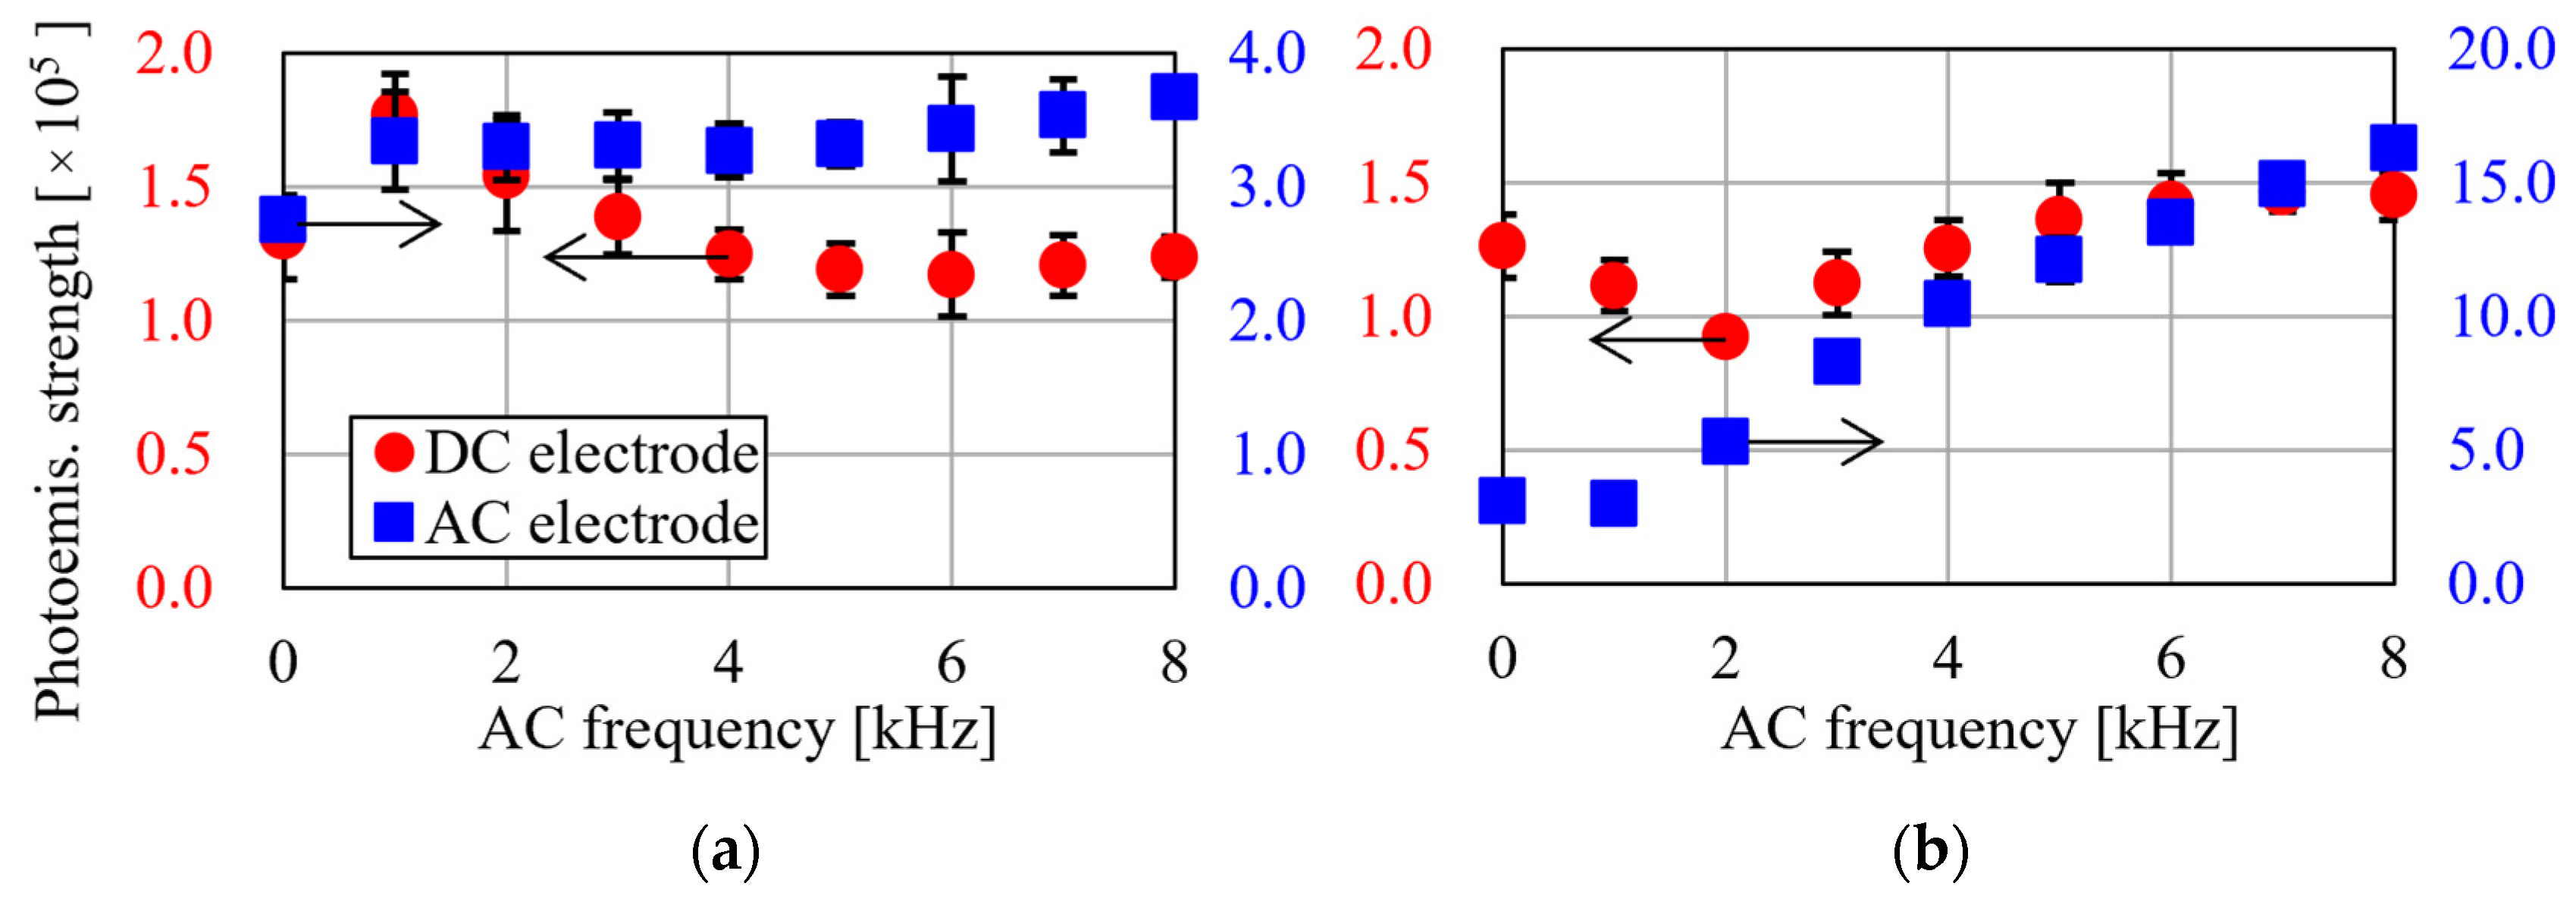
3.2.1. Plasma Discharge

Figure 17 shows the discharge photographs when the frequency of the AC voltage was 2 kHz, and Figure 18 shows them at a frequency of 8 kHz; the other driving parameters are the same. At the AC electrode, in the CD-PA, a corona discharge occurred, as shown in Figure 17a and Figure 18a, and in the TED-PA, a barrier discharge occurred, as shown in Figure 17b and Figure 18b. Comparing Figure 17 and Figure 18, in the CD-PA, the discharge spot at the AC electrode when the frequency was 8 kHz was more uniform and slightly smaller than that when the frequency was 2 kHz. In this case, the maximum amplitude of the AC voltage was 5 kV, and the DC voltage was 14 kV, meaning that the AC electrode was constantly the cathode. Therefore, it is conceivable that the voltage oscillations at the cathode affect the appearance of the discharge, but further investigation is required. On the other hand, in the TED-PA, the streamer of the barrier discharge at the AC electrode was longer and brighter when the frequency was 8 kHz compared to when the frequency was 2 kHz, and this is a well-known feature of barrier discharges due to the increase in the number of discharges.
Figure 19 shows the photoemission strength versus the frequency of the AC voltage. Note that at 0 kHz in the graph, the AC electrode is grounded, as shown in Figure 10. When the AC electrode was grounded, the photoemission strengths of the CD-PA and TED-PA have the same values. As shown in Figure 19a, in the CD-PA, the photoemission strength at both the DC and AC electrodes became stronger as the frequency changed from 0 kHz (grounded) to 1 kHz. This is because the application of the AC voltage increased the maximum electric potential difference between the DC and AC electrodes from 14 kV to 19 kV. The photoemission strength at the AC electrode increased with the frequency and decreased at a frequency higher than 2 kHz at the DC electrode. The increase at the AC electrode was due to the emission area increment coming from the uniformity of the discharge, as shown in Figure 18. The decrease at the DC electrode may have been due to the spots of the discharge becoming smaller, as well as the discharge at the AC electrode. On the other hand, in the case of the TED-PA, the photoemission strength at the DC electrode decreased as the frequency changed from 0 kHz (grounded) to 2 kHz, as shown in Figure 19b, and this is because the dielectric charging over the ground electrode coming from the barrier discharge canceled the electric potential of the AC electrode. However, it increased at a frequency higher than 2 kHz. This is because, as the frequency increases, the barrier discharge becomes more active and the electron supply to the DC electrode from the barrier discharge increases [42]; furthermore, the electron supply effect exceeds the weakening effect by increasing the frequency. In summary, in the CD-PA, the discharge at the DC electrode was stronger at a lower AC frequency, and in the TED-PA, it was stronger at a higher frequency, comparing with the case where the AC electrode was grounded.

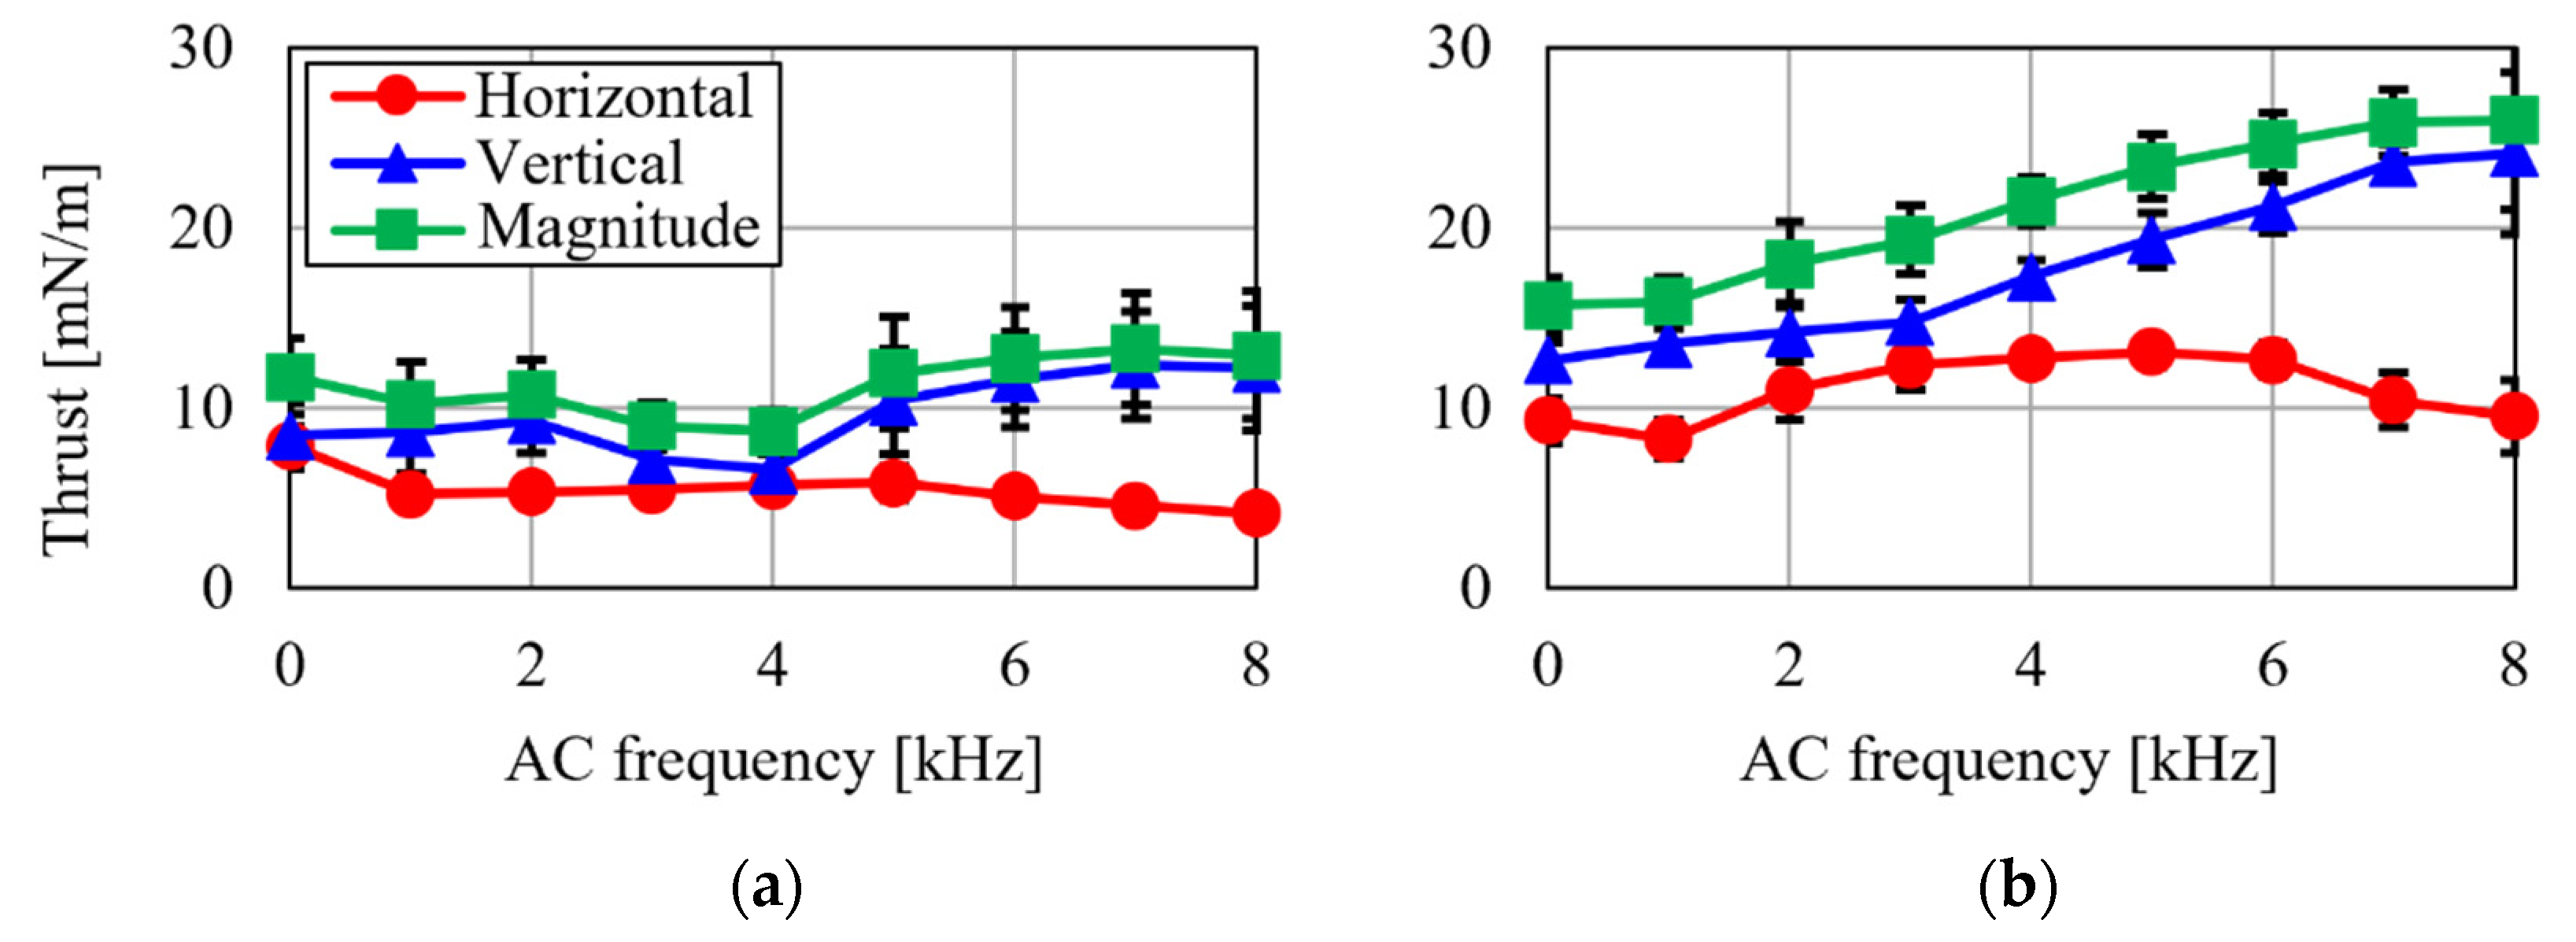
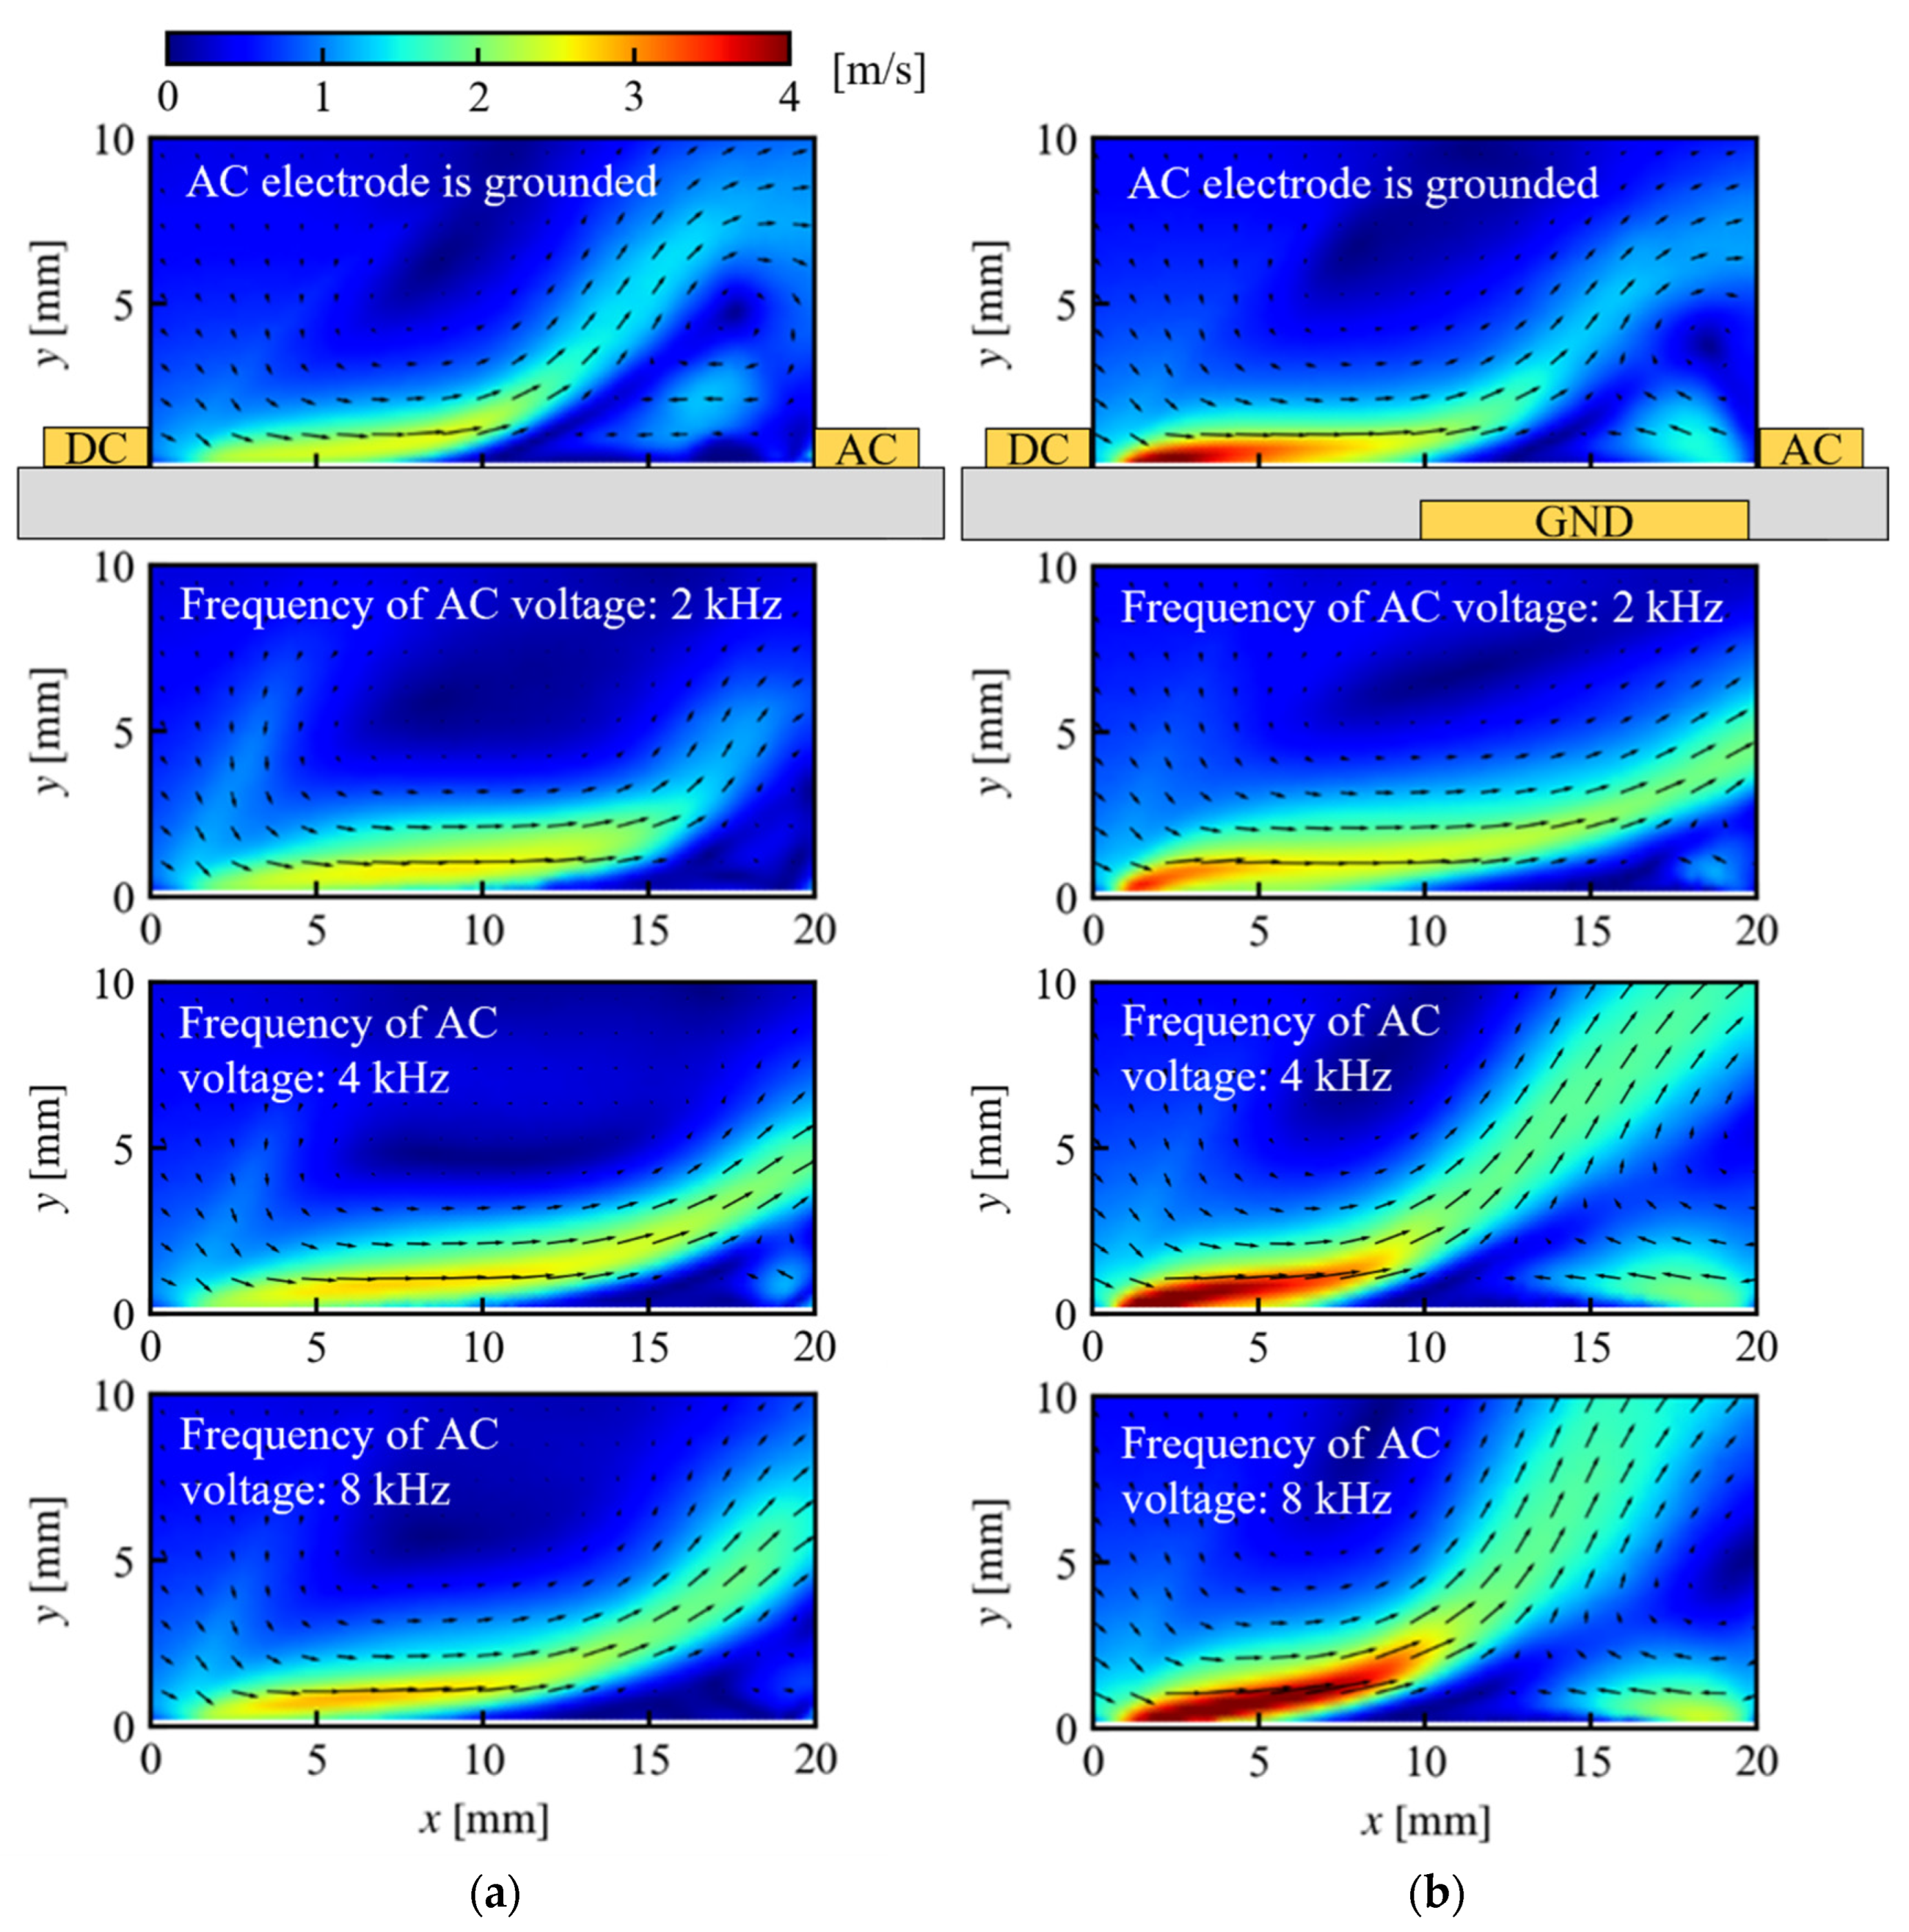
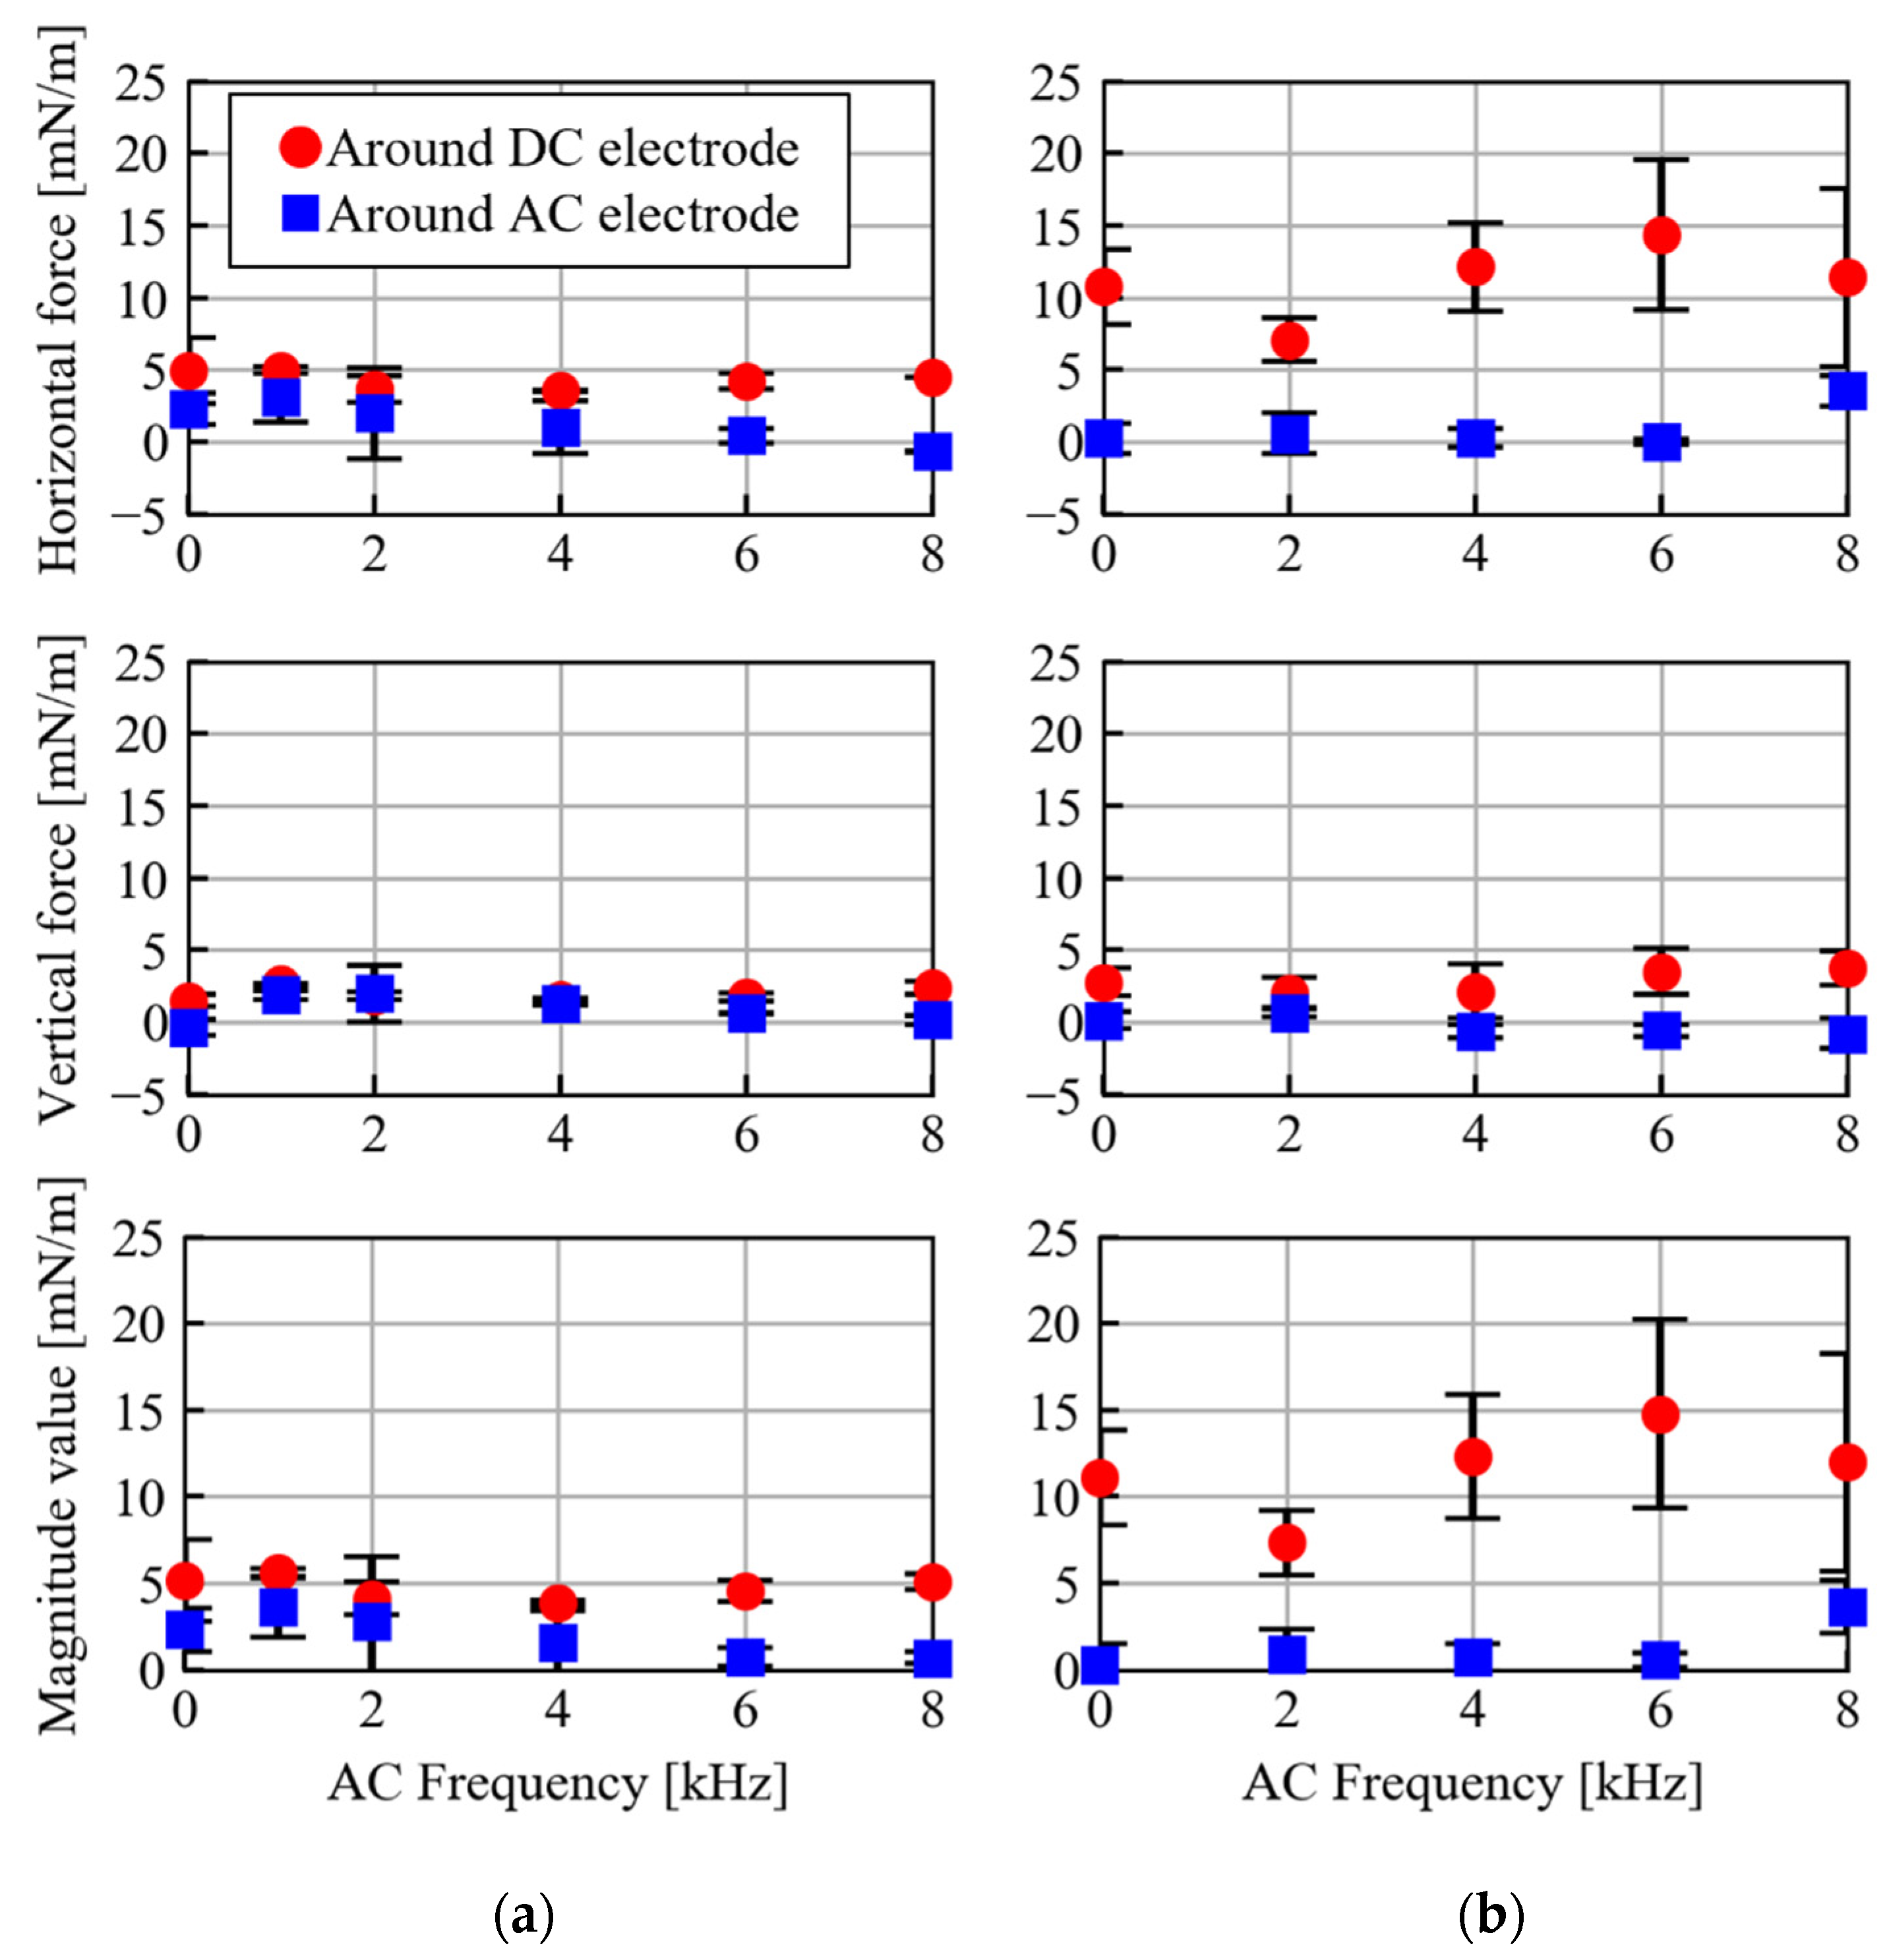
3.2.2. Thrust, Flow Velocity Field, and Body Force

Figure 20 shows the thrust versus the frequency of the AC voltage, and Figure 21 shows the flow velocity field. In Figure 20, the horizontal force directed from the DC to the AC electrode is positive, and the magnitude value of absolute thrust is calculated from the horizontal and vertical thrusts. As shown in Figure 21a, when the frequency was 0 kHz (the AC electrode was grounded) to 2 kHz, the thickness of the jet from the DC electrode became larger. This result correlates with the increase in the photoemission strength, as shown in Figure 19a. In this case, the horizontal thrust shown in Figure 20a decreased because the jet from the AC electrode became stronger than that from the DC electrode. The magnitude value of the thrust did not increase, probably because of the loss due to collision. As shown in Figure 20a, in the frequency range of 4 kHz to 8 kHz in the CD-PA, the horizontal thrust decreased, the vertical thrust increased with the frequency, and the magnitude value was almost the same as when the AC electrode was grounded (0 kHz). As shown in Figure 21a, this result corresponds to the vertical deflection of the jet and indicates that the jet from the AC electrode became stronger with the increasing frequency. The jet collided and merged with the jet from the DC electrode and increased the vertical thrust. The collision weakened the horizontal thrust of the jet from the DC electrode and reduced the magnitude value of the thrust. The increase in the jet strength at the AC electrode is consistent with the increase in the photoemission strength at the AC electrode, as shown in Figure 19a. In the TED-PA, as shown in Figure 20b, the vertical thrust linearly increased as the frequency increased, and this was correlated with the jet being deflected vertically with the frequency, as shown in Figure 21b. The increasing frequency resulted in enhancement of the barrier discharge and induction of a stronger jet from the AC electrode.
Figure 22 shows the body force calculated from the flow velocity field. Note that the body force directed towards the opposite electrode was positive, as shown in Figure 8. As shown in Figure 22a, when the frequency was 4 kHz to 8 kHz, the horizontal body force around the AC electrode slightly decreased. This result is inconsistent with the increase in the photoemission strength, as shown in Figure 19a, and jet deflection, as shown in Figure 21a. It is possible that the body force was not estimated correctly because the pressure gradient was ignored when calculating the volumetric force, or because of particle loss during the flow field measurement. The photoemission strength in Figure 19a and the vertical thrust in Figure 20a increased, meaning the magnitude value of the body force around the AC electrode may have increased, although further investigation is required. Similarly, for the TED-PA, the body force around the AC electrode shown in Figure 21b may have increased because the photoemission strength increased and the induced jet around the AC electrode became stronger. The horizontal body force around the DC electrode in the case of 2 kHz decreased compared to the case where the AC electrode was grounded, and it increased with the frequency in the range of 2 kHz to 6 kHz. This result is correlated with the photoemission strength, and it indicates that the increase in the frequency of the AC voltage enhanced the discharge and generation of body force around the DC electrode. As the frequency changed from 6 kHz to 8 kHz, the horizontal body force around the DC electrode slightly decreased. This result indicates the saturation of the enhancement effect by the AC discharge.

4. Conclusions

In this study, to obtain insight into the working mechanism of TED-PAs, a TED-PA was experimentally investigated and compared with a CD-PA by varying the DC voltage amplitude and AC frequency from the viewpoints of the plasma photoemission, thrust force, and flow velocity field. As a result, it was shown that a higher DC voltage led to a weaker AC (DBD) discharge in the TED-PA but generated a stronger DC discharge and a stronger body force around the DC electrode. Furthermore, a high AC frequency caused not only a stronger AC discharge but also a stronger DC discharge. This implies that a stronger AC discharge enhances the DC discharge through the electron supply; this mechanism was reported in a previous numerical study. The body force generation performance strongly depends on a lot of design parameters such as the applied voltage amplitude, frequency, and gap distance between the two exposed electrodes, and design optimization is required in order to maximize the performance and practical use. According to the knowledge obtained in this study, a higher DC voltage is preferable because it can generate a stronger body force due to the stronger DC discharge. However, the DC voltage should be set at a moderate amplitude to avoid sparks between the two exposed electrodes. On the other hand, a higher AC frequency is very effective because it can enhance the body force generation not only in the AC but also in the DC discharge without changing the potential difference between the two exposed electrodes.
In the future, the characteristics of the power consumption, jet deflection angle, and geometric parameter effects will be investigated for design optimization.

Author Contributions

Conceptualization, A.H., K.N. and H.N.; Data curation, A.H.; Formal analysis, A.H.; Funding acquisition, H.N.; Investigation, A.H.; Methodology, A.H. and H.N.; Project administration, A.H.; Resources, H.N.; Software, A.H.; Supervision, H.N.; Validation, A.H.; Visualization, A.H.; Writing—original draft, A.H.; Writing—review and editing, A.H., K.N. and H.N. All authors have read and agreed to the published version of the manuscript.

Funding

This work was supported by JSPS KAKENHI Grant Number JP19H02062.

Data Availability Statement

The data presented in this study are available on request from the corresponding author.

Conflicts of Interest

The authors declare no conflict of interest.

References

  1. Roth, J.R.; Sherman, D.M.; Wilkinson, S.P. Electrohydrodynamic Flow Control with a Glow-Discharge Surface Plasma. AIAA J. 2000, 38, 1166–1172. [Google Scholar] [CrossRef]
  2. Post, M.L.; Corke, T.C. Separation Control on HIgh Angle of Attack Airfoil Using Plasma Actuators. AIAA J. 2004, 42, 2177–2184. [Google Scholar] [CrossRef]
  3. Huang, J.; Corke, T.C.; Thomas, F.O. Plasma Actuators for Separation Control of Low-Pressure Turbine Blades. AIAA J. 2006, 44, 51–57. [Google Scholar] [CrossRef]
  4. Corke, T.C.; Post, M.L.; Orlov, D.M. SDBD Plasma Enhanced Aerodynamics: Concepts, Optimization and Applications. Prog. Aerosp. Sci. 2007, 43, 193–217. [Google Scholar] [CrossRef]
  5. Abe, T.; Takizawa, Y.; Sato, S.; Kimura, N. Experimental Study for Momentum Transfer in a Dielectric Barrier Discharge Plasma Actuator. AIAA J. 2008, 46, 2248–2256. [Google Scholar] [CrossRef]
  6. Benard, N.; Moreau, E. Electrical and Mechanical Characteristics of Surface AC Dielectric Barrier Discharge Plasma Actuators Applied to Airflow Control. Exp. Fluids 2014, 55, 1846. [Google Scholar] [CrossRef] [Green Version]
  7. Fujii, K. Three Flow Features behind the Flow Control Authority of DBD Plasma Actuator: Result of High-Fidelity Simulations and the Related Experiments. Appl. Sci. 2018, 8, 546. [Google Scholar] [CrossRef] [Green Version]
  8. Shimomura, S.; Sekimoto, S.; Oyama, A.; Fujii, K.; Nishida, H. Closed-Loop Flow Separation Control Using the Deep Q Network over Airfoil. AIAA J. 2020, 58, 4260–4270. [Google Scholar] [CrossRef]
  9. Lilley, A.J.; Roy, S.; Michels, L.; Roy, S. Performance Recovery of Plasma Actuators in Wet Conditions. J. Phys. D Appl. Phys. 2022, 55, 155201. [Google Scholar] [CrossRef]
  10. Benard, N.; Balcon, N.; Moreau, E. Electric Wind Produced by a Surface Dielectric Barrier Discharge Operating Over a Wide Range of Relative Humidity. In Proceedings of the 47th AIAA Aerospace Sciences Meeting Including the New Horizons Forum and Aerospace Exposition; Aerospace Sciences Meetings, Orlando, FL, USA, 5–8 January 2009; American Institute of Aeronautics and Astronautics: Reston, VA, USA, 2012. [Google Scholar] [CrossRef]
  11. Wicks, M.; Thomas, F.O. Effect of Relative Humidity on Dielectric Barrier Discharge Plasma Actuator Body Force. AIAA J. 2015, 53, 2801–2805. [Google Scholar] [CrossRef]
  12. Segawa, T.; Suzuki, D.; Fujino, T.; Jukes, T.; Matsunuma, T. Feedback Control of Flow Separation Using Plasma Actuator and FBG Sensor. Int. J. Aerosp. Eng. 2016, 2016, 8648919. [Google Scholar] [CrossRef] [Green Version]
  13. Pasquale, L.; Durante, D.; Broglia, R. Flow Separation Prevention around a NACA0012 Profile through Multivariable Feedback Controlled Plasma Actuators. Comput. Fluids 2019, 182, 85–107. [Google Scholar] [CrossRef]
  14. Durscher, R.; Roy, S. Novel Multi-Barrier Plasma Actuators for Increased Thrust. In Proceedings of the 48th AIAA Aerospace Sciences Meeting Including the New Horizons Forum and Aerospace Exposition, Orlando, FL, USA, 4–7 January 2010; American Institute of Aeronautics and Astronautics: Reston, VA, USA, 2012. [Google Scholar] [CrossRef] [Green Version]
  15. Durscher, R.; Roy, S. On Multi-Barrier Plasma Actuators. In Proceedings of the 49th AIAA Aerospace Sciences Meeting Including the New Horizons Forum and Aerospace Exposition, Orlando, FL, USA, 4–7 January 2011; American Institute of Aeronautics and Astronautics: Reston, VA, USA, 2012. [Google Scholar] [CrossRef]
  16. Erfani, R.; Erfani, T.; Utyuzhnikov, S.V.; Kontis, K. Optimisation of Multiple Encapsulated Electrode Plasma Actuator. Aerosp. Sci. Technol. 2013, 26, 120–127. [Google Scholar] [CrossRef]
  17. Erfani, R.; Zare-Behtash, H.; Hale, C.; Kontis, K. Development of DBD Plasma Actuators: The Double Encapsulated Electrode. Acta Astronaut. 2015, 109, 132–143. [Google Scholar] [CrossRef] [Green Version]
  18. Sato, S.; Furukawa, H.; Komuro, A.; Takahashi, M.; Ohnishi, N. Successively Accelerated Ionic Wind with Integrated Dielectric-Barrier-Discharge Plasma Actuator for Low-Voltage Operation. Sci. Rep. 2019, 9, 5813. [Google Scholar] [CrossRef] [Green Version]
  19. Sato, S.; Sakurai, M.; Ohnishi, N. Enhancement of Electrohydrodynamic Force with AC Bias Voltage in Three-Electrode Dielectric Barrier Discharge Plasma Actuators. J. Appl. Phys. 2022, 132, 113301. [Google Scholar] [CrossRef]
  20. Sosa, R.; Artana, G.; Moreau, E.; Touchard, G. Stall Control at High Angle of Attack with Plasma Sheet Actuators. Exp. Fluids 2006, 42, 143–167. [Google Scholar] [CrossRef]
  21. Moreau, E.; Sosa, R.; Artana, G. Electric Wind Produced by Surface Plasma Actuators: A New Dielectric Barrier Discharge Based on a Three-Electrode Geometry. J. Phys. D Appl. Phys. 2008, 41, 115204. [Google Scholar] [CrossRef]
  22. Sosa, R.; Arnaud, E.; Memin, E.; Artana, G. Study of the Flow Induced by a Sliding Discharge. IEEE Trans. Dielectr. Electr. Insul. 2009, 16, 305–311. [Google Scholar] [CrossRef] [Green Version]
  23. Sosa, R.; D’Adamo, J.; Artana, G. Circular Cylinder Drag Reduction by Three-Electrode Plasma Actuators. J. Phys. Conf. Ser. 2009, 166, 012015. [Google Scholar] [CrossRef]
  24. D’Adamo, J.; Leonardo, L.; Castro, F.; Sosa, R.; Duriez, T.; Artana, G. Circular Cylinder Drag Reduction by Three-Electrode Plasma Symmetric Forcing. J. Fluids Eng. 2017, 139, 061202. [Google Scholar] [CrossRef]
  25. Zheng, B.; Chen, J.; Ge, C.; Ke, X.; Liang, H. Flow Visualization and Mechanisms of Three-Electrode Sliding Discharge Plasma Actuator. Proc. Inst. Mech. Eng. G J. Aerosp. Eng. 2019, 233, 4788–4799. [Google Scholar] [CrossRef]
  26. Zheng, B.; Ke, X.; Ge, C.; Zhu, Y.; Wu, Y.; Liu, F.; Luo, S. Electrical and Flow Characteristics of a Double-Side Sliding Pulsed Discharge Plasma Actuator. AIAA J. 2020, 58, 733–746. [Google Scholar] [CrossRef]
  27. Zheng, B.; Xue, M.; Ge, C. Sliding Discharge Plasma Actuation for Forebody Vortex Control on a Slender Body at High Angles of Attack. AIP Adv. 2020, 10, 055103. [Google Scholar] [CrossRef]
  28. Matsuno, T.; Sugahara, M.; Kawazoe, H.; Nishida, H. Development of serrated multi-electrode plasma actuators for enhanced force production. In Proceedings of the 54th AIAA Aerospace Sciences Meeting, San Diego, CA, USA, 4–8 January 2016; AIAA SciTech Forum. American Institute of Aeronautics and Astronautics: Reston, VA, USA, 2016. [Google Scholar] [CrossRef]
  29. Xue, M.; Ni, Z.; Gao, C.; Wu, B.; Zheng, B. Deflected Synthetic Jet Due to Vortices Induced by a Tri-Electrode Plasma Actuator. AIAA J. 2022, 60, 3695–3706. [Google Scholar] [CrossRef]
  30. Jukes, T.N.; Choi, K.-S. Dielectric-Barrier-Discharge Vortex Generators: Characterisation and Optimisation for Flow Separation Control. Exp. Fluids 2012, 52, 329–345. [Google Scholar] [CrossRef]
  31. Wicks, M.; Thomas, F.O.; Corke, T.C.; Patel, M.; Cain, A.B. Mechanism of Vorticity Generation in Plasma Streamwise Vortex Generators. AIAA J. 2015, 53, 3404–3413. [Google Scholar] [CrossRef]
  32. Yoon, J.-S.; Han, J.-H. Parametric investigation on plasma streamwise vortex generators with flow around the bluff body. In Proceedings of the 53rd AIAA Aerospace Sciences Meeting, Kissimmee, FL, USA, 5–9 January 2015; AIAA SciTech Forum. American Institute of Aeronautics and Astronautics: Reston, VA, USA, 2015. [Google Scholar] [CrossRef]
  33. Vernet, J.A.; Örlü, R.; Söderblom, D.; Elofsson, P.; Alfredsson, P.H. Plasma Streamwise Vortex Generators for Flow Separation Control on Trucks: A Proof-of-Concept Experiment. Flow Turbul. Combust. 2018, 100, 1101–1109. [Google Scholar] [CrossRef] [Green Version]
  34. Dickenson, A.; Morabit, Y.; Hasan, M.I.; Walsh, J.L. Directional Mass Transport in an Atmospheric Pressure Surface Barrier Discharge. Sci. Rep. 2017, 7, 14003. [Google Scholar] [CrossRef] [Green Version]
  35. Gilbart, B.; Dickenson, A.; Walsh, J.L.; Hasan, M.I. Mutual Interaction among Multiple Surface Barrier Discharges. Plasma Process. Polym. 2022, 19, 2100181. [Google Scholar] [CrossRef]
  36. Roy, S.; Wang, C.-C. Bulk Flow Modification with Horseshoe and Serpentine Plasma Actuators. J. Phys. D Appl. Phys. 2009, 42, 032004. [Google Scholar] [CrossRef]
  37. Riherd, M.; Roy, S. Serpentine Geometry Plasma Actuators for Flow Control. J. Appl. Phys. 2013, 114, 083303. [Google Scholar] [CrossRef] [Green Version]
  38. Gupta, A.D.; Roy, S. Three-Dimensional Plasma Actuation for Faster Transition to Turbulence. J. Phys. D Appl. Phys. 2017, 50, 425201. [Google Scholar] [CrossRef] [Green Version]
  39. Wang, C.-C.; Roy, S. Microscale Plasma Actuators for Improved Thrust Density. J. Appl. Phys. 2009, 106, 013310. [Google Scholar] [CrossRef] [Green Version]
  40. Zito, J.C.; Durscher, R.J.; Soni, J.; Roy, S.; Arnold, D.P. Flow and Force Inducement Using Micron Size Dielectric Barrier Discharge Actuators. Appl. Phys. Lett. 2012, 100, 193502. [Google Scholar] [CrossRef]
  41. Nakai, K.; Nishida, H.; Asaumi, N.; Tanaka, Y.; Matsuno, T. Development of Engineering Model Providing Body Force Distribution of Tri-Electrode Plasma Actuator. Trans. Jpn. Soc. Aeronaut. Space Sci. 2019, 62, 247–255. [Google Scholar] [CrossRef] [Green Version]
  42. Nishida, H.; Nakai, K.; Matsuno, T. Physical Mechanism of Tri-Electrode Plasma Actuator with Direct-Current High Voltage. AIAA J. 2017, 55, 1852–1861. [Google Scholar] [CrossRef]
  43. Nakai, K. Analysis of Electrohydrodynamic Force Generation Mechanism and Study on Performance Improvement of Plasma Actuator Utilizing Plasma Fluid Model. Ph.D. Dissertation, Tokyo University of Agriculture and Technology, Koganei, Japan, 2020. [Google Scholar]
  44. Nakai, K.; Hatamoto, A.; Nishida, H. Effective design of tri-electrode plasma actuator for body force generation by DC discharge. In Proceedings of the Mechanical Engineering Congress, Akita, Japan, 8–11 September 2019. [Google Scholar]
  45. Nakai, K.; Hasegawa, D.; Hatamoto, A.; Nishida, H. Body Force generation control by modulating applied voltage waveform in tri-electrode plasma actuator. In Proceedings of the AIAA Scitech 2019 Forum, San Diego, CA, USA, 7–11 January 2019; American Institute of Aeronautics and Astronautics: Reston, VA, USA, 2019. [Google Scholar] [CrossRef]
  46. Durscher, R.; Roy, S. Evaluation of Thrust Measurement Techniques for Dielectric Barrier Discharge Actuators. Exp. Fluids 2012, 53, 1165–1176. [Google Scholar] [CrossRef]
  47. Moreau, E.; Cazour, J.; Benard, N. Influence of the Air-Exposed Active Electrode Shape on the Electrical, Optical and Mechanical Characteristics of a Surface Dielectric Barrier Discharge Plasma Actuator. J. Electrostat. 2018, 93, 146–153. [Google Scholar] [CrossRef]
  48. Guoqiang, G.A.O.; Peng, K.; Dong, L.; Wenfu, W.E.I.; Guangning, W.U. Parametric Study on the Characteristics of a SDBD Actuator with a Serrated Electrode. Plasma Sci. Technol. 2017, 19, 064010. [Google Scholar] [CrossRef]
  49. Léger, L.; Moreau, E.; Artana, G.; Touchard, G. Influence of a DC Corona Discharge on the Airflow along an Inclined Flat Plate. J. Electrostat. 2001, 51–52, 300–306. [Google Scholar] [CrossRef]
  50. Léger, L.; Moreau, E.; Touchard, G.G. Effect of a DC Corona Electrical Discharge on the Airflow along a Flat Plate. IEEE Trans. Ind. Appl. 2002, 38, 1478–1485. [Google Scholar] [CrossRef]
  51. Moreau, E. Airflow Control by Non-Thermal Plasma Actuators. J. Phys. D Appl. Phys. 2007, 40, 605–636. [Google Scholar] [CrossRef]
Figure 1. Schematic of a dielectric barrier discharge plasma actuator.
Actuators 11 00322 g001
Figure 2. Schematic of a tri-electrode plasma actuator.
Actuators 11 00322 g002
Figure 3. Schematic of a corona discharge plasma actuator.
Actuators 11 00322 g003
Figure 4. Schematic of discharge photograph imaging.
Actuators 11 00322 g004
Figure 5. Area for calculating the photoemission strength from the discharge photograph.
Actuators 11 00322 g005
Figure 6. Setup for thrust measurement.
Actuators 11 00322 g006
Figure 7. Setup for measurement of flow velocity fields using the PIV system: (a) connection diagram; (b) side view from the camera.
Actuators 11 00322 g007
Figure 8. Area for calculating the momentum flow rate from the flow velocity field.
Actuators 11 00322 g008
Figure 9. Schematics of the (a) CD-PA and (b) TED-PA: the left electrode is the DC electrode (applied the DC voltage), and the right electrode is the AC electrode (applied the AC voltage); (c) top view of the top electrode.
Actuators 11 00322 g009
Figure 10. Discharge photographs in the case where the AC electrode was grounded and a voltage of 14 kV was applied to the DC electrode in the (a) CD-PA and (b) TED-PA.
Actuators 11 00322 g010
Figure 11. Discharge photographs in the case where a voltage of 10 kVpp at 4 kHz was applied to the AC electrode, and the DC electrode was grounded, in the (a) CD-PA and (b) TED-PA.
Actuators 11 00322 g011
Figure 12. Discharge photographs in the case where a voltage of 10 kVpp at 4 kHz was applied to the AC electrode, and a voltage of 14 kV was applied to the DC electrode, in the (a) CD-PA and (b) TED-PA.
Actuators 11 00322 g012
Figure 13. Photoemission strength versus the DC voltage when the AC voltage was 10 kVpp at 4 kHz in the (a) CD-PA and (b) TED-PA.
Actuators 11 00322 g013
Figure 14. Thrust versus the DC voltage when the AC voltage was 10 kVpp at 4 kHz in the (a) CD-PA and (b) TED-PA.
Actuators 11 00322 g014
Figure 15. Flow velocity field versus the DC voltage when the AC voltage was 10 kVpp at 4 kHz in the (a) CD-PA and (b) TED-PA.
Actuators 11 00322 g015
Figure 16. Momentum flow rate versus the DC voltage when the AC voltage was 10 kVpp at 4 kHz in the (a) CD-PA and (b) TED-PA.
Actuators 11 00322 g016
Figure 17. Discharge photographs in the case where a voltage of 10 kVpp at 2 kHz was applied to the AC electrode, and a voltage of 14 kV was applied to the DC electrode, in the (a) CD-PA and (b) TED-PA.
Actuators 11 00322 g017
Figure 18. Discharge photographs in the case where a voltage of 10 kVpp at 8 kHz was applied to the AC electrode, and a voltage of 14 kV was applied to the DC electrode, in the (a) CD-PA and (b) TED-PA.
Actuators 11 00322 g018
Figure 19. Photoemission strength versus the frequency of the AC voltage when the AC voltage was 10 kVpp and the DC voltage was 14 kV in the (a) CD-PA and (b) TED-PA.
Actuators 11 00322 g019
Figure 20. Thrust versus the frequency of the AC voltage when the AC voltage was 10 kVpp and the DC voltage was 14 kV in the (a) CD-PA and (b) TED-PA.
Actuators 11 00322 g020
Figure 21. Flow velocity field versus the frequency of the AC voltage when the AC voltage was 10 kVpp and the DC voltage was 14 kV in the (a) CD-PA and (b) TED-PA.
Actuators 11 00322 g021
Figure 22. Momentum flow rate versus the frequency of the AC voltage when the AC voltage was 10 kVpp and the DC voltage was 14 kV in the (a) CD-PA and (b) TED-PA.
Actuators 11 00322 g022
Publisher’s Note: MDPI stays neutral with regard to jurisdictional claims in published maps and institutional affiliations.

