Abstract
People with concomitant human immunodeficiency virus (HIV) and tuberculosis (TB) have an increased risk of hepatotoxic reactions due to antiretroviral therapy (ART) and anti-TB therapy (ATT). Concomitant hepatitis B virus (HBV) in these patients may lead to poorer health outcomes. To assess liver enzyme levels and immune response in adults with HIV, HBV, and TB, data from 300 antiretroviral-naïve people living with HIV (PLWHIV) were analyzed. The prevalence of HIV/HBV (cHIV/HBV) and HIV/TB (cHIV/TB) was 28% (95% CI: 23.0–33.4) and 10% (95% CI: 6.8–14.0), respectively. HIV/HBV/TB (cHIV/HBV/TB) prevalence was 5.3% (95% CI: 3.1–8.5). There was a statistically significant difference between the groups of participants in HIV viral load (p = 0.004), hemoglobin levels (p = 0.025), and body mass index (p = 0.011). A larger proportion of cHIV/HBV/TB participants (37.5%) had an aspartate aminotransferase to platelet ratio index (APRI) score ≥0.5 (p = 0.013), a lower cutoff for significant liver fibrosis. Immunological non-responders (CD4+ T-cell count <20% gain and HIV viral load <400 copies/mL at 6 months) were observed in all groups except those with cHIV/TB. Our findings support the need to screen for infections that could cause excessive liver damage prior to ATT or ART initiation, such as HBV.
1. Introduction
Globally, approximately 251,000 tuberculosis (TB)-associated deaths were recorded among people living with human immune deficiency virus (PLWHIV) in 2018 with a high proportion of people with concomitant HIV/TB (cHIV/TB) occurring in Africa [1]. Botswana is no exception and is listed among the thirty highest TB/HIV burdened countries by the World Health Organization (WHO) [1]. Other HIV co-infections such as viral hepatitis, particularly hepatitis B virus (HBV) is highly prevalent in Africa with approximately 71% of people with concomitant HIV/HBV (cHIV/HBV) reported in sub-Saharan Africa [2]. Botswana also has one of the highest reported HBV incidences among PLWHIV in Southern Africa [3], and prevalence rates vary from 3.1% to 10.6% in different at-risk populations [4,5,6,7,8,9]. Focusing efforts on preventive measures such as vaccinations and early diagnosis is of great importance.
Although treatment of HIV co-infections has been shown to decrease HIV viral load [10], other multiple undiagnosed infections could counteract this effort and possibly lead to delayed immune recovery. Currently, there are limited data on the burden of multiple infections with TB and HBV among PLWHIV in a high HIV endemic country such as Botswana. HIV, HBV, and TB multi-infection burden is rarely studied in sub-Saharan Africa; however, a prevalence of 7.5% was reported in China [11] indicating a possibly overlooked source of adverse health outcomes in the context of HIV endemicity.
HIV co-infections result in poor health outcomes that are not only a function of their pathogenesis but also the complications arising from their treatment. Patients with cHIV/TB are known to have increased hepatotoxic reactions particularly with the initiation of anti-TB therapy (ATT) [12,13]. Immune reconstitution inflammatory syndrome (IRIS) is also prevalent in patients with cHIV/TB at antiretroviral therapy (ART) initiation [14]. Chronic and occult HBV among PLWHIV may result in adverse health outcomes [15], and HIV treatments such as Truvada-based ART are efficacious in treating HBV [16]. The immense pressure on the liver resulting from disease and treatment therefore requires routine assessment for patients on ART and ATT. To assess liver damage, inexpensive non-invasive methods such as evaluating aspartate aminotransferase (AST), alanine aminotransferase (ALT), AST to platelet ratio index (APRI), and fibrosis-4 (FIB-4) are employed. These liver enzymes, in particular aminotransferases, are released in circulation after liver injury [17]. These methods are suitable in low- and middle-income countries with limited resources or expertise for other methods such as liver biopsy.
Immune restoration in PLWHIV that could also be co-infected with other diseases is measured mainly by the use of CD4 T+ cell counts in resource-limited settings. It is especially important to assess immune response in these patients as liver cirrhosis has been associated with low CD4 T+ cell count even in the absence of HIV [18], as well as among PLWHIV who are treatment naïve indicating the possibility of HIV-associated liver damage [19]. To assess such dynamics in people with concomitant HIV, HBV, and TB (cHIV/HBV/TB), we determined the prevalence of cHIV/HBV/TB in an adult population initiating a Truvada-based ART in Botswana. We also aimed to evaluate the liver enzyme levels and immune response among PLWHIV only, participants with concomitant HIV and HBV (cHIV/HBV) and cHIV/TB, as well as participants with cHIV/HBV/TB.
2. Materials and Methods
2.1. Study Participants
The study participants were PLWHIV initiating Truvada-based ART in Botswana from a longitudinal study “Bomolemo” conducted at the Botswana Harvard AIDS Institute Partnership (BHP) between 2008 and 2011. The Bomolemo study recruited 309 ART-naive PLWHIV and screened 300 for HIV, HBV, and TB as previously described [20]. Eligibility criteria for the Bomolemo study included a minimum age of 18 years, presence of an AIDS defining condition, or CD4+ T-cell count of less than 250 cells/mm3. Female participants found to be pregnant or who had received a single dose of nevirapine through the prevention of mother to child transmission program within 6 months preceding enrollment were excluded. Written informed consent was obtained from study participants. The study received ethical approval from the Botswana Ministry of Health Research Development Committee (PPME-13/18/1) and the Harvard T.H. Chan School of Public Health Institutional Review Board (16470–02).
2.2. Laboratory Testing
All laboratory tests were conducted at the Botswana Harvard HIV reference laboratory (BHHRL) following manufacturer’s instructions. HIV and hepatitis B virus surface antigen (HBsAg) were diagnosed using enzyme-linked immunosorbent assays (ELISA). HIV ELISA included a double/parallel testing algorithm with Vironostika HIV Uniform II plus O (BioMérieux France, Marcy l’Etoile, France) and Murex HIV-1.2.O (Biotech, Dartford, U.K.) as per manufacturer’s instructions. HBsAg ELISA was also carried out using the Murex HBsAg kit (Biotech, Dartford, U.K.). HBV DNA was quantified by use of COBAS® AmpliPrep/COBAS® Taqman®, HBV Test v.2.0 (Roche diagnostics, Mannheim, Germany). Occult HBV infection (OBI) was defined as negative HBsAg with a detectable HBV viral load. TB was confirmed using either a positive sputum acid-fast bacillus or culture result or an abnormal chest radiology as previously described [20]. HIV viral load was measured using the COBAS® AmpliPrep/COBAS® AMPLICOR® HIV-1 MONITOR Test, version 1.5 (Roche Molecular Systems, Branchburg, NJ). CD4+ T-cell counts were measured on the BD FACScalibur platform (BD Biosciences, San Jose, CA, USA). Hematology tests were conducted on the Sysmex XE-2100 (Sysmex, Kobe, Japan). The COBAS INTEGRA 400 plus (Roche Diagnostics, Indianapolis, IN, USA) was used for the measurement of chemistry panels.
2.3. Outcome Definitions
Immunological non-response (INR) was defined as <20% increase in CD4+ T-cell count from the baseline CD4+ T-cell count to 6 months of follow-up [21] with an HIV viral load of less than 400 copies/mL as per the limit of detection [20]. Four non-invasive methods were used to assess liver damage at baseline (prior to ART initiation) in these patients, including AST, ALT, APRI, and the FIB-4 index. The upper limit of normal (ULN) for ALT and AST were considered to be 42 and 41 U/L respectively, as per the BHHRL protocols. AST and ALT grades were defined as grade 1 (1.25–2.5 × ULN), grade 2 (2.6–5.0 × ULN), grade 3 (5.1–10.0 × ULN), or grade 4 (>10.0 × ULN) per the Division of AIDS adverse event grading table [22]. APRI and FIB-4 scores were calculated as previously reported [23,24], and low cutoff values were used for the staging of fibrosis. The low cutoff value for APRI was 0.5, while the FIB-4 low cutoff value was 1.45 for liver fibrosis staging. The low cutoff for cirrhosis using APRI was 1.0, while the high cutoff was 2.0 [25].
2.4. Statistical Analysis
Kruskal–Wallis test was used to compare the median CD4+ T-cell count, log HIV viral load, ALT, AST, APRI, and FIB-4 levels across the different groups. Dunn’s test with Bonferroni correction was used to adjust for multi-comparison between groups. Pearson’s chi-squared test (χ²) was used for comparisons between categorical data. All statistical analysis was performed in STATA version 15.1 (Stata Corporation, College Station, TX, USA), and p-values less than 0.05 were considered statistically significant.
3. Results
3.1. Prevalence Rates of Co-Infections with HIV
Of the 300 participants at baseline, 56.7% [95% CI: 50.9–62.4] (170/300) were PLWHIV without HBV and TB. Twenty-eight percent [95% CI: 23.0–33.4] (84/300) of the participants had cHIV/HBV, 10% [95% CI: 6.8–14.0] (30/300) had cHIV/TB, and 5.3% [95% CI: 3.1–8.5] (16/300) were participants with cHIV/HBV/TB. Among those that had cHIV/HBV, 29.8% [95% CI: 20.3–40.7] (25/84) tested positive for HBsAg, while the remaining 70.2% [95% CI: 59.3–79.7] (59/84) had OBI (Figure 1).
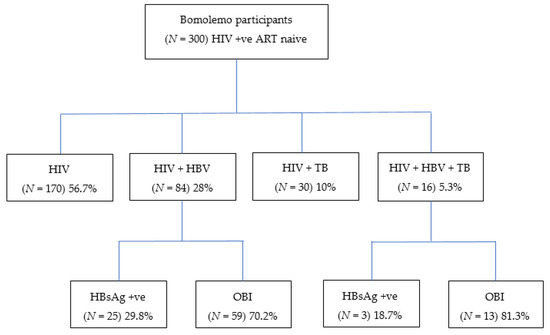
Figure 1.
Proportion of Bomolemo participants with HIV, HBV, and/or TB co-infections. HIV; human immunodeficiency virus; HBV, hepatitis B virus; TB, tuberculosis; HBsAg, hepatitis B surface antigen; OBI, occult hepatitis B virus infection; +ve, positive.
3.2. Participant Baseline Demographics and Clinical Characteristics
At baseline, there were no statistically significant differences across the study groups in median CD4+ T-cell count, ALT, AST, APRI, or FIB-4 levels. However, there was significant statistical difference in median hemoglobin levels (p = 0.025), median body mass index (BMI) (p = 0.011), and log HIV viral load (p = 0.004) at baseline (see Table 1).

Table 1.
Participant baseline demographics and clinical characteristics.
There was a statistically significant difference in the proportion of participants with previous exposure to HBV (HBcAb), (p = 0.001). There is evidence of previous exposure to HBV in PLWHIV and participants with cHIV/TB. However, the highest proportions were observed in participants with cHIV/HBV/TB (82.3%) and those with cHIV/HBV (69.1%), which is not surprising as some of the participants were also HBsAg positive. Five participants—4 with cHIV/HBV and 1 with cHIV/HBV/TB—were HBsAg positive but HBcAb negative (data not shown). There was no significant difference between participants with cHIV/HBV who had chronic infection versus OBI for all variables analyzed (data not shown).
Statistically significant differences in hemoglobin levels were observed between PLWHIV versus cHIV/HBV/TB (p = 0.011), cHIV/HBV versus cHIV/HBV/TB (p = 0.043), and cHIV/TB versus cHIV/HBV/TB (p = 0.017) groups as shown in Figure 2a. Figure 2b shows that cHIV/TB participants had lower BMI compared to PLWHIV (p = 0.003) and cHIV/HBV participants (p = 0.018). Participants with cHIV/HBV/TB had the highest log viral load compared to PLWHIV only (p = 0.003) and cHIV/HBV (p = 0.003).
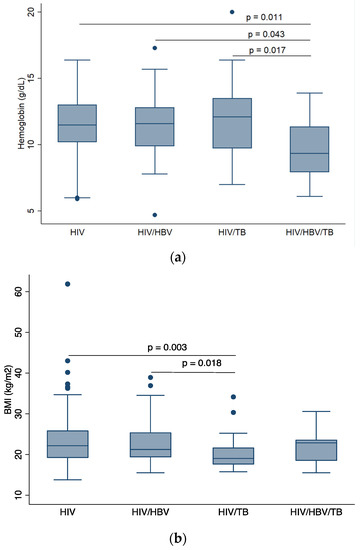
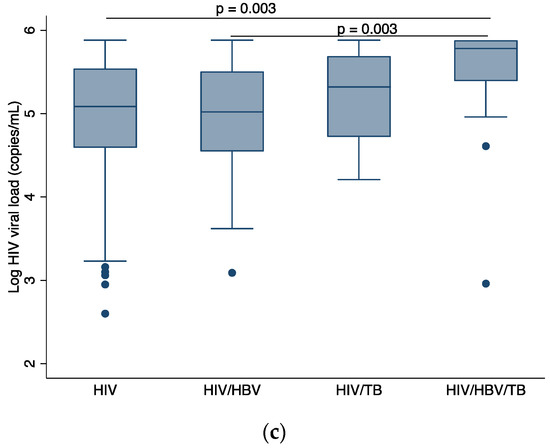
Figure 2.
Comparison of baseline demographics across participant groups, (a) comparison of median BMI across participant groups, (b) comparison of median hemoglobin level across participant groups, (c) comparison of median log HIV viral load across participant groups. HIV: human immunodeficiency virus; HBV: hepatitis B virus; TB: tuberculosis; BMI: body mass index. p-values are by Dunn’s test with Bonferroni correction. Only p-values that indicate statistically significant differences in median values between patient groups are shown.
3.3. Hepatotoxicity
At baseline, the majority of participants from each group had normal ALT (HIV (92.7%); HIV/HBV (91.8%); HIV/TB (93.1%); HIV/HBV/TB (87.5%) as shown in Figure 2a. A similar trend was observed with AST levels [HIV (89.9%%); HIV/HBV (84.3%); HIV/TB (93.1%); HIV/HBV/TB (87.5%)] as shown in Figure 2b. No participants had grade 4 AST toxicity, Figure 2b, whilst grade 4 ALT toxicity was recorded in one participant with cHIV/HBV, Figure 3a.
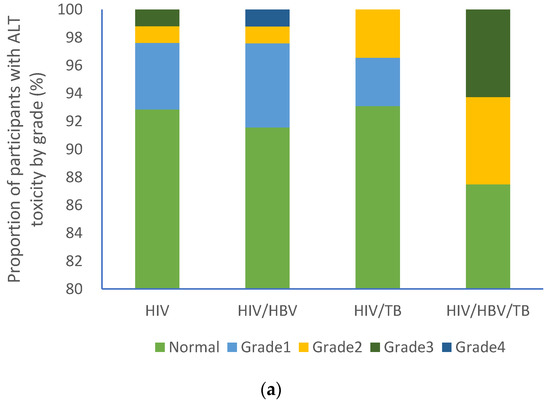
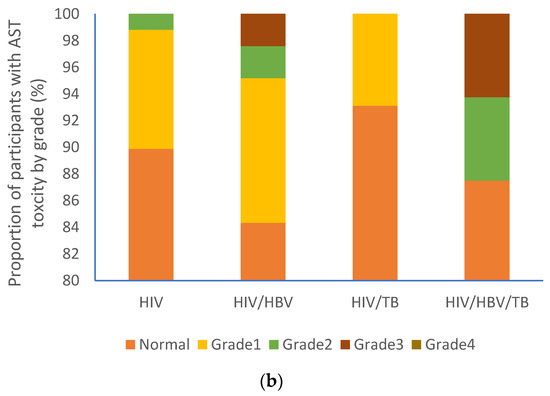
Figure 3.
Proportion of participants with varying liver function test grades: (a) ALT grades and (b) AST grades. HIV: human immunodeficiency virus; HBV: hepatitis B virus; TB: tuberculosis; AST: aspartate aminotransferase; ALT: alanine aminotransferase.
There was a significant statistical difference between the groups in APRI score categories (p = 0.013). A higher proportion of participants with cHIV/HBV/TB (37.5%) had an APRI score of greater than 0.5 compared to the other groups: HIV (16%), HIV/HBV (15.9%), and HIV/TB (10.7%) (Table 2).

Table 2.
APRI and FIB-4 scores among participants.
These participants had APRI scores >1.0, which is a low cutoff for cirrhosis, a high cutoff being 2.0. The lowest APRI scores were among mono-infected HIV participants (BB1–BB3). Participants with cHIV/HBV had the highest APRI scores (BB8 and BB6). Participants BB6–BB10 had APRI scores of greater than 2.0 indicating significant liver cirrhosis. Participant BB6, deceased, had the highest APRI scores indicating severe liver damage (Table 3).

Table 3.
Baseline demographics of participants with APRI score >1 (lower cutoff for cirrhosis).
3.4. Immunological Response
All patient groups had low proportions of INR at 6 months of follow-up [HIV (17.1%, 28/164), HIV/HBV (17.3%, 14/81), HIV/TB (0% 0/29), HIV/HBV/TB (20%, 3/15)]. These proportions were not statistically different (p = 0.110) as shown in Figure 4.
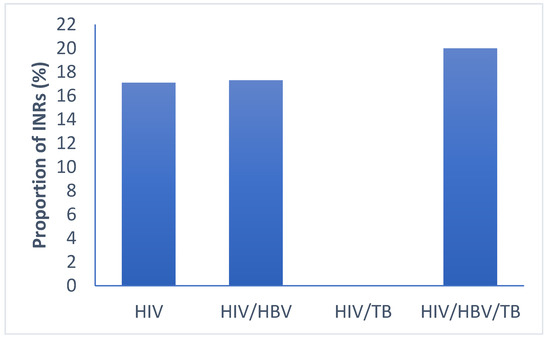
Figure 4.
Proportion of immune-non-responders in the different groups of infections. HIV: human immunodeficiency virus; HBV: hepatitis B virus; TB: tuberculosis; INR: immunological non responders. p-values < 0.05 are statistical different by Pearson’s chi-squared test for categorical data.
4. Discussion
In this study conducted in a cohort of PLWHIV initiating ART in Botswana, we found a cHIV/HBV/TB prevalence of 5.3% with cHIV/HBV/TB participants having the lowest hemoglobin level and high HIV viral loads. Participants with cHIV/TB had a low BMI. Liver damage was more prevalent among participants with cHIV/HBV/TB at a low cutoff for fibrosis. In addition, immunological non-response was observed in all groups of participants at 17–20% apart from those with cHIV/TB.
Concomitant HIV, HBV, and TB is poorly studied in sub-Saharan Africa; however a prevalence of 7.5% has been observed in China [11]. Our study has therefore revealed a possibly overlooked health problem that should be studied more in our settings. People with cHIV/HBV/TB may require unique patient care due to the considerable burden on the liver from ATT, HBV, and ART. Our estimated prevalence of cHIV/HBV in Botswana is 28%, including both chronic infections and OBI, which is comparable to prevalence rates that have been reported in Botswana in similar populations [6,9,26]. The prevalence of cHIV/HBV in other sub-Saharan African countries was shown to range from 0% to 27%, with this large range being affected by the management of HBV in different countries [27]. A cHIV/TB prevalence of 10% is reported here, slightly lower than what was previously reported in a previous analysis of the Bomolemo cohort as we did not exclude patients with HBV [20]. Evidence of cHIV/HBV/TB in our participants can therefore be used to propose guidelines for screening PLWHIV for HBV prior to ART and ATT initiation. The five participants who were HBsAg positive but HBcAb negative are suspected to be cases of recent infections; however, this should be confirmed with immunoglobulin M (IgM) testing. Several other reasons, such as the presence of diagnostic escape mutants for the core gene and immunotolerance of core antigen have been discussed to explain these serology results [28].
Baseline participant demographics revealed that there were more females enrolled in the study, which could explain the difference in proportions in gender for PLWHIV and participants with cHIV/HBV. However, this trend was not observed for participants with cHIV/TB, which is also a global trend. In Botswana, incident TB is more prevalent in males than in females [20]. The difference in TB susceptibility between the genders has been discussed to be possibly due to behavioral, physiological, and genetic differences as reviewed by Nhamoyebonde and Leslie [29]. This gender bias is attributed to risk factors such as smoking [30] and protective female sex hormones that modify immune responses and regulate immune cell functions for a controlled mycobacterial infection [31]. Participants with cHIV/HBV/TB exhibited high HIV viral load and low hemoglobin levels. Co-infections are well known to result in worsened prognosis than mono-infections, which is no exception is this study. Concomitant HIV, HBV, and TB can bring in more complications in this case possibly resulting in late viral suppression and a high viral set point. In a previous analysis of the Bomolemo cohort, there was no association between HIV viral load and the risk of TB [20]. Therefore, the association between HIV viral load and multi-infection could be due to the high burden of HBV infection in this cohort. A larger South African study, however, showed HIV viral load as a risk factor for TB [32]. The present study observed the lowest median hemoglobin levels among participants with cHIV/HBV/TB possibly due to TB. Low hemoglobin level has been shown to be a predictor of incident TB in Bomolemo participants [20] and in South African patients during long-term ART [33]. The association of HBV and low hemoglobin levels should be explored further. Participants with cHIV/TB had the lowest BMI, which could be attributed to nutritional deficiency due to TB infection. Nutritional deficiency, resulting in low BMI, was found to be high in pulmonary TB patients [34], while an overweight BMI is shown to significantly reduce risk for TB [35].
With regards to liver enzyme levels, the majority of our study participants had normal liver enzyme levels at baseline. A high incidence of abnormal liver function tests (LFTs) was observed among participants with cHIV/HBV/TB in China [11]. In contrast, in our study, ALT and AST data were only available at baseline, and there was no statistically significant difference in the median liver enzyme levels between all groups. However, there is a possibility of advancing to more toxic grades, which could have been assessed with longitudinal follow-up of liver enzyme tests as more individuals initiate ART. Fibrosis grading in our study showed that participants with cHIV/HBV/TB had a higher proportion of patients with APRI score of greater or equal to 0.5, a low cutoff point for significant liver fibrosis. At this cutoff point, the sensitivity and specificity for the detection of fibrosis is 78% and 68%, respectively. At a cutoff of 1.5, the sensitivity and specificity for the detection of fibrosis is 36% and 92%, respectively [25]. These non-invasive tests are utilized in most resource-limited settings but may miss some cases. Local ALT and AST reference ranges are yet to be defined specifically for men and women in our setting. A recent study, using African reference ranges versus American reference ranges emphasized the need to have specific ranges for different populations to avoid overestimation or underestimation of abnormalities [36]. FibroTest and FibroScan may be preferred over APRI and FIB-4 but may not be suitable for resource-limited settings. The upper cutoff was not pursued due to the modest sample size. Other studies have revealed an association between concomitant HIV/HBV and liver fibrosis [37,38], while one has shown TB to be a risk factor for liver fibrosis [39]. In patients suspected of having cirrhosis (APRI > 1), all had high HIV viral loads and those with HBV had detectable HBV viral loads at baseline, suggesting active HBV replication resulting in liver damage. The association between HBV and HIV viral load with liver fibrosis has been described previously [40].
We also assessed immune non-response in these patients, defined as a less than 20% gain in CD4+ T-cell count at 6 months of follow-up with viral suppression at less than 400 copies/mL. The lack of immune non-responders in the HIV/TB cohort could be due to the general small sample size as well as our definition of non-responders. There is currently no consensus on the definition of INRs, defined as reviewed by Yang et al. [41]. In light of this, cHIV/HBV was previously shown to result in slow CD4+ T-cell recovery in these patients compared to PLWHIV only [9,42]. TB also results in slow CD4+ T-cell recovery even after ART initiation [43,44,45]. In one South Africa cohort of 15,646 adults, there was no difference in immune restoration between participants with cHIV/TB and those without TB after ART initiation [46]. The differences in observations from these studies could be attributed to factors such as sample size, immune reconstitution definition, and cofounding factors among others.
Our study bears the limitation of a lack of longitudinal liver enzyme tests. This limits our analysis in terms of assessing for incidence of liver damage in each group of participants, particularly with initiation of ART. A larger population size would have also allowed for other fibrosis cutoff points in the analysis.
5. Conclusions
To our knowledge, this is the first study in Botswana to report the prevalence of cHIV/HBV/TB prior to ART initiation. Participants with cHIV/HBV/TB had low hemoglobin levels and high HIV viral loads. Patients with undiagnosed HBV who initiate ATT before ART may have poorer viral hepatitis health outcomes such as developing chronicity, advancing to liver fibrosis, cirrhosis, and possibly hepatocellular carcinoma without any intervention. The study has revealed the need to screen for HBV in people with cHIV/TB infection, as this will lead to better patient management.
Author Contributions
Conceptualization, B.B.P., MA., and S.G.; methodology, B.B.P., M.A., S.M., and S.G.; validation, M.M. and S.M.; formal analysis, B.B.P.; investigation, B.B.P. and M.A.; data curation, B.B.P., M.A., and L.M.; writing—original draft preparation, B.B.P.; writing—review and editing, B.B.P., M.A., L.B., K.B., G.M., W.T.C., L.M., T.M., M.M., S.M., R.M., J.T.B., and S.G.; supervision, M.A., S.M., and S.G.; funding acquisition, M.A. and S.G. All authors have read and agreed to the published version of the manuscript.
Funding
This work was supported through the Sub-Saharan African Network for TB/HIV Research Excellence (SANTHE), a DELTAS Africa Initiative (grant # DEL-15-006). The DELTAS Africa Initiative is an independent funding scheme of the African Academy of Sciences (AAS)’s Alliance for Accelerating Excellence in Science in Africa (AESA) and supported by the New Partnership for Africa’s Development Planning and Coordinating Agency (NEPAD Agency) with funding from the Wellcome Trust (grant # 107752/Z/15/Z) and the U.K. government. The views expressed in this publication are those of the author(s) and not necessarily those of AAS, NEPAD Agency, Welcome Trust, or the U.K. government. This work was also supported by H3ABioNet. H3ABioNet is supported by the National Institutes of Health Common Fund (U41HG006941). H3ABioNet is an initiative of the Human Health and Heredity in Africa Consortium (H3Africa) program of the African Academy of Science (AAS). B.B.P. and M.A. are funded by the Wellcome Trust (grant reference number 218770/Z/19/Z). The content is solely the responsibility of the authors and does not necessarily represent the official views of the National Institutes of Health.
Acknowledgments
We would like to acknowledge the Bomolemo study participants and Ms. Charlotte Mdluli for her assistance in retrieving the patient demographics from the study databases.
Conflicts of Interest
The authors declare no conflict of interest.
References
- WHO. Global Tuberculosis Report 2019; World Health Organisation: Geneva, Switzerland, 2019. [Google Scholar]
- WHO. Global Hepatitis Report 2017; World Health Organisation: Geneva, Switzerland, 2017. [Google Scholar]
- Phinius, B.B.; Anderson, M.; Bokete, R.; Mbangiwa, T.; Choga, W.T.; Baruti, K.; Makhema, J.; Musonda, R.; Blackard, J.T.; Essex, M.; et al. Incidence of hepatitis B virus infection among human immunodeficiency virus-infected treatment naïve adults in Botswana. Medicine 2020, 99, e19341. [Google Scholar] [CrossRef]
- Choga, W.T.; Anderson, M.; Zumbika, E.; Moyo, S.; Mbangiwa, T.; Phinius, B.B.; Melamu, P.; Kayembe, M.K.; Kasvosve, I.; Sebunya, T.K.; et al. Molecular characterization of hepatitis B virus in blood donors in Botswana. Virus Genes 2018. [Google Scholar] [CrossRef]
- Mbangiwa, T.; Kasvosve, I.; Anderson, M.; Thami, P.K.; Choga, W.T.; Needleman, A.; Phinius, B.B.; Moyo, S.; Leteane, M.; Leidner, J.; et al. Chronic and Occult Hepatitis B Virus Infection in Pregnant Women in Botswana. Genes 2018, 9, 259. [Google Scholar] [CrossRef]
- Matthews, P.C.; Beloukas, A.; Malik, A.; Carlson, J.M.; Jooste, P.; Ogwu, A.; Shapiro, R.; Riddell, L.; Chen, F.; Luzzi, G.; et al. Prevalence and Characteristics of Hepatitis B Virus (HBV) Coinfection among HIV-Positive Women in South Africa and Botswana. PLoS ONE 2015, 10, e0134037. [Google Scholar] [CrossRef]
- Wester, C.W.; Bussmann, H.; Moyo, S.; Avalos, A.; Gaolathe, T.; Ndwapi, N.; Essex, M.; MacGregor, R.R.; Marlink, R.G. Serological evidence of HIV-associated infection among HIV-1-infected adults in Botswana. Clin. Infect. Dis. 2006, 43, 1612–1615. [Google Scholar] [CrossRef]
- Mandiwana, A.; Tshitenge, S. Prevalence of human immunodeficiency virus—Hepatitis B virus co-infection amongst adult patients in Mahalapye, Ngami, Serowe, Botswana: A descriptive cross-sectional study. South Afr. Fam. Pract. 2017, 59, 94–97. [Google Scholar] [CrossRef]
- Anderson, M.; Gaseitsiwe, S.; Moyo, S.; Thami, K.P.; Mohammed, T.; Setlhare, D.; Sebunya, T.K.; Powell, E.A.; Makhema, J.; Blackard, J.T.; et al. Slow CD4+ T cell Recovery in Human Immunodeficiency Virus/Hepatitis B Virus-Coinfected Patients Initiating Truvada-Based Combination Antiretroviral Therapy in Botswana. Open Forum Infect. Dis. 2016, 3, ofw140. [Google Scholar] [CrossRef]
- Modjarrad, K.; Vermund, S.H. Effect of treating co-infections on HIV-1 viral load: A systematic review. Lancet Infect. Dis. 2010, 10, 455–463. [Google Scholar] [CrossRef][Green Version]
- Mo, P.; Zhu, Q.; Teter, C.; Yang, R.; Deng, L.; Yan, Y.; Chen, J.; Zeng, J.; Gui, X.E. Prevalence, drug-induced hepatotoxicity, and mortality among patients multi-infected with HIV, tuberculosis, and hepatitis virus. Int. J. Infect. Dis. 2014, 28, 95–100. [Google Scholar] [CrossRef]
- Yimer, G.; Aderaye, G.; Amogne, W.; Makonnen, E.; Aklillu, E.; Lindquist, L.; Yamuah, L.; Feleke, B.; Aseffa, A. Anti-tuberculosis therapy-induced hepatotoxicity among Ethiopian HIV-positive and negative patients. PLoS ONE 2008, 3, e1809. [Google Scholar] [CrossRef]
- Costiniuk, C.T.; Gosnell, B.I.; Manzini, T.C.; Du Plessis, C.N.; Moosa, M.Y. Tuberculous Drug-induced Liver Injury and Treatment Re-challenge in Human Immunodeficiency Virus Co-infection. J. Glob. Infect. Dis. 2015, 7, 151–156. [Google Scholar] [CrossRef]
- Chelkeba, L.; Fekadu, G.; Tesfaye, G.; Belayneh, F.; Melaku, T.; Mekonnen, Z. Effects of time of initiation of antiretroviral therapy in the treatment of patients with HIV/TB co-infection: A systemic review and meta-analysis. Ann. Med. Surg. 2020, 55, 148–158. [Google Scholar] [CrossRef]
- Saha, D.; Pal, A.; Sarkar, N.; Das, D.; Blackard, J.T.; Guha, S.K.; Saha, B.; Chakravarty, R. Occult hepatitis B virus infection in HIV positive patients at a tertiary healthcare unit in eastern India. PLoS ONE 2017, 12, e0179035. [Google Scholar] [CrossRef]
- Han, Y.; Zeng, A.; Liao, H.; Liu, Y.; Chen, Y.; Ding, H. The efficacy and safety comparison between tenofovir and entecavir in treatment of chronic hepatitis B and HBV related cirrhosis: A systematic review and Meta-analysis. Int. Immunopharmacol. 2017, 42, 168–175. [Google Scholar] [CrossRef]
- Limdi, J.K.; Hyde, G.M. Evaluation of abnormal liver function tests. Postgrad. Med. J. 2003, 79, 307–312. [Google Scholar] [CrossRef]
- McGovern, B.H.; Golan, Y.; Lopez, M.; Pratt, D.; Lawton, A.; Moore, G.; Epstein, M.; Knox, T.A. The impact of cirrhosis on CD4+ T cell counts in HIV-seronegative patients. Clin. Infect. Dis. 2007, 44, 431–437. [Google Scholar] [CrossRef]
- Dusingize, J.C.; Hoover, D.R.; Shi, Q.; Mutimura, E.; Rudakemwa, E.; Ndacyayisenga, V.; Gakindi, L.; Mulvihill, M.; Sinayobye, J.D.; Musabeyezu, E.; et al. Association of Abnormal Liver Function Parameters with HIV Serostatus and CD4 Count in Antiretroviral-Naive Rwandan Women. AIDS Res. Hum. Retrovir. 2015, 31, 723–730. [Google Scholar] [CrossRef]
- Mupfumi, L.; Moyo, S.; Molebatsi, K.; Thami, P.K.; Anderson, M.; Mogashoa, T.; Iketleng, T.; Makhema, J.; Marlink, R.; Kasvosve, I.; et al. Correction: Immunological non-response and low hemoglobin levels are predictors of incident tuberculosis among HIV-infected individuals on Truvada-based therapy in Botswana. PLoS ONE 2018, 13, e0198711. [Google Scholar] [CrossRef]
- Gaardbo, J.C.; Hartling, H.J.; Gerstoft, J.; Nielsen, S.D. Incomplete immune recovery in HIV infection: Mechanisms, relevance for clinical care, and possible solutions. Clin. Dev. Immunol. 2012, 2012, 670957. [Google Scholar] [CrossRef]
- DAIDS. Division of AIDS (DAIDS) Table for Grading the Severity of Adult and Pediatric Adverse Events; Division of AIDS: Bethesda, MD, USA, 2017. [Google Scholar]
- Anon. AST to Platelet Ratio Index (APRI) Calculator. Available online: https://www.hepatitisc.uw.edu/page/clinical-calculators/apri (accessed on 28 February 2020).
- Anon. Fibrosis-4 (FIB-4) Calculator. Available online: https://www.hepatitisc.uw.edu/page/clinical-calculators/fib-4 (accessed on 28 August 2020).
- WHO. Guidelines for the Prevention, Care and Treatment of Persons with Chronic Hepatitis B Infection; WHO: Geneva, Switzerland, 2015; p. 29. [Google Scholar]
- Patel, P.; Davis, S.; Tolle, M.; Mabikwa, V.; Anabwani, G. Prevalence of hepatitis B and hepatitis C coinfections in an adult HIV centre population in Gaborone, Botswana. Am. J. Trop. Med. Hyg. 2011, 85, 390–394. [Google Scholar] [CrossRef]
- Coffie, P.A.; Egger, M.; Vinikoor, M.J.; Zannou, M.; Diero, L.; Patassi, A.; Kuniholm, M.H.; Seydi, M.; Bado, G.; Ocama, P.; et al. Trends in hepatitis B virus testing practices and management in HIV clinics across sub-Saharan Africa. BMC Infect. Dis. 2017, 17, 706. [Google Scholar] [CrossRef]
- Bajpai, V.; Gupta, E.; Kundu, N.; Sharma, S.; Shashtry, S. Hepatitis B Core Antibody Negativity in a Chronic Hepatitis B Infected Patient: Report of an Unusual Serological Pattern. J. Clin. Diagn. Res. 2017, 11, 4–6. [Google Scholar] [CrossRef]
- Nhamoyebonde, S.; Leslie, A. Biological differences between the sexes and susceptibility to tuberculosis. J. Infect. Dis. 2014, 209 (Suppl. S3), S100–S106. [Google Scholar] [CrossRef]
- Watkins, R.E.; Plant, A.J. Does smoking explain sex differences in the global tuberculosis epidemic? Epidemiol. Infect. 2006, 134, 333–339. [Google Scholar] [CrossRef]
- Fish, E.N. The X-files in immunity: Sex-based differences predispose immune responses. Nat. Rev. Immunol. 2008, 8, 737–744. [Google Scholar] [CrossRef]
- Fenner, L.; Atkinson, A.; Boulle, A.; Fox, M.P.; Prozesky, H.; Zürcher, K.; Ballif, M.; Furrer, H.; Zwahlen, M.; Davies, M.A.; et al. HIV viral load as an independent risk factor for tuberculosis in South Africa: Collaborative analysis of cohort studies. J. Int. AIDS Soc. 2017, 20, 21327. [Google Scholar] [CrossRef]
- Kerkhoff, A.D.; Wood, R.; Cobelens, F.G.; Gupta-Wright, A.; Bekker, L.G.; Lawn, S.D. The predictive value of current haemoglobin levels for incident tuberculosis and/or mortality during long-term antiretroviral therapy in South Africa: A cohort study. BMC Med. 2015, 13, 70. [Google Scholar] [CrossRef]
- Hussien, B.; Hussen, M.M.; Seid, A.; Hussen, A. Nutritional deficiency and associated factors among new pulmonary tuberculosis patients of Bale Zone Hospitals, southeast Ethiopia. BMC Res. Notes 2019, 12, 751. [Google Scholar] [CrossRef]
- Hanrahan, C.F.; Golub, J.E.; Mohapi, L.; Tshabangu, N.; Modisenyane, T.; Chaisson, R.E.; Gray, G.E.; McIntyre, J.A.; Martinson, N.A. Body mass index and risk of tuberculosis and death. AIDS 2010, 24, 1501–1508. [Google Scholar] [CrossRef]
- O’Hara, G.; Mokaya, J.; Hau, J.P.; Downs, L.O.; McNaughton, A.L.; Karabarinde, A.; Asiki, G.; Seeley, J.; Matthews, P.C.; Newton, R. Liver function tests and fibrosis scores in a rural population in Africa: A cross-sectional study to estimate the burden of disease and associated risk factors. BMJ Open 2020, 10, e032890. [Google Scholar] [CrossRef]
- Kilonzo, S.B.; Gunda, D.W.; Kashasha, F.; Mpondo, B.C. Liver Fibrosis and Hepatitis B Coinfection among ART Naïve HIV-Infected Patients at a Tertiary Level Hospital in Northwestern Tanzania: A Cross-Sectional Study. J. Trop. Med. 2017, 2017, 5629130. [Google Scholar] [CrossRef]
- Hawkins, C.; Christian, B.; Fabian, E.; Macha, I.; Gawile, C.; Mpangala, S.; Ulenga, N.; Thio, C.L.; Ammerman, L.R.; Mugusi, F.; et al. Brief Report: HIV/HBV Coinfection is a Significant Risk Factor for Liver Fibrosis in Tanzanian HIV-Infected Adults. J. Acquir. Immune. Defic. Syndr. 2017, 76, 298–302. [Google Scholar] [CrossRef]
- Vinikoor, M.J.; Sinkala, E.; Mweemba, A.; Zanolini, A.; Mulenga, L.; Sikazwe, I.; Fried, M.W.; Eron, J.J.; Wandeler, G.; Chi, B.H. Elevated AST-to-platelet ratio index is associated with increased all-cause mortality among HIV-infected adults in Zambia. Liver Int. 2015, 35, 1886–1892. [Google Scholar] [CrossRef]
- Maponga, T.G.; Andersson, M.I.; van Rensburg, C.J.; Arends, J.E.; Taljaard, J.; Preiser, W.; Glashoff, R.H. HBV and HIV viral load but not microbial translocation or immune activation are associated with liver fibrosis among patients in South Africa. BMC Infect. Dis. 2018, 18, 214. [Google Scholar] [CrossRef]
- Yang, X.; Su, B.; Zhang, X.; Liu, Y.; Wu, H.; Zhang, T. Incomplete immune reconstitution in HIV/AIDS patients on antiretroviral therapy: Challenges of immunological non-responders. J. Leukoc. Biol. 2020, 107, 597–612. [Google Scholar] [CrossRef]
- van Griensven, J.; Phirum, L.; Choun, K.; Thai, S.; De Weggheleire, A.; Lynen, L. Hepatitis B and C co-infection among HIV-infected adults while on antiretroviral treatment: Long-term survival, CD4 cell count recovery and antiretroviral toxicity in Cambodia. PLoS ONE 2014, 9, e88552. [Google Scholar] [CrossRef]
- Ku, N.S.; Oh, J.O.; Shin, S.Y.; Kim, S.B.; Kim, H.W.; Jeong, S.J.; Han, S.H.; Song, Y.G.; Kim, J.M.; Choi, J.Y. Effects of tuberculosis on the kinetics of CD4(+) T cell count among HIV-infected patients who initiated antiretroviral therapy early after tuberculosis treatment. AIDS Res. Hum. Retrovir. 2013, 29, 226–230. [Google Scholar] [CrossRef]
- Karo, B.; Krause, G.; Castell, S.; Kollan, C.; Hamouda, O.; Haas, W.; Group, C.H.S. Immunological recovery in tuberculosis/HIV co-infected patients on antiretroviral therapy: Implication for tuberculosis preventive therapy. BMC Infect. Dis. 2017, 17, 517. [Google Scholar] [CrossRef]
- Negash, H.; Legese, H.; Tefera, M.; Mardu, F.; Tesfay, K.; Gebresilasie, S.; Fseha, B.; Kahsay, T.; Gebrewahd, A.; Berhe, B. The effect of tuberculosis on immune reconstitution among HIV patients on highly active antiretroviral therapy in Adigrat general hospital, eastern Tigrai, Ethiopia; 2019: A retrospective follow up study. BMC Immunol. 2019, 20, 45. [Google Scholar] [CrossRef]
- Schomaker, M.; Egger, M.; Maskew, M.; Garone, D.; Prozesky, H.; Hoffmann, C.J.; Boulle, A.; Fenner, L.; IeDEA Southern Africa. Immune recovery after starting ART in HIV-infected patients presenting and not presenting with tuberculosis in South Africa. J. Acquir. Immune Defic. Syndr. 2013, 63, 142–145. [Google Scholar] [CrossRef]
Publisher’s Note: MDPI stays neutral with regard to jurisdictional claims in published maps and institutional affiliations. |
© 2020 by the authors. Licensee MDPI, Basel, Switzerland. This article is an open access article distributed under the terms and conditions of the Creative Commons Attribution (CC BY) license (http://creativecommons.org/licenses/by/4.0/).