Predicting Loneliness from Where and What People Do


Abstract
1. Introduction
2. Method
2.1. Participants
2.2. Measures
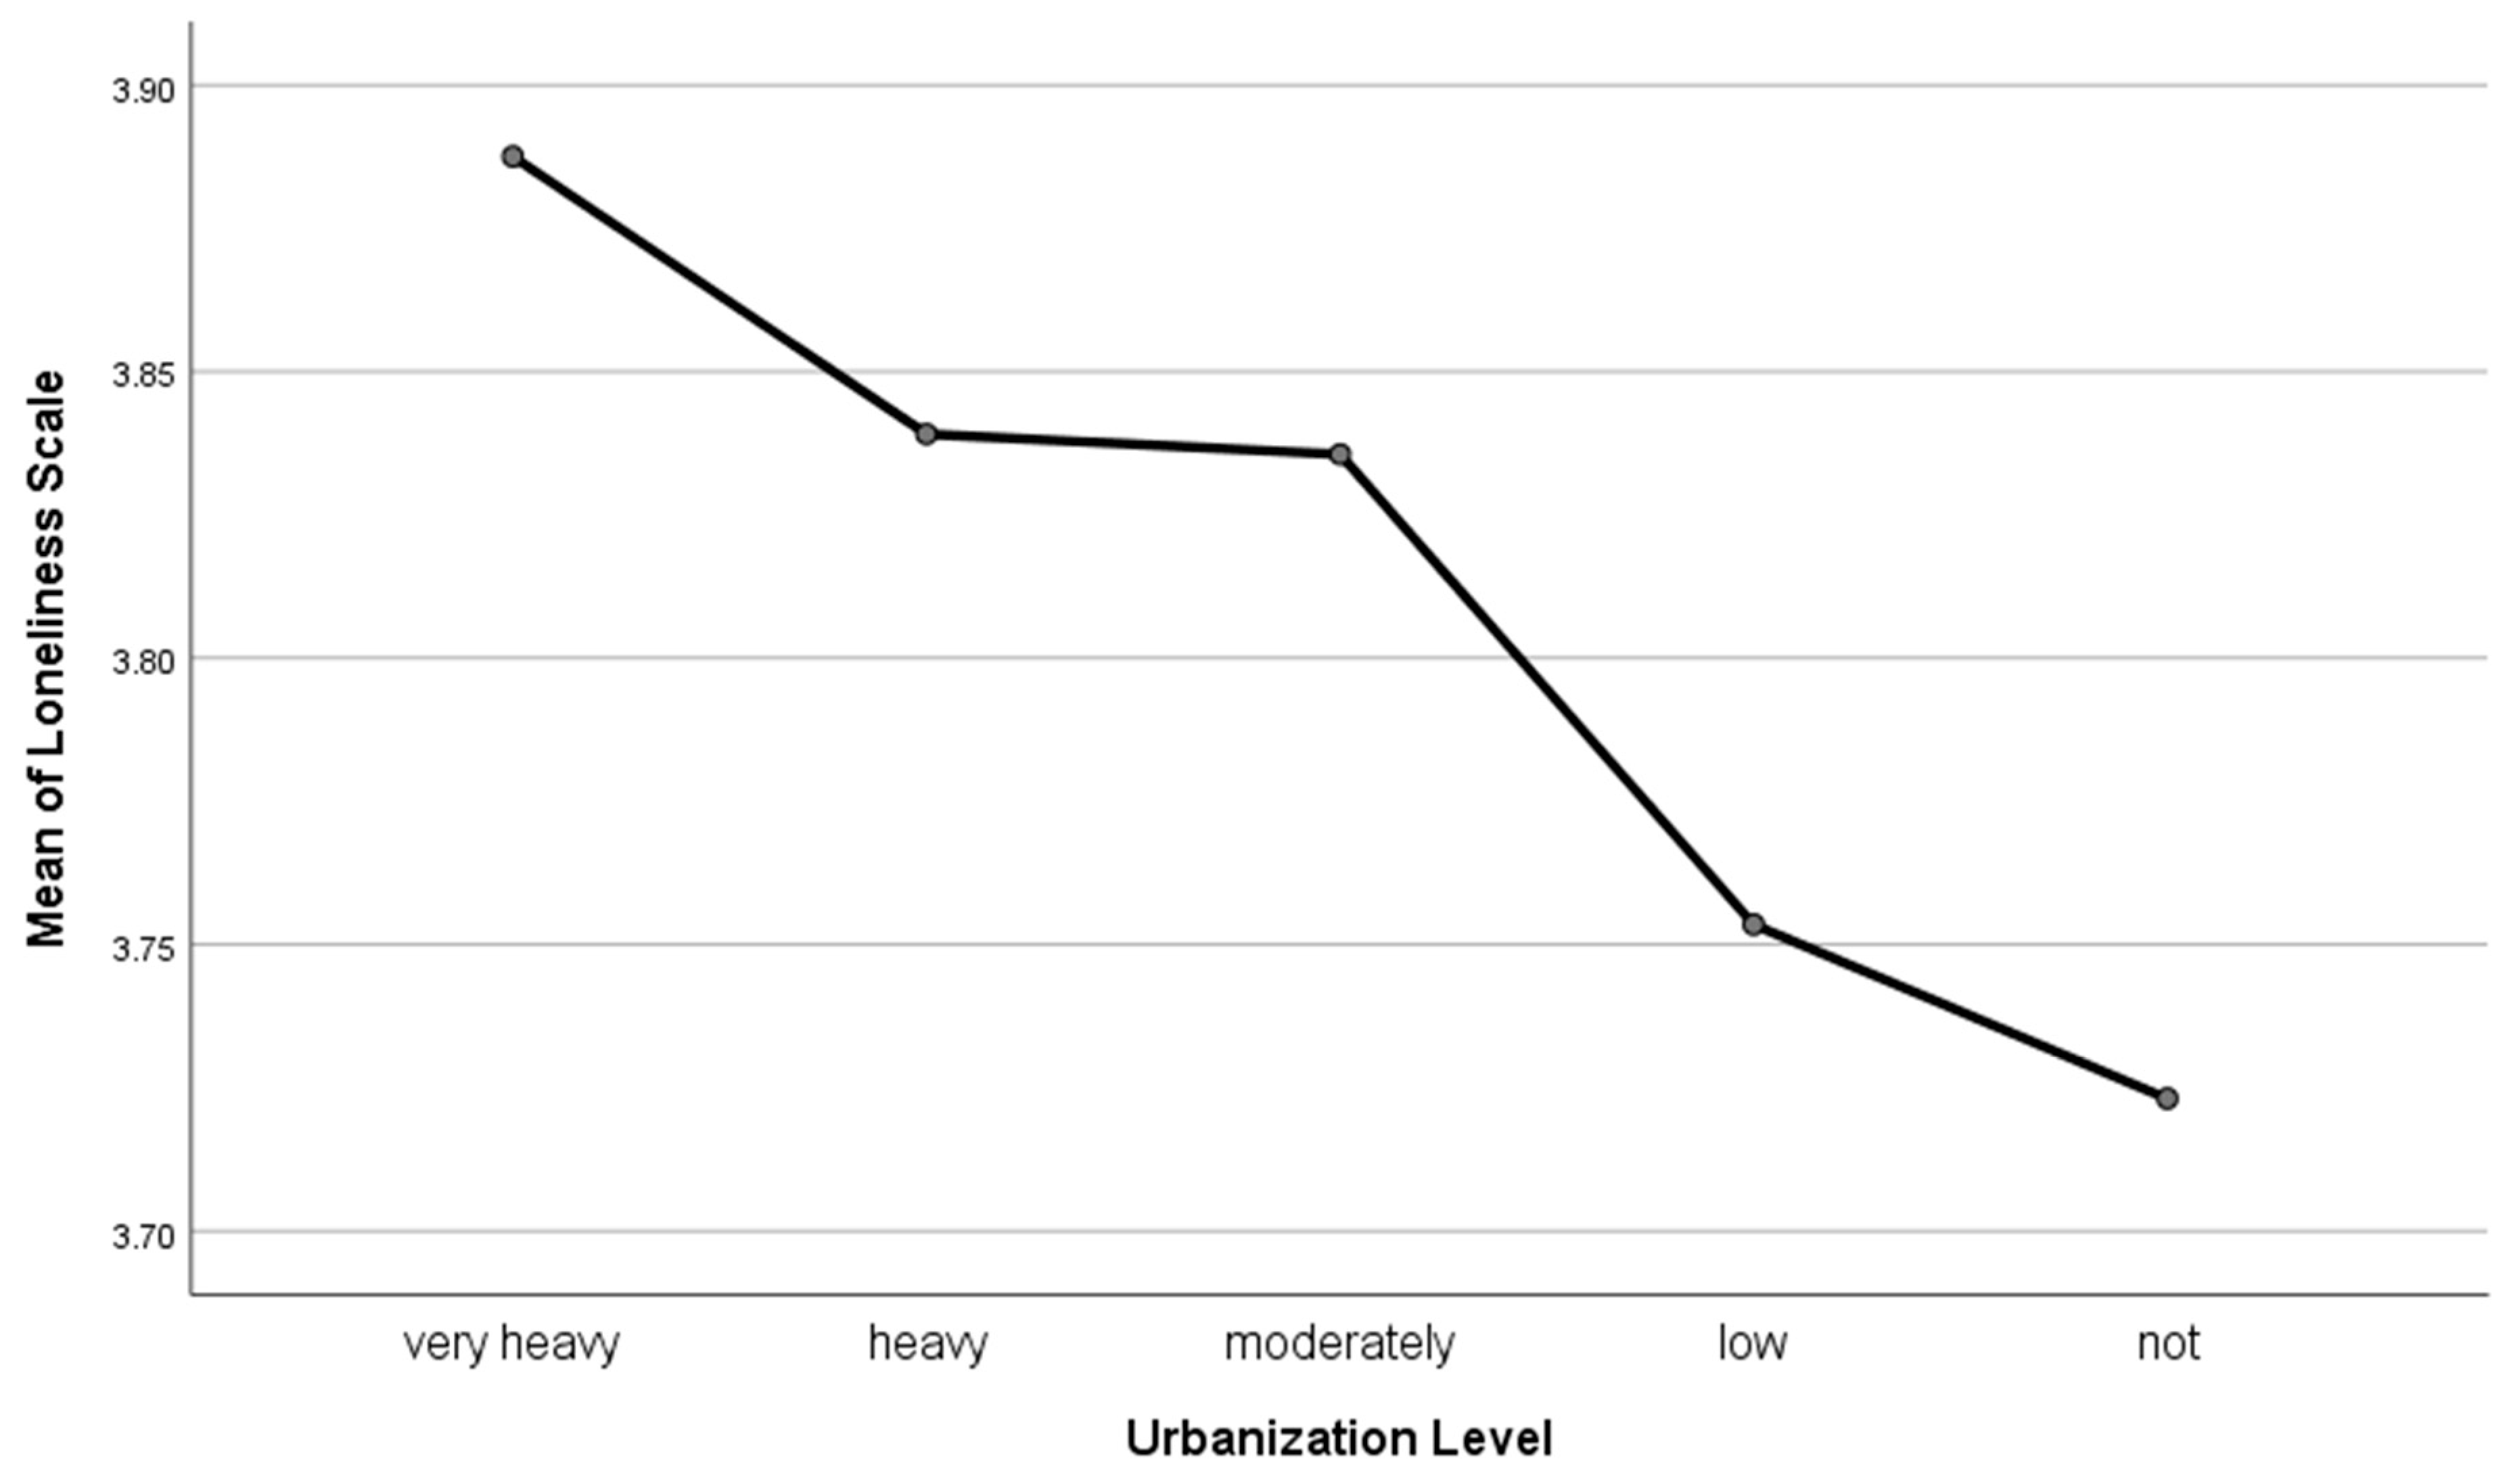
3. Results
Predicting Loneliness
4. Discussion
5. Limitations and Future Directions
6. Conclusions
Author Contributions
Funding
Acknowledgments
Conflicts of Interest
References
- Beere, Paul, Sally Keeling, and Hamish Jamieson. 2019. Ageing, loneliness, and the geographic distribution of New Zealand’s interRAI-HC cohort. Social Science & Medicine 227: 84–92. [Google Scholar]
- Boomsma, Dorret I., Gonneke Willemsen, Conor V. Dolan, Louise C. Hawkley, and John T. Cacioppo. 2005. Genetic and environmental contributions to loneliness in adults: The Netherlands Twin Register study. Behavior Genetics 35: 745–52. [Google Scholar] [CrossRef] [PubMed]
- Boomsma, Dorret I., Eco J. C. de Geus, Jacqueline M. Vink, Janine H. Stubbe, Marjin A. Distel, Jouke-Jan Hottenga, Danielle Posthuma, Toos C. E. M. van Beijesterveldt, James J. Hudziak, Meike Bartels, and et al. 2006. Netherlands twin register: From twins to twin families. Twin Research and Human Genetics 9: 849–57. [Google Scholar] [CrossRef] [PubMed]
- Burholt, Vanessa, and Thomas Scharf. 2014. Poor Health and Loneliness in Later Life: The Role of Depressive Symptoms, Social Resources, and Rural Environments. Journals of Gerontology, Series B: Psychological Sciences and Social Sciences 69: 311–24. [Google Scholar] [CrossRef] [PubMed]
- Cacioppo, John T., Louise C. Hawkley, L. Elizabeth Crawford, John M. Ernst, Mary H. Burleson, Ray B. Kowalewski, William B. Malarkey, Eve Van Cauter, and Gary G. Berntson. 2002. Loneliness and health: Potential mechanisms. Psychosomatic Medicine 64: 407–17. [Google Scholar] [CrossRef] [PubMed]
- Casale, Silvia, and Giulia Fioravanti. 2011. Psychosocial correlates of internet use among Italian students. International Journal of Psychology 46: 288–98. [Google Scholar] [CrossRef]
- Centraal Bureau voor de Statistiek (CBS). 2006. Kerncijfers postcodegebieden 2004. Available online: https://www.cbs.nl/nl-nl/publicatie/2006/08/kerncijfers-postcodegebieden-2004 (accessed on 24 February 2006).
- Chang, Qingsong, Chee Hon Chan, and Paul S. F. Yip. 2017. A meta-analytic review on social relationships and suicidal ideation among older adults. Social Science & Medicine 191: 65–76. [Google Scholar]
- Conde-Sala, Josep L., Josep Garre-Olmo, Laia Calvó-Perxas, Oriol Turró-Garriga, and Joan Vilalta-Franch. 2019. Course of depressive symptoms and associated factors in people aged 65+ in Europe: A two-year follow-up. Journal of Affective Disorders 245: 440–50. [Google Scholar] [CrossRef]
- Finlay, Jessica M., and Lindsay C. Kobayashi. 2018. Social isolation and loneliness in later life: A parallel convergent mixed-methods case study of older adults and their residential contexts in the Minneapolis metropolitan area, USA. Social Science & Medicine 208: 25–33. [Google Scholar]
- Hamid, P. Nicholas, and David P. P. Lok. 2000. Loneliness in Chinese adolescents: A comparison of social support and interpersonal trust in 13 to 19 year olds. International Journal of Adolescence and Youth 8: 45–63. [Google Scholar] [CrossRef]
- Hunt, Melissa G., Rachel Marx, Courtney Lipson, and Jordyn Young. 2018. No more FOMO: Limiting social media decreases loneliness and depression. Journal of Social and Clinical Psychology 37: 751–68. [Google Scholar] [CrossRef]
- Joiner, Thomas E., Jr., and M. David Rudd. 1996. Disentangling the interrelations between hopelessness, loneliness, and suicidal ideation. Suicide and Life-Threatening Behavior 26: 19–26. [Google Scholar] [PubMed]
- Jones, Warren H., J. E. Freemon, and Ruth Ann Goswick. 1981. The persistence of loneliness: Self and other determinants. Journal of Personality 49: 27–48. [Google Scholar] [CrossRef]
- Jones, Dee A., Christina R. Victor, and Norman J. Vetter. 1985. The problem of loneliness in the elderly in the community: Characteristics of those who are lonely and the factors related to loneliness. Journal of the Royal College of General Practitioners 35: 136–39. [Google Scholar] [PubMed]
- Karmakar, Asmita, and Souvik Raychaudhuri. 2015. Loneliness & Depression: An Urban Syndrome? International Journal of Indian Psycholog 2: 174–82. [Google Scholar]
- Khamis, Harry. 2008. Measures of association. How to choose? Journal of Diagnostic Medical Sonography 24: 155–62. [Google Scholar] [CrossRef]
- Kim, Junhyoung, Jinmoo Heo, In Heok Lee, and Jun Kim. 2015. Predicting personal growth and happiness by using serious leisure model. Social Indicators Research 122: 147–57. [Google Scholar] [CrossRef]
- Lampinen, P., R. L. Heikkinen, M. Kauppinen, and E. Heikkinen. 2006. Activity as a predictor of mental well-being among older adults. Aging and Mental Health 10: 454–66. [Google Scholar] [CrossRef]
- Layland, Eric K., Brian J. Hill, and Larry J. Nelson. 2018. Freedom to explore the self: How emerging adults use leisure to develop identity. Journal of Positive Psychology 13: 78–91. [Google Scholar] [CrossRef]
- Lucas, Gale M., Megan L. Knowles, Wendi L. Gardner, Daniel C. Molden, and Valerie E. Jefferis. 2010. Increasing social engagement among lonely individuals: The role of acceptance cues and promotion motivations. Personality and Social Psychology Bulletin 36: 1346–59. [Google Scholar] [CrossRef]
- Luhmann, Maike, Felix D. Schönbrodt, Louise C. Hawkley, and John T. Cacioppo. 2015. Loneliness and social behaviours in a virtual social environment. Cognition and Emotion 29: 548–58. [Google Scholar] [CrossRef]
- Maes, Marlies, Stefanie A. Nelemans, Sofie Danneel, Belén Fernández-Castilla, Wim Van den Noortgate, Luc Goossens, and Janne Vanhalst. 2019. Loneliness and social anxiety across childhood and adolescence: Multilevel meta-analyses of cross-sectional and longitudinal associations. Developmental Psychology 55: 1548. [Google Scholar] [CrossRef] [PubMed]
- Nowland, Rebecca, Elizabeth A. Necka, and John T. Cacioppo. 2018. Loneliness and social internet use: Pathways to reconnection in a digital world? Perspectives on Psychological Science 13: 70–87. [Google Scholar] [CrossRef] [PubMed]
- Peen, Jaap, Robert A. Schoevers, A. T. Beekman, and Jack Dekker. 2010. The current status of urban-rural differences in psychiatric disorders. Acta Psychiatrica Scandinavica 121: 84–93. [Google Scholar] [CrossRef] [PubMed]
- Peltzer, Karl, and Supa Pengpid. 2017. Loneliness: Its correlates and associations with health risk behaviours among university students in 25 countries. Journal of Psychology in Africa 27: 247–55. [Google Scholar] [CrossRef]
- Perlman, Daniel, and Letitia A. Peplau. 1981. Toward a Social Psychology of Loneliness. In Personal Relationships in Disorder. Edited by Steve Duck and Robin Gilmour. London: Academic Press, pp. 31–56. [Google Scholar] [CrossRef]
- Pinquart, Martin, and Silvia Sörensen. 2001. Influences on loneliness in older adults: A meta-analysis. Basic and Applied Social Psychology 23: 245–66. [Google Scholar] [CrossRef]
- Queen, Tara L., Robert S. Stawski, Lindsay H. Ryan, and Jacqui Smith. 2014. Loneliness in a day: Activity engagement, time alone, and experienced emotions. Psychology and Aging 29: 297–305. [Google Scholar] [CrossRef]
- Romans, Sarah, Marsha Cohen, and Tonia Forte. 2011. Rates of depression and anxiety in urban and rural Canada. Social Psychiatry and Psychiatric Epidemiology 46: 567–75. [Google Scholar] [CrossRef]
- Russell, Dan, Letitia. A. Peplau, and Carolyn E. Cutrona. 1980. The revised UCLA loneliness scale: Concurrent and discriminant validity evidence. Journal of Personality and Social Psychology 39: 472–80. [Google Scholar] [CrossRef]
- Schermer, Julie A., and Nicholas G. Martin. 2019. A behavior genetic analysis of personality and loneliness. Journal of Research in Personality 78: 133–37. [Google Scholar] [CrossRef]
- Stokes, Joseph P. 1985. The relation of social network and individual difference variables to loneliness. Journal of Personality and Social Psychology 48: 981–90. [Google Scholar] [CrossRef]
- Tam, Katy Y. Y., and Christian S. Chan. 2019. The effects of lack of meaning on trait and state loneliness: Correlational and experience-sampling evidence. Personality and Individual Differences 141: 76–80. [Google Scholar] [CrossRef]
- Toepoel, Vera. 2013. Ageing, leisure, and social connectedness: How could leisure help reduce social isolation of older people? Social Indicators Research 113: 355–72. [Google Scholar] [CrossRef] [PubMed]
- Twenge, Jean M., Gabrielle N. Martin, and W. Keith Campbell. 2018. Decreases in psychological well-being among American adolescents after 2012 and links to screen time during the rise of smartphone technology. Emotion 18: 765–80. [Google Scholar] [CrossRef] [PubMed]
- van Beek, Jenny H. D. A., Marleen H. M. de Moor, Lot M. Geels, Gonneke Willemsen, and Dorret I. Boomsma. 2014. Explaining individual differences in alcohol intake in adults: Evidence for genetic and cultural transmission? Journal of Studies on Alcohol and Drugs 75: 201–10. [Google Scholar] [CrossRef][Green Version]
- Van Deursen, Alexander J. A. M., Colin L. Bolle, Sabrina M. Hegner, and Piet A. M. Kommers. 2015. Modeling habitual and addictive smartphone behavior: The role of smartphone usage types, emotional intelligence, social stress, self-regulation, age, and gender. Computers in Human Behavior 45: 411–20. [Google Scholar] [CrossRef]
- Vancampfort, Davy, Garcia Ashdown-Franks, Lee Smith, Joseph Firth, Tine Van Damme, Lore Christiaansen, Brendon Stubbs, and Ai Koyanagi. 2019. Leisure-time sedentary behavior and loneliness among 148,045 adolescents aged 12–15 years from 52 low- and middle-income countries. Journal of Affective Disorders 251: 149–55. [Google Scholar] [CrossRef]
- Victor, Christina R., and Keming Yang. 2012. The prevalence of loneliness among adults: A case study of the United Kingdom. Journal of Psychology: Interdisciplinary and Applied 146: 85–104. [Google Scholar] [CrossRef]
- Wen, Ming, Louise C. Hawkley, and John T. Cacioppo. 2006. Objective and perceived neighborhood environment, individual SES and psychosocial factors, and self-rated health: An analysis of older adults in Cook County, Illinois. Social Science & Medicine 63: 2575–90. [Google Scholar]
- Willemsen, Gonneke, Danielle Posthuma, and Dorret I. Boomsma. 2005. Environmental factors determine where the Dutch live: Results from the Netherlands Twin Register. Twin Research and Human Genetics 8: 312–17. [Google Scholar] [CrossRef]
- Willemsen, Gonneke, Jacqueline M. Vink, Abdel Abdellaoui, Anouk den Braber, Jenny H. D. A. Van Beek, Harmen H. M. Draisma, Jenny van Dongen, Dennis van’t Ent, Lot M. Geels, Rene van Lien, and et al. 2013. The Adult Netherlands Twin Register: Twenty-five years of survey and biological data collection. Twin Research and Human Genetics 16: 271–81. [Google Scholar] [CrossRef]
- Yang, Chia-chen. 2016. Instagram use, loneliness, and social comparison orientation: Interact and browse on social media, but don’t compare. Cyberpsychology, Behavior, and Social Networking 19: 703–8. [Google Scholar] [CrossRef] [PubMed]
- Zhang, Shujie, Yu Tian, Yi Sui, Denghau Zhang, Jieru Shi, Peng Wang, Weixuan Meng, and Yingdong Si. 2018. Relationships between social support, loneliness, and internet addiction in Chinese postsecondary students: A longitudinal cross-lagged analysis. Frontiers in Psychology 9: 1707. [Google Scholar] [CrossRef] [PubMed]


| Activity | Mean (SD) | Most Common Response | Correlation with Loneliness |
|---|---|---|---|
| General leisure activity | |||
| Attend movies, theatre, a play, museum or concert | 2.00 (0.80) N = 6936 | 2 (a few times a year) 50.7% | −0.02 |
| Spend time in nature, go sightseeing or go to an amusement park or zoo | 2.09 (0.90) N = 6929 | 2 (a few times a year) 55.0% | −0.04 * |
| Go to a cafe, eat at a restaurant or go out dancing | 2.57 (1.19) N = 6925 | 2 (a few times a year) 40.2% | −0.03 * |
| Partake in activities such as neighborhood programs, hobby or social clubs or professional organizations | 2.08 (1.44) N = 6924 | 1 (hardly ever) 41.9% | −0.04 * |
| Specific leisure activity | |||
| Take part in physical sports | 1.93 (0.77) N = 6863 | 2 (1–2 h a week) 43.7% | −0.04 * |
| Take part in reading or mind sports | 2.21 (0.82) N = 6865 | 2 (1–2 h a week) 44.9% | 0.01 |
| Take part in listening to music | 2.47 (0.92) N = 6852 | 2 (1–2 h a week) 38.9% | 0.06 * |
| Take part in computer activities (games, Internet, etc.) | 2.37 (0.95) N = 6845 | 2 (1–2 h a week) 33.6% | 0.06 |
| Take part in watching TV | 2.98 (0.85) N = 6903 | 3 (5–10 h a week) 35.3% | 0.01 |
| Predictor | Standardized Beta | t |
|---|---|---|
| Age | −0.44 | −4.37 ** |
| Sex (1 = male, 2 = female) | 0.02 | 0.28 |
| Age2 | 0.35 | 4.34 ** |
| Age by Sex | 0.13 | 1.78 |
| Urbanization (1 = very heavy, 5 = not urban) | −0.05 | −3.12 ** |
| Movies, theatre, a play, museum or concert | −0.02 | −1.47 |
| Nature, sightseeing or amusement park or zoo | −0.04 | −2.28 * |
| Go to a cafe, eat at a restaurant or go out dancing | −0.02 | −0.91 |
| Neighborhood programs, hobby or social clubs or professional organizations | −0.03 | −2.28 * |
| Physical sports | −0.02 | −1.01 |
| Reading or mind sports | −0.02 | −1.15 |
| Listening to music | 0.03 | 1.59 |
| Computer activities (games, Internet, etc.) | 0.04 | 2.55 * |
| Watching TV | −0.01 | −0.63 |
© 2020 by the authors. Licensee MDPI, Basel, Switzerland. This article is an open access article distributed under the terms and conditions of the Creative Commons Attribution (CC BY) license (http://creativecommons.org/licenses/by/4.0/).
Share and Cite
MacDonald, K.J.; Willemsen, G.; Boomsma, D.I.; Schermer, J.A. Predicting Loneliness from Where and What People Do. Soc. Sci. 2020, 9, 51. https://doi.org/10.3390/socsci9040051
MacDonald KJ, Willemsen G, Boomsma DI, Schermer JA. Predicting Loneliness from Where and What People Do. Social Sciences. 2020; 9(4):51. https://doi.org/10.3390/socsci9040051
Chicago/Turabian StyleMacDonald, Kristi J., Gonneke Willemsen, Dorret I. Boomsma, and Julie Aitken Schermer. 2020. "Predicting Loneliness from Where and What People Do" Social Sciences 9, no. 4: 51. https://doi.org/10.3390/socsci9040051
APA StyleMacDonald, K. J., Willemsen, G., Boomsma, D. I., & Schermer, J. A. (2020). Predicting Loneliness from Where and What People Do. Social Sciences, 9(4), 51. https://doi.org/10.3390/socsci9040051