1. Introduction
The European Framework Program for Research and Innovation—Horizon 2020—sets transport as a priority area for research and intervention until 2020. The aim is to facilitate citizens’ mobility while reducing traffic congestion in cities, and to promote a more efficient and environmentally friendly use of resources (
European Commission 2017). Current passenger transport systems in most cities are overwhelmingly reliant on private cars. The risks of this dependence on cars—increased social and economic costs and environmental impacts—mean that cost-effective and less-polluting alternatives must be found to efficiently serve urban mobility. The provision of faster and more convenient public transport would make long urban journeys unnecessary and allow existing roads to be used more efficiently (
Chowdhury and Ceder 2016;
European Commission 2013;
Wardman 2014).
Many countries are investing heavily in public transport systems to make them more attractive, greener and more competitive than private cars (
European Environmental Agency 2013). However, a quantitative or qualitative increase in supply does not lead to a corresponding increase in the adoption of public transport per se. Barcelona, Berlin, London, Lisbon and Rome are examples of European cities where public transit agencies have intensified their efforts to improve supply, but the share of trips made by public transport continues to be lower than that of the private car (
Land Transport Authority 2011). This should serve as a warning to transit agencies of the need to find alternative policies that promote a shift from the private car to public transport service. The implementation of policies aimed at increasing public transport use requires a clear understanding of travel behaviors which influence the decision to use modes of transport other than the car, as well as passenger attitudes, expectations, needs, and the perception of the existing quality of the public transport service. Therefore, research that sheds light on these issues can be used by transit managers to draw up more effective strategies to improve passenger satisfaction, increase transit market share, and ultimately stimulate sustainable mobility in urban areas (
Beirão and Cabral 2007;
Fellesson and Friman 2008;
Fujii and Kitamura 2003).
The Metropolitan Authority of Lisbon Transport (MALT) is the state/public entity that is responsible for regulating and supervising mobility by road, river and rail transport and the related infrastructure within the metropolitan area of Lisbon (MAL). The MAL has long been identified as having a serious problem of traffic congestion and it therefore needs to implement actions and policies that reduce car dependency and encourage the use of public transport. Driven by this goal, the MALT requested a study to evaluate both the transit users’ perceptions of the quality and adequacy of the public transport service and a characterization of the mobility patterns of the transit population in the MAL. The goal was to gather information to support the definition of policies aimed at increasing public transport use. This paper presents data from the qualitative study undertaken, involving public transport users of different transport modes. The following questions guide the analysis: (i) how do public transport users perceive the service provided? (ii) how do public transport users perceive the service provided within different transport modes (road, railway, river)? and (iii) what aspects encourage or deter people from using public transport?
This paper is organized as follows. This Introduction is followed by a literature review focusing on factors affecting passengers’ perceptions of public transport service. The methodology is described in
Section 3 and the results are presented in
Section 4.
Section 5 completes the paper with the discussion and conclusion.
2. Literature Review
Transit users suffer the consequences of poor service quality and their judgment of service quality is therefore crucial. The perception of service quality is a subjective evaluation of the service provided, based on the interaction between the user and the service provider (
Eboli and Mazzulla 2007;
Zeithaml et al. 2006). The assessment of service quality involves identifying service parameters or attributes that directly affect the users’ perception. Quality of service parameters can be classified in two broad categories (
Das and Pandit 2013): quantitative parameters and qualitative parameters. The former includes quantifiable attributes like “travel time”, “waiting time”, “walking distance”, etc. The latter includes parameters that passengers can observe directly but cannot evaluate numerically; instead, the passenger expresses how “good” or “bad” they find the service (e.g., “driver/conductor behavior”, “safety and security”, “fare collection system”, “maintenance”, “information availability”) (
Kittelson & Associates, Inc. et al. 2003). The list of factors in each category is not closed and new factors are constantly being added to reflect the changes and improvements in public transport service, such as “route characteristics”, “administration of complaints”, “use of eco-friendly technology” (
Eboli and Mazzulla 2007), “supervision”, “co-passenger behavior” (
Andaleeb et al. 2007), “deviation from optimal route” (
dell’Olio et al. 2010), “frequency of buses during evening hours, during the day and on weekends” (
Hensher et al. 2010).
Researchers argue that users’ perceptions of quality of service vary because of situational circumstances (for example, urban vs rural context (
Taylor et al. 2009)), users’ personal needs (
Simons et al. 2014;
Levin 2019), their experience from service providers and their assessment of what can be delivered (
Das and Pandit 2013). Understanding this diversity is a complex task and different methodological approaches can be used. Although a survey-based approach has the benefit of working with large samples of individuals (e.g.,
Belwal and Belwal 2010;
De Witte et al. 2008;
Fellesson and Friman 2008;
Guirao et al. 2015;
van Exel and Rietveld 2010), its use of standardized closed-end questions limits the depth of the information gathered. Qualitative research does not give statistically robust findings, but it does permit an in-depth exploration of what people think, feel or do and, crucially, why. By allowing people to express themselves in their own words, the qualitative researcher finds out what is important for them, why they behave as they do and what barriers there may be to a change in their behavior (
Yin 2015).
Research on public transportation using qualitative methods has provided new insights leading to a better understanding of transit problems. Different qualitative techniques have played a substantial role in furthering our understanding of transport-related issues in the areas of travel behavior and mode choice, policy guidance, infrastructure, design and operation, attitudes and perceptions, passenger information systems and public consultation (
Grosvenor 2000). For example,
Beirão and Cabral (
2007) conducted 24 in-depth interviews with regular and occasional users of public transport and car users to gain insights into key factors influencing travel mode choice and attitudes towards transport. Their main conclusion was that public transport use could be increased if the levels of service demanded by passengers were provided.
Buys and Miller (
2011) explored Brisbane, Australia residents’ transportation practices and perceptions via 24 qualitative interviews. They concluded that transportation choices are explained through complex definitions of convenience based on three key aspects: time-efficiency, single versus multi-modal trips, and distance to and purpose of journey, as well as attitudinal, affective and symbolic elements related to transport mode use.
Carreira et al. (
2013) used qualitative interviews with 49 bus passengers to show that the passenger travel experience not only encompasses all moments of contact with the transportation service, but also aspects that the transportation provider does not control directly. Their outcomes suggest that transport providers and planners should pay attention to the overall passenger travel experience from a holistic view, and that transportation services should be carefully designed and managed in a systemic way. Moreover, service parameters that affect users’ perceptions of service quality vary for different cities depending on the service delivery environment and various local situational factors (
Cascajo et al. 2018;
Klein 2017;
Morton et al. 2016;
Taylor et al. 2009). A qualitative approach, using a set of individuals familiar with the city’s infrastructure, is the best way to give transit operators the knowledge of service parameters that affect perceived quality and desired quality (
Das and Pandit 2013).
3. Methodology
This study is based on a qualitative approach with two distinct but complementary stages of data collection:
- (1)
Ethnographic interviews: conducted with the purpose of gathering data, during a journey, on perceptions of public transport, critical aspects of transport service and daily travel routines based on interviews and observation.
- (2)
Focus group discussions: conducted with the objective of gathering information about the perception of the different transport modes and negative and positive aspects in the use of public transport.
As noted above, qualitative research is not about statistical significance but about gleaning a real understanding of people’s responses so as to identify what drives their decisions. As such, statistical representativeness was not a priority when selecting the samples and therefore generalizations should be made with caution.
3.1. Case Study: Metropolitan Area of Lisbon
The metropolitan area of Lisbon (MAL) is the focus of this research. The MAL is the largest metropolitan area in Portugal; it encompasses 18 municipalities spread over nearly 3000 km
2 with 2.8 million inhabitants (
Statistics Portugal 2011). The municipality of Lisbon is the geographic center of MAL. The public transport service in this area includes road, railway (both subway and over ground) and river transport. The bus is the most used mode, with over 50% of public transport users commuting by bus in 2010; it is followed by the subway (22% of transport users) (
MALT 2014a,
2014b).
The public transport system in MAL has a mixture of public and market/private governance. The public authority controls the network design and service offered and delegates only some specific parts of the service to private firms. While the subway and river transport are provided solely by public operators, road and over ground train transport is provided by both private and public operators. In recent decades, MAL has made considerable investments in the public transport system; more specifically, the subway network was extended, a railway service was introduced connecting the two margins of the River Tagus, and the bus fleet was modernized. However, the improvements to the transport system have not been accompanied by positive changes in mobility patterns into and within the MAL. From 1991 to 2011, trips made by public transport (bus, subway or tram) decreased from 51% to 28% of total trips made. Moreover, whereas less than 25% of all commuting trips were made by car in 1991, this figure rose to 54% in 2011; similarly, the percentage of commuting trips on foot fell from 21% in 1991 to 15% in 2011.
3.2. Ethnographic Interviews
3.2.1. Participants
Ethnographic interviews were conducted with public transport users within the municipality of Lisbon and in the inner Lisbon suburbs over a four-day period. The sample size was set at 18 participants because this was the minimum to assure the sample had at least one transport user: (i) from each type of public transport mode—road, railway, and river; (ii) from each type of governance—public and private operators; and (iii) with diverse urban journeys—into and within the municipality of Lisbon. Participants were purposively selected to guarantee sample composition with the characteristics described. A detailed description of the participants is presented in
Table A1 in the
Appendix A.
3.2.2. Procedure
Each participant was accompanied by an interviewer during his/her usual trip to work or other destination. Approximately half of the ethnographic interviews took place in the morning. The remaining interviews were conducted in the evening when the interviewer accompanied each participant on his/her way back home.
The interviews were semi-structured with a predefined observation guide and an interview guide, and they took on average around 50 min. The observation guide included recording timetables, duration of the journey, the condition of the stops/stations, ticketing process, ease of access to the transport, travel conditions (environment, noise, comfort …), and vehicle capacity. The interview guide included questions on participants’ transport routines, reasons and motives for the use of transport, as well as its advantages and disadvantages, general image and perception of the different modes of transport, problems and suggestions for improvements. The interview guide is presented in the
Appendix A.
The outputs from ethnographic interviews were used to build some of the dynamics of the focus groups discussions.
3.3. Focus Groups
3.3.1. Participants
The planned sample included six focus groups, with the possibility of increasing this if the research team realized during data collection that this was necessary to reach saturation. The literature on qualitative methodologies (e.g.,
Guest and MacQueen 2008;
Guest et al. 2006,
2017) suggests that nearly 80%–90% of issues in a research topic can be revealed with up to six focus groups; this rule guided our sample sizing. The definition of “data saturation” by
Guest et al. (
2006) was adopted: “the point in data collection and analysis when new information produces little or no change to the codebook.” Geographical “stratification” was also taken into consideration when sizing the sample: three focus groups should be conducted with residents in the North Metropolitan Area of Lisbon and the same number with residents in the South Metropolitan Area of Lisbon.
The final sample had six focus groups and a total of 42 participants who were selected using a snowball sampling procedure. Most participants were regular (often daily) travelers within the MAL, either by public transport or using both public transport and their own car. Within each group, a diversity of ages was guaranteed.
3.3.2. Procedure
The focus groups met at a specialized facility, divided into two areas separated by a one-way mirror. The members of the research team observed the focus group discussions from the other side of the mirror. Each focus group had a facilitator and a co-facilitator who had received prior training. The discussions were guided by a semi-structured interview script that had been tested previously with a group of regular and non-regular public transport users. The facilitator led the discussion in each focus group, while the co-facilitator kept an audio record and observation notes on relevant non-verbal interaction.
The discussion focused on: (1) the perception of the different transport modes; (2) the perception of transport users, and (3) the negative and positive aspects of using public transport. The three types of transport mode were discussed in all the South MAL groups; however, it only made sense to discuss the road and railway transport modes with the groups from North MAL. Each focus group discussion lasted on average 1 h 15 min. The detailed interview script can be found in the
Appendix A.
3.4. Data Analysis
All the ethnographic interviews and the focus groups interviews were audio-taped; they were then transcribed and analyzed using content analysis techniques.
A qualitative thematic analysis was used for both ethnographic interviews and focus groups to find repeated patterns of meanings across the participants’ descriptions (
Bazeley 2013). In general, we used an inductive approach to determine the categories of analysis (
Ghiglione and Matalon 2005). During the data analysis process, each relevant segment was assigned to a category. If the content of a segment was not covered in the existing categories, a new category was created. To determine the frequencies of the categories, we considered just one occurrence per person as this ensures a clearer understanding of the data. For example, if one participant mentioned the same category three times and another mentioned it once, we considered one occurrence in both cases.
In focus group interviews, data saturation was reached with five focus groups. Nevertheless, we went ahead with the sixth focus group because the participants had already been contacted and agreed to attend. However, the discussion did not add any novelty to the set of perceptions about public transport service already revealed by the previous five discussions.
4. Results
This section presents the main findings of the study. The two sources of data—ethnographic interviews and focus groups—are merged to provide the outcomes. The results are organized as follows: (i) the general perception of the public transport service; (ii) the perception of the public transport by mode (including their typical users); and (iii) the use of transport, which includes an evaluation of barriers and drivers to public transport use.
4.1. General Perception of the Public Transport Service
Qualitative data analysis revealed three main factors affecting the users’ general perception of public transport: availability, convenience, and cost.
4.1.1. Availability
Respondents perceive the transport service as reasonably good in rush hours and for those who have a typical working routine: “For most people using public transport, especially to go to and from work, I think it works well … there are no delays, there are not many problems.” (22-year-old female regular user of river transport). But availability can be a problem for people working at non-typical hours (very early in the morning, very late in the evening and weekends): “Outside of rush hours and on weekends, it is terrible …” (27-year-old male regular user of rail transport).
Some non-regular users mention they prefer the car if they must make several trips during the day due to the poor coverage of the transport network: “If I came by public transport and had to go to several places, it would be impossible, because there is no transit service” (Focus Group 1).
4.1.2. Convenience
Respondents reported that their choice for a specific mode of transport is based on: (i) its proximity to their home and/or workplace: “I have it where I live …” (Focus Group 2); “In my case, the subway is very near my house” (Focus Group 2); “I go by bus because it’s close to my home, basically that’s it” (Focus Group 2); and (ii) ease of travel: “For me it’s direct, I don’t have to change; in forty-five minutes, I’m there.” (Focus Group 1); “It’s fast, it’s safe, I don’t have to take any other transport; I get off the subway at the nearest station and then I walk.” (Focus Group 4); “I prefer to come by train because I know I won’t be late, don’t catch traffic.” (Focus Group 3).
4.1.3. Cost
Opinions on the cost of public transport vs. private car were divided. On one hand, some participants considered public transport less expensive than the car: “… it is more affordable than driving everywhere” according to a 69-year-old female who is a regular user of subway transport; “… although expensive, it is the cheapest way to travel.” (Focus Group 4). Although the car is frequently associated to more comfort and greater freedom and flexibility of route, it is also associated with higher cost and difficult parking: “Bringing the car … the parking problem and the money I’d spend on parking, at the end of the month would cost more than the monthly transport ticket.” (Focus Group 3). On the other hand, others stated that the amount spent monthly on public transport is very high (“… some of the hardest money to spend every month.” (Focus Group 6); “I have a friend who used the subway, but the cost of the metro and going by car was the same … so she started coming by car every day” (Focus Group 2).
4.2. General Perception of the Public Transport Service by Mode
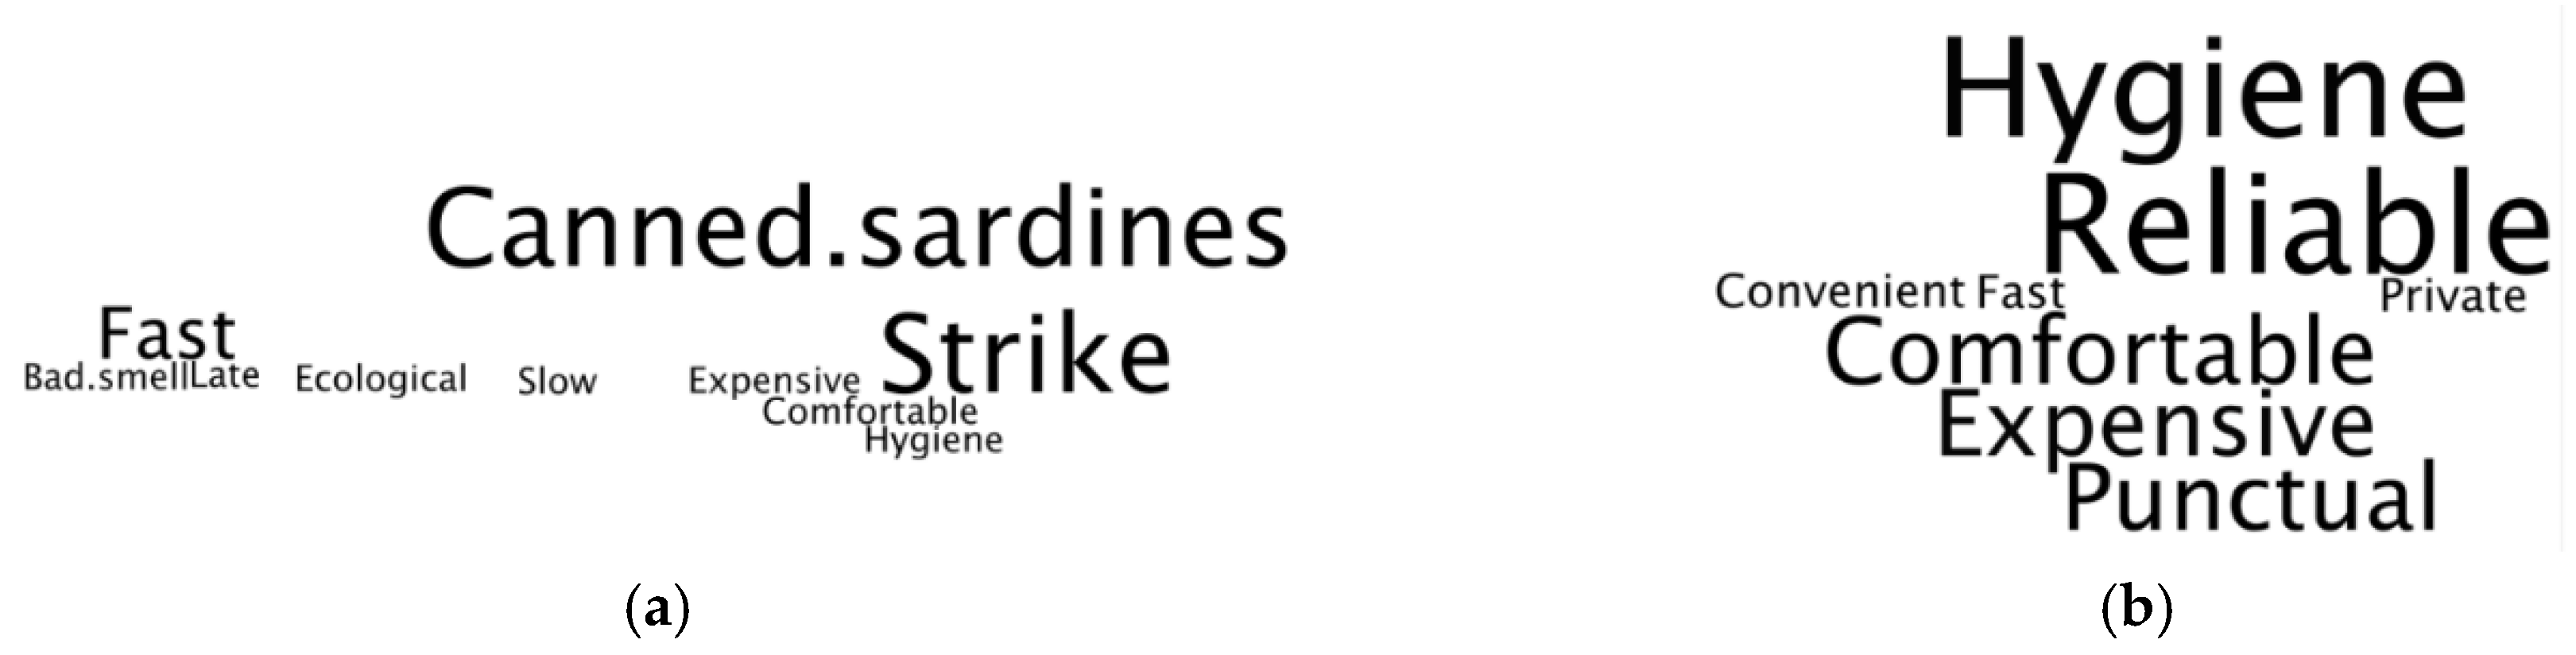
To access and explore the perception of each mode of transport, the semantic fields associated with the different modes of transport were analyzed and plotted in word clouds—the more a specific word appears in textual data obtained from focus groups discussions, the bigger and bolder it appears in the word cloud.
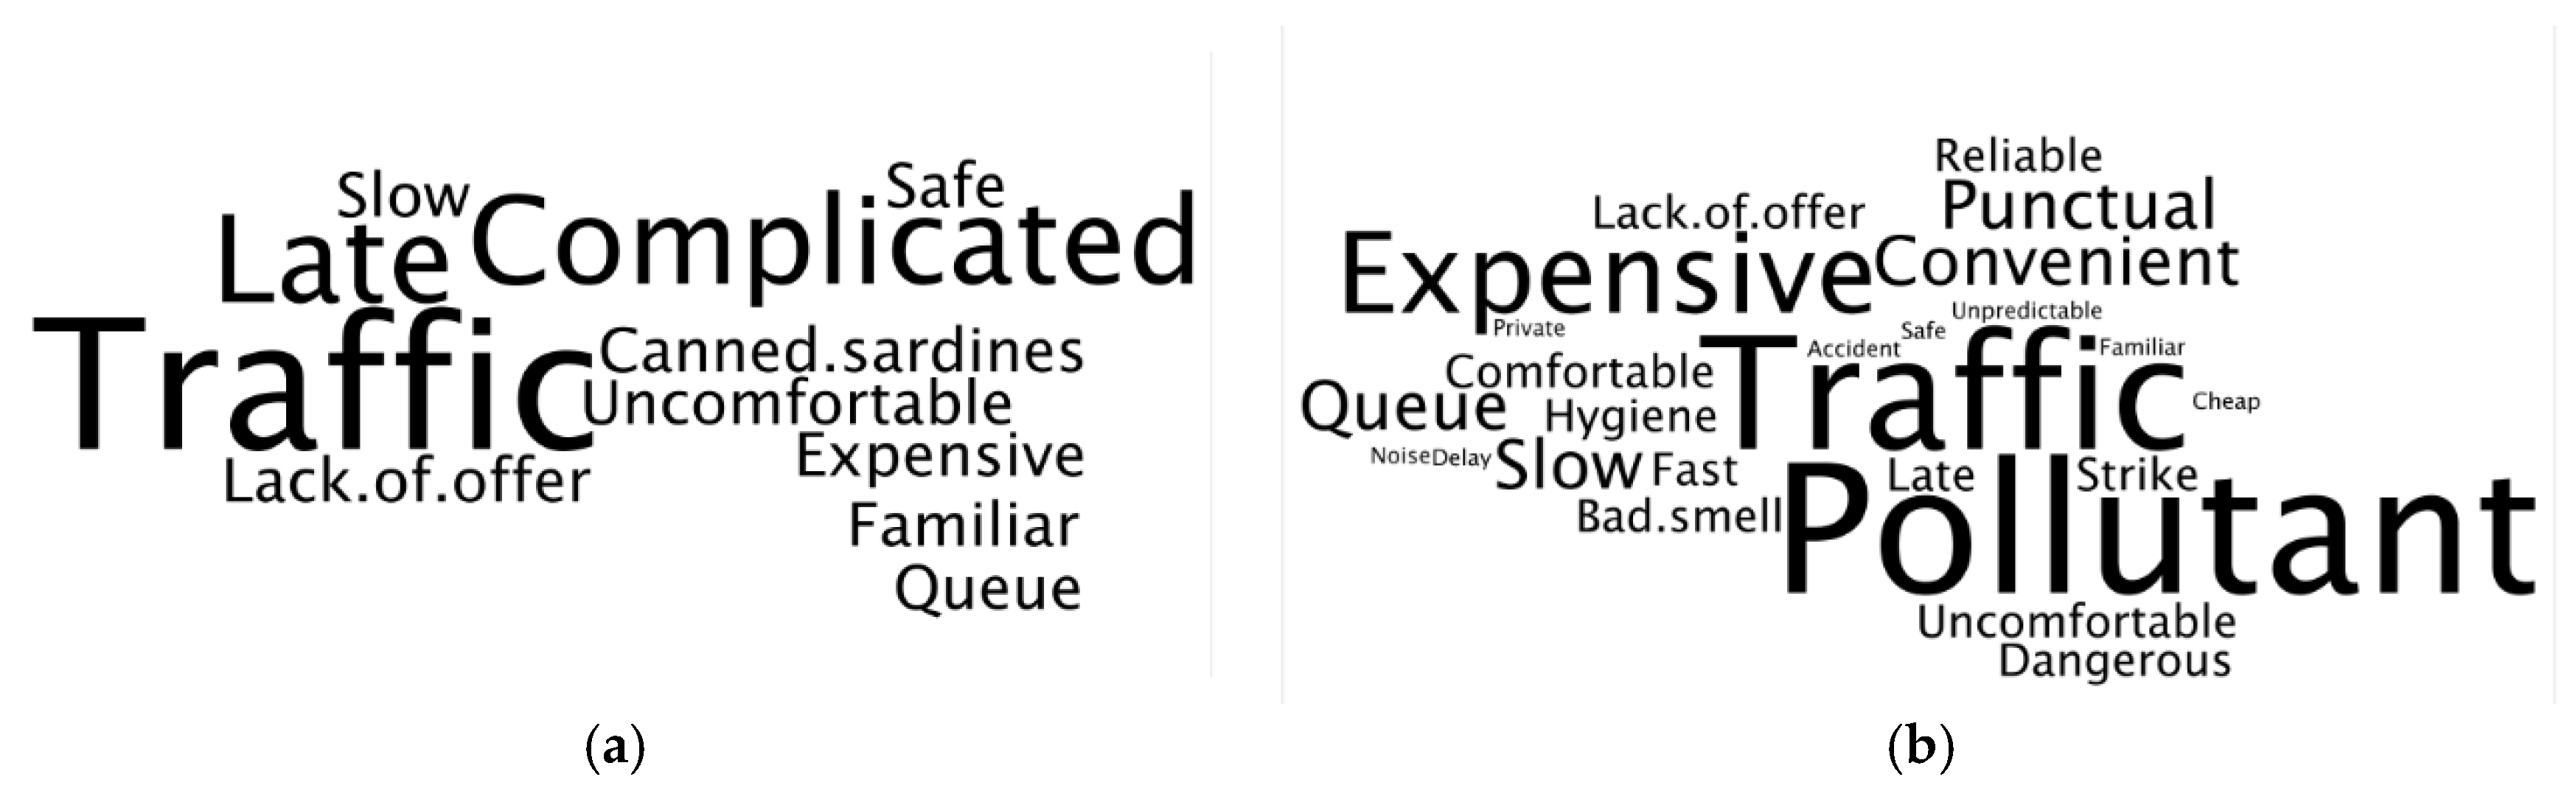
Figure 1 presents the word cloud related to road transport and compares road transport inside and outside Lisbon municipality.
“Traffic”, “Late” and “Complicated” are the three words that stand out in the cloud for road transport inside Lisbon municipality. They show that public transport users have a negative perception of the bus service. The first two concepts are interrelated because the excessive traffic in Lisbon is often a cause for buses being delayed (i.e., arriving later than scheduled). Additionally, transit users regard road transport as “complicated” because it is difficult to understand the routes and connections within the bus network (
Figure 1a). Transit users outside Lisbon municipality mainly use the words “Pollutant”, “Traffic” and “Expensive” to describe road transport (
Figure 1b). Many transit users find the buses old and in bad condition, linking this with the pollution problem.
Whereas the over ground train transport corresponds to public suburban trains inside Lisbon municipality, outside Lisbon municipality it corresponds to a single private suburban train company that operates from/to the South Metropolitan Area of Lisbon (connecting the two margins of the River Tagus). Findings show very different perceptions for the two situations. Inside Lisbon municipality, the expressions used by transit users to describe over ground trains are “Canned sardines”, to indicate overcrowding, and “Strike”; the third most prominent word is “Fast” (
Figure 2a). For the trains outside Lisbon municipality, the most prominent words are “Hygiene” and “Reliable”. “Comfortable” and “Punctual”, which overall is very positive although “Expensive” completes the users’ perception of this mode of transport (
Figure 2b).
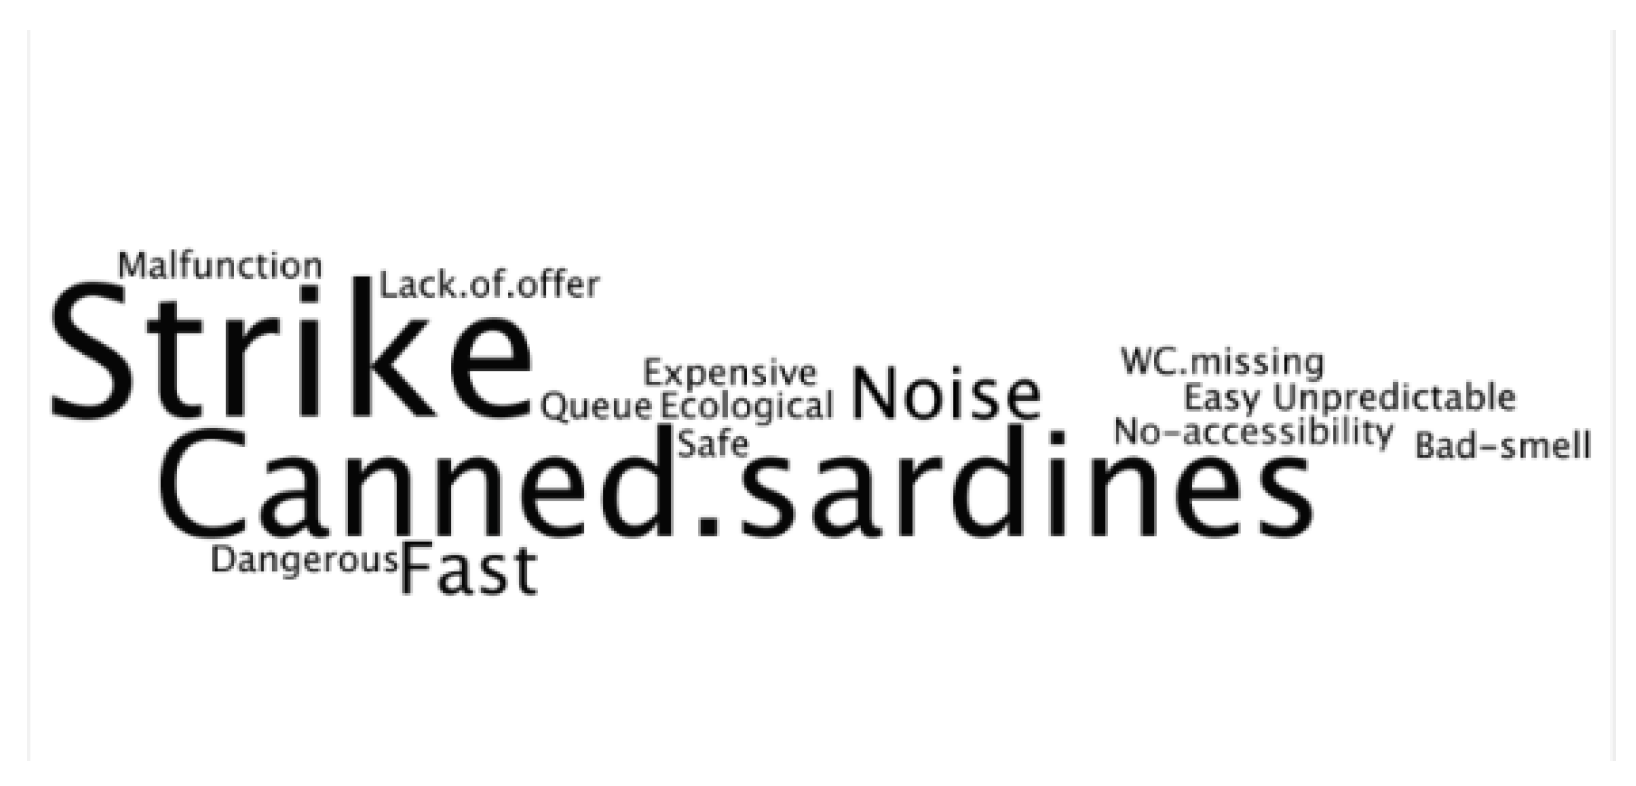
Figure 3 relates to the subway inside Lisbon municipality. The perception of users is very similar to that of the over ground train inside Lisbon municipality as “Strike” and “Canned sardines” are the most frequent words/expressions given.
The river mode outside Lisbon (boats connecting the north bank and the south bank of the River Tagus) is mostly seen as “Punctual” and “Fast” although “Pollutant” (
Figure 4). The punctuality and speed are positive features, but this is hardly surprising since the river is free of traffic jams that delay boats; however, the spillage of fuel into the water does not go unnoticed by users, contributing to a negative perception of river transport.
4.3. General Perception of Public Transport Users
The user-type image is different across modes of transport. Participants associated the subway inside Lisbon municipality with more diverse types of users. Some respondents made a clear distinction between the various subway lines because they cross different areas of the city that are frequented by different kinds of people: college students, working people, executives, common people, immigrants, and the homeless: “The Lisbon Metro, I thought they all fit, in fact it is very diverse” (Focus Group 1). Some participants find the subway difficult for older people: “This is granny! Grannies can’t get the metro ticket. And it is very fast, and you get in and get out fast …” (Focus Group 6).
Road transport inside and outside Lisbon municipality presents similarities. It is described as offering good accessibility for people with reduced mobility (wheelchairs) and mothers with small children in strollers; it is preferred by working people: “On the bus … it is typically Lisbon’s old people” (Focus Group 3); “People who travel by bus is the typical citizen going to work” (Focus Groups 2).
The train and river transport are viewed as the most common modes of transport, strongly associated with working people: “It’s people going to work” (Focus Group 2). In contrast, the train outside Lisbon municipality stands out for its “elite” status and is associated with executives and students in higher education: “Yes, I see more people, most people using a suit on X (name of railway company)” (Focus Group 1).
4.4. Drivers and Barriers to Using Public Transport
This section describes the main negative aspects of using public transport according to participants’ perceptions and concludes with a summary of the key drivers and barriers to the use of public transport.
Problems with buying tickets is given as a negative aspect, namely machines are often out of order: “Sometimes in the metro, I don’t know why, I can’t get the ticket from the machine, but if we go back a few minutes later it works!” (26-year-old female, regular user of road transport). Participants also reported the low user-friendly interface of the ticket machines at stops/stations. There is sometimes no operator to assist users and some people say buying tickets from the machines is complicated and requires many small steps and several decisions: “It depends how much people are willing to interact with machines” (35-year-old female, regular user of river transport).
The infrequency of vehicles outside peak hours and the resulting increase in waiting time at stops or terminals is one of the most criticized aspects of public transport: “At peak rush hour there are many … we cannot complain … but in the middle of the day from 10am to 4pm …” (Focus Group 2); “I think you could extend the operation of the metro during the early hours to have a 24-h service. I think it would be positive.” (34-year-old male, regular user of subway transport).
Travel time and discrepancies between scheduled and actual times is also considered a problem that deters people from using public transport, particularly road transport: “We’re always annoyed when we programmed an hour and the transport doesn’t appear” (26 year old female, regular user of road transport); “Waiting at the bus stop is the worst part …, the bus company already has a system that shows how long it is until the next bus, but it doesn’t actually work; they have it at a few stops, but it’s not very reliable.” (35-year-old female, regular user of road transport); “Sometimes I’d rather use my own transport, because I can’t always be sure of the schedules.” (19-year-old female, regular user of road transport); “… I don’t like having to wait for transport; besides that, there are inevitably stops en route, and the trip is constantly interrupted” (27-year-old male, regular user of train and road transport). The lack of compliance with schedules causes transport users to be negative regarding the control of the travel process: “I have to make an effort not to get upset every day because of something I don’t have great control of” (26-year-old female, regular user of road transport).
The insufficient level of comfort on public transport or in associated infrastructures is also a deterring factor for public transport use: “Ah!!! …, I hate traveling in the rain; umbrellas and buses don’t go well together” (51-year-old female, regular user of road transport); “Possibly a little bit more comfortable … more spacious, because sometimes it bothers me to travel with so little room” (30-year-old female, regular user of subway transport); “The WC’s are lousy” (Focus Group 1); “… the bathrooms are always damaged, always closed” (Focus Group 4); “There are bus stops that have shelters, but others don’t.” (Focus Group 2); “I think it’s all made for summer when it’s not raining …” (Focus Group 1).
Table 1 summarizes the main drivers and barriers to the use of public transport in MAL. It shows which aspects can contribute to an actual change in attitudes and intentions.
The factors that may encourage people using public transport are mostly related to service characteristics: reduce the number of transfers, which is a critical issue for those who need to use more than one transport mode, improve compliance with schedules, so transport service becomes more reliable, better coordination between modes, in order to reduce waiting times and overall travel time and increase the offer at atypical times.
5. Conclusions
The aim of this paper was to identify key factors affecting passengers’ perception of the public transport service and to determine the drivers and barriers to adopting public transport in the metropolitan area of Lisbon in order to enable policy makers and operators to concentrate their efforts and improve public transport users’ travel experience.
The findings show that the perception of the public transport service is influenced by a combination of factors, but these vary in line with the transport services analyzed. Road transport is mainly associated with negative factors such as traffic, pollution, network complexity, cost and delays. Even though there are bus lanes inside the Lisbon municipality, it is difficult for road transport to escape from traffic congestion. This affects the quality of the service, namely keeping to schedules, and makes users regard road transport as unreliable. Users are very concerned about the pollution caused by road transport outside the Lisbon municipality. Indeed, these operators, most of whom are private, have failed to invest in modernizing the fleets, unlike the public transport operators inside the city where most transport is already powered by natural gas and a pilot-project is underway to test the transport efficiency of a 100% electric and silent bus (
ECO 2016). Participants also reported that the monthly cost of road transport is very high, notably outside Lisbon municipality. In fact, most of those living outside Lisbon must use more than one bus to reach the city center, which raises the cost of the overall trip. Moreover, the high cost of living and large wage cuts during the recent economic crisis have affected many people in Portugal, exacerbating the negative perception of the cost of road transport. Furthermore, the complexity of the road transport is associated with the difficulty in making connections and transfers between routes. Participants refer to the fact that it is not easy to devise a good travel plan within the network of available routes.
Participants considered the train outside Lisbon municipality to be the fastest mode of transport and free from unexpected traffic problems; this is perceived as its great advantage. However, the frequent strikes and overcrowded trains (caused by insufficient trains to meet demand, notably in peak hours) inside Lisbon municipality reduce users’ confidence in this mode of transport. Frequent strikes and overcrowding are also the adjectives chosen to describe the subway. Participants mention that there are often insufficient carriages in the subway contributing to overcrowding and uncomfortable trips.
The transport across the River Tagus is perceived to be the most punctual and consistent as it is not affected by traffic, but its potential pollution of the river is seen as its greatest disadvantage. It should be noted, however, that participants only refer to pollution in our task of assigning words using cards (i.e., there is an explicit choice), and not in the context of open questions or discussion.
When asked about critical aspects in public transport service and what should be done to improve the travel experience, the factors mentioned most frequently are directly linked with the characteristics of the service, namely increased offer at atypical times, better synchronization between transport modes, reducing the number of transfers and better compliance with timetables. (Potential) users will only consider it preferable to travel by public transport if it is convenient—near residence and/or working place—, with good and easy connections within the transport network, without failures (keeping to schedules, no cancellation of services, no strikes) and less expensive. These are the critical factors in which public transport authorities and operators should concentrate their efforts.
The most successful European and Canadian urban public transport systems (e.g.,
MAUTC 2015;
NTA 2016;
TfL 2016) have focused on network planning to design public transport services that can offer a competitive alternative to the car for urban travel. Network planning creates maximum flexibility for travelers by making it easy for them to transfer between different services or modes. Additionally, the geographical coverage of the public transport network must be enlarged. In our study, passengers agree that the service offered inside the Lisbon municipality is reasonable. However, this is not the case in Lisbon’s more remote suburbs where there is little choice of modes of transport and inadequate transport in off-peak hours like weekends or evenings; this prejudices people with unusual working hours (e.g., shifts, night or weekend work) and those coming into the city for cultural or sports events in the evening, walking around the city, visiting exhibitions or monuments or for family activities at weekends. Public transport operators must make investments to overcome these limitations in order to make public transport more appealing and increase the number of users.
Participants noted that greater compliance with timetables and shorter waiting times along with good multi-modal solutions were key factors for the regular use of public transport. Mention was also made of the importance of improving comfort and space (on transport and in the stations) to reduce the feeling of being like “canned sardines”. To improve these service features, operators need to increase the number of vehicles (buses, trains, subway carriages) in circulation; however, this is challenging to implement not only because it demands a significant investment, but also because MAL has many service operators (more than 15, some have public governance, others are private) which makes it difficult to coordinate planning for the expansion of the network and service. This is however one of the most critical issues pointed out by the participants that operators cannot ignore.
The perception of the public transport service is a key determinant for the adoption of public transport. The development of sustainable mobility in large cities requires a clear understanding of travel behavior and users’ needs and expectations. Therefore, measuring the level of service to identify the potential strengths and weakness of the public transport system will help the successful implementation of new mobility plans for large cities and municipalities, as is the case of the metropolitan area of Lisbon.


