Article

Perspectives of University-Industry Technology Transfer in African Emerging Economies: Evaluating the Nigerian Scenario via a Data Envelopment Approach

1
Department of Geology, Faculty of Geography and Geoscience, University of Trier, Universitätsring 15, 54296 Trier, Germany
2
Department of Economy, Faculty of Informatics and Management, University of Hradec Kralove, Rokitanskeho 62, 50003 Hradec Kralove, Czech Republic
3
Department of Business Administration, Faculty of Management Science, Anchor University, Ayobo, 100278 Lagos, Nigeria
4
Department of Management, Faculty of Business Administration, University of Nigeria, Enugu Campus, 400024 Enugu State, Nigeria
*
Author to whom correspondence should be addressed.
Soc. Sci. 2019, 8(10), 286; https://doi.org/10.3390/socsci8100286
Submission received: 14 July 2019 / Revised: 21 September 2019 / Accepted: 11 October 2019 / Published: 13 October 2019

Abstract

:
All of Africa’s emerging economies are faced with developmental challenges, which can be partly ameliorated using effective University–Industry technology transfer. While technology transfer remains at the infant stage, sparsely documented, and with no complex ongoing processes in many African societies, Universities in Africa are making efforts in University–Industry collaborations aimed at bringing significant improvements to the continent in a bid to drive national innovation and regional economic development. In this paper, we attempt to evaluate the progress made so far by Nigerian Universities in technological innovation transfer, in order to suggest ways for possible future progress. To do this, crucial technology transfer resource factors (inputs), namely, the number of linkage projects funded by the “African Research Council” (ARC), consortium membership of the University’s technology transfer office, and the number of doctoral staff at the University’s technology transfer office, were checked against a set of performance measures (number of executed licenses, amount of licensing royalty income, number of spin-offs created, and the number of spin-offs created with university equity), using data envelopment analysis and multiple regression, respectively. Results suggest that Universities that possess better resource factors reported higher outputs on most of the performance indicators applied. In addition, it was observed that Universities with greater ability to effectively transfer knowledge had higher technology commercialization performance and financial sustainability. The implication of these results is that Universities in Africa need to develop in line with the technology transfer resource (input) factors suggested within this study, as this is the way to go for better performance.

1. Introduction

Globalization puts emerging nations under enormous pressure to rebuild themselves using technology in an attempt to keep up with global sustainability and economic trends (Bozeman 2000; De Moortel and Crispeels 2018). In order to compete effectively in the new global economy, knowledge generation and technological innovations are crucial, and African countries, through their Universities, are making rallying efforts in university–industry collaborations in order to be part of this new economic paradigm shift (Mazurelle and Ginies 2010) and to contribute to better technological outputs.
Universities play important roles in the transfer of technology. This is because the process of learning and acquisition of new knowledge has been the foundation for most ground-breaking inventions across all spheres of life (Giuri et al. 2019; De Moortel and Crispeels 2018). Hence, universities are generally regarded as key agents of economic and social progress. Nevertheless, recent years have seen universities’ basic roles evolve to now include collaborations with industry, to add to the traditional missions of teaching and research. This is further justified by Osabutey and Jin (2016), who explained that universities in contemporary times are required to play multi-faceted roles: teaching, research and entrepreneurial functions.
In emerging economies, universities are saddled with the responsibilities of creating new knowledge and working with indigenous industries in effective absorption and adaptation of internationally transferred technologies. Generally, role-playing by universities in emerging economies, especially in Africa, is faced with a number of challenges. According to research, African nations, with the exceptions of South Africa, Egypt, Mauritius, and Benin, are part of the so-called group of science laggards (Rand Corporation 2001). In addition, there seems to be a problem with African higher education systems, both in terms of university study schemes as well as institutional abilities. Individual academics are also affected, as morale to research and create positive output is generally low (Novickis et al. 2017). The availability of very little or no research and development funds (in some cases) also seems to worsen the situation (Oyedoyin et al. 2013), resulting in extreme difficulty to initiate and maintain scientific research (Mohamedbhai 2008). The result of these challenges is the availability of mainly gray literature on university–industry collaborations (World Bank 2008; World Bank 2012). Individual researchers in Africa seem to have been particularly hit by restrictive working conditions, even though these difficulties are not peculiar to Africa (Sparks and Barnett 2010). Research resources are rarely available, especially in public higher institutions, leading to less motivation and innovation.
Despite the many challenges in African universities, researchers are not giving up on the situation, carrying out research in their own way and not minding the odds (Mazurelle and Ginies 2010). Hence, a number of marketable research breakthroughs, many with industrial relevance, have been witnessed over the years (Munyoki et al. 2011). As part of the vision in many research and development (R&D) centers across Africa, research findings are now been given industrial backing, so that patenting and licensing can be achieved, thereafter leading to nationally relevant products and technology. Technology transfer generally requires a cultural shift in academia, beyond the usual research and teaching (Novickis et al. 2017), thereby requiring the participation of researchers, policy makers and industry agents. Some scholars argue that university research commercialization is a second academic revolution for universities, from which the term entrepreneurial university has been coined (Vick and Robertson 2018). However, scholars such as Giuri et al. (2019), as well as De Moortel and Crispeels (2018), claim that this phenomenon is only an institutionalization of an activity that can be traced back 100 years to the development of the chemical industry (Meng et al. 2019). Regardless of the debate about the initiation of this phenomenon, universities are expected to incorporate technology transfer as a new role in addition to their traditional teaching and research roles, and African universities are not left out of this.
The rest of this paper is organized as follows; Section 2 covers the review of literature related to trends of technology transfer in Africa. Section 3 describes the methodology and approach to the current study. Section 4 shows the experimental procedure and presents the experiments and evaluation, while section 5 discusses the conclusions and possible future research on the subject.

2. Literature Review

Technology continues to foster development in all aspects of human endeavor (Adeoti 2002), making life better-off in comparison to what was obtainable during medieval times (Landes 1970). Nevertheless, not all human societies belong to the same technological scale (Dongarra et al. 1979), implying that some nations are more technologically-oriented than others, a factor which is considered when distinguishing developed economies from emerging ones (Nielsen 2011). Emerging nations are mostly technology receivers, especially owing to the fact that most of these countries are consumer economies. On the other hand, developed countries are mostly industrialized. As a result of varying levels of technological applications around the world, there is a large number of literature on innovation transfer to countries with technology deficits.
As early as the 1980s, developing countries either paid directly for transferred technologies, or entered into some form of contract with their developed partners. With these arrangements all set on a laissez-faire platform, McCullough (1981) reported that some emerging economies started to activate national laws to manage knowledge transfer, with some approaching the United Nations Conference on Trade and Development (UNCTAD) for better policies on technology transfer to emerging nations. The use of these national laws to date has raised questions as regards whether such collaborations can continue. One popular example is the case of China, a country whose status of development has been largely met with varying debates (Cutler and Doyle 2019). Holmes et al. (2013) noted that the importation of technology into China followed the so-called “Quid pro quo” policy. Within the realm of Quid pro quo, a technology developer must be willing to share knowledge of the technology with a Chinese firm before having access to the Chinese market. There have been reported cases where Kawasaki and Siemens, two high-speed train giants, have shared knowledge with Chinese firms (Nowak 2012).
Beyond the enactment of new, unfavorable national laws to guide the transfer of technology, Padgett (1990) identified culture as being a major challenge to effective North to South technology transfer. Although this cultural constraint was mainly studied between two third-world nations, it also remains one of the major challenges in technology transfer, regardless of the status of the transferor and receiver. As a solution to technology transfer creating social conflicts, Saeed (1990) proffered a simplistic consideration approach, in which the technology producer factors in the culture of the consumer into the manufacturing of a new technology. By this, we mean that the producer must survey what the needs of the technology receiver are, the level to which the procedure of technology transfer (TT) is in line with the receiving country’s best practices, and the availability of human resources within the receiving nation needed for effective transfer, among other factors (Sathaye and Ravindranath 1998). Although this solution remains largely unclear, it remains one of the very few solutions to some of the problems faced by technology transfer globally. In a critical line of thinking, Carrillo-Hermosilla and Chafla (2003) explained that emerging nations should endeavor to critically evaluate every new technology, noting that a technology manufacturer rarely releases the most effective technology due to certain lock-ins.

2.1. Technology Transfer Situation in Africa

While Africa largely relies on transferred technology, it faces several challenges and threats posed to effectively utilize these technologies. The most common among the challenges African nations face is the absorption of transferred technology (Danquah 2018). As reported by Maya (2010), better analysis and implementation of policies, upgrading of business skills and the creation of technology carrying firms are some of the key areas where African nations are lagging in TT. In a research work that examined the relationship between development and technology transfer, Costantini and Liberati (2014) noted that working institutional systems are crucial for the effective conversion of imported technology for domestic usage. Furthermore, it is difficult for some African countries to evaluate incoming technology against existing needs. This causes over-reliance of many African countries on third-world nations.
Having looked at North to South knowledge transfer, let us consider TT within individual African settings. South Africa is unarguably Africa’s most technology-driven nation, having painstakingly developed its TT platform with the enactment of the ‘Technology Innovation Agency Act’ (Act 26, 2008) as well as the ‘Intellectual Property Rights (IPR) from Publicly Financed Research and Development Act’ (Act 51, 2008) (University of Pretoria 2019). Both acts have helped in the creation of the Technology Innovation Agency (TIA), an organization saddled with the responsibilities of fostering research in the line of ground-breaking inventions capable of further improving the nation’s economy. Within the jurisdiction of the IPR Act, university research output is made to serve the public at several levels. Another indigenous body, the Council for Scientific and Industrial Research (CSIR), carries out interdisciplinary research studies with the goal of improving innovation within the country. The body is controlled by the country’s parliament, having been earlier established by a parliamentary consensus act in 1945 (Council for Scientific and Industrial Research 2019). The guidelines of the CSIR are partly intertwined with the IPR Act, with both organizations pursuing the common goal of economic improvement for South Africans through innovations. According to Wolson (2007), before the enactment of the IPR Act, only a few South African higher institutions possessed clearly stated intellectual property (IP) rules. Generally, individuals or universities can lay claims to an IP. However, this depends on the policies in place. According to Mustapha et al. (2019), about five South African companies succeeded in spinning off 45 start-ups within a six-year period from 2008. This was made possible through government funding, which is largely from taxpayers’ money. With coordination and joint funding from both the Department of Higher Education as well as the Department of Science and Technology in 2013, analysis of an investment of R1 billion showed that technology transfer offices announced 33 disclosures, while over a 150 new technologies were being managed (Mustapha et al. 2019). Additionally, five new start-ups were created from the research output of five universities.
In Kenya, Bakuli (1994) maintained that excessively rigid structures in most organizations disallow the ease of technology transfer from universities. Even though the government develops policies with good intentions, the implementation stage is often problematic. However, the role of “LIWA: Linking Industry with Academia” is easing up the situation a little more. With the goal of creating long-standing partnerships between East African firms and universities, LIWA is gradually helping to foster a better environment for knowledge transfer (LIWA 2016). Furthermore, technology transfer within Kenya is guided by “The Science and Technology Act of 1977 Cap. 250”, a law established due to the defunct East African Community (EAC) (Kandel et al. 2017).
In Egypt, Kirby and El Hadidi (2019) noted that there are no effective policies in place to guide knowledge transfer and commercialization. Using a questionnaire survey of over 350 academics and about 200 industry experts, the study outcome revealed that even though a number of measures have been introduced in the past, none of these measures have been enough to guide university–industry collaborations to success. In 2010, with the support of the University of Freie in Germany, Helwan University, Asyut University, and the University of Cairo as well as the American University in Cairo each created a new start-up during a three-year cooperation period (Freie University Cairo Office 2014). The Academy of Scientific Research and Technology (ASRT) is Egypt’s technology transfer management agency, and the body continues to work hard towards building country-wide “Technology Innovation and Commercialization Offices” (TICO). There is hope that the establishment of TICO offices will bring about the desired change in the transfer of academic knowledge to Egyptian industries, in order to further foster development.
In Ghana, preference is given to collaborations with international partners on knowledge that is being transferred into the country; as such, national university–industry collaboration is not as effectively handled as knowledge exchange with a third-world nation. Ghana’s international relationship in terms of innovation transfer is governed by two unique laws; Ghana’s Investment Promotion Act of 2013, otherwise known as Act 865, and Technology Transfer Regulation Act of 1992 (Danquah 2018). Within the domains of these acts, the body in charge in investment and promotion coordinates all patenting and licensing procedures. As reported by Mamudu and Hymore (2016), collaborations are mainly in terms of students’ internships in local firms and faculty “research/study leaves” to industries. Although well-established universities have recently started to develop novel ideas for industries, smaller universities are yet to effectively key into the process.
Morocco’s intellectual property and technology transfer front is rather complex, with several organizations (The Permanent Inter-ministerial Committee for Scientific Research and Technological Development (PICSRTD); The National Center for Scientific and Technical Research (NCSTR); The Hassan II Academy of Science and Technology (HIIAST); The Ministry of Commerce, Industry and New Technologies (MCINT); The Ministry of Higher Education, Scientific Research and Professional Training (MHESRPT)) playing a number of intertwined roles. As described by Hamidi and Benabdeljalil (2013), there seems to be a weak coordination of these bodies, perhaps due to similar roles, even when there exist some forms of hierarchy. Nevertheless, a unique feature of the technology transfer process in the North African nation is the presence of a variety of research funding sources, such as “INNOVACT”. Hamidi and Benabdeljalil (2013) in their study noted that the many arms of technology transfer and available funding sources do not translate to innovation progress within the country. As a result, the authorities in Morocco introduced the “Morocco Innovation Strategy” in 2009.
In a study carried out by Ssebuwufu et al. (2012), the authors observed that collaboration between university and industry is very recent in many universities across Africa. Nevertheless, for an improvement on the process, there is a need for a better understanding of the expertise and capabilities of individual universities and firms, which will help them to understand each other’s interests and needs.
Thus far, it is clear that most of Africa’s strongest economies tend to adopt the triple helix approach to technology transfer, with the government mediating between university and industry. Nevertheless, the government’s presence in knowledge transfer in many African countries is exercised through agencies who mediate the process using some form of regulation. Since there are marked differences in political and research ideologies in African nations, it is important that African nations begin to look at technology transfer methods that will suit the individual countries, based on these differences. A similar situation is seen in the studies by Novickis et al. (2017), as well as Kalnins and Jarohnovich (2015), where country-specific solutions were developed as suggestive models for TT process flow.
While the conventional TT model can be easily implemented, the triple helix model, which seems to be dominant in Africa, has been widely accepted as an improvement on the linear TT method. Although several other models exist in literature to improve the process of TT transfer in many countries (Maresova et al. 2019), the triple helix serves as a foundation to some of these models. About a decade ago, Etzkowitz and Leydesdorff (1999) gave specific details on the triple helix approach to knowledge transfer. The duo explained it as a TT model where a University (through its technology transfer offices (TTOs)) works hand-in-hand with industry to bring innovation close to the public, and this relationship is often moderated by the government. This government–industry–academia relationship is known to be crucial, if scientific research ideas are to bring about expected developments for society (Miller et al. 2018; McAdam et al. 2018). The triple helix model was introduced by Etzkowitz and Leyesdorff (Etzkowitz and Leydesdorff 1995) as a framework for further learning on the inter-relationship between University, Industry, and Government. It was initially aimed at understanding how government policies influence University research output as well as Industrial production output in the long run, and at understanding University–Industry–Government relations and their further development. In a study by Afzal et al. (2018), it was observed that the triple helix method could support the economic drive of Malaysia, if the right resources are channeled into the process. The authors further argued that the triple helix approach pushes for innovation to be derived from the so-called “learning-based economy”. While innovation is crucial for further development, it must be fostered through advances in cooperation by three important helices (Etzkowitz and Leydesdorff 1998).
While there are many more TT models nowadays to foster development and drive for advances in innovation and economy, Maresova et al. (2019) noted that emerging economies must carefully make model choices within the TT domains. In other words, the roles played by actors within any TT method adopted, especially by a developing society (African countries in this case), must be well spelled out. The implication of this clarity of roles and processes is the ease of achievement of the goals of TT within the society.

2.2. Technology Transfer in Nigerian Universities
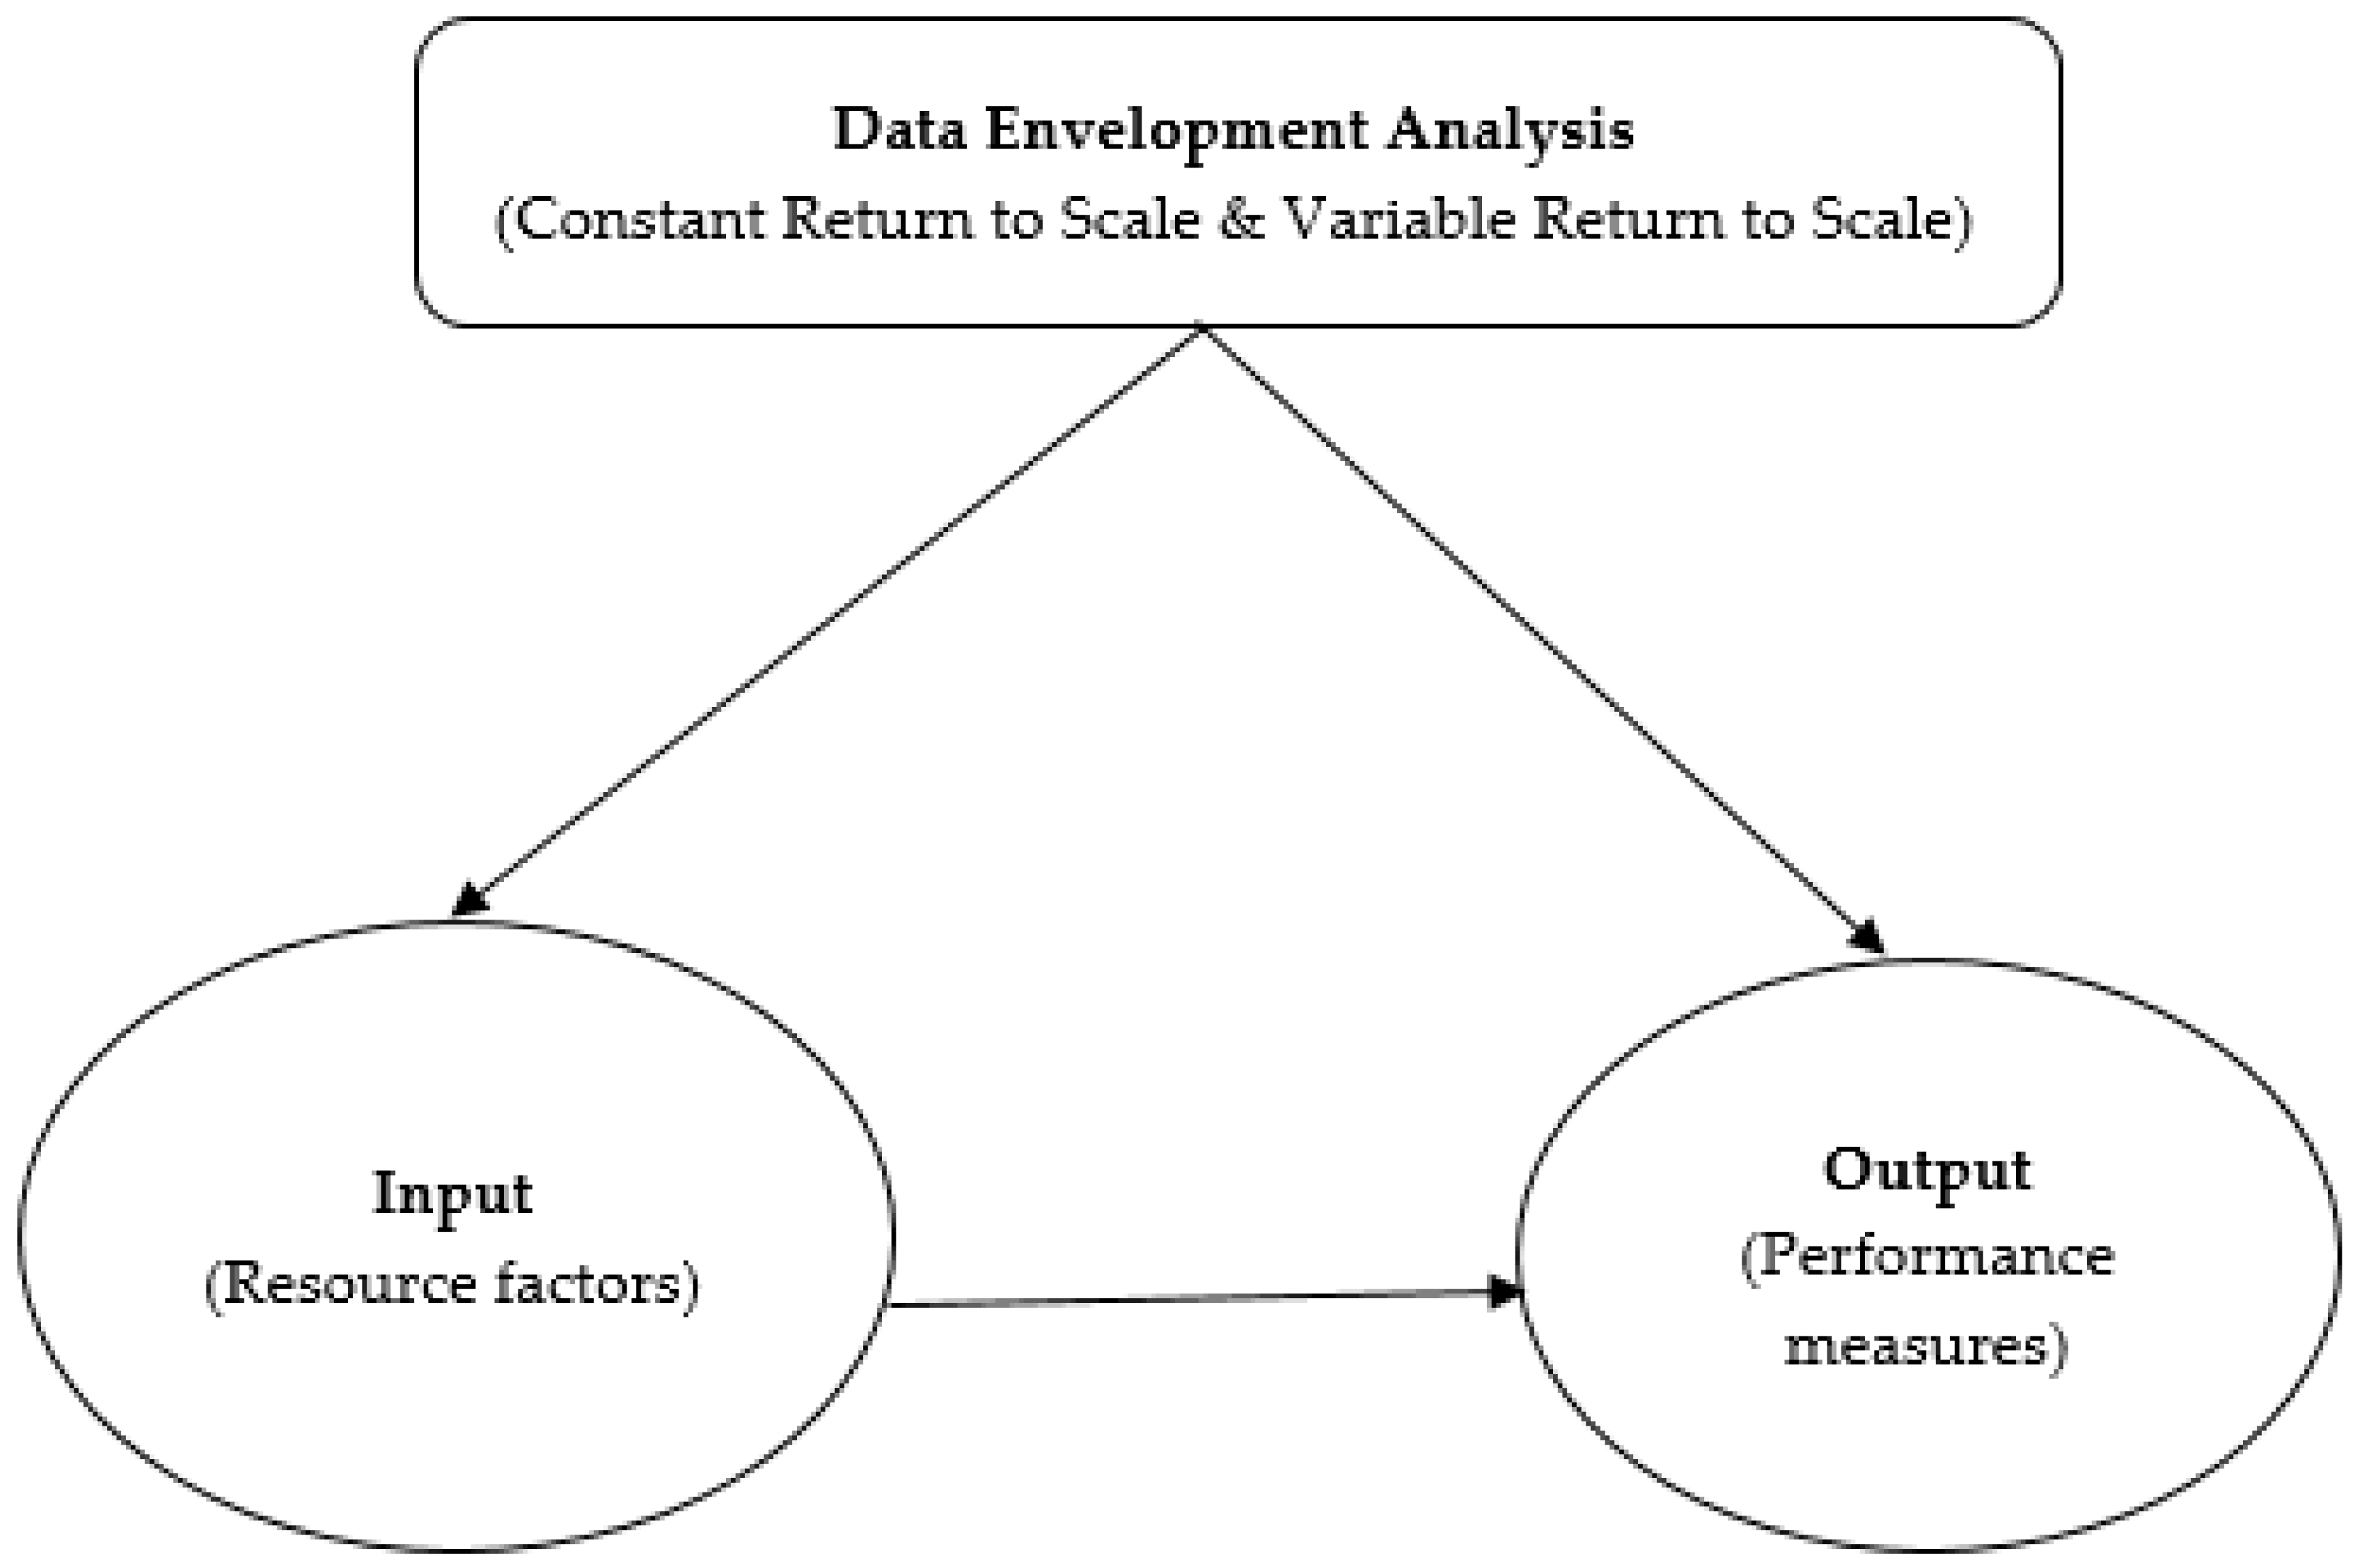
Being one of Africa’s largest economies, Nigeria has had its fair share of the challenges typical to African nations within the technology transfer domains. Nigeria’s technological settings were mainly dominated by foreign firms until 1979, when the federal government set up the National Office for Technology Acquisition and Promotion (NOTAP) to help develop local technological expertise, as well as manage internationally transferred technology. In 2006, NOTAP found that research results in Nigeria ended on university shelves and were not fully converted for industrial use. Although some Intellectual Property and Technology Transfer Offices (IPTTOs) were already in existence at the time, NOTAP again set up more IPTTOs in tertiary institutions across Nigeria (Aroture 2017).
NOTAP has effectively developed many more possibilities for Nigerian industries and entrepreneurs to develop their technological know-how through technology transfer agreements with universities (Aroture 2013). For instance, the rules of NOTAP stipulate that at least 40% of annual technical maintenance paid to foreign software-technology vendors should go to local affiliates to acquire abilities to implement, customize, integrate and support foreign innovation. This aims to ensure that local vendors are involved in maintaining such software in the country, thus reducing the cost of involving expatriates in local processes, and enhancing the capacity of nationals (Kruss et al. 2012). Many Nigerian software firms are now engaged in the execution of software projects, technology engineering and technical facilities that were once provided only by foreign firms. A major Nigerian software company, the Computer Warehouse Group (CWG), has discovered so much that it has grown into a tiny multinational company, operating in 18 of the 36 Nigerian states, with offices in other western African countries such as Ghana, Uganda, and Cameroon. Since 2006, more than 40 higher institutions in Nigeria have also facilitated the creation of more IPTTOs. Within the first six months of the introduction of NOTAP’s system, many Nigerian universities that were without a single patent in their many years of existence can now boast 10 to 20 inventions (Aroture 2013; Aroture 2017). As a result, the number of patents registered in Nigeria has since risen from a yearly average of 100 in 2006 to 400 in 2012 (Kruss et al. 2012). NOTAP works in a comparatively fragile scheme of information and in a nation where government agencies are often criticized for unnecessary bureaucracy, delays, bad expertise, and unmotivated workforce. Better equipping NOTAP to fulfill its obligation is another task. Most recently, the organization explained the need for a large exhibition center, where entrepreneurs can come and see worldwide technology, domesticate these techniques and set up companies (Aroture 2013). NOTAP’s project is also becoming a model for a number of African nations, collaborating with organizations in Ghana, Kenya, and Tanzania, among others, to set up science and technology museums and to improve the effective commercialization of intellectual properties.

3. Methodology

To understand how well university–industry collaboration is working within the Nigerian system, we adopt data envelopment analysis (DEA). The use of DEA is widely believed to be effective in the measurement of the efficiency of university technology transfer (Kim et al. 2008). DEA came into existence following the ideas put forward by Micheal Farrell in his 1957 research article. The study mainly focused on measuring productivity and efficiency levels (Farrell 1957; Førsund and Sarafoglou 2002). Approximately two decades later, Charnes et al. (1978) further developed Farrell’s ideas, giving them the name DEA, and refining them to what they are today (Førsund and Sarafoglou 2002). Data envelopment analysis mainly finds applications in operations management research when there is a need to understand possible outputs of individual units within a system of interconnected units. According to Rosenmayer (2014), DEA compares a number of inputs as well as output terms to determine the effectiveness of a parameter under investigation (Son and Moon 2004). A crucial factor in its usage is the homogeneity of terms. Nowadays, DEA has become quite popular in the field of economics and management research. Lee et al. (2017) used DEA to carry out an efficiency modeling of commercial banks in Korea. The goal was to understand how each of the 18 analyzed universities performed, given a number of market conditions. Since all the banks had similar environments in which to excel, based on operation on a common law guiding their operations, the market conditions served as a platform for comparing an individual bank to another. Similarly, Ramanathan (2001), in a bid to understand certain underlying discrepancies amongst existing methods for carrying out performance efficiency comparison in a number of schools in the Netherlands, also utilized DEA. This time, the method was used in collaboration with regression to detect how larger schools were more efficient in comparison to smaller ones. Furthermore, DEA has over the years found continuous application in the realm of University–Industry TT, university entrepreneurship and commercialization (Abramo et al. 2011).
In the current study, DEA was carried out on secondary data. The production of four different technology outputs by the top Nigerian universities was the main object of the data. The outputs included: number of invention disclosures, number of executed licenses, amount of licensing royalty income, and number of spin-offs created with university equity. Two models were adopted in terms of “return to scale” within the DEA, namely, Constant Return to Scale (CRS) and Variable Return to Scale (VRS). To calculate CRS and VRS, input–output proportionality was assumed as a crucial model choice for CRS, implying that for a unit (A, B) of the factors (where both terms denote vectors of inputs and outputs), and for any xA0, scaled unit (xA, xB) is also a subset of the factors (Podinovski 2004). On the other hand, VRS for this study depends on convexity, i.e., that there are no proportionality assumptions used, resulting in a production possibility set (PPS), which makes VRS underestimate the correct state of the usefulness of the factors. This is why there is a general belief that CRS is more common for DEA, as it allows for mathematical form of scale effect and the possibility of diminishing returns. Besides CRS and VRS, newer techniques that can function in place of both models are fast becoming popular. An example is the hybrid returns-to-scale (HRS) (Podinovski 2004).
Following the adoption of a scale return, a DEA double-input and single-output effectiveness assessment was conducted using “solver”, a Microsoft Excel add-in that solves the DEA matrix for each decision-making unit (DMU) (year of information in this case). For this study, a weight (v, w) of 1 is allocated for each year of information, because the weights are a choice matrix, and it will generate an ideal weight for each year using solver. In addition, an effectiveness (ei) of 1 is allocated as the effectiveness in an unidentified choice factor, so that solver restores this price to its desired valuation on resolving the equation. For solver to get the equation fixed, limitations are set, so that the outputs (X1 or X2) are continually equivalent to or below the sum of inputs, and so that the output (Y1) is always greater than or equal to the total outputs. DEA allows the identification of the “best practice” universities, and then determines the efficiency of other universities in relation to their levels of outputs and inputs, which are compared to the universities with best practices. Simply put, efficient universities will form the production frontier, and the efficiency of other universities is measured by the distance from this frontier.
University technology transfer input and output data were obtained from the National Survey of Research Commercialization (NSRC) conducted annually by the National Universities Commission (NUC). Nigeria currently has 152 universities registered and approved by NUC, though there are many Universities claiming to be approved and registered in Nigeria that in reality are not recognized by the university registration body. Therefore, data on the top 10 Nigerian universities were assessed from NUC for a period from 2010 to 2017. The universities were ranked as the top 10 based on the ranking by a number of leading university ranking entities around the globe, such as times higher education world university ranking, QS world university rankings, U.S. news and world report on best global university ranking, world university academic ranking, and Reuter’s top 100 most innovative universities in the world. By comparing the ranking across these entities, Table 1 was developed as a useful table for this study. To further support the shortcomings of DEA, multiple regression analysis was used to check the effect of input factors (resource factors) on the university outputs, otherwise referred to as performance measures. There were a total of three input factors: ARCNUM: number of ARC linkage funded projects; CONMEM: consortium-member; UTTO: university technology transfer office; and PHDSTF: number of PhD staff at the university technology transfer office. The following abbreviations represent the variables used within for describing the performance as well as the resource variables: INVDIS: invention disclosures, FILPAT: filed patents, EXCLIC: executed licenses, LICINC: amount of licensing royalty income, SPICRE: number of created spin-offs, and SPIEQU: spin-offs created within university equity. Furthermore, ARC and ID represent African Research Council and invention disclosures, respectively.
In general, the variables and institutional factors adopted within this study were chosen because of their proven high relevance to the topic of country-specific TT. This has been confirmed by numerous published research studies (Gür et al. 2017; Chang et al. 2009) as well as statements issued by influential institutions, such as the World Intellectual Property Organization(WIPO) (Cervantes 2008) and the Organisation for Economic Co-Operation and Development (OECD) (Daglio et al. 2015), as well as state governments and global companies involved in patent activities (Manyika et al. 2013). A good example is seen in the work of Sanberg and McDevitt (2013). The pair pointed out the revolutionary impact of the 1980 Bayh-Dole Act, which granted US universities the right to hold on to intellectual property funded from the federal budget. This change caused a shift in academic circles toward a more entrepreneurial mindset and, in the long run, generated greater licensing income, whose volume increased as a result of new collaborations and new funding opportunities. It follows that funding and budget options significantly affect patent activity. In their study, Wu et al. (2015) examine both individual and institutional factors influencing the area of patents. Among the institutional factors are the perceived service effectiveness of Technology Transfer Offices (TTOs), cost-saving measures, patenting fee coverages, and license owner’s requirements prior to patent application. For the input factors, linkages with ARC are a crucial variable, mainly because it is important to be affiliated to the African Research Council for any university to further grow its research capacity. This is because the organization annually sets aside funding opportunities for researchers in African universities. These funds are useful for innovation and developmental research. Consortium membership of university TTOs is selected as a variable within this study mainly for its usefulness as an avenue for diffusion of ideas. When representatives of the TTOs of different Nigerian universities work hand-in-hand, younger universities are able to learn from the bigger and more established ones. Furthermore, ideas that relate to university entrepreneurship and venture-capital can be exchanged in the process. PhD holders are very useful for research and daily administration of the processes within the university. This includes TTOs. As such, the number of PhD holders has been factored into the mix. Figure 1 shows the interconnection between the methodology adopted for the study and the resource factors and performance measures, respectively.

4. Results

In this section, we present output-oriented DEA results with the assumption of VRS on four performance measures (Table 2). From these results, the following findings can be deduced.

4.1. Number of Invention Disclosures

The average CRS technical efficiency score of the selected Nigerian Universities was 36%, and the average VRS technical efficiency score was 44%. The average scale efficiency (CRS/VRS) score of the selected Universities was 85%. In relation to returns to scale, six selected Nigerian Universities achieved increasing returns to scale, and only three Universities achieved decreasing returns to scale, while the remaining one exhibited CRS. In fact, three of the selected Nigerian Universities were found to be technically efficient using the CRS model, five were technically efficient using VRS, while the last two achieved 100% scale efficiency.

4.2. Number of Licenses Executed

In terms of the number of licenses, data envelopment analysis found that the average CRS technical efficiency score of the selected Nigerian Universities was 0%, and the average VRS technical efficiency score of universities’ technology transfer offices was 43%. The average scale efficiency score of the selected Universities was 0%. In relation to returns to scale, six selected Nigerian Universities achieved increasing returns to scale, while the remaining four exhibited CRS. In fact, 10 selected Nigerian Universities were VRS technically efficient, and none of the selected Nigerian Universities achieved 100% CRS technical efficiency or scale efficiency.

4.3. Licensing Royalty Income

For licensing royalty income, the average CRS technical efficiency score was 0%, and the average VRS technical efficiency score of the selected Nigerian Universities was 25%. The average scale efficiency score was 0%. In relation to returns to scale, seven selected Nigerian Universities achieved increasing returns to scale, while the remaining three exhibited CRS. In fact, all the selected Universities were VRS technically efficient, while none of the selected achieved 100% CRS scale efficiency.

4.4. Number of Equity Spin-Offs

The average CRS technical efficiency score of the selected Nigerian Universities was 33%, and the average VRS technical efficiency score was 41%. The average scale efficiency score was 81%. In relation to returns to scale, four of the selected Universities achieved decreasing returns to scale, while the remaining six selected Nigerian Universities exhibited CRS. In fact, three of the selected were CRS technically efficient, five were VRS technically efficient, and only six achieved 100% scale efficiency, as presented in Table 2.
In Table 3, the data envelopment analysis conducted with solver for each DMU is displayed in the last row. The effectiveness was calculated for each year under the optimum weighting. Inputs (invention disclosures and patent applications) and outputs (license agreements) are also shown. The results show that efficiency scores between 2012 and 2014 were higher than in other years. DEA results generally do not indicate where or how to boost the technology transfer offices. The maturity model results categorized TTO alpha as level 3, controlled phase, and therefore, TTO alpha can be rendered conscious of the key fields that need action instantly by searching at the outline.
The controlled phase definition says that a technology transfer office should have adequate human resources with the right types of abilities, royalties, or reward systems in location for bureau technology transfer employees, developed networks, or connections between university and industry, subsequently revealed innovations, and a decentralized inner framework. If TTO alpha does not satisfy any of these criteria, then the divisions that need action are the ones selected. TTO alpha researches the outcomes of the self-assessment instrument (Table 4) for particular intangible indices in that particular effectiveness region for in-depth ideas into particular weaknesses that can be reinforced. Nevertheless, the results correlate well with the findings of the self-assessment instrument and the associated ranking of maturity level, which demonstrates that TTO alpha still has places for improvement. In addition, these findings were verified by debate with the TTO alpha employees. TTO beta has moved nearer to the productivity border in recent years, but measures still need to be taken to guarantee effectiveness. The maturity model’s controlled phase states that at this maturity, a technology transfer office still needs multiple procedures to function effectively. This can further be explained using correlation co-efficient and regression analysis.
Table 5 and Table 6 show descriptive and correlation statistics. For the recorded performance period of 2010–2017, the average number of inventions disclosed was 37% per annum and the average number of patents filed was 18% per year. The selected universities had executed an average of 24% licenses per annum and received an average licensing royalty income of 32% per year. In addition, universities had created an average of 5.33 spin-off firms and 4.70 spin-offs with university equity holdings. On the other hand, the average number of ARC Linkage projects was 30%, with an average number of students holding a doctorate degree.
Multiple regression analysis was performed on the six performance variables (INVDIS, FILPAT, EXCLIC, LICINC, SPICRE, and SPIEQU) grouped as dependent variables, and on three independent variables (ARCNUM, PHDSTF and CONMEM).
Results of the analyses are summarized in Table 4, Table 5 and Table 6. Variance Inflation Factors (VIFs) were likewise estimated to check for multi-collinearity. Substantially low VIFs (below 10) indicate that all variables were useful (Von Eye and Schuter 1998). Additionally, adjusted R-square values were relatively close to the actual R-square values, indicating that the regression model is not overfit (Leinweber 2007). All resource factors show varying effects on technology transfer performance indicators of universities, with the number of ARCNUM as the most significant resource factor across six performance indicators. ARCNUM has a positive and significant association with the number of INVDIS (at the 0.05 level), FILPAT (at the 0.01 level), EXCLIC (at the 0.01 level), LICINC (at the 0.05 level), SPICRE (at the 0.01 level), and SPIEQU (at the 0.01 level). Additionally, the number of PHDSTF was positively and significantly associated with better university technology transfer performance in relation to the number of INVDIS (at the 0.01 level), FILPAT (at the 0.01 level), EXCLIC (at the 0.05 level), and SPICRE (at the 0.1 level). On the other hand, CONMEM was only associated with better performance in relation to the number of INVDIS (at the 0.05 level), SPICRE (at the 0.05 level), and SPIEQU (at the 0.05 level).
Through its implementation to a university alpha case study in Nigeria, the maturity model was validated and checked. By using information on TTO beta performance, the findings align well with the DEA outcome showing that TTO beta is at optimal effectiveness (36%). Based on the average VRS technical efficiency scores from each of the four measures on which DEA was carried out, Nigerian universities could increase their outputs on average by 37% for invention disclosures, 24% for licenses executed, 28% for licensing royalty income, and 32% for spinoffs created with university equity. Chapple et al. (2005) conducted output-oriented DEA with the assumption of VRS for UK Universities, and the average technical efficiency was 39% for number of licenses and 34% for licensing royalty income. The authors also conducted another DEA with outliers omitted, and the average technical efficiency was 35% for number of licenses and 16% for licensing royalty. Therefore, it can be deduced that universities in the UK perform better than Nigerian Universities, taking into account that different inputs and outputs were used to measure technical efficiency. The results of this paper are in line with those of Agasisti et al. (2011), who examined how efficient science, technology, and medicine departments performed in the Lombardy area of Italy over a three-year period. Academic staff and available departmental facilities made up the resource (inputs), while the number of articles published in highly indexed journals, as well as grants from various organizations, made up the performance measure (outputs). It was observed that the efficiency of most departments improved within the period under review, even though this improvement could not be explained, given factors such as the number of faculties with PhDs and university location, among other things. The result also follows that of Lafuente and Berbegal-Mirabent (2019), who suggested, using the Malmquist index, that efficiency can be boosted by creating benchmarking of their own productivity levels within the market in comparison to those of other Spanish universities within a five-year period. In order to compare the influence of local and international innovation systems on the overall efficiency of the Chinese innovation system, Qin and Du (2017) utilized direct investments from foreign nations and cooperation between industry and universities as key factors to point to the invention of technology, as well as its commercialization, as input and output. Results of the study showed that the university–industry relationship allowed for better cooperation with efficiency of innovation at the output stages. This is also in line with the current research. In a contrasting study, it was observed by Abbott and Doucouliagos (2003) that whether or not input and output factors exist, institutions in Australia reached very high efficiency levels among themselves. This is quite different from the situation in Nigeria, where only the more established universities showed serious efficiency levels.
By comparing TTO alpha outcomes in the current study with a number of studies, it was observed that TTO alpha in the case of Nigeria still has some changes that can be created to enhance its effectiveness. However, the strategies of university alpha may need to be modified to provide opportunities for faculty employees in technology transfer and to allocate adequate funds. The task of the university is to integrate the transition of technology into its objectives. Results of this study on targeted measures using the IC lens reveal that alpha universities can enhance the effectiveness of TTO alpha and UTT. TTO alpha can capitalize on the inner and external ties of the university to enhance the effectiveness of its network and that of industry.

5. Discussion

This study shows that the number of commercially-aware faculty members is associated with better university technology transfer. Universities where commercialization awareness amongst faculty is high have competitive advantages over others. This awareness helps them to excel in technology transfer, especially in terms of the number of ARC linkage funded projects as well as in the development of an entrepreneurial culture, which has a positive relationship with patenting and technology licensing (Owen-Smith and Powell 2001). As such, the number of ARC linkage funded projects can defiantly be considered as a good predictor of overall performance differences between universities in technology transfer. Although university scientists are required in most parts of the world to disclose their inventions to technology transfer offices, the case is quite different in Nigeria, where a large percentage of university inventions go out through informal means. This is largely due to the fact that researchers are free to choose the research commercialization strategy they want to adopt. Most universities in Nigeria have mechanisms in place to compensate researchers when their research findings go public. Notable among these mechanisms is the so-called share of licensing royalties. This is a step in the right direction given that researchers want to do more in terms of research inventions, thereby helping universities to meet the expectations of the public as the society’s knowledge-producers. To further improve on the existing status of researchers’ compensation, ideas can be drawn specifically from TT transfer systems in the U.S. and other societies with more advanced TT systems. Furthermore, there is a need for Nigerian Universities to further foster effective partnerships with educational arms of regional economic development organizations, such as the Economic Community of West-African States (ECOWAS), African Union (AU), and African Development Bank (AfDB), to mention a few. These organizations can contribute immensely to University–Industry collaborations through funding and grants. Findings from the current study also evidence the major role of TTOs in funding. As explained by Padilla-Meléndez and Garrido-Moreno (2012), the existence of TTOs increases the engagement of researchers and improves their involvement in Knowledge Transfer Exchange (KTE) and Open Innovation (OI) processes. Finally, Wu et al. (2015) noted that universities with a functioning and cost-effective TTO are more likely to be granted a license for their inventions. Patent activity is influenced by a large number of factors. As recent research shows, the complex interplay of factors includes not only the universities’ characteristics but also public policy at the country or the regional level, economic and social characteristics, and technological level. For example, the Triple Helix Model proposed by Etzkowitz and Leydesdorff (2000) examines the interconnection of universities, industry, and government. Huggins argues that the open innovation system brings to the fore regional assets in innovation processes. Carayannis and Campbell (2006), the authors of the Quadruple Helix model, underline the role of the media- and culture-based public. The result is a gradually emerging organic system of knowledge and innovation, well suited to the knowledge-based economy. Laperche (2002) demonstrates that the commercialization of public research is the result of an “organic paradigm” of four interrelated factors: university strategy, legislation, economic environment and entrepreneurship, and technical progress. Generally, many authors point to the importance of the TTO for the creation of new ventures. Nevertheless, the role of the business incubator and science park, as well as other activities, such as entrepreneurship classes (Åstebro et al. 2012; Kuhlmann and Shapira 2006; Rasmussen and Wright 2015), cannot be underestimated. Dalmarco et al. (2018) proposed a framework consisting of five discrete dimensions: entrepreneurial perspective, external links, access to university resources, innovation arrangement, and scientific research. Entrepreneurial perspective includes entrepreneurial lectures in all faculties, to improve awareness among students on how to identify new markets or technology opportunities. As mentioned by Rasmussen and Borch (2010), entrepreneurial classes are seen as positive by students wanting to start up their own ventures and develop their own business plans. External links mean that academics participate in national and international applied research domains. Furthermore, entrepreneurs should be able to use academic laboratories for testing and experimenting, which means that they do not have to invest in additional resources when all their funds should be directed towards product development (Rasmussen et al. 2014). On a final note, TT is most successful when a university provides entrepreneurial support infrastructure, for instance an entrepreneurship center, has a technology transfer office and has a well-established structure, with research groups and postgraduate courses. These factors are generally confirmed by research in developed, emerging, and developing economies. The factors examined in this article also fully correspond with the results of the above-mentioned authors.

6. Conclusions

African universities, governments, and stakeholders need to do more regarding the management of technology transfer, using both internally and externally generated strategies. It is imperative to point out that development in the 21st century is unachievable without the necessary developmental impetus. The success of university–industry technology transfer is mainly a function of the system in place in a particular university or country. Only a few emerging nations have effective systems in place to manage university–industry knowledge transfer. This is partly due to poor funding of scientific research. In fact, the OECD (2017) explained that less than 10% of all businesses in Africa collaborate in innovation transfer with universities. This figure is low when compared to OECD’s suggested average of 13% for (small and medium companies) SMEs and 35% for large businesses. In Nigeria, the current study shows that only 3% of Nigerian businesses obtained their innovative ideas from universities between 2010 and 2017.
Universities license their intellectual property rights to industry partners mainly in exchange for monetary rewards, sponsored research or in order to become equity owners within the partner firm. Such licensing agreements can either be exclusive or not, depending on the scope or field, such as market, context, territory, or time. University involvement is crucial for the creation of spin-offs; this is also confirmed in the current study, which shows a positive association for the number of all created spin-offs. Hence, the number of employed PhD staff in a university can be considered as a good predictor of the overall performance in technology transfer as this represents the human capital resource factor. Within this study, universities that are consortium members have disclosure of inventions and creation of spin-offs as their main focus, with less emphasis on increasing the number of licensing agreements and the amount of licensing royalty income. In contrast, Park et al. (2013) observed a positive association between consortium membership and the number of filed patents, the number of executed licenses or the amount of licensing royalty income.
It can be deduced from the findings of this study that for the successful development of academia, a strategic advantage is PhD student/staff. At the same time, PhD students are the most important source of new employees in the research field (Leisyte 2011). This suggests that the University labor market segment is oriented inward, as there are some territorial constraints, despite the fact that the selection of new staff is fully in the hands of individual research institutes/Universities. This fact strongly limits the emergence of new incentives, not only for research but also for the further development of the institutions themselves. At present, the major challenge for public Universities is to identify key areas of research. This is mainly because the assessment system of research organizations tends to support top-notch scientific results and trigger applied research, as well as the involvement of researchers in international cooperation. This implies not only a faster implementation of the changes proposed in government strategy, but also paying attention to the presentation of this environment as a potential attractive place to draw young researchers. The main objective of R&D activities at national and international levels is to produce more results and support the emerging of economies, which can be achieved by interaction between the academic environment and the business sphere. In this regard, inspiration could be taken from developed countries. For instance, in many EU countries, even though TT is still in its development phase, there is access to significant funding by stronger countries and by the EU. While countries with developing TT in Europe have access to funding aids, there are challenges emanating from the need for even more funding to resolve the challenges faced as a result of the specific needs of TT centers in these countries. The European experience also shows the need for a combination of university and grant funding. Nevertheless, the essential importance of TT centers lies both in cultivating and setting procedural frameworks for a successful commercialization and a subsequent remuneration for the patent originator (Wu et al. 2015). When a research organization does not offer a functional workplace for knowledge transfer, then it is demotivating for many researchers. Conversely, a functional workplace of knowledge transfer offering a wide range of quality services will motivate researchers to apply their knowledge and cooperate with the industry sector, when it would otherwise discourage them due to its legal and administrative complexities (European Commission 2007).
This study, which has examined TT processes across Africa, is limited in scope, covering the African TT setting only, and utilizing Nigerian Universities as a case study. While institutions in many countries of the world face specific, but similar challenges to those of African Universities, the current study proffers a solution to the challenges of TT generally from an African viewpoint, and specifically from the lenses of the Nigerian TT sphere. In theory, this study comes in at a crucial time for the Nigerian economy, which has recently started taking shape after the recent global economic meltdown. Given that the triple helix model is the prevailing system in Nigeria, it is important that Universities, Industries, and Governments specifically understand their individual roles, and rise up to jointly combat the challenges to effective TT in Nigeria. In practical terms, this study is an eye-opener for the Government to open up more funding sources for University-based research, so that performance can possibly hit an all-time high in the coming years. This will encourage scholars to do more in terms of innovative research. While the annual budget for education in Nigeria has been discouraging in recent years, there is a need for the government to invest in technological solutions to the economic and developmental woes of the nation. This is, however, achievable via effective knowledge transfer.

Future Work

Future studies could focus on understanding university outputs in other African countries, given certain inputs either on the part of government or stake-holding industry partners. As such, it would be possible to investigate whether the antecedent of university research commercialization is country-specific, especially as there are marked differences in political and research ideologies across the African continent. Furthermore, it is important for research to start focusing on the development of TT systems and models that are unique to Africa and African nations. Given the existence of several TT improvement models in the literature, it is very difficult to come across any one of these models that has its roots within the African research space.

Author Contributions

Conceptualization, O.F.; Data curation, M.A.; Investigation, M.A.; Methodology, F.A.; Supervision, O.F. and P.M.; Validation, F.A.; Writing—review & editing, P.M., R.S.

Funding

This research received no external funding.

Acknowledgments

The paper is supported by the by the SPEV project (2019), Investments under the Industry 4.0 concept at the Faculty of Informatics and Management of the University of Hradec Kralove, Czech Republic.

Conflicts of Interest

The authors declare no conflict of interest.

References

  1. Abbott, Malcolm, and Chris Doucouliagos. 2003. The Efficiency of Australian Universities: A Data Envelopment Analysis. Economics of Education Review 22: 89–97. [Google Scholar] [CrossRef]
  2. Abramo, Giovanni, Tindaro Cicero, and Ciriaco Andrea D’Angelo. 2011. A Field-Standardized Application of DEA to National-Scale Research Assessment of Universities. Journal of Informetrics 5: 618–28. [Google Scholar] [CrossRef]
  3. Adeoti, John Olatunji. 2002. Building Technological Capability in the Less Developed Countries: The Role of a National System of Innovation. Science and Public Policy 29: 95–104. [Google Scholar] [CrossRef]
  4. Afzal, Munshi Naser Ibne, Rini Suryati Sulong, Susmita Dutta, and Datuk Kasim Bin HJ MD Mansur. 2018. An Investigation on Triple Helix Model and National Innovation Systems: The Case of Malaysia. Journal of Entrepreneurship Education 21: 1–15. [Google Scholar]
  5. Agasisti, Tommaso, Antonio Dal Bianco, Paolo Landoni, Alessandro Sala, and Mario Salerno. 2011. Evaluating the Efficiency of Research in Academic Departments: An Empirical Analysis in an Italian Region. Higher Education Quarterly 65: 267–89. [Google Scholar] [CrossRef]
  6. Aroture, Bob. 2013. NOTAP & Technology Transfer in Nigeria. Abuja: Nigerian Law Intellectual Property Watch Inc., Available online: https://nlipw.com/patents-vol-1-no-7/2017 (accessed on 10 September 2019).
  7. Aroture, Bob. 2017. Technology Transfer in Nigeria—NOTAP Commissions 39th Intellectual Property and Technology Transfer Office.” Online. Abuja: Nigerian Law Intellectual Property Watch Inc., Available online: https://nlipw.com/tag/technology-transfer-in-nigeria/ (accessed on 10 September 2019).
  8. Åstebro, Thomas, Navid Bazzazian, and Serguey Braguinsky. 2012. Startups by Recent University Graduates and Their Faculty: Implications for University Entrepreneurship Policy. Research Policy 41: 663–77. [Google Scholar] [CrossRef]
  9. Bakuli, D. Luvisia. 1994. Pitfalls in Technology Transfer: Kenya’s Construction Industry. World Development 22: 1609–12. [Google Scholar] [CrossRef]
  10. Bozeman, Barry. 2000. Technology Transfer and Public Policy: A Review of Research and Theory. Research Policy 29: 627–55. [Google Scholar] [CrossRef]
  11. Carayannis, Elias G., and David F. J. Campbell, eds. 2006. Knowledge Creation, Diffusion, and Use in Innovation Networks and Knowledge Clusters: A Comparative Systems Approach across the United States, Europe, and Asia. In Technology, Innovation, and Knowledge Management. Westport: Praeger Publishers. [Google Scholar]
  12. Carrillo-Hermosilla, J., and Pablo Martínez Chafla. 2003. Technology Transfer and Sustainable Development in Emerging Economies: The Problem of Technology Lock-In. IE Working Paper. pp. 1579–4873. Available online: https://www.researchgate.net/publication/228425406_Technology_Transfer_and_Sustainable_Development_in_Emerging_Economies_The_Problem_of_Technology_Lock-in (accessed on 10 September 2019).
  13. Cervantes, Mario. 2008. Academic Patenting: How Universities and Public Research Organizations Are Using Their Intellectual Property to Boost Research and Spur Innovative Start-Ups. Geneva: WIPO, Available online: https://www.wipo.int/sme/en/documents/academic_patenting.html (accessed on 10 September 2019).
  14. Chang, Yuan-Chieh, Phil Y. Yang, and Ming-Huei Chen. 2009. The Determinants of Academic Research Commercial Performance: Towards an Organizational Ambidexterity Perspective. Research Policy 38: 936–46. [Google Scholar] [CrossRef]
  15. Chapple, Wendy, Andy Lockett, Donald Siegel, and Mike Wright. 2005. Assessing the Relative Performance of U.K. University Technology Transfer Offices: Parametric and Non-Parametric Evidence. Research Policy 34: 369–84. [Google Scholar] [CrossRef]
  16. Charnes, Abraham, William W. Cooper, and Edwardo Rhodes. 1978. Measuring the Efficiency of Decision Making Units. European Journal of Operational Research 2: 429–44. [Google Scholar] [CrossRef]
  17. Costantini, Valeria, and Paolo Liberati. 2014. Technology Transfer, Institutions and Development. Technological Forecasting and Social Change 88: 26–48. [Google Scholar] [CrossRef]
  18. Council for Scientific and Industrial Research. 2019. Explore the CSIR. Research & Development. Vision, Mission & Mandate of CSIR. Available online: https://www.csir.co.za/about-us (accessed on 10 September 2019).
  19. Cutler, Wendy, and Doyle Kelvin. 2019. China’s Developing Country Status in the WTO: Time for an Upgrade? Asia Society Policy Institute. January. Available online: https://asiasociety.org/policy-institute/chinas-developing-country-status-wto-time-upgrade (accessed on 10 September 2019). Asia Society Policy Institute.
  20. Daglio, Marco, Daniel Gerson, and Hannah Kitchen. 2015. Building Organisational Capacity for Public Sector Innovation. In Innovating the Public Sector. Paris: OECD, pp. 1–35. Available online: https://www.google.com/search?client=firefox-b-d&q=paper+blowing (accessed on 10 September 2019).
  21. Dalmarco, Gustavo, Willem Hulsink, and Guilherme V. Blois. 2018. Creating Entrepreneurial Universities in an Emerging Economy: Evidence from Brazil. Technological Forecasting and Social Change 135: 99–111. [Google Scholar] [CrossRef]
  22. Danquah, Michael. 2018. Technology Transfer, Adoption of Technology and the Efficiency of Nations: Empirical Evidence from Sub Saharan Africa. Technological Forecasting and Social Change 131: 175–82. [Google Scholar] [CrossRef]
  23. De Moortel, Kevin, and Thomas Crispeels. 2018. International University-University Technology Transfer: Strategic Management Framework. Technological Forecasting and Social Change 135: 145–55. [Google Scholar] [CrossRef]
  24. Dongarra, Jack, Cleve Moler, Jim Bunch, and Gilbert Stewart. 1979. LINPACK Users’ Guide. Other Titles in Applied Mathematics. Philadelphia: Society for Industrial and Applied Mathematics. [Google Scholar]
  25. Etzkowitz, Henry, and Loet Leydesdorff. 1995. The Triple Helix—University-Industry-Government Relations: A Laboratory for Knowledge Based Economic Development. EASST Review 14: 14–19. [Google Scholar]
  26. Etzkowitz, Henry, and Loet Leydesdorff. 1998. The Endless Transition: A ‘Triple Helix’ of University-Industry-Government Relations: Introduction. Minerva 36: 203–8. [Google Scholar] [CrossRef]
  27. Etzkowitz, Henry, and Loet Leydesdorff. 1999. The Future Location of Research and Technology Transfer. The Journal of Technology Transfer 24: 111–23. [Google Scholar] [CrossRef]
  28. Etzkowitz, Henry, and Loet Leydesdorff. 2000. The Dynamics of Innovation: From National Systems and ‘Mode 2’ to a Triple Helix of University–Industry–Government Relations. Research Policy 29: 109–23. [Google Scholar] [CrossRef]
  29. European Commission. 2007. Knowledge Transfer between Research Institutions and Industry. Ispra: European Commission, Available online: http://ec.europa.eu/invest-in-research/pdf/download_en/consult_report.pdf (accessed on 10 September 2019).
  30. Von Eye, Alexander, and Christof Schuter. 1998. Regression Analysis for Social Sciences. London: Academic Press, Available online: https://epdf.pub/regression-analysis-for-social-sciences.html (accessed on 10 September 2019).
  31. Farrell, Michael James. 1957. The Measurement of Productive Efficiency. Journal of the Royal Statistical Society. Series A (General) 120: 253–90. [Google Scholar] [CrossRef]
  32. Førsund, Finn R., and Nikias Sarafoglou. 2002. On the Origins of Data Envelopment Analysis. Journal of Productivity Analysis 17: 23–40. [Google Scholar] [CrossRef]
  33. Freie University Cairo Office. 2014. Building of Technology-Transfer Centers in Egypt. Berlin: Freie University, June 17, Available online: https://www.fu-berlin.de/en/sites/cairo/ueberuns/Proj_/93-Technologietransfer.html (accessed on 10 September 2019).
  34. Giuri, Paola, Federico Munari, Alessandra Scandura, and Laura Toschi. 2019. The Strategic Orientation of Universities in Knowledge Transfer Activities. Technological Forecasting and Social Change 138: 261–78. [Google Scholar] [CrossRef]
  35. Gür, Ufuk, İkbal Sinemden Oylumlu, and Özlem Kunday. 2017. Critical Assessment of Entrepreneurial and Innovative Universities Index of Turkey: Future Directions. Technological Forecasting and Social Change 123: 161–68. [Google Scholar] [CrossRef]
  36. Hamidi, Siham, and Nadia Benabdeljalil. 2013. National Innovation Systems: The Moroccan Case. Procedia—Social and Behavioral Sciences 25: 119–28. [Google Scholar] [CrossRef]
  37. Holmes, Thomas, Ellen McGrattan, and Edward Prescott. 2013. Quid pro Quo: Technology Capital Transfers for Market Access in China. VoxEU.Org (blog). November 8. Available online: https://voxeu.org/article/technology-transfer-chinese-markets (accessed on 10 September 2019).
  38. Kalnins, Habil Juris-Roberts, and Natalja Jarohnovich. 2015. System Thinking Approach in Solving Problems of Technology Transfer Process. Procedia—Social and Behavioral Sciences 195: 783–89. [Google Scholar] [CrossRef]
  39. Kandel, Alice Wairimu, Peter Gakio Kirira, and George Ngondi Michuki. 2017. University—Industry Collaboration and Innovativeness of Firms: Evidence from Kenya Innovation Survey. International Journal for Innovation Education and Research 5: 1–10. [Google Scholar]
  40. Kim, Jisun, Timothy Anderson, and Tugrul Daim. 2008. Assessing University Technology Transfer: A Measure of Efficiency Patterns. International Journal of Innovation and Technology Management 5: 495–526. [Google Scholar] [CrossRef]
  41. Kirby, David A., and Hala H. El Hadidi. 2019. University Technology Transfer Efficiency in a Factor Driven Economy: The Need for a Coherent Policy in Egypt. The Journal of Technology Transfer 44: 1367–95. [Google Scholar] [CrossRef]
  42. Kruss, Glenda, John Adeoti, and Dani Nabudere. 2012. Universities and Knowledge-Based Development in Sub-Saharan Africa: Comparing University-Firm Interaction in Nigeria, Uganda and South Africa. Journal of Development Studies 48: 516–30. Available online: http://hdl.handle.net/20.500.11910/3379 (accessed on 10 September 2019). [CrossRef]
  43. Kuhlmann, Stefan, and Philip Shapira. 2006. How Is Innovation Influenced by Science and Technology Policy Governance? Transatlantic Comparisons. In Innovation, Science and Institutional Change: A Research Handbook. New York: Oxford University Press, pp. 221–55. Available online: https://global.oup.com/academic/product/innovation-science-and-institutional-change-9780199573455?cc=us&lang=en& (accessed on 10 September 2019).
  44. Lafuente, Esteban, and Jasmina Berbegal-Mirabent. 2019. Assessing the Productivity of Technology Transfer Offices: An Analysis of the Relevance of Aspiration Performance and Portfolio Complexity. The Journal of Technology Transfer 44: 778–801. [Google Scholar] [CrossRef]
  45. Landes, D. S. 1970. The Unbound Prometheus: Technological Change and Industrial Development in Western Europe from 1750 to the Present. Australian Economic History Review 10: 93–94. [Google Scholar] [CrossRef]
  46. Laperche, Blandine. 2002. The Four Key Factors for Commercialising Research: The Case of a Young University in a Region in Crisis. Higher Education Management and Policy 14: 149–75. [Google Scholar] [CrossRef]
  47. Lee, Yong Joo, Seong-Jong Joo, and Hong Gyun Park. 2017. An Application of Data Envelopment Analysis for Korean Banks with Negative Data. Benchmarking: An International Journal 24: 1052–64. [Google Scholar] [CrossRef]
  48. Leinweber, David J. 2007. Stupid Data Miner Tricks: Overfitting the S & amp P500. The Journal of Investing 16: 15–22. [Google Scholar] [CrossRef]
  49. Leisyte, Liudvika. 2011. University Commercialization Policies and Their Implementation in the Netherlands and the United States. Science and Public Policy 38: 437–48. [Google Scholar] [CrossRef]
  50. LIWA. 2016. LIWA: Who We Are. R & D. Linking Industry with Academia (blog). Available online: https://liwatrustorg.wordpress.com/who-we-are/ (accessed on 10 September 2019).
  51. Mamudu, Azumah, and Frederick Koffi Hymore. 2016. Enhancing University-Industry Collaboration in Ghana for Improved Skilled Labour. Accra: INCEDI, Available online: https://www.sciencedirect.com/science/article/abs/pii/0024630189900897 (accessed on 10 September 2019).
  52. Manyika, James, Michael Chui, Jacques Bughin, Richard Dobbs, Peter Bisson, and Alex Marrs. 2013. Disruptive Technologies: Advances That Will Transform Life, Business, and the Global Economy. Online Report. New York: McKinsey Global Institute, Available online: https://www.mckinsey.com/business-functions/digital-mckinsey/our-insights/disruptive-technologies (accessed on 10 September 2019).
  53. Maresova, Petra, Ruzena Stemberkova, and Oluwaseun Fadeyi. 2019. Models, Processes, and Roles of Universities in Technology Transfer Management: A Systematic Review. Administrative Sciences 9: 67. [Google Scholar] [CrossRef]
  54. Maya, S. 2010. Capacity Building for Technology Transfer in the African Context: Priorities and Strategies. Harare: UNFCC, Available online: https://unfccc.int/files/documentation/workshops_documentation/application/pdf/maya.pdf (accessed on 10 September 2019).
  55. Mazurelle, Jean, and Paul Ginies. 2010. Africa Shapes Its Elites: Success Story. Available online: http://www.editions-harmattan.fr/index.asp?navig=catalogue&obj=livre&no=32752 (accessed on 10 September 2019).
  56. McAdam, Maura, Kristel Miller, and Rodney McAdam. 2018. Understanding Quadruple Helix Relationships of University Technology Commercialisation: A Micro-Level Approach. Studies in Higher Education 43: 1058–73. [Google Scholar] [CrossRef]
  57. McCullough, Rachel. 1981. Technology Transfer to Developing Countries: Implications of International Regulation. The Annals of the American Academy of Political and Social Science 458: 110–22. [Google Scholar] [CrossRef]
  58. Meng, Donghui, Xianjun Li, and Ke Rong. 2019. Industry-to-University Knowledge Transfer in Ecosystem-Based Academic Entrepreneurship: Case Study of Automotive Dynamics & Control Group in Tsinghua University. Technological Forecasting and Social Change 141: 249–62. [Google Scholar] [CrossRef]
  59. Miller, Kristel, Rodney McAdam, and Maura McAdam. 2018. A Systematic Literature Review of University Technology Transfer from a Quadruple Helix Perspective: Toward a Research Agenda. R&D Management 48: 7–24. [Google Scholar] [CrossRef]
  60. Mohamedbhai, Goolam. 2008. The Effects of Massification on Higher Education in Africa. Accra: Assocaiation for the Development of Education in Africa, Association of African Universities, Available online: http://www.africanbookscollective.com/books/the-effects-of-massification-on-higher-education-in-africa (accessed on 10 September 2019).
  61. Munyoki, Justus, Francis Kibera, and Martin Ogutu. 2011. Extent to Which University-Industry Linkage Exists in Kenya: A Study of Medium and Large Manufacturing Firms in Selected Industries in Kenya. Business Administration and Management 1: 163–69. [Google Scholar]
  62. Mustapha, Nazeem, Firdous Khan, and Gerard Ralphs. 2019. Technology Transfer in South Africa. Scientific. Pretoria: Human Sciences Research Council in Collaboration with Southern African Research and Innovation Management Association (SARIMA), the National Intellectual Property Management Office (NIPMO), and the Department of Science and Technology (DST), Available online: http://www.hsrc.ac.za/en/departments/CeSTii/reports-cestii (accessed on 10 September 2019).
  63. Nielsen, Lynge. 2011. Classifications of Countries Based on Their Level of Development: How It Is Done and How It Could Be Done. SSRN Scholarly Paper ID 1755448. Rochester: Social Science Research Network, Available online: https://papers.ssrn.com/abstract=1755448 (accessed on 10 September 2019).
  64. Novickis, Leonids, Antanas Mitasiunas, and Viktorija Ponomarenko. 2017. Information Technology Transfer Model as a Bridge between Science and Business Sector. Procedia Computer Science 104: 120–26. [Google Scholar] [CrossRef]
  65. Nowak, Spike. 2012. On the Fast-Track: Technology Transfer in China. News. China Briefing News. September 3. Available online: https://www.china-briefing.com/news/on-the-fast-track-technology-transfer-in-china/ (accessed on 10 September 2019).
  66. OECD. 2017. Enhancing the Contributions of SMEs in a Global and Digitized Economy. Paris: OECD, Available online: https://www.oecd.org/mcm/documents/C-MIN-2017-8-EN.pdf (accessed on 10 September 2019).
  67. Osabutey, Ellis L. C., and Zhongqi Jin. 2016. Factors Influencing Technology and Knowledge Transfer: Configurational Recipes for Sub-Saharan Africa. Journal of Business Research 69: 5390–95. [Google Scholar] [CrossRef]
  68. Owen-Smith, Jason, and Walter W. Powell. 2001. To Patent or Not: Faculty Decisions and Institutional Success at Technology Transfer. The Journal of Technology Transfer 26: 99–114. [Google Scholar] [CrossRef]
  69. Oyedoyin, Bolanle O., Matthew O. Ilori, Timothy O. Oyebisi, Billy A. Oluwale, and Oluseye O. Jegede. 2013. Technology Transfer Process in Nigeria: From R&D Outputs to Entrepreneurship. International Journal of Technology Transfer and Commercialisation 12: 216–30. [Google Scholar] [CrossRef]
  70. Padgett, Brian. 1990. Technological Mobility and Cultural Constraints. In Technology Transfer in the Developing Countries. Edited by Manas Chatterji. London: Palgrave Macmillan, pp. 119–28. [Google Scholar] [CrossRef]
  71. Padilla-Meléndez, Antonio, and Aurora Garrido-Moreno. 2012. Open Innovation in Universities. International Journal of Entrepreneurial Behavior & Research 18: 417–36. [Google Scholar] [CrossRef]
  72. Park, Hyunseok, Kwangsoo Kim, Sungchul Choi, and Janghyeok Yoon. 2013. A Patent Intelligence System for Strategic Technology Planning. Expert Systems with Applications 40: 2373–90. [Google Scholar] [CrossRef]
  73. Podinovski, Victor V. 2004. Bridging the Gap between the Constant and Variable Returns-to-Scale Models: Selective Proportionality in Data Envelopment Analysis. Journal of the Operational Research Society 55: 265–76. [Google Scholar] [CrossRef]
  74. Qin, Xionghe, and Debin Du. 2017. Do External or Internal Technology Spillovers Have a Stronger Influence on Innovation Efficiency in China? Sustainability 9: 1574. [Google Scholar] [CrossRef]
  75. Ramanathan, Ramanan. 2001. A Data Envelopment Analysis of Comparative Performance of Schools in the Netherlands. Opsearch 38: 160–82. [Google Scholar] [CrossRef]
  76. Rand Corporation. 2001. Techlogy Use in Africa. Available online: https://www.rand.org/topics/africa.html (accessed on 10 September 2019).
  77. Rasmussen, Einar, and Mike Wright. 2015. How Can Universities Facilitate Academic Spin-Offs? An Entrepreneurial Competency Perspective. The Journal of Technology Transfer 40: 782–99. [Google Scholar] [CrossRef]
  78. Rasmussen, Einar, and Odd Jarl Borch. 2010. University Capabilities in Facilitating Entrepreneurship: A Longitudinal Study of Spin-off Ventures at Mid-Range Universities. Research Policy Special Section on Government as Entrepreneur 39: 602–12. [Google Scholar] [CrossRef]
  79. Rasmussen, Einar, Simon Mosey, and Mike Wright. 2014. The Influence of University Departments on the Evolution of Entrepreneurial Competencies in Spin-off Ventures. Research Policy 43: 92–106. [Google Scholar] [CrossRef]
  80. Rosenmayer, Tomáš. 2014. Using Data Envelopment Analysis: A Case of Universities. Review of Economic Perspectives 14: 34–54. [Google Scholar] [CrossRef] [Green Version]
  81. Saeed, Khalid. 1990. Prevention of Dysfunctional Environmental and Social Conditions. In Technology Transfer in the Developing Countries. Edited by Manas Chatterji. London: Palgrave Macmillan. [Google Scholar] [CrossRef]
  82. Sanberg, Paul R., and Valerie L. McDevitt. 2013. Patents: Universities Profit from Products. Nature 502: 448–48. [Google Scholar] [CrossRef] [PubMed]
  83. Sathaye, Jayant A., and Nijavalli H Ravindranath. 1998. Climate Change Mitigation in the Energy and Forestry Sectors of Developing Countries. Annual Review of Energy and the Environment 23: 387–437. [Google Scholar] [CrossRef]
  84. Son, S.Y., and T.H. Moon. 2004. Decision Tree Based on Data Envelopment Analysis for Effective Technology Commercialization. Expert Systems with Applications 26: 279–84. [Google Scholar] [CrossRef]
  85. Sparks, Donald L., and Stephen T. Barnett. 2010. The Informal Sector in Sub-Saharan Africa: Out of the Shadows to Foster Sustainable Employment and Equity? International Business & Economics Research Journal 9: 1–12. [Google Scholar] [CrossRef]
  86. Ssebuwufu, John, Teralynn Ludwick, and Margaux Béland. 2012. Strengthening University-Industry Linkages in Africa, Association of African Universities. Available online: https://www.heart-resources.org/doc_lib/strengthening-university-industry-linkages-in-africa-a-study-on-institutional-capacities-and-gaps/ (accessed on 10 September 2019).
  87. University of Pretoria. 2019. Innovation & Technology Transfer. Education & Research. Contracts & Innovation Office. Available online: https://www.up.ac.za/contracts-innovation-office/article/262155/innovation-technology-transfer (accessed on 10 September 2019).
  88. Vick, Thais Elaine, and Maxine Robertson. 2018. A Systematic Literature Review of UK University–Industry Collaboration for Knowledge Transfer: A Future Research Agenda. Science and Public Policy 45: 579–90. [Google Scholar] [CrossRef]
  89. Webometrics. 2019. Ranking of Nigerian Universities in 2019. Education. Available online: http://www.webometrics.info/en/africa/nigeria (accessed on 10 September 2019).
  90. Wolson, Rosemary A. 2007. Technology Transfer in South African Public Research Institutions. In Intellectual Property Management in Health and Agricultural Innovation: A Handbook of Best Practices. Yolo County: PIPRA. [Google Scholar]
  91. World Bank. 2008. Accelerating Catch-Up: Tertiary Education for Growth in Sub-Saharan Africa. Washington: The World Bank, Available online: http://documents.worldbank.org/curated/en/305471468202164066/Accelerating-catch-up-tertiary-education-for-growth-in-Sub-Saharan-Africa (accessed on 10 September 2019).
  92. World Bank. 2012. Africa’s Pulse, October 2012: An Analysis of Issues Shaping Africa’s Economic Future. World Bank. Arica’s Pulse. Available online: http://hdl.handle.net/10986/20239 (accessed on 10 September 2019).
  93. Wu, Yonghong, Eric Welch, and Wan Ling Huang. 2015. Commercialization of University Inventions: Individual and Institutional Factors Affecting Licensing of University Patents. Technovation 36: 12–25. [Google Scholar] [CrossRef]
Figure 1. Conceptual model for the study.
Socsci 08 00286 g001
Table 1. Ranking of some of the best universities in Nigeria (Webometrics 2019).
UniversityRanking
NigerianWorldPresenceImpact Openness Excellence
A: University of Ibadan112331775150812341566
B: University of Nigeria 216772297208410972254
C: Covenant University317042073309714961801
D: Obafemi Awolowo University420773920440517732032
E: University of Lagos52094932417917102326
F: Ahmadu Bello University622162115439521342228
G: University of Ilorin727266247652913152637
H: Federal University of Technology, Akure829354953859817322419
I: Adekunle Ajasin University, Akungba9305711612106439104695
J: University of Port-Harcourt1031828682540619943615
Table 2. Data envelopment analysis of university technology transfer performance measures.
UniversityNumber of Invention DisclosuresNumber of Licenses ExecutedLicensing Royalty Income Number of Equity Spin-OffsAverage DEA Score
A60%61%69%53%61%
B44%42%41%59%47%
C47%44%50%42%46%
D48%37%31%37%38%
E37%16%35%39%32%
F57%13%13%26%27%
G32%2%7%18%15%
H20%5%12%18%14%
I19%8%12%12%13%
J10%10%10%16%12%
Average37%24%28%32%30%
Table 3. Technology transfer office (TTO) alpha performance metrics for 2010–2017 and DEA results.
YearINPUT 1INPUT 2OUTPUT 1DEA RESULTS
Invention DisclosuresNational Patent ApplicationsLicense AgreementsEfficiency Scores
2010221020.43
2011301140.32
2012141041
2013189101
2014191041
2015261270.51
2016211050.53
201720950.42
Average0.65
Table 4. Descriptive statistics for all variables.
ParametersMinimumMaximumMeanStandard dev.Coefficient of Variation
INVDIS0114.6421.0230.831.47
FILPAT063.848.9314.371.61
EXCLIC031.623.755.721.53
LICINC020.220.841.702.02
SPICRE026.52.744.151.51
SPIEQU021.191.973.952.01
ARCNUM010224.7229.031.17
PHDSTF01112.682.70
CONMEM010.100.5275.27
Table 5. Pearson’s correlation co-efficient.
123456789
INVDIS1
FILPAT0.308 **1
EXCLIC0.450 **0.655 **1
LICINC0.188 **0.263 **0.393 **1
SPICRE0.183 **0.290 **0.324 **0.386 **1
SPIEQU0.0260.216 **0.138 **0.142 **0.314 **1
ARCNUM0.190 **0.255 **0.272 **0.221 **0.299 **0.323 **1
PHDSTF0.541 **0.690 **0.718 **0.580 **0.439 **0.320 **0.449 **1
CONMEM0.290 **0.338 **0.408 **0.576 **0.515 **0.300 **0.385 **0.640 **1
** Correlation is significant at the 0.01 level (2-tailed).
Table 6. Multiple regression analysis results.
INVDISFILPATEXCLICLICINCSPICRESPIEQU
Constant0.523−4.636−0.722−1.504−1.482−0.825
(5.252)(2.733)(1.098)(0.749)(1.746)(1.873)
ARCNUM0.264 **0.218 ***0.184 ***0.046 **0.654 **0.093 **
(0.11)(0.065)(0.043)(0.025)(0.022)(0.027)
PHDSTF3.732 ***2.183 ***3.732 **0.4652.996 ***3.732 ***
(1.736)(0.702)(0.536)(0.244)(1.548)(1.736)
CONMEM26.672 **2.9 **−4.7646.6387.622 **26.672 **
(5.727)(3.747)(3.844)(2.431)(2.784)(5.727)
Sample Size252525252525
R-Square0.728 ***0.672 ***0.719 ***0.823 ***0.739 ***0.620 ***
Adjusted R-Square0.7010.6490.6830.7910.7110.595
** Statistically significant at the 0.05 level or better. *** Statistically significant at the 0.01 level or better.

