1. Introduction: The Market in English Higher Education
Market reforms in the English higher education system since 2004 (
HM Government 2004) and continuing through the White Papers
DBIS (
2011) and
DBIS (
2016a) are designed to do two things: Differentiate the market so that there is a concentration of the highest qualified students in a small group of “elite” institutions that alone can justify charging the maximum fee (
DBIS 2011); and to ensure that the higher education (HE) market meets the demand for student places. This has been attempted partly by lifting the student numbers cap (in place from 2009–2010 to 2014–2015,
HM Treasury 2013), and by making it easier for additional “challenger” providers to enter the market (as degree awarding institutions more easily able to claim the title of universities) (
DBIS 2016a). Whilst this approach to the “massification” of HE may not be mirrored identically elsewhere, the demands on all governments to ensure that human capital is maximised and contributes to the global competitiveness of an economy is acknowledged (
Bowl et al. 2018). Equally, the English example is one of varied responses to the economic turmoil extant since the 2008 crash. Thus, whilst education policy is contextualised at the national level it has become of international interest and concern, especially for the HE sector:
…advanced capitalist economies have been informed by a neoliberal world view which advocates a retreat from public funding in order that market principles should be allowed to govern the supply, quality and perceived value of educational opportunities in the service of a global ‘knowledge economy’
The idea of a differentiated market in the specific English context is observable on two levels: On one level there is a distribution of variable tuition fees. Currently, however, the average fee across the English system stands at (£9110,
Bolton 2018), uncomfortably close to the maximum (£9250) and well above the £7500 figure modelled by government as “affordable” (in relation to public expenditure exposure to unpaid graduate debt) at the time of the fee-increase (
DBIS 2011); on the other level, as an alternative price as represented by entry requirements demanded by institutions, known as the “UCAS tariff”
1. This distribution more accurately reflects perceived quality as implied by institutional league tables (e.g., as published by the Times Higher Education and others). In fact, average entry requirements demanded are a key metric of those league tables. This latter distribution currently evidences greater differentiation than does the tuition fee distribution, which is yet to emerge as of autumn 2019.
Policy since the introduction of the £9000 (now £9250) fee regime in 2010 has focused on creating or promoting greater differentiation in tuition fees (
DBIS 2011;
DBIS 2015;
DBIS 2016a;
HM Government 2017). It is the merging of the two distributions in order that consumers can more easily identify both quality and affordability that drives the need for a dual-price scale that would enable and encourage greater fee variation. One example of policy that is aimed directly at reducing the average tuition fee across the system is the additional supply of student places provided by “challenger” institutions (legislated for by the Higher Education and Research Act (
HM Government 2017)). This would allow demand-led expansion at lower price points, first encouraged by the removal of student numbers caps (
HM Treasury 2013), to finally emerge.
The probable effect of encouraging such a distribution of fees may be to encourage “widening participation” students (in general those from poorer or otherwise underrepresented backgrounds and on average lower tariff points) to enrol disproportionately in less prestigious (but potentially lower cost) institutions and have correspondingly less opportunity for upward social mobility (
McCaig 2018b). While less prestigious institutions are often highly valued in specific fields, not least because of their vocational focus, student experience or links to employers, in a vertically differentiated system where perceived “quality” is expressed through price (expressed either as tuition fees or the UCAS tariff demanded for entry), those alternative values may go unrecognised in such a market. Given this policy context, this paper explores the prospects for shifting patterns of enrolments in English higher education to become a driver of a “dual-price” mechanism where tuition fees reflect tariff points in their distribution across a range.
2. Market Failure in a Neoliberal System
To fail the market one has to have an aim; a completely free market—the invisible hand affected by no government activity—has no aim and therefore cannot “fail”. Such a free market clears where it clears, when suppliers have filled all their places and that stands whether there are 20 universities offering 100,000 places to 7% of school leavers (as at the time of the Robbins Report in the UK (
HM Government 1963) or when 133 institutions offer 2,000,000 places to 49% of 18–30-year-olds as now. However, it is widely agreed that the English HE system does not meet the conditions under which a market could work “perfectly” (e.g.,
Marginson 2013;
Brown and Carasso 2014;
McGettigan 2013). Governments, in England as elsewhere (
Agasisti and Catalano 2006;
Molesworth et al. 2010), have nevertheless determined to make market-like interventions to inject competition into highly regulated national systems—and this forms to the definition of a neoliberal rather than free-market system, in which the state carefully regulates entry to and quality within the system. Any government is additionally free within the regulated system to introduce policy aims which it encourages through the application of “market levers” or interventions designed to change systemic behaviours (
McCaig 2018a). These interventions will necessarily play out differently in specific national contexts (e.g.,
Bowl in Bowl et al. 2018); other examples are offered by
Meek (
2000) and
Sellar (
2013) in relation to Australia;
Lynch (
2006) in relation to Ireland;
Ka Ho Mok (
1999) for China and Hong Kong;
Varman et al. (
2011) for India; and
Paulsen and St. John (
2002) for the United States. It is in relation to the outcome of such policy aims that we can speak of “market failure”.
In the current analysis we seek to discover whether the policy of driving institutional differentiation so that a dual price (price + tariff) scale emerges is likely to succeed or fail as a policy aim; for example, if we were to hypothesise that it is an example of market failure, in what way is it failing? Is it currently failing to produce differential fees? We could conclude that, yes, it has failed to create differential fees since the £3000 fee was introduced in 2004 and since the £9000 fee in 2011. However, what of other aims: Is it failing to produce social justice, social mobility or the correct quantity of highly skilled STEM labour to meet the human capital needs of the economy? What of the most recent policy aims of expanding the number of lower cost providers (making it easier for new providers to qualify for Degree Awarding Powers (DAP) and to use University Title (UT)) and withdrawing the state underwriting of existing providers (enabling market exit for failing institutions, key elements of the 2016 White Paper DBIS 2016 and ensuing 2017 Act (
HM Government 2017)). If the main policy aims of this new regime are to reduce public spending by increasing supply at a lower average price point, thus forcing existing providers to lower their prices or “go to the wall”, we can say it has failed so far, but may yet succeed because the registration process for new lower cost providers is still ongoing. So far no institutions have yet been allowed to “fail” and “exit” (although one of the largest chains of new providers, GSM, went to the wall unregistered in August 2019) as a consequence of competition from below, but there is a general acceptance within the English HE sector that the new Office for Students (OFS) regime will not support what it deems “failing institutions”.
3. Differentiation: Supply and Demand for Undergraduate Places by Institution Type
For analysis purposes English HE institutions (HEIs) are often differentiated between selective, research-orientated universities (pre-1992s, including a sub-group of large “Russell Group” universities that also have medical schools), all of which on average demand a high tariff for most of their provision, and post-1992s which are mainly former Polytechnics or other public sector Colleges of Higher Education. These are in general “recruiting institutions” (demanding a lower tariff for most of their provision) that have less of a research focus. Analytically, these two quite distinct parts of the unitary system conform to Bourdieu’s notion of two contrasting poles, formed of an
[E]lite sector, which generates scarce social goods on the basis of autonomous cultural standards; and the mass tending to commercial sector, which is driven by quantity objectives and is partly heteronomous in relation to government and markets.
This paper uses this “binary” differentiation as the basis for our analysis of the English sector, not least because of the different relationships between supply and demand that exist for each institution type. Across the system the level of unmet demand recorded annually by UCAS data has been estimated to be between 10,000 and 20,000 18-year-old school-leavers (
UCAS 2015), and recent application rounds suggests that this demand may now have been satisfied (
UCAS 2017a) even before the expansion of providers envisaged in the most recent legislation (
DBIS 2016a;
HERA (
HM Government 2017)).
This paper discusses explanations of why policy interventions affecting supply and demand in the HE market have thus far failed to create a differentiated fee structure, and have exacerbated the failure to widen participation. The substantive argument of the paper is that government policy, whilst using the discourse of markets, has failed to recognise key characteristics or conceptualisations of a market. For example:
The market should—but does not—set the price in this version of a market, and equilibrium (achieved by a balance of supply and demand expressed by price) cannot be achieved when there is a tuition fee cap imposed by government.
The market for degrees is not homogenous; not all degrees are the same (even within the same subject disciplines); and there is differentiated demand by institution and by institution type, i.e., pre- and post-1992 institutions (
Institute for Fiscal Studies 2016;
HEFCE 2011).
Not all consumers (applicants to HE) are free to attend the institutions that demand the highest entry requirements, even if they are qualified; there is imperfect access on the demand side due to insufficient information and other factors affecting applicant mobility and the geographical spread of pre-1992 institutions.
For these and other reasons this paper aims to expose the contradiction of trying to develop a market through policy levers which fail to acknowledge the actual nature of the English HE market. Specifically, the simplistic market mechanisms laid out in
DBIS (
2011) failed to account for the wide distribution of highly demanded provision, assuming that all the best qualified applicants would accumulate at only those institutions at the top of the institutional hierarchy as expressed by league tables. This failure is manifested in continuing high demand and thus the maintenance of high tuition fees across the distribution of institutions. Driven by the political and economic need to reduce the public expenditure exposure to student debt non-repayment, more recent government policy (
DBIS 2015;
DBIS 2016a;
HERA (
HM Government 2017)) has added “risk” and “exit” in the form of expanded cheaper provision. This competition, in the form of teaching-only new providers, would widen access, but “ghetto-ise” the disadvantaged in low-status cheap institutions, a world away from the cloistered, unreformed elite:
…those institutions that do the most to welcome students from a range of disadvantaged backgrounds, support them to remain on their courses (such students are often at a higher risk of dropping out) and help them to progress to further study or a high skilled job.
Of course, we should not forget that the new alternative and cheaper providers are also those most likely to fail in the new risk-based system, potentially leaving those from disadvantaged backgrounds high and dry. This paper proceeds by establishing the historical gestation of the current highly marketised system, before exploring patterns in recent acceptances data that contextualise the prospects for a dual-price mechanism to fully emerge.
4. The Introduction of Risk and Exit
The most recent attempt to inject market competition into the English HE system is the 2016 White Paper
Success as a Knowledge Economy: Teaching Excellence, Social Mobility and Student Choice (
DBIS 2016a) and the subsequent Higher Education and Research Act (
HM Government 2017). This introduced several regulatory changes to encourage new providers to enter the market, thus increasing the supply of places and removing the state’s traditional obligation to support financially failing providers. These took the form of measures to make it easier for new providers to gain Degree Awarding Powers (DAP), the right to use University Title (UT) and market entry with a lower proportion of HE students (of total students). Potentially the encouragement of “challenger” providers could be at the expense of existing institutions:
The possibility of exit is a natural part of a healthy, competitive, well-functioning market and the Government will not, as a matter of policy, seek to prevent this from happening. The Government should not be in the business of rescuing failing institutions—decisions about restructuring, sustainability, and possible closure are for those institutions’ leaders and governing bodies.
Actual existential risk (i.e., of business failure) has now become a feature of the English system for the first time since the state began funding HE in 1919. Government anticipate that “the number of Alternative Providers with DAPs is expected to increase from 9 in 2014/15 to 51 in 2018/19; and to 118 by 2027/28” (
DBIS 2016b, p. 25). Potentially this new policy regime will enable rapid expansion of supply among new providers at a lower price point by either replacing existing providers or creating additional places. In addition, the absence of support for those institutions who fail to recruit would enable the market to more clearly identify what the student wants in terms of quality, tuition fee and type of provision.
5. The Neoliberal Market in English Higher Education
The theoretical “neoliberal market model for higher education” (
Marginson 2013) is based on the assumption that the market is the most effective and efficient distributor of goods and services (
Lynch 2006;
Agasisti and Catalano 2006;
Brown and Carasso 2014;
Newman and Jahdi 2009). However, as already noted, markets in HE are very different from perfect competition models of a market (
Marginson 2013;
Brown and Carasso 2014;
McGettigan 2013;
Agasisti and Catalano 2006;
Molesworth et al. 2010). Neoliberalism is thus defined as use of market levers (typically incentives to enhance demand and supply) employed by governments within a regulated system in an effort to change behaviours, be they institutional, academic or student behaviours (
McCaig 2018b). Theoretically, supply and demand for student numbers in England should be affected by recent policy reforms, but as we have seen, even where enrolment numbers have shifted between institutions and institution-types (an important distinction) this has so far failed to lead to a tuition fee differential between institutions
In conditions where there is no student number cap (i.e., England since 2015–2016), institutions are free to supply as many places as they wish. Supply positively correlates to price so the higher the price, in this case tuition fees, the more likely institutions are to generate a surplus of revenue and thus they increase the supply of places. However, the most prestigious (high tariff) institutions may not automatically expand supply to meet demand if this would diminish their status in any way, i.e., damage the perceived status of their institution. Indeed, there has been no growth in undergraduate numbers at Oxford and Cambridge which have remained virtually static for over a decade, while they have both expanded post-graduate and international student numbers (
McKie 2018;
Coughlan 2019b). Other high tariff institutions have, however, expanded as we would expect.
UCAS data from the first two years following the removal of the undergraduate numbers cap suggests that higher tariff institutions are increasing supply potentially at the expense of less prestigious (lower tariff) institutions (
UCAS 2016,
2017a). This expansion has not impacted on status as they have maintained their UCAS tariff (the other definition of “price”) and their numbers have grown faster than medium or low tariff institutions (
Kernohan 2019).
6. A Dual Price Scale Mechanism: The Policy Endgame?
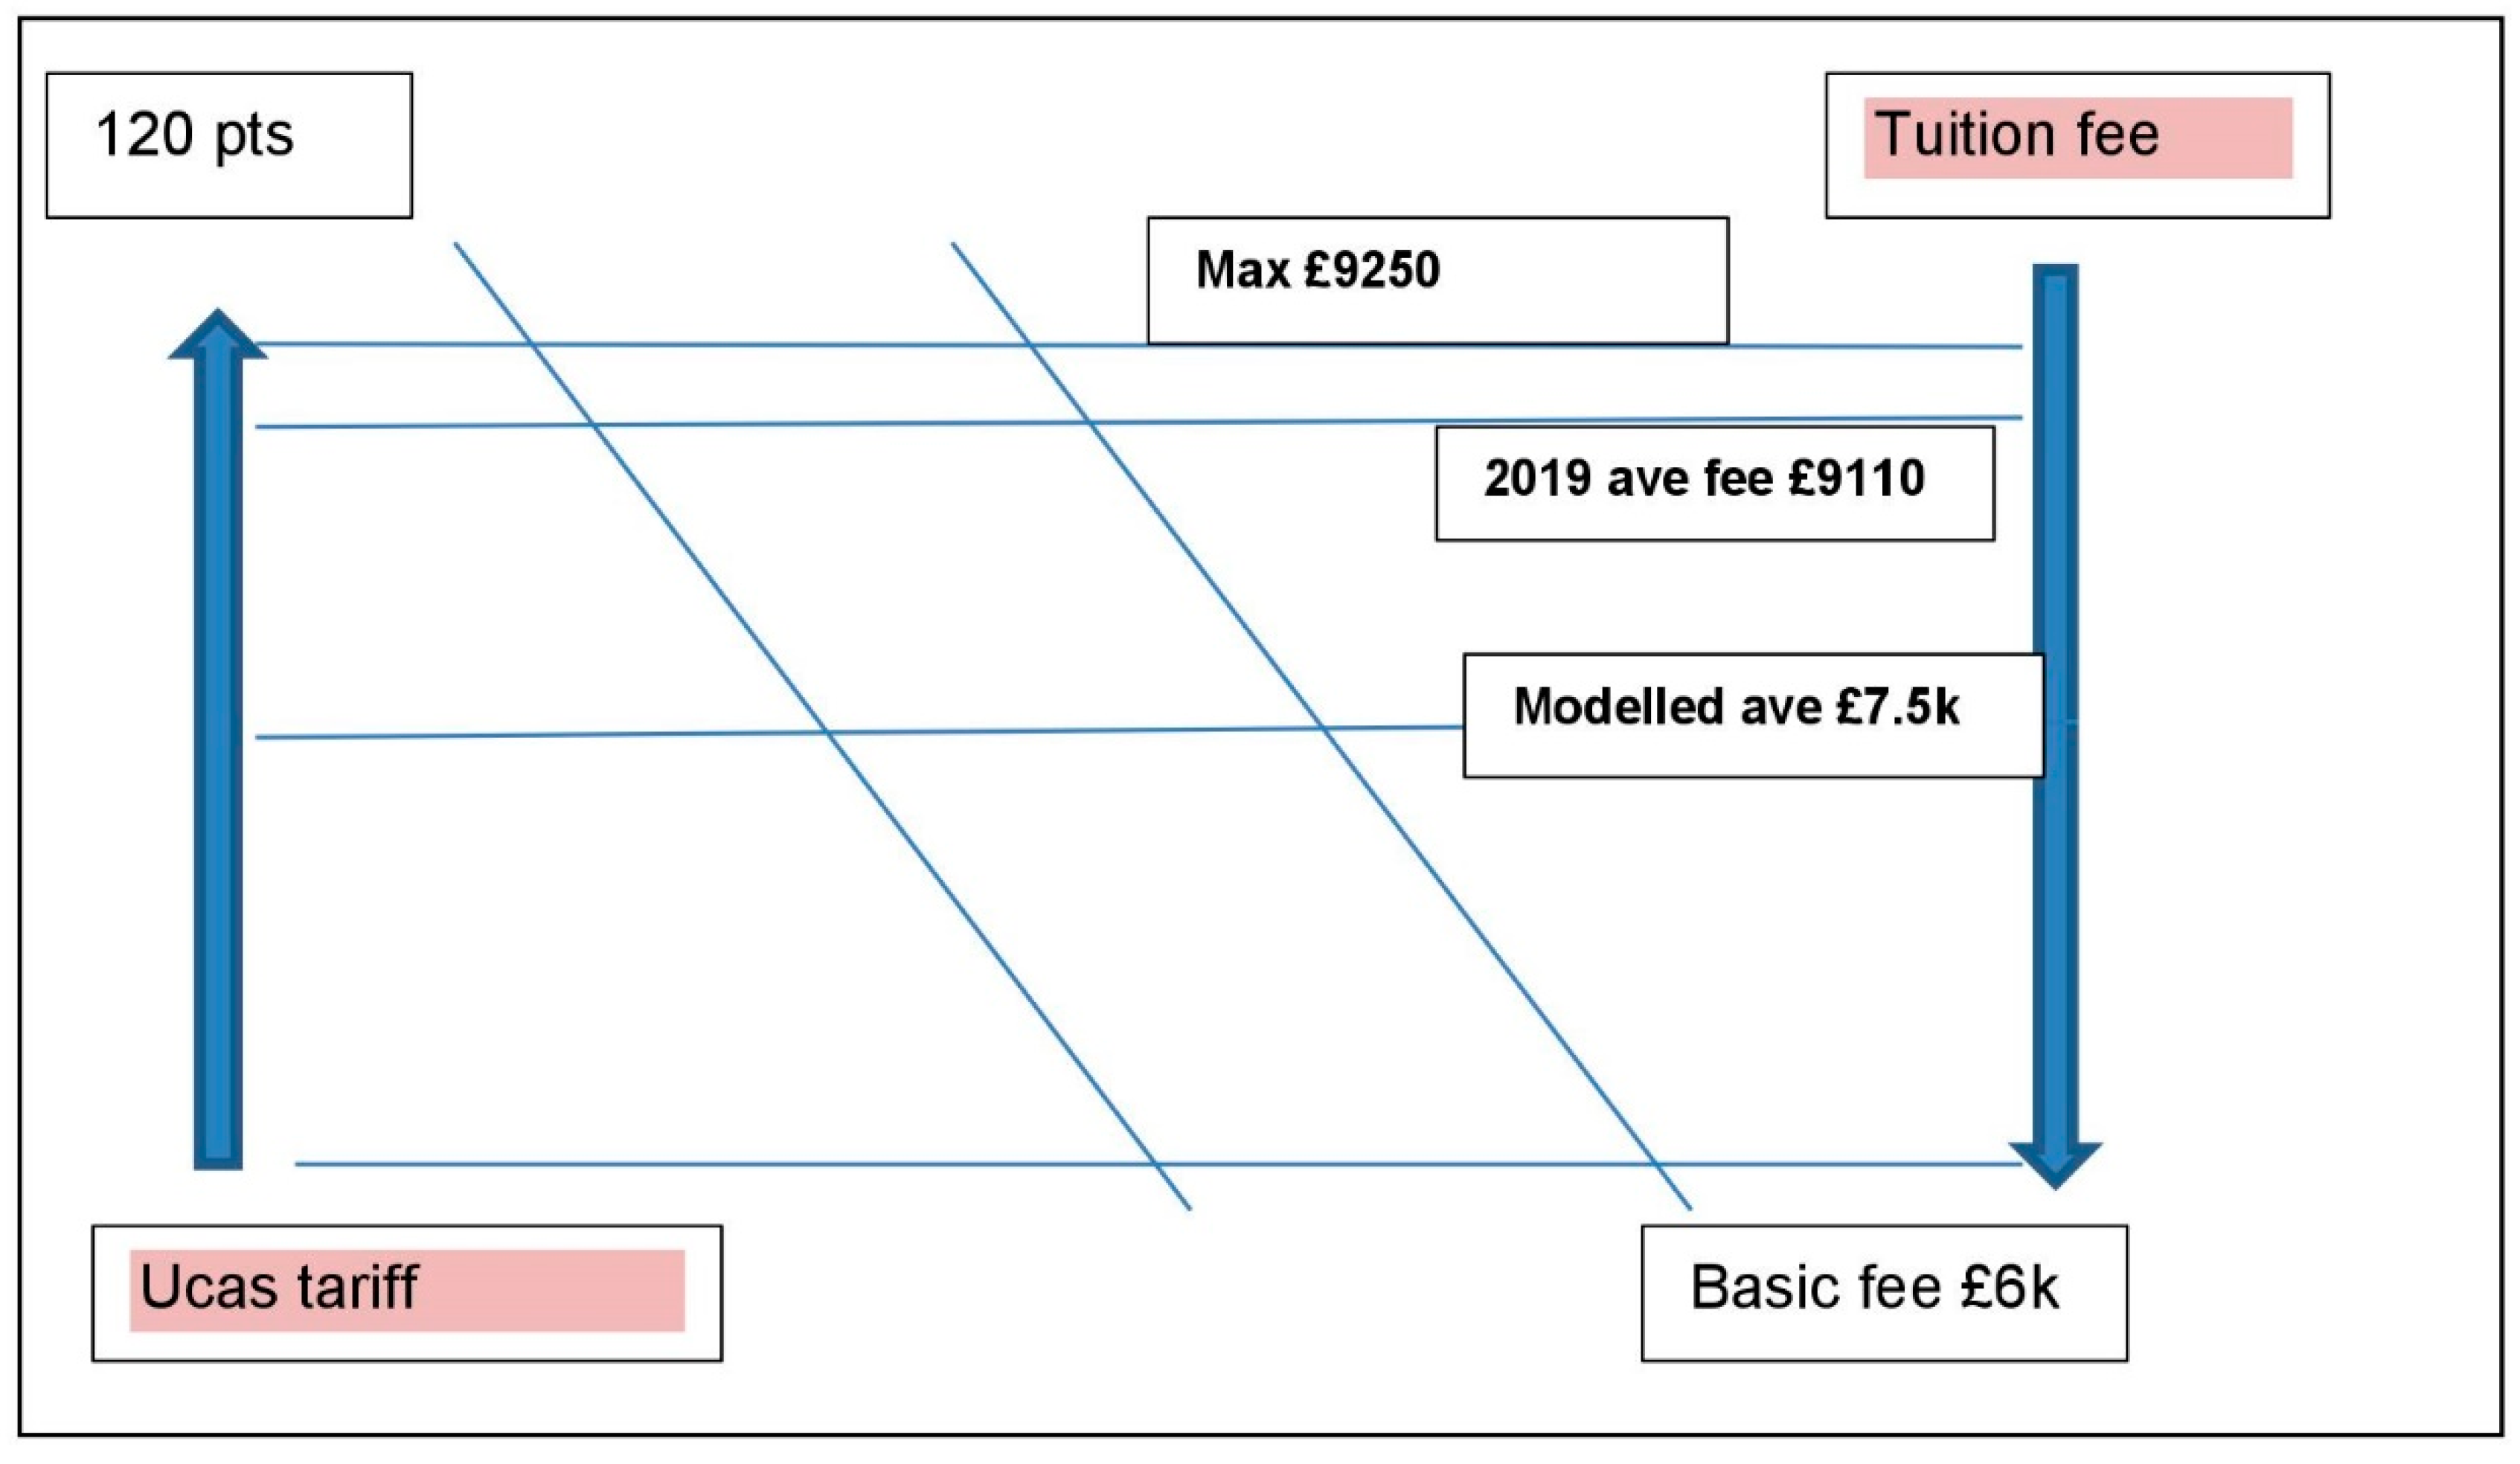
We have suggested that the key characteristic driver of the English HE market is a dual-pricing mechanism, featuring capped maximum tuition fees and the UCAS points tariff, which fits the economic theory definition of “price” more clearly, that an applicant has to achieve to be offered a place. This is created through the interaction of demand for places by students and the supply of places offered by the institution (at any given tariff point) and can be conceptualised as the real “market price” for a university place. A non-regulated dual pricing at the course level (e.g., through Longitudinal Education Outcomes data,
DfE 2016) could offer a sophisticated mechanism for maximal efficiency and is likely to appeal to governments’ wishing to ensure that only the best qualified pay the highest tuition fees while the average tuition price would fall. A dual-pricing mechanism based on an average tuition fee/tariff rate for each institution would look something like this (the maximum tuition fee is still acknowledged in the figure) (
Figure 1):
Figure 1 conceptualises the dual demand for each type of price: The highest demanded UCAS Tariff of 120 points is matched by the maximum tuition fee, while those institutions that can only demand lower points are only able to justify and charge the basic fee (currently £6000 per year). This would, theoretically, assert downward pressure on the average tuition fee so that it more closely aligns with government modelling at the time of the introduction of the new fee/repayment regime in 2011 (which assumed affordability for government at an average fee of £7500 per year).
Given continuing higher demand for the institutions asking for the highest tariff entry price, little would change at the “top” of this distribution (given the fee cap). However, the government’s assumption is that incentivising growth in the supply of places will satisfy existing demand and perhaps generate additional demand, especially so if these new places are at a lower price-point. As the 2015 Green Paper put it:
In a changing and more competitive sector, providers that innovate and present a more compelling value proposition to students will be able to increase their share of total students—in some cases this may be at the expense of other institutions.
Elsewhere, in the ensuing 2016 White Paper, Government links this “compelling value proposition” to enhanced quality:
Competition between providers in any market incentivises them to raise their game, offering consumers a greater choice of more innovative and better quality products and services at lower cost. Higher education is no exception.
The government’s plan, therefore, has two prongs: The market effect could either increase the number of places at a lower price point or replace more expensive provision with better and lower cost provision with the same number of places. In either case the average tuition fee charged across the sector would fall and the distribution of fees would begin to reflect the distribution of demanded tariff points; the dual-price system would emerge.
However, it should be remembered that if the government was serious about price differentiation in the market it would and could take off the tuition fee cap and enable elite institutions to charge fees higher than the current ceiling. This outcome, however, is likely to contradict social mobility discourses produced by government but does clearly evidence the contradictions associated with the government’s push to marketise HE while at the same time containing public expenditure.
7. Institutional Price Setting: The Prospects for a Dual-Pricing Mechanism?
This system-wide dual-pricing model described here is useful as an illustration of the policy intention behind recent market reforms, especially in conditions when more HE providers are encouraged into the market (
DBIS 2016a). However, at the institution level there are several inhibitors that may prevent the full realisation of a simple relationship between supply of and demand for undergraduate places and dual pricing.
One such inhibitor is that the market assumes that consumers are rational in their decision-making. What this means for the English HE market is that applicants, given the publication of for example UNISTATS
2 data and league tables of university performance, will demand places from institutions and on courses which are identified as successful. However, as with some other products, consumption decisions are not solely determined by price or market conditions. Some potential consumers are averse to debt (for example for cultural reasons), prefer to attend local institutions (for example to save on maintenance or travel costs) or indeed have other non-economic motivations relating to the location, type of institution and subject they study. In other words, they do not necessarily react to the market as may have been anticipated (
Davies et al. 2008).
There are other inhibitors within the system caused by subject provision variation. For example, there are many highly demanded degree programmes offered by institutions that are not highly placed in institutional league tables, which are largely determined by research criteria. Specialised courses in Equine Studies or Horticulture, for example, which are only offered at agricultural institutions; or highly selective degrees in Arts, Design, Drama, Music and Dance offered by Conservatoires (specialist arts institutions). Many post-1992 institutions also have highly demanded degree programmes, reflecting local and regional demand, e.g., vocation-specific Maritime Engineering qualifications in parts of the country without prestigious universities (
Davies et al. 2008). All these institutions are characterised by having little or no research income.
Given the diversity of HE in the English market and the emphasis on research income in institutional league tables, a simple vertical, linear distribution of institutions (which government wishes to also reflect price distribution) is stymied by the lack of research credentials among some institutions which have high demand for their degree programmes. Research power is not distributed among institutions in the same way as high tariff requirements; to put it another way, not all the most demanded courses are at the most prestigious institutions at the top of the status hierarchy, nor do highly qualified students necessarily demand places at the highest status institutions. (
McCaig and Taylor 2017). Nor does the status hierarchy reflect perceived teaching quality, with several non-“prestigious” HE institutions and colleges achieving Gold status and other high-profile institutions achieving only Silver or Bronze ratings as measured by the Teaching Excellence Framework (
HEFCE 2017). Given the complexity of real market conditions, how has the new regime begun to affect supply and demand for English undergraduate places?
8. Analysis: The Changing Market in Acceptances Data
The first two cycles of acceptances data following the removal of the numbers cap are analysed below (
UCAS 2016,
2017a,
2017b), showing the extent that a market effect in student places may have been emerging even before the HERA 2017 regime, which should over time incentivise further market flexibility. Acceptances data reflect actual decisions by institutions on how many new students to offer places to from among those that applied—this is the point where supply and demand meet. (Note that the following analysis covers English HEIs that use the UCAS application system, which does not include all HEIs.) The UCAS data is derived from 100 institutions, 40 pre-1992, mainly selective and research-intensive universities (including the Russell Group of 20 institutions), and 60 mainly recruiting and teaching focused post-1992 universities
3.
We have suggested that the government has conceptualised the use of market mechanisms or levers resulting in pre-1992 institutions expanding their provision at the maximum tuition-fee level, and post-1992 institutions reducing or maintaining current levels of student acceptances in an effort to differentiate fees. Over time and with the influx of new “challenger” providers an expectation is that this would be accompanied by post-1992 institutions commanding lower tuition-fees and/or a reduction in overall student numbers at the institution level. Thus, the sector-wide average tuition fee would fall as the now differentiated distribution of fees begins to match the distribution of UCAS tariff points.
During the three years of the DBIS 2011 regime (2012/13 to 2014/15), 79 of the 100 providers increased acceptances; 47 (59%) by 10% or more places. At the same time a further 19 (19%) reduced acceptances over the three years. While there was growth overall and some large movements by individual providers over the three years, acceptances only grew by 3.9% (or 15,000 students) overall in the first academic year after the removal of the numbers cap (i.e., between 2014 and 2015 data), only marginally more than the 3.4% growth between 2013 and 2014. The growth figure for the period covering the first three years since the new fee regime and other effects of the 2011 White Paper was 7% overall, lower growth than during the first three years after the previous fee increase (2006–2007 to 2008–2009) when total acceptance numbers grew by 16%. UCAS data for 2016–2017 suggest that applicant growth has slowed, with an increase of only 1.3% (
HEFCE 2016;
UCAS 2017a).
8.1. Longer and Shorter-Cycle Trajectories and Institution-Type Variation in UCAS Data
Focussing on trend data for the two distinct provider types—pre-1992 and post-1992 institutions—and on variations between growth patterns over ten years and the most recent three years, reveals a shifting pattern. Over the ten-year cycle (2005/6–2014/15) post-1992s were more likely to grow their numbers at a faster rate than pre-1992s: Post-1992s grew on average 45% and pre-1992s by 36%. However, analysis of the three-year cycle (2013–2015) shows that this pattern of growth trajectory reversed. Pre-1992s were both more likely to grow their number of acceptances
and grow to a greater extent than post-1992s: Pre-1992s grew on average by 14% and post-1992s by 6%. Over the ten-year cycle 35 (87%) pre-1992s grew their acceptances by more than 10% at an average of 41% growth, compared to 47 (78%) post-1992s which grew their acceptances by more than 10% at an average of 57% growth (
Table 1).
Four post-1992s recorded growth between 81% and 90%, three between 91% and 100%, and five between 101% and 150%. One institution recorded growth of 161%, which is more than double the growth rate of any pre-1992 institution in that period. However, the three years growth data illustrates the extent to which this trend has reversed (
Table 2).
8.2. UCAS Data over the Shorter-Cycle
Conversely, over the more recent three year period (2012/13–14/15) almost all (39 of the 40) pre-1992s grew their numbers compared to 40 (67%) of the post-1992s. Two post-1992s had zero growth and another 18 (30%) recorded lower acceptances, including six that fell by more than 10% over the period.
Among those institutions that grew numbers, at each level pre-1992s recorded the most growth in undergraduate acceptances. Twenty-four (60%) pre-1992s grew acceptances by more than 10%, compared to 23 (38%) post-1992s; 13 (32%) pre-1992s grew by over 20% compared to nine (15%) post-1992s; and four pre-1992s and two post-1992s grew by over 30%. On average pre-1992s grew by 22% over the three-year period compared to 6% among post-1992s.
8.3. Early Signs of a Market Effect?
The question, then, is how much of this trajectory shift is attributable to institutions responding to various market signals or instruments (e.g., government policy or perceptions of weakening demand)? Various factors may explain this movement at the institutional level, but it seems clear that one constant is the new ability to expand the overall number of acceptances since the removal of the cap on numbers. Of the English post-1992s that have experienced falling acceptances over the whole decade, in each case their “high water mark” was 2011 (possibly due to applicants eschewing a gap year to avoid the new higher fees in 2012–2013)—but also coinciding with the demographic decline in the number of 18 year olds in society (due to last well into the 2020s,
DBIS 2016b). The non-English post-1992 institutions recording large falls in the UCAS data over the last three years (two in Scotland and one in Northern Ireland where market reforms did not apply) had high water marks in 2013 or 2014, suggesting demographic decline may be the major factor in these territories.
Longer term year-on-year analysis of the trajectories of the nine post-1992s in England that have grown by more than 20% since 2013 shows that their acceptances actually peaked around 2011 and 2012 and then surged once again only after the cap came off; the ten years growth masks the recent relative declines. Looking at the three English post-1992s experiencing the highest rates of growth reveals different patterns of trajectory over the decade. For two of them, increased numbers of acceptances formed part of a steady growth trend, but for the other large growth institution the surge in acceptances after the cap was lifted (2014–2015) actually represented only a return to its 2009 high water mark. Neither higher tuition fees nor the demographic decline would explain such a variable pattern; in the absence of more information it is safer to assume the pattern was the result of institutional strategic decisions about specific market segments.
Meanwhile the pre-1992 institutions over the 10 years period did not exhibit such large growth rates with only 19 evidencing a growth rate of 50% or above. However, in the three years of acceptances data following the DBIS 2011 fee regime (2012-13–2014-15), pre-1992 institutions appear to be showing a higher growth rate in real terms and a notable growth rate in percentage of total institutions. Pre-1992s are thus growing more quickly and are more likely to be growing than post-1992s. This suggests that whilst pre-1992s were slow to take advantage of market changes, they have since 2014–2015 become more aware and acted upon opportunities available. This is likely to be because the “high grades” number control incentive in operation from 2012–2013 acted as a zero-sum game, obliging pre-1992s to swap one group of (high grades) applicants for another (with lower grades). Lifting the numbers cap has enabled them to grow those highly demanded (but relatively low tariff) programmes again whilst maintaining their numbers of high tariff students (
Taylor and McCaig 2014). This trend would potentially squeeze middle-ranking institutions, as indeed the most recent UCAS data suggests. Figures published after the release of A-level results show that universities with the lowest entry standards were continuing to lose out to more prestigious institutions in the enrolments battle. According to UCAS data issued in August 2018, the number of UK-domiciled students accepting places at “lower-tariff” institutions during the market clearing stage
4 was down 5700 (3.8%) on the previous year. This comes on the back of a 5.6% drop the previous year (
McKie 2018).
9. Discussion
Recent research into the impact of student number controls (specifically the “high grades” AAB+ regime between 2012–2013 and 2014–2015) showed that many pre-1992s in England felt pressured to move their student numbers away from programmes requiring lower UCAS tariff points to those—usually STEM and medicine-related subjects—requiring higher grades (
Taylor and McCaig 2014;
McCaig and Taylor 2017). This was seen as a threat to humanities, modern foreign languages and social sciences in some of the most prestigious universities (where such “high grades” are not always required in these disciplines). Some of the recent rises in pre-1992 acceptances are likely to reflect institution’s rebalancing their provision by offering more places in what remain high-demand courses, and may even be indulging in “price taking” (
Johnes and Ruggiero 2015) because price is still below equilibrium level.
Changing student acceptance numbers among post-1992s may be the result of strategic programme reviews at the institution level, followed by decisions to expand overall, shrink overall or (more likely) to rebalance their offer by shifting away from one subject area and into others that may garner more applicants. This sort of market-reactive behaviour may explain the greater variance in the patterns we see among post-1992s’ acceptances. UCAS acceptances data at the institutional level alone cannot show the extent to which other routes into HE are affected, or whether falling numbers represent numbers lost to pre-1992s, new alternative (or existing FE) providers. They may also represent strategic decisions to consolidate or even downsize to enable a shift towards an emphasis on research, or to set higher average UCAS tariff entry requirements; both of these strategies may make sense to an institution wishing to enhance its league table position, and indeed research indicates that both these strategies have been adopted by post-1992s in recent years (
Taylor and McCaig 2014;
McCaig and Taylor 2017). They may become more widespread if, in future years, such institutions were to be threatened on price by new “challenger” providers as a result of the HERA (
HM Government 2017).
10. Conclusions: The “Freer” Market in Action?
UCAS data since the numbers cap was removed suggests that there are three variable factors in play which have introduced dynamism to the market: The 2011 White paper reforms (new fee regime, informed choice and “high grades” effects); demographic decline (the reduction in the number of 18 year old applicants); and the removal of the numbers cap from 2015–2016. The ability to grow numbers due to the removal of the numbers cap seems to offer more explanatory power in relation to growth among pre-1992s. Post-1992s’ more rapid growth over the 10-year cycle obscures a degree of volatility (beyond what we may expect from the demographic decline) that suggests other market or strategic policy factors have been at play; they have clearly not been able to (or wanted to) expand numbers to the same extent as pre-1992s since the cap came off. This may be a defensive reaction to changes in competition, from pre 1992s and new entrants and a wish to consolidate their market plus compete on factors other than price such as tariff points, research profile or student experience.
Ultimately the idea of price competition is extremely risky for a lower prestige provider as it is easier to be competed against on price than on status and reputation, and as such a price war could drive prices down below a sustainable level as is envisaged in the Act and 2016 White Paper (
HM Government 2017;
DBIS 2016a). Many existing providers would suffer by falling tuition fee revenue, though government and taxpayers would benefit from lower public expenditure outlay on un-paid tuition loans. Rather than compete with new entrants on price, such institutions may try to differentiate their product through status, as evidenced through the UCAS tariff. The expansion of places witnessed among the pre-1992 group of institutions is likely to have taken place without a decline in their UCAS tariff; that is, they have no incentive to see their reputation for quality undermined and there is no regulatory pressure on institutions to lower entry requirements (e.g., for widening access purposes). Therefore, it is likely pre-1992s will expand their student numbers up to a point where they would need to reduce their tariff points to attract more students, at which point expansion is likely to halt (
Coughlan 2019a,
2019b). Focus would move more significantly to international student and post-graduate markets.
Among post-1992s the relative contraction in growth may represent an attempt to create scarcity and to raise their average UCAS tariff. This attempt to create status and, ultimately, a lack of applicant sensitivity to tuition fee changes through a higher UCAS tariff could be allied to institutions putting more emphasis on research power. This can be expressed in Research Excellence Framework outcomes and indices of research income which are included as league table metrics; together these can be seen as rational strategies to fend off new entrants competing with them on tuition price.
In terms of market failure, the first part of our argument—that enrolment patterns have begun to change due to the introduction of neoliberal market incentives that impact supply and demand at different UCAS tariff points—is borne out; the second part of the argument—that post-1992 institutions may be forced by competition to lower their fees leading to the appearance of a dual-pricing mechanism—may emerge in the coming decade, and it appears that this will happen regardless of the Augar review of HE fees (
DfE 2018), which acknowledged the failure of differentiation up to that point:
The competitive market between universities which the system of variable tuition fees envisaged has simply not emerged…
As it happened, the Augar Review’s many recommendations may not lead to any serious diminution of institutional income-per-student, not least because Parliament has the power to block any tuition-fee cuts unless they are replaced by government grants.
Whilst it is acknowledged by some that the English marketisation of higher education has surpassed other nation states, for example New Zealand and Australia (
Bowl et al. 2018, p. 44), there is a fundamental concern that the marketisation of higher education, to whatever degree, has deleterious effects on equality of access and social justice though the English HE system. This paper suggests that marketisation policies as outlined in this paper are failing to deliver the supply, quality and differentiated pricing of undergraduate places that was promised in the English market. It can be seen to represent market failure on two counts: On its own terms the “dual-price mechanism” cannot represent a good market outcome for the majority of those from disadvantaged background, because its only motive factor is simply to tell those with lower qualifications to shop around for cheaper—and inherently more risky—provision, so as to avoid crippling debts; and also by reinforcing the division between institutions and institutional types (those that can and cannot demand high entry grades) it prevents entire social cohorts and entire institutions from moving upwards in an ever more skewed reward system that negatively impacts on efforts to widen access to higher education.


