3.1. Scale Development
A composite cognitive scale measurement,
Attitudes toward Conservation (ATC) was developed and tested through participant survey and experimental assessment responses. The scale attempts to capture the participant’s cognitive latent construct related to their attitudes toward conservation, especially with respect to coral reefs. With respect to its specificity, a number of items in the scale are somewhat related to the subject of the behavioral, mental or experimental activities within which the participant assessments are often nested. The abstract generalizability of the scale links broader participant attitudes, aspirations, dispositions, and social norms of participants toward environmental conservation. Key reliability statistics on the composite scale measurements are shown in
Table 2 below.
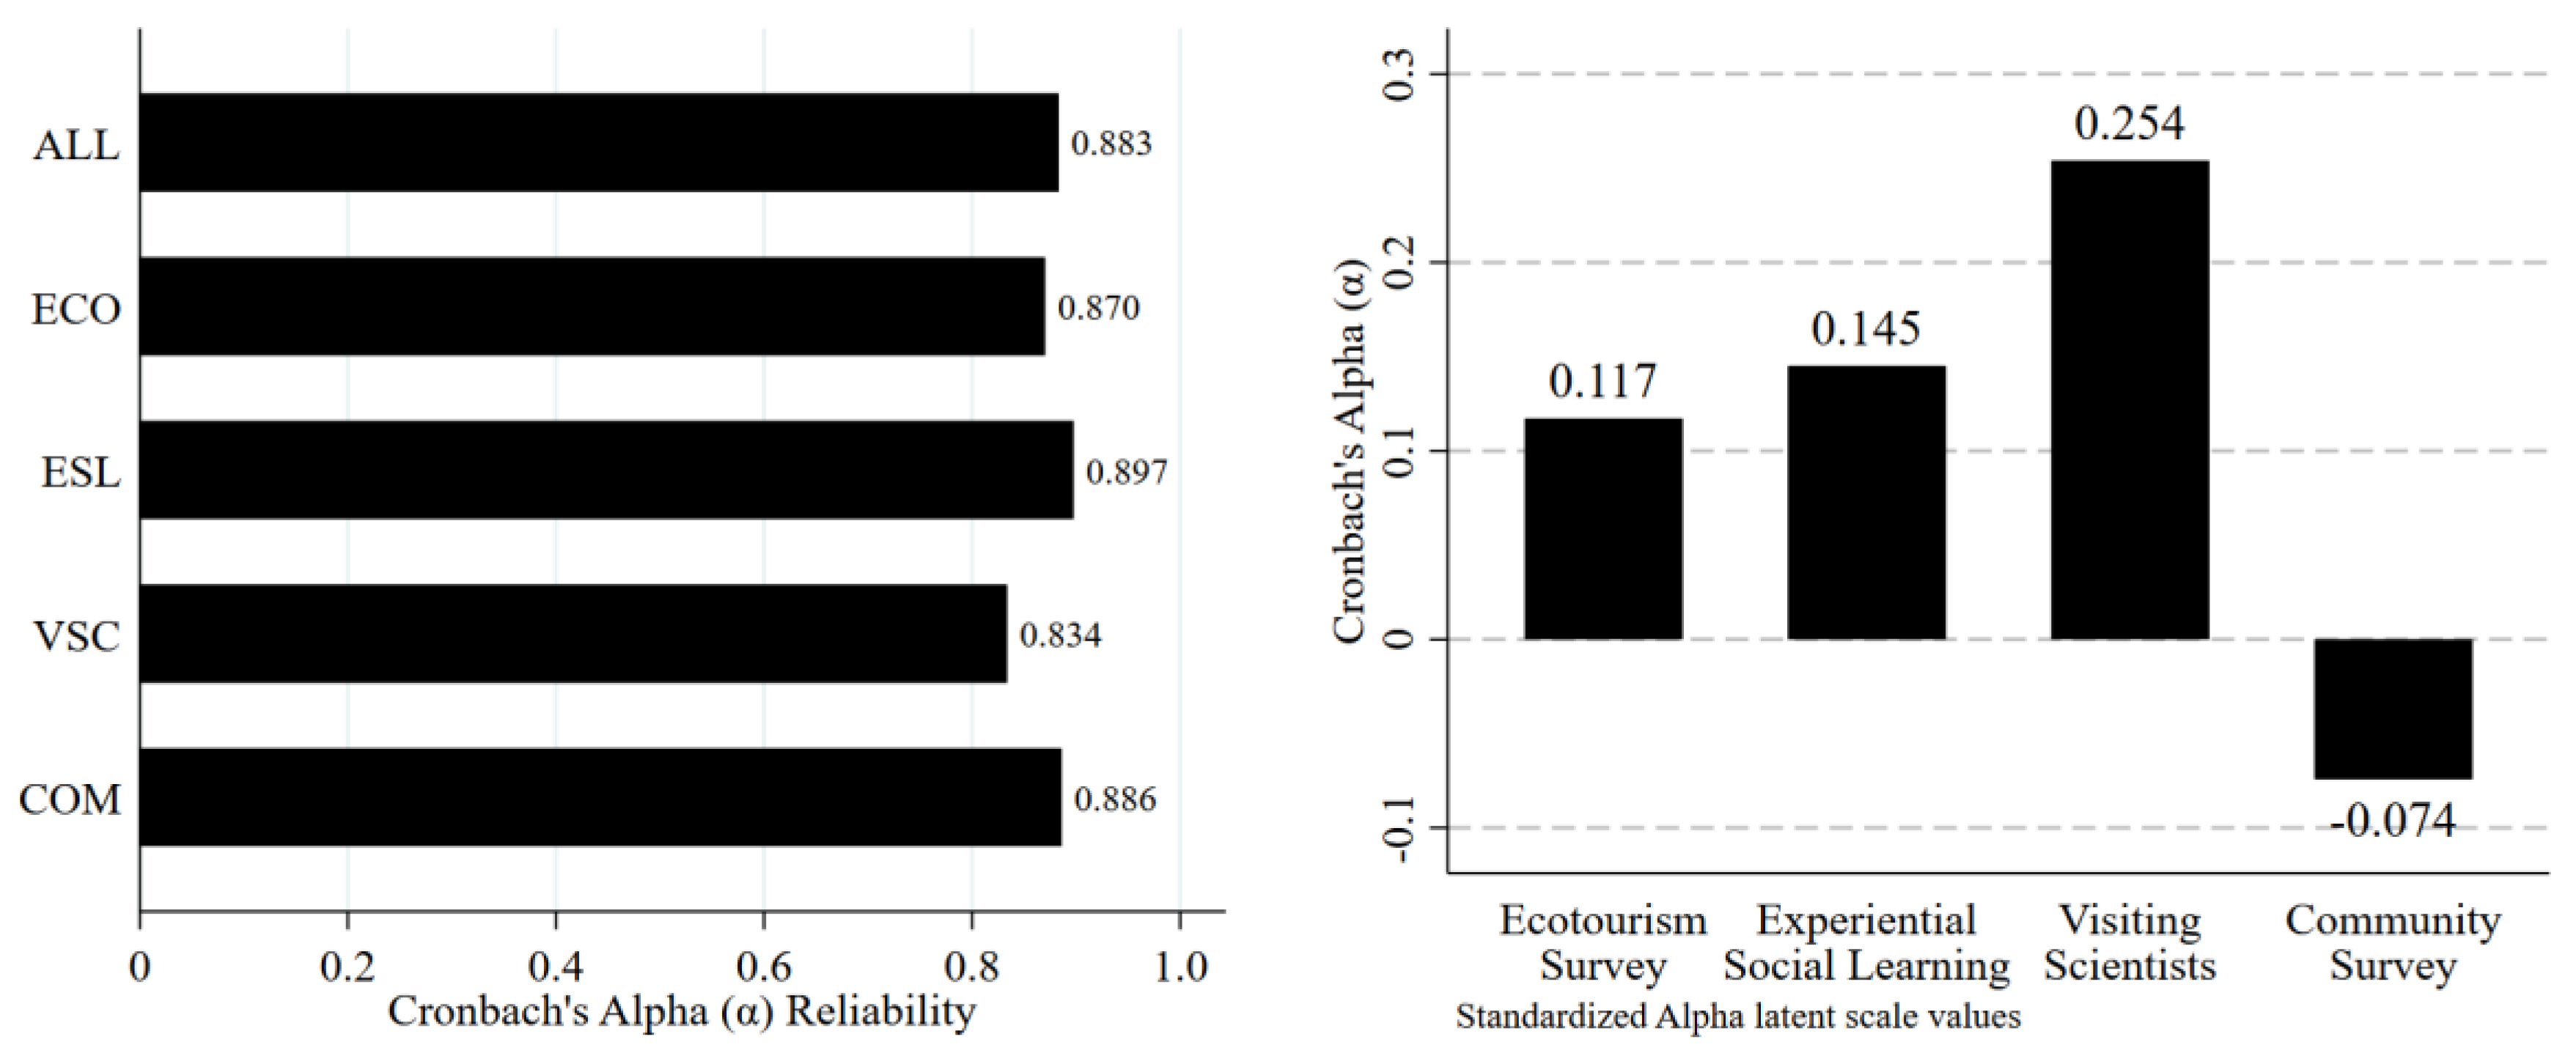
The ATC scale enjoys a relatively high Cronbach’s Alpha reliability coefficient. The Cronbach’s Alpha reliability coefficients were measured by reversing the sign of items 1 (TooMuchConcern), 3 (NoTopPriority), 5 (LawsLimit), 6 (LittleEffect), 8 (ThreatenJobs), 9 (TourismLivelihoods), 12 (FutureGenerations), 14 (EnoughDone), 15 (ConsEconConflict), and 16 (NaturalValues) in the scale. We used a two-stage algorithmic process to estimate the items to be included in order to maximize the yielded Cronbach’s alpha coefficients. The optimal scale is computed by removing items whose item-level alpha coefficient (alpha if item removed) was larger than their respective scale-level alpha. As a result, the optimal ATC scale includes 18 out of the 24 original items (α = 0.883).
The high level of the achieved reliability coefficient confirms the validity of the instrument items to capture the latent constructs under study, namely the cognitive attitudes of participants towards coral reef conservation, and the cognitive beliefs of study participants about nature in general. More specifically, the standardized alpha for the ATC latent scale of 0.883 denotes an overall correlation coefficient value of 0.940 and thus captures approximately 94.0% of the association between items in the scale and the underlying latent factor, i.e., the participant’s attitudes toward coral reef conservation.
In addition, as we can see in
Table 3, we conducted separate reliability analyses for all studies included in the data, namely the
ecotourism survey, the
experiential social learning experiments, the
visiting scientists survey, and the
community survey data. In each of the studies, the item-level standardized Cronbach’s alpha coefficient was relatively consistent as can be seen in the following
Table 3.
The graph in
Figure 1 summarizes the performance of the reliability analysis using the standardized Cronbach’s Alpha coefficient, for the standardized ATC scale. As we can see from the right subgraph, the strongest positive ATC scale mean is obtained in the
Visiting Scientists study strata (0.254 above the mean ATC overall reliability). The strongest negative alpha coefficient is obtained in the
Community survey study strata (slightly below the overall mean, by 0.074).
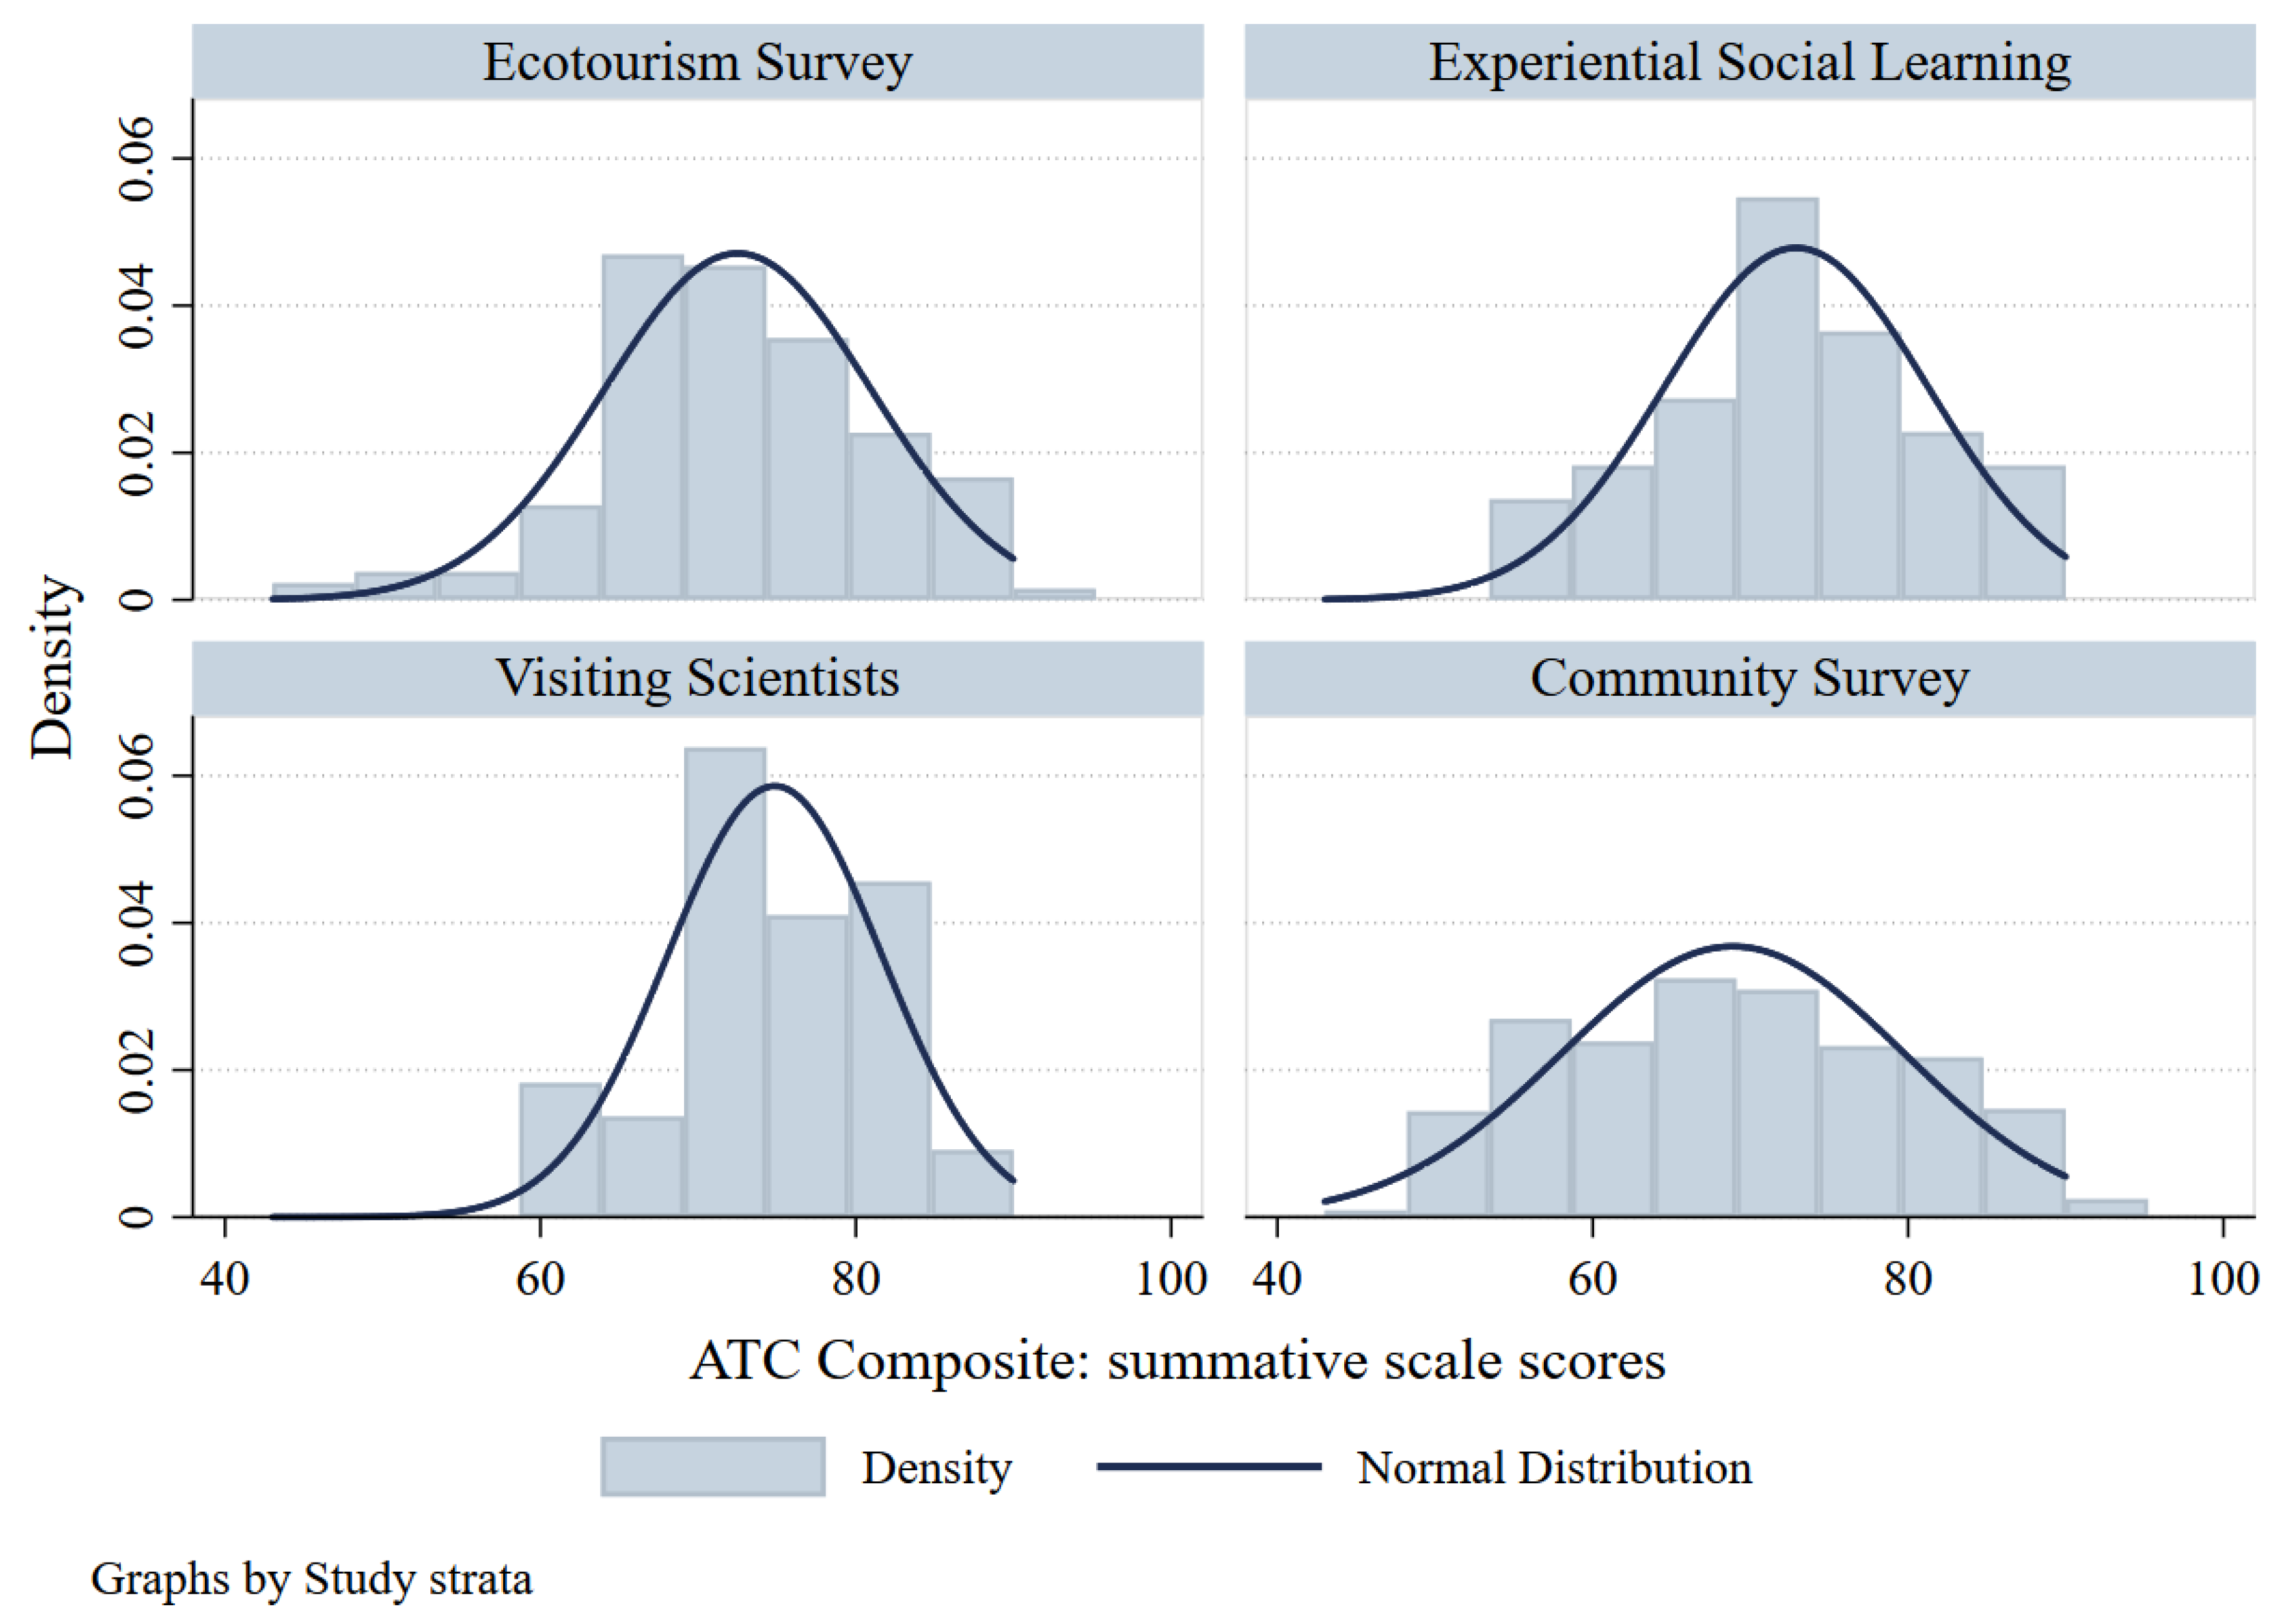
Based on the reliability analysis, we computed the raw (summative) composite scores of each participant in the study. For a five-Likert scale per item, and for the 18 scale items, the minimum score that can be achieved is 18, and the maximum is 90. We added the raw summative scores, and we rescaled the summative scale from 0 to 100. A histogram of the results for all four studies in the dataset are shown in
Figure 2. The mean summative scale score for the 963 participant observations, μ = 58.032 with standard deviation, σ
2 = 21.688.
As we can see from the subgraphs in
Figure 2, significant differences between the four study groups can be identified, both visually, and statistically. Specifically, the Ecotourism and Social learning groups have very similar characteristics on their distributional patterns and reflect similar participant demographic (and socioeconomic) characteristics.
The analysis of the items in the ATC scale provide further insight into the inferential dynamics of the latent cognitive and social constructs under study.
Table 4 presents the key item statistics for the 18-item scale development of the
Attitudes toward Conservation (ATC) construct. The scale contains eight positive statements and ten negative statements. The first column of the table shows the scale item question. The second through fourth third columns show the mean (
μ), standard deviation (
σ2, and standard error values respectively of the participant’s responses to the question using a summative Likert rating scale. The Likert scale used for the analysis ranges from negative to positive dispositions:
strongly disagree = 1;
disagree = 2;
neutral (neither agree nor disagree) = 3;
agree = 4;
strongly agree = 5 (reversed values in negative items, with
strongly disagree = 5 through
strongly agree = 1.
The last few columns of
Table 4 summarize the key reliability characteristics of the ATC scale, namely the item-test correlation (
ITC), the item-rest correlation (
IRC), the average inter-item covariance (
IIC), and the Cronbach’s alpha test coefficient (
α) if the item is removed from the scale.
By reversing the sign of the correlation coefficient (see also Equations (1) and (2)) for the negative statements and computing the relevant Cronbach’s alpha coefficient, we can see that we can obtain a relatively high reliability for our instrument, with an average value of α = 0.877 and a range from 0.871 (minimum value) on item statement 12 (“We don’t need to worry much about the corals, because future generations will be better able to deal with these problems than we are (reversed)”), to 0.884 (maximum value) on item statement 18 (“I expect to see more dramatic changes in our natural and marine environment in the future”). All items are shown to reduce the achieved Cronbach’s alpha reliability coefficient if deleted from the scale, and all items would reduce the scale’s mean value, as they present a correlated composite construct (shown in their corrected item-total correlation coefficients and their squared multiple correlation coefficients alike).
The resulting ATC scale (based on alpha coefficient scores) has 963 observations. The scale has mean of 0, variance of 0.335, and standard deviation of 0.579. The minimum and maximum scale values are −1.583 and 1.115, respectively.
3.2. Comparing Alpha Scale Estimates Across Attributes and Participant Groups
We tested for normality in the scale score distributions using multiple tests for normality. The
Kolmogorov-Smirnov (K-S) goodness-of-fit test for normality for the distribution of mean scale scores across participants had a
p-value of
p = 0.027 for the K-S Statistic
D = 0.043. Thus, we cannot reject the null hypothesis (
p < 0.05) that the Attitudes Toward Conservation scale is normally distributed across the population of participants in the study. In addition, the joint Skewness and Kurtosis test for normality in the mean scale scores indicate that cannot reject the null hypothesis (
p < 0.001) for normality. Specifically,
P(skew) = 0.074, and
P(kurt) = 0.000, with joint adjusted
χ2 = 65.690 (
p = 0.000). Finally, both the Shapiro-Wilk W test and the Shapiro-Francia W’ test for normality show that we cannot reject the null hypothesis (
p < 0.001) for normality in the scale score distributions with
W = 0.982 (
z = 5.945) for the Shapiro-Wilk test, and
W’ = 0.982 (
z = 5.649) for the Shapiro-Francia test. The results of testing for distributional normality across study participants and studies are shown in the following
Table 5.
We tested for statistically significance in the equality of mean scale scores for a number of attribute variables in the data, using the non-parametric
Kruskall-Wallis chi-square test (
Table 6). In cases with only two states, (binary conditions) the
Kruskall-Wallis chi-square test, is identical with the
Wilcoxon (Mann-Whitney) chi-square test. We also reported the
two-sample Kolmogorov-Smirnov test comparing binarized versions of the attributes, allow us to assess the asymptotic significance of the positive or negative sign of the differences.
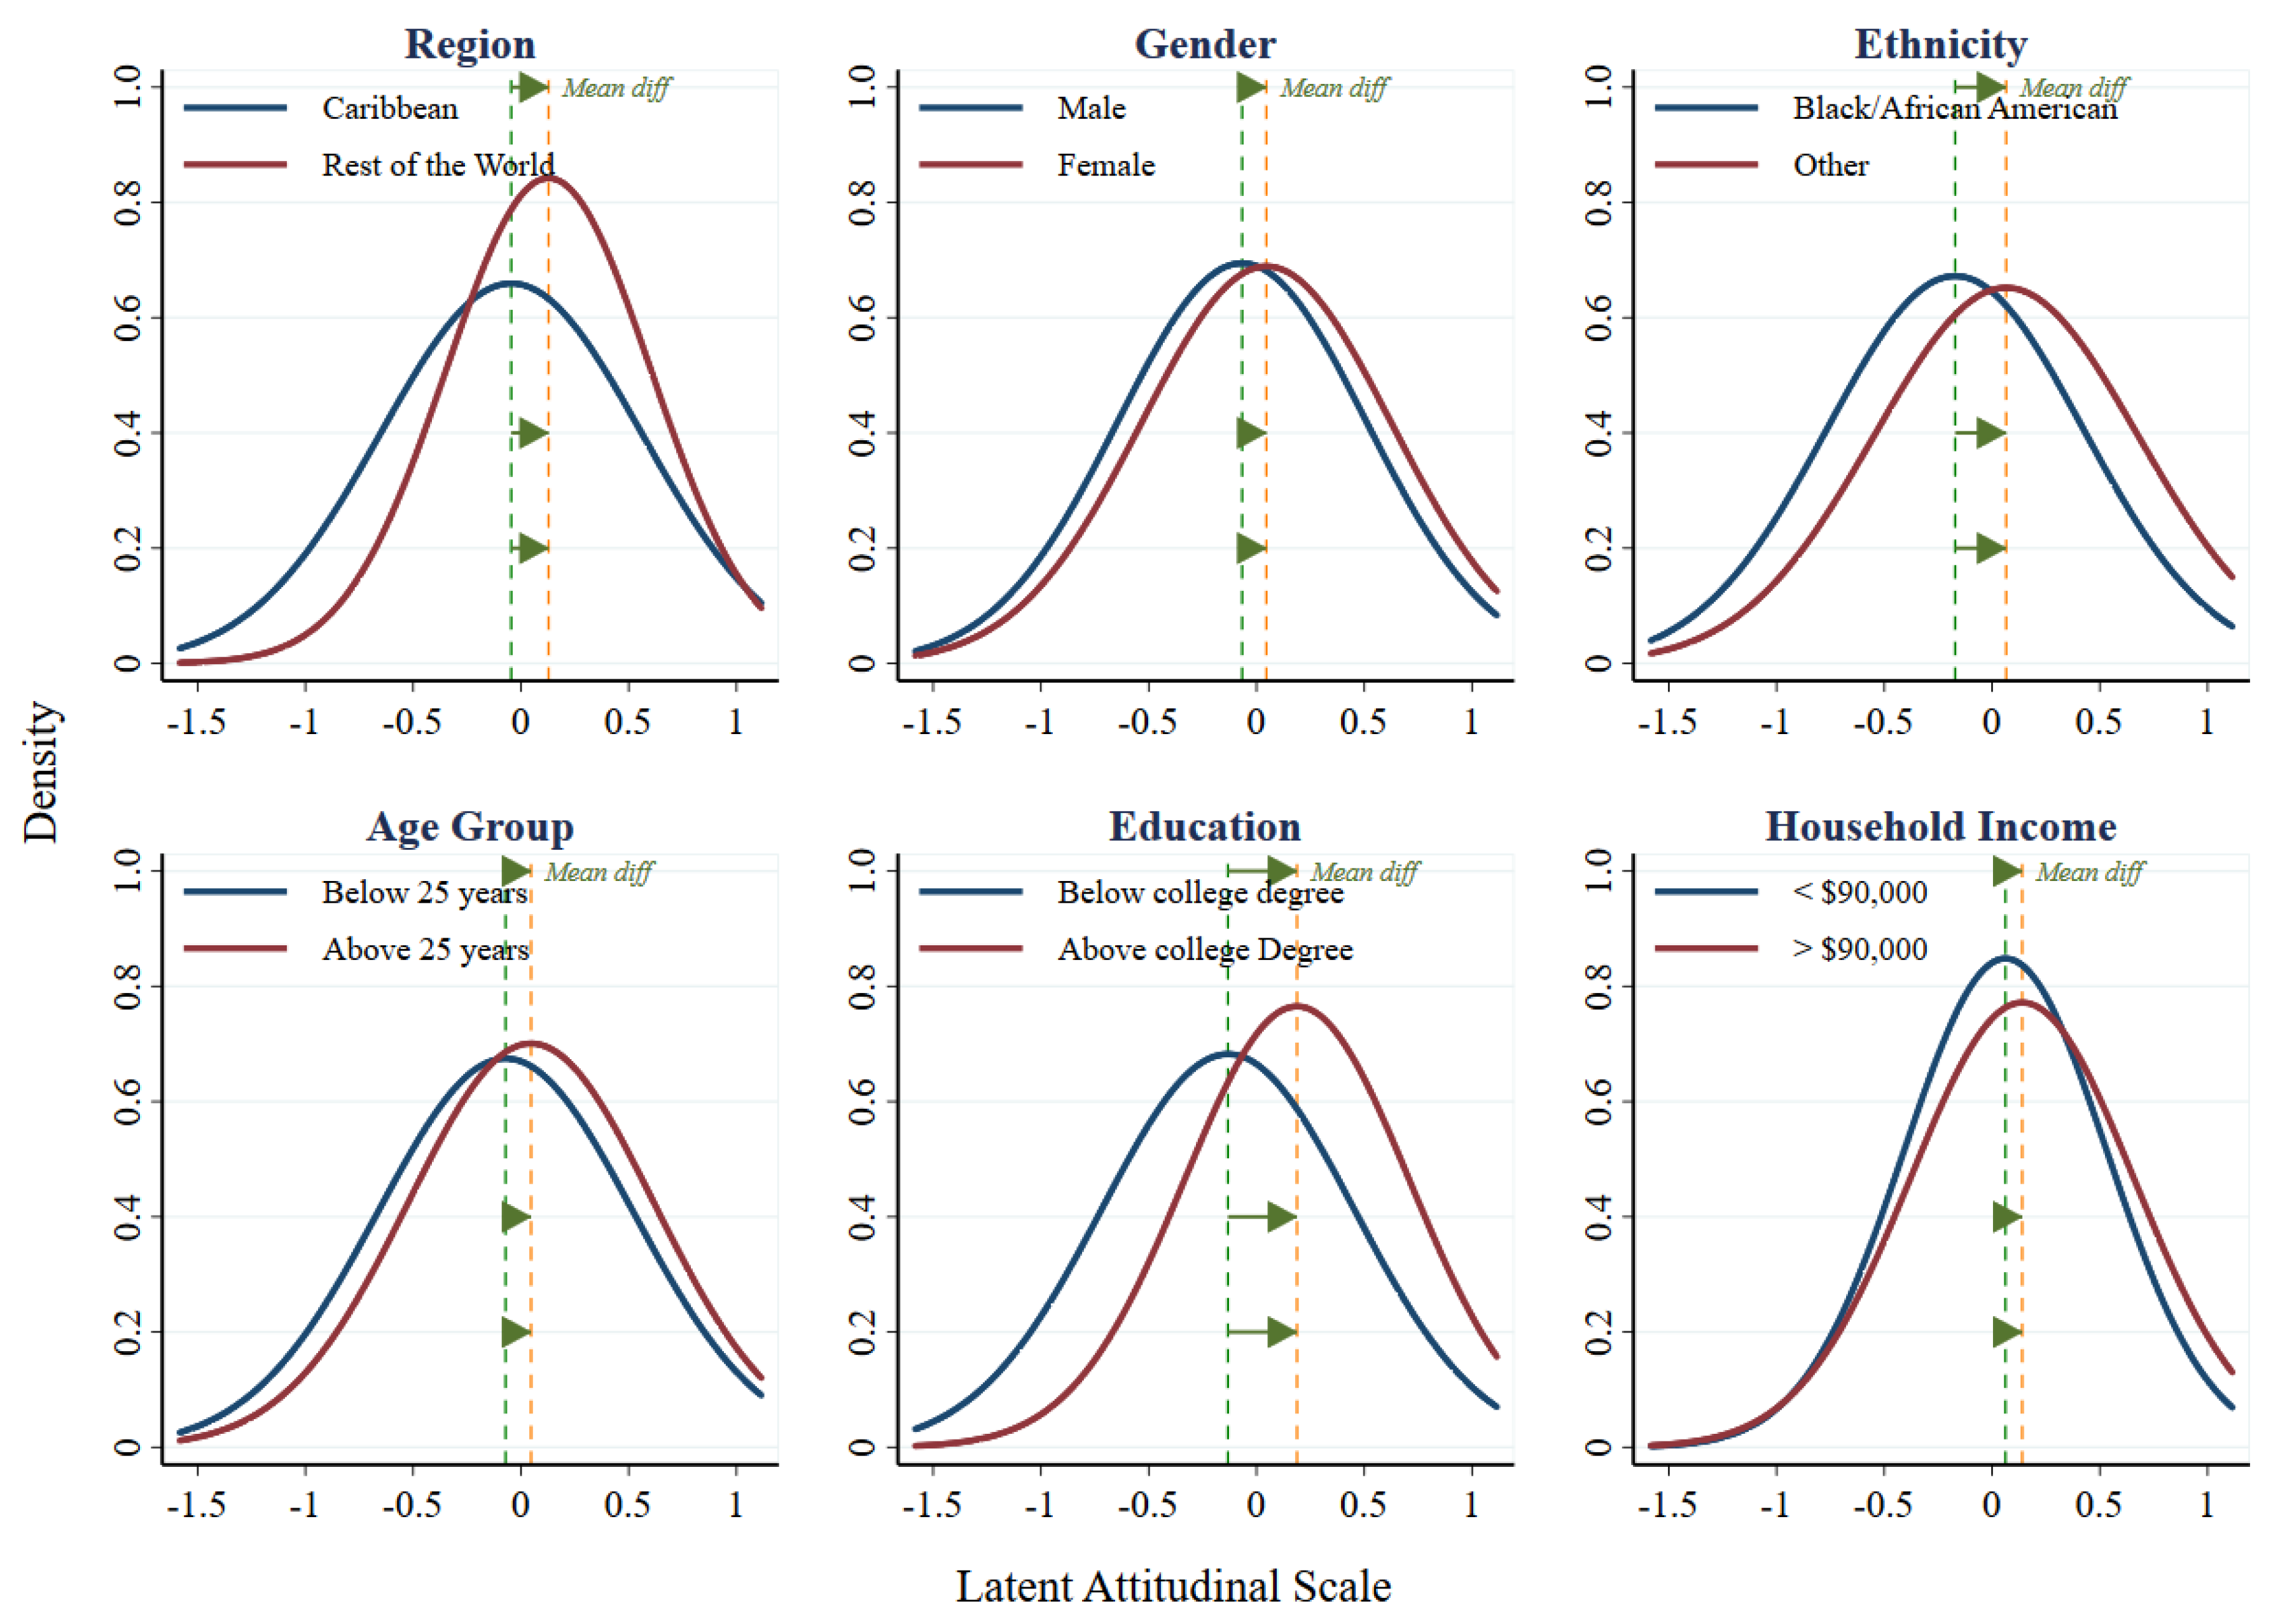
In terms of demographic and socio-economic characteristics, male participants appear to have slightly smaller values of mean scale scores than female ones (albeit barely significant—
p = 0.0017). Mean scale scores are shown to be statistically different across ethnicity groups, and furthermore, Black/African American participants have larger mean scale scores than any other ethnic group (
p < 0.001). Participants below 25 years old have lower mean scale scores than participants above 25 years (
p = 0.0011). Similarly, participants with college degree and above have larger mean scale scores than the ones without college degree (
p < 0.001). On the other hand, household income levels do not appear to be statistically significantly different among participants in terms of their mean scale scores. The selected demographic characteristic scale comparisons among participants are shown in the following
Figure 3. Additional ethnicity (other/mixed) self-identified characteristics are provided in
Appendix B of the study.
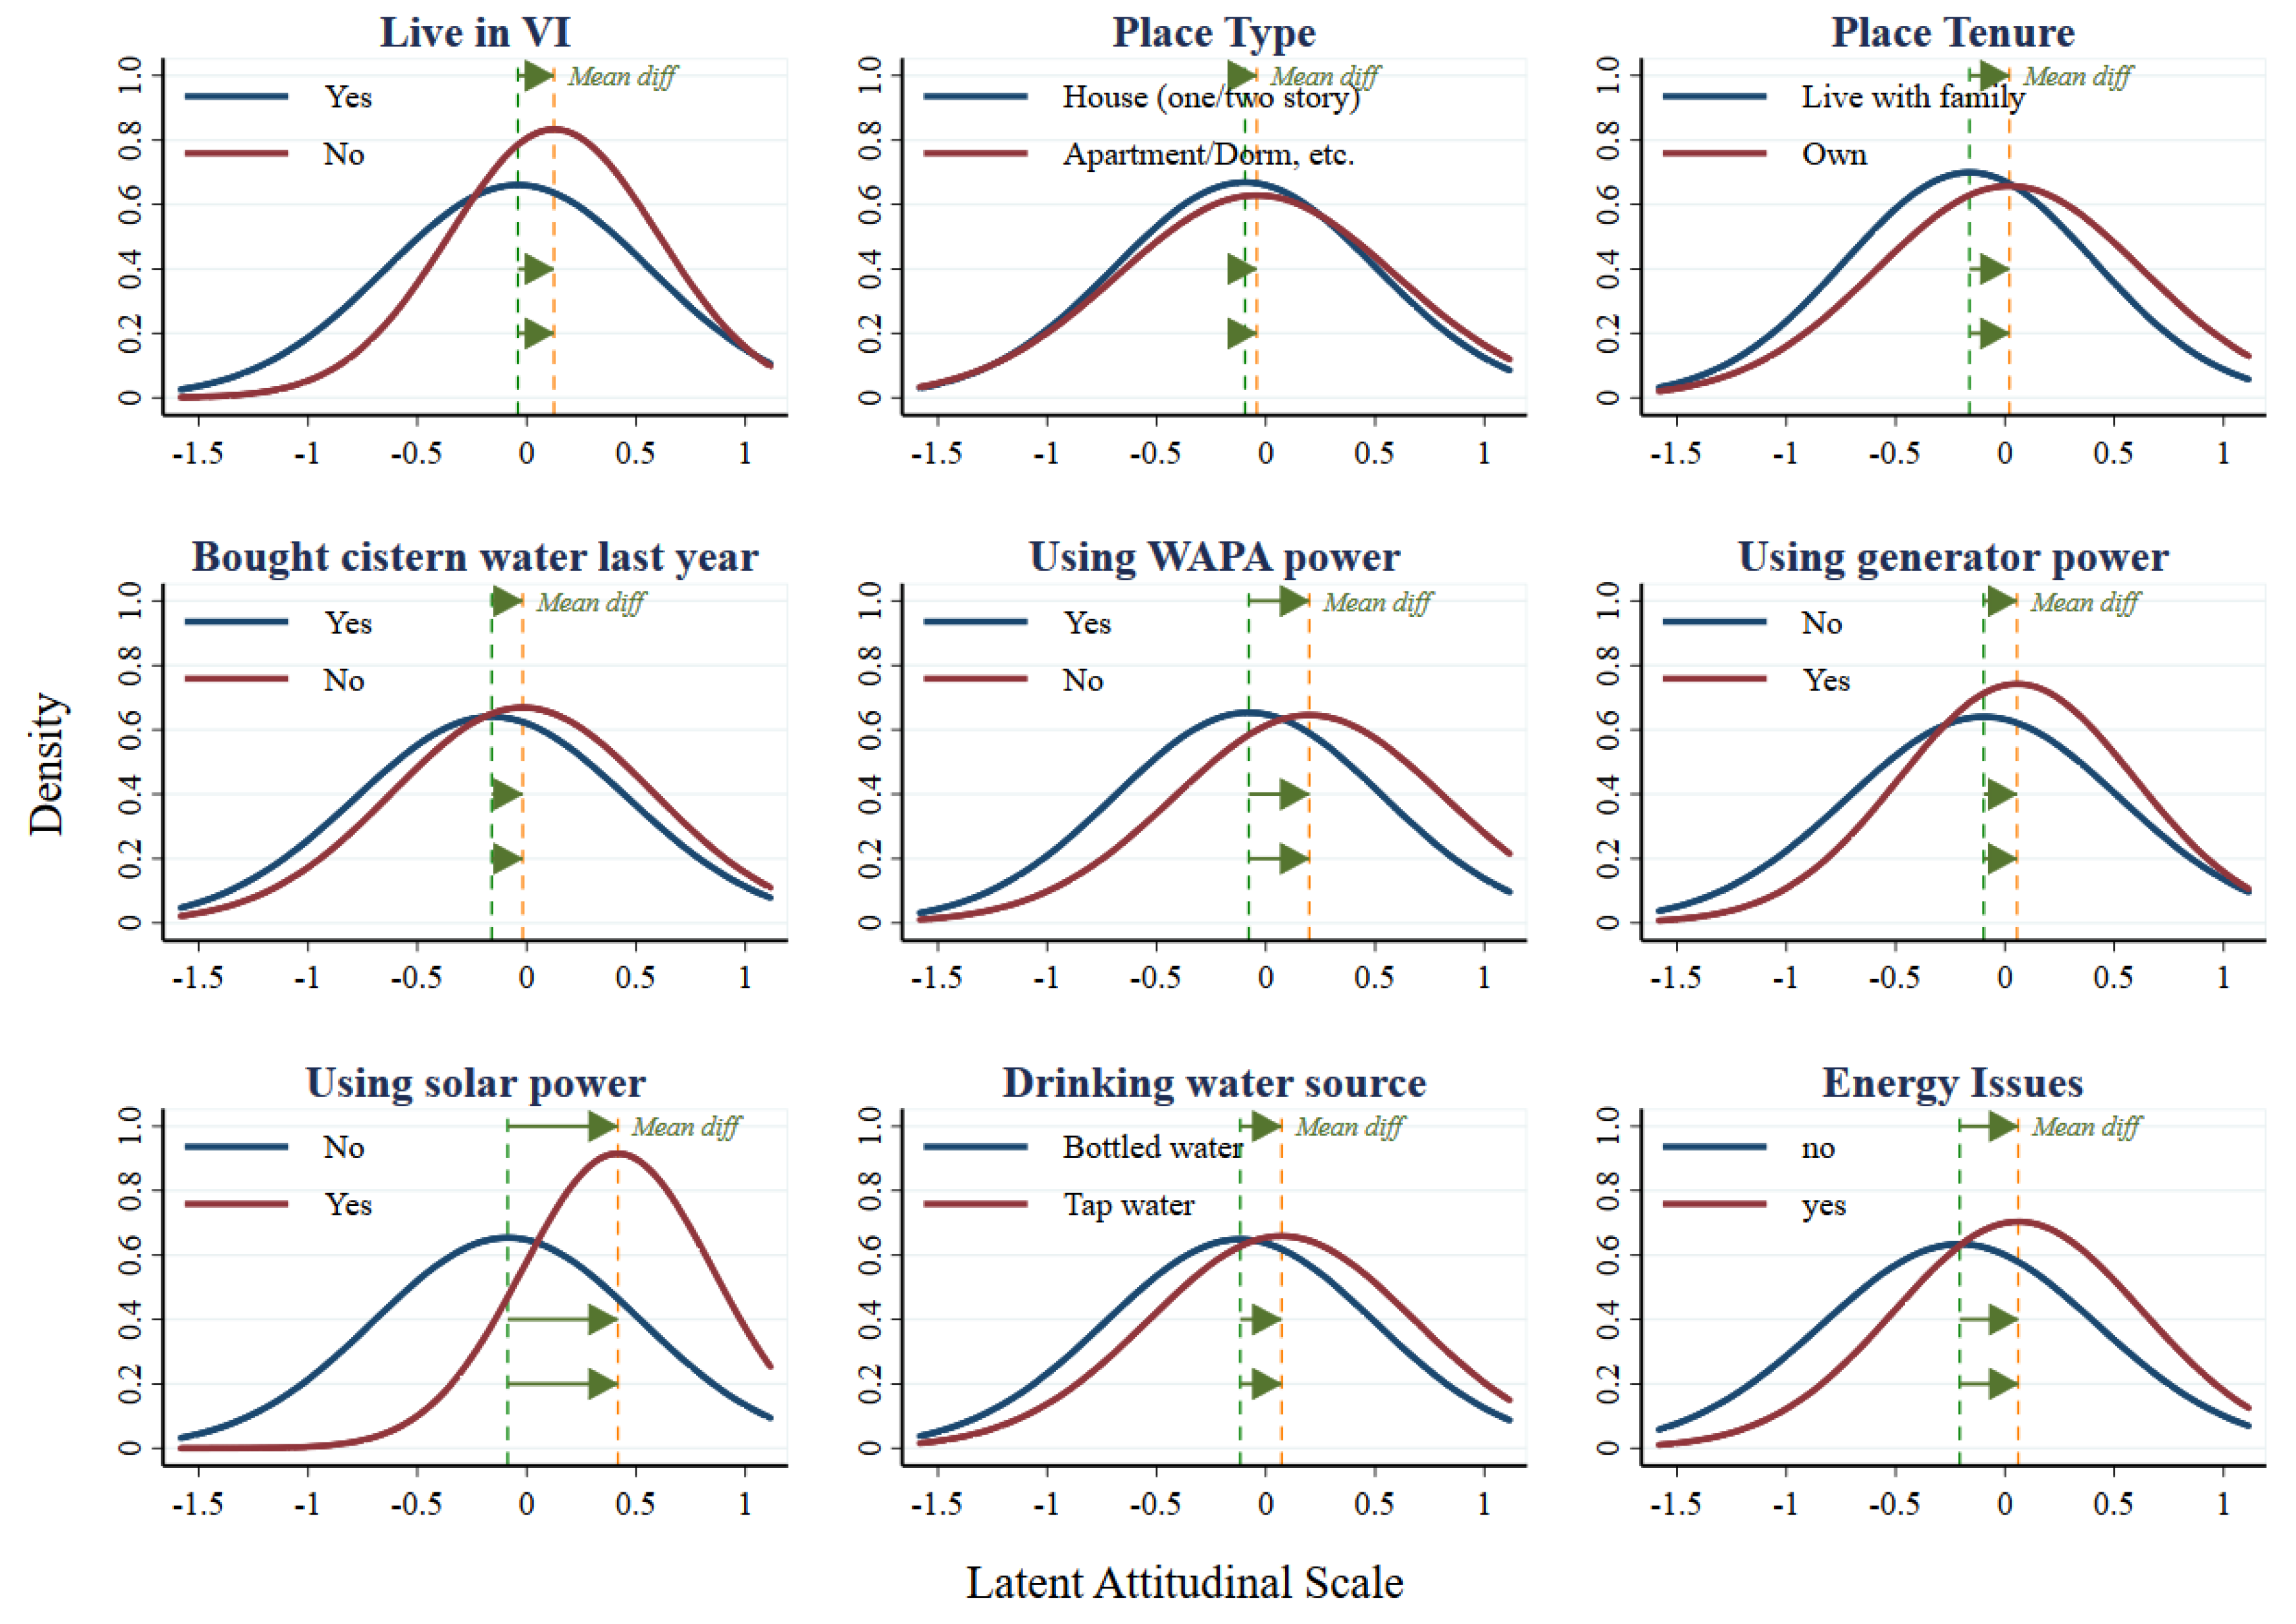
Participants who live in the US Virgin Islands have smaller mean scale scores than the ones who don’t (
p < 0.001), and furthermore, their mean scale score is slightly negative on the scale. From those participants who live in the US Virgin Islands, the type of place they live do not appear to affect their mean scale scores (
p = 0.3334), but the tenure of the living quarters does: participants who rent or own by themselves have smaller mean scale scores than those living with their family (
p = 0.0167). The selected place-based characteristic scale comparisons among participant groups are shown in
Figure 4.
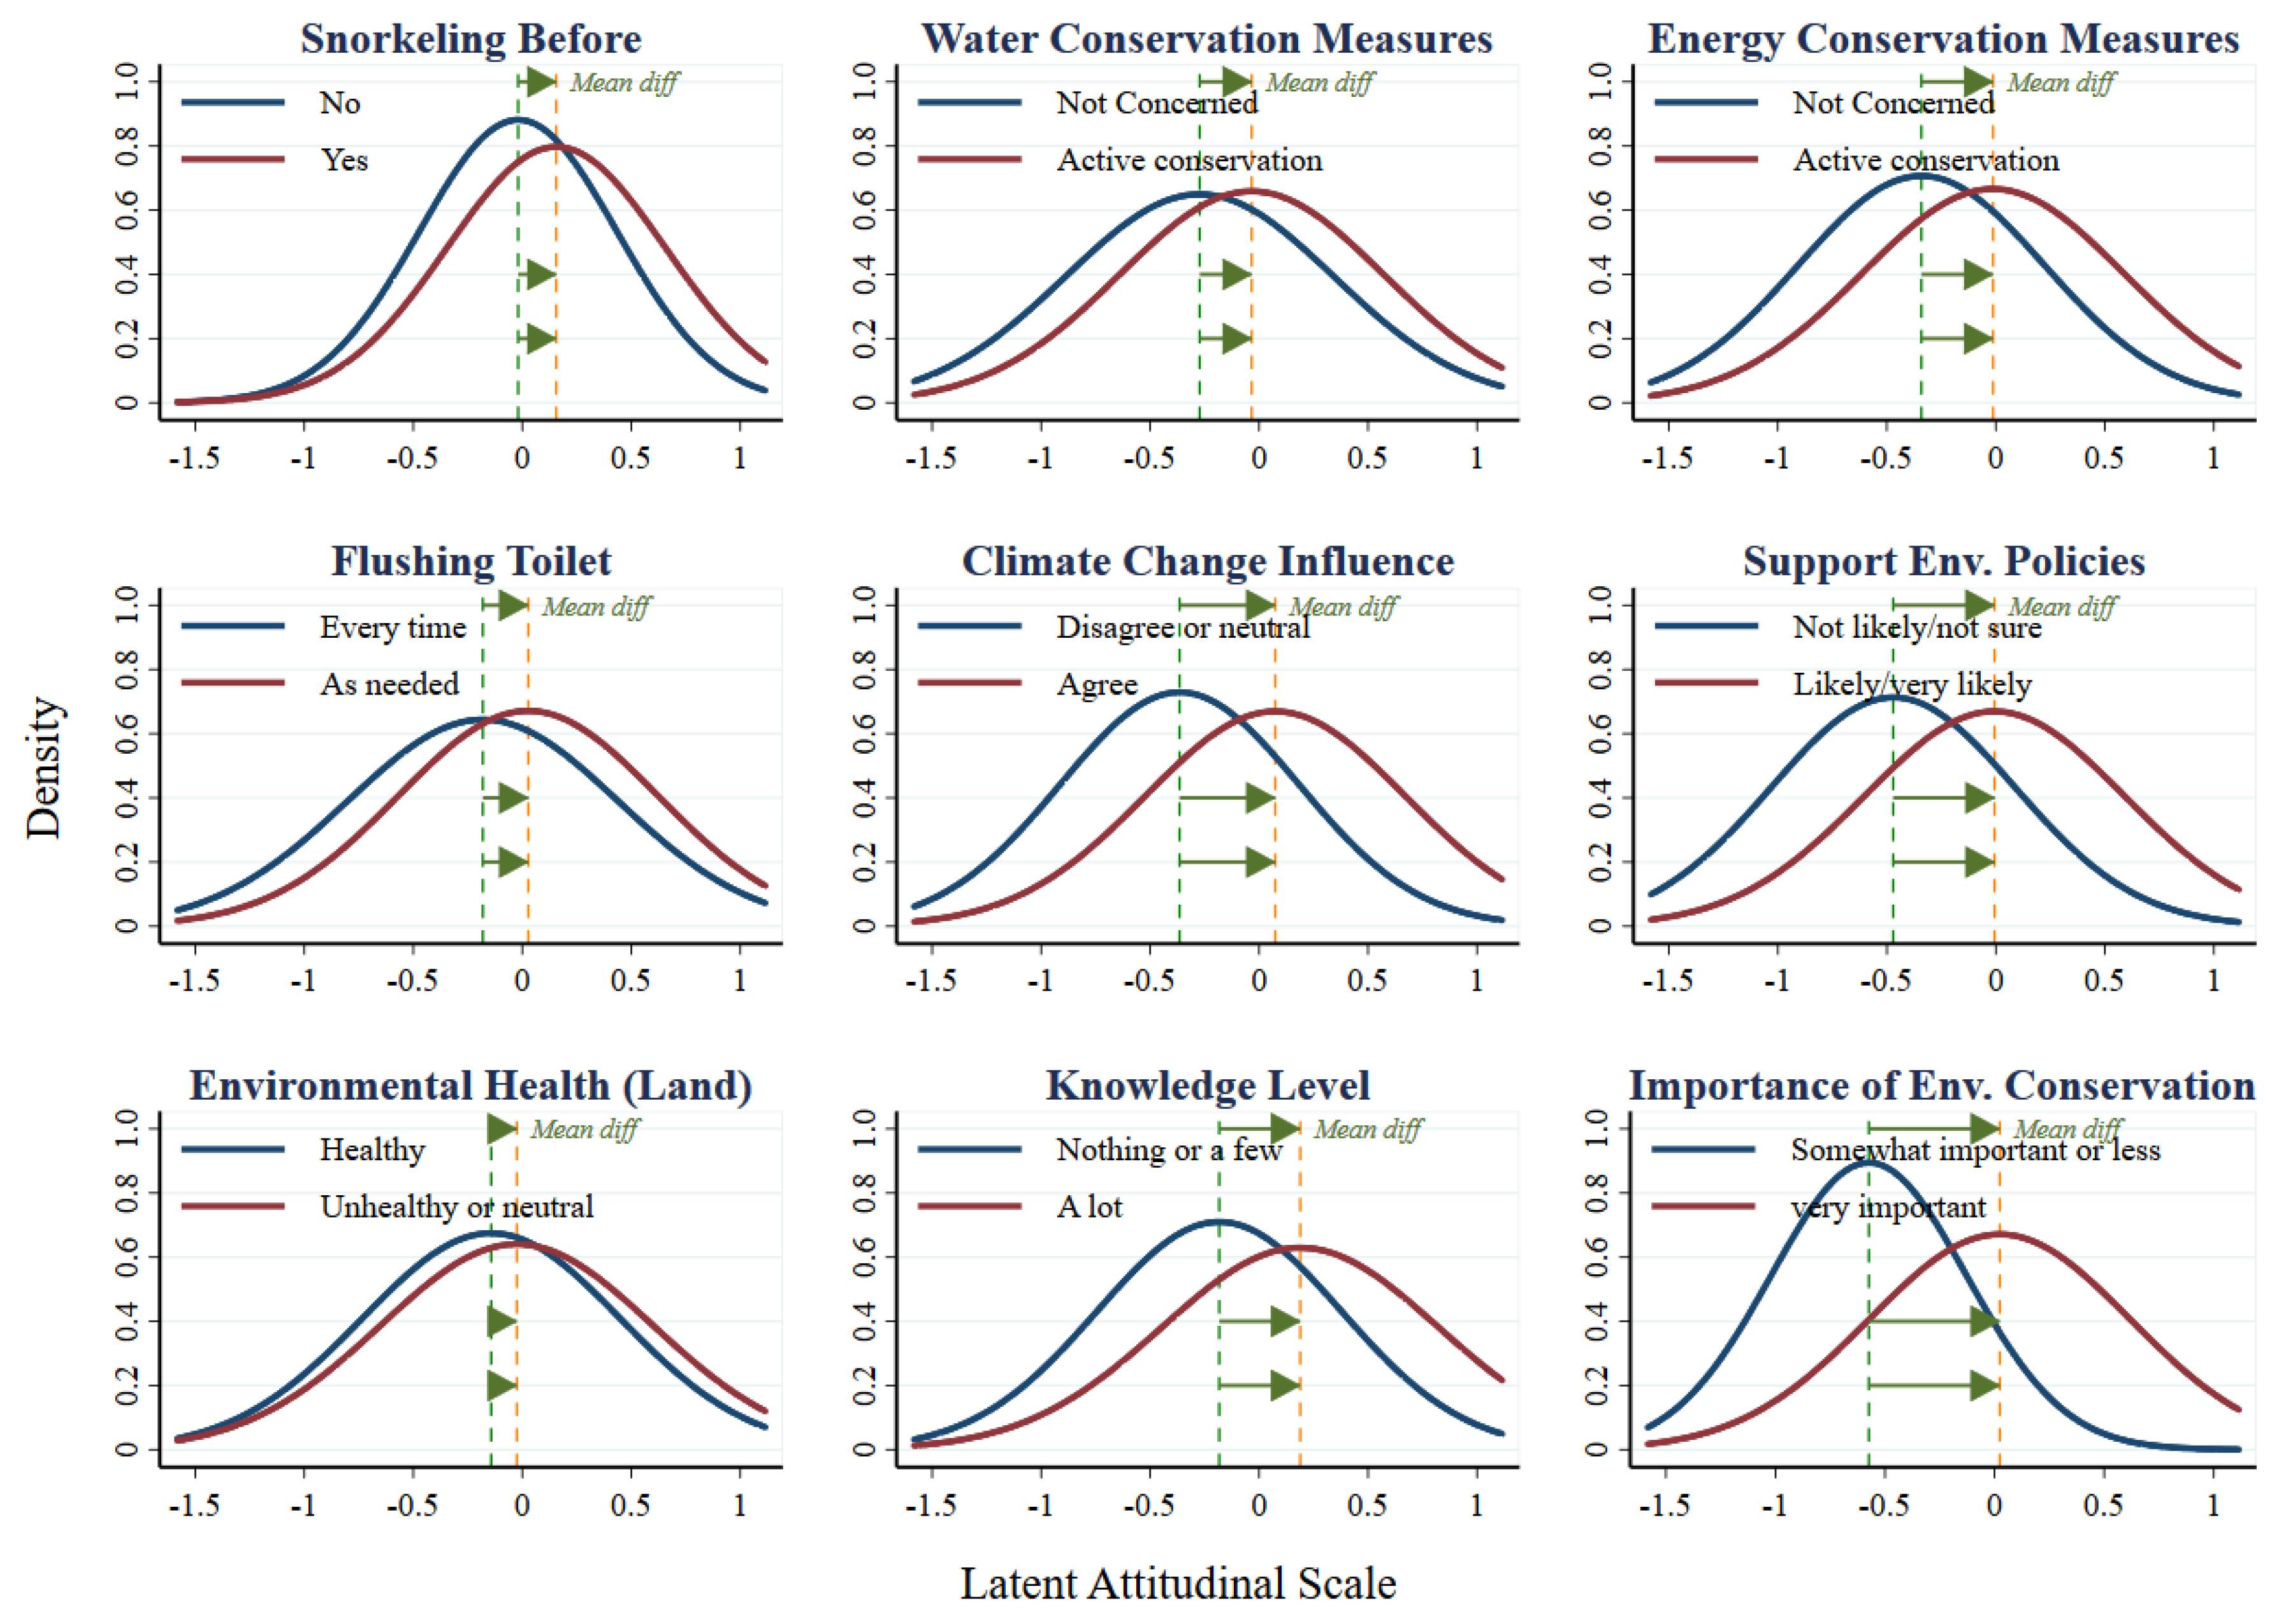
In terms of general environmental attributes, the source of water significantly affects participant’s attitudes with participants collecting rain water through cistern systems having larger mean scale scores than the ones using city water (p = 0.0009). On the other hand, among participants who use cistern water, having to buy water to refill their cisterns in the past year is associated with statistically significant lower attitudinal scale scores (p = 0.0052). The use of alternative energy sources is clearly associated with differences in attitudinal mean scale scores. Specifically, participants who use WAPA (local Water and Power Authority) power, slightly smaller means in their attitudinal scores (p = 0.0414), compared to participants who use generator or solar power. These groups have increasingly larger mean scale scores (p = 0.0098, and p = 0.0002, respectively). Participants who had snorkeled before in coral reefs appear to have larger mean scale scores than the ones that have never experienced coral reefs in close contact (p = 0.0123), but the frequency of snorkeling does not affect their attitudes.
In terms of the water-energy nexus, participants who had issues with their water or energy systems tend to have significantly higher mean attitudinal scale scores than the ones that did not (with p-values of 0.0096 and 0.0000, respectively). It is more likely than not, that the limitations of both natural and systemic water-energy systems in small and economically disadvantageous areas such as the US Virgin Islands, reinforces, and perhaps, drives to an extent attitudinal formation and attitudinal change in terms of environmental conservation. The latter proposition is reinforced by the participant’s responses to the questions regarding whether or not they are engaged in active water or energy conservation measures. Specifically, respondents who are either somewhat concerned and aware or very aware and use active conservation in both water and energy systems have higher scale attitudinal values compared to respondents not concerned about conservation or are aware but not taking conservation action (p = 0.0004, for water conservation and p = 0.0000, for energy conservation systems respectively). The mean differences are larger for energy conservation systems than water conservation systems. To check the consistency between attitudes and (stated) behavior, we asked participants whether they flushed their toilet every time they used it or only when they need it (a common conservation practice in the Virgin Islands in the face of water scarcity). The comparative analysis of the attitudinal scale comparison across the response groups show that participants who engage in such conservation behavior have positively higher scale mean attitudinal values than the ones who don’t (p = 0.0000).
There exists a relative strong statistically significant difference between the mean attitudinal scale scores between participants whose decisions are influenced by factors related to climate change, versus those whose decisions remain unaffected (p < 0.0001). In addition, participants who are more likely to support stronger environmental policies at all time scales (currently, near term, distant future), have higher mean attitudinal scale scores that those who are either not sure or not likely to support such decisions (all three question comparisons yield p-values < 0.0001).
Participants who believe that their land and/or coastal environment in the Virgin Islands is generally unhealthy (very unhealthy or somewhat unhealthy) have larger mean scale scores than the ones believing that the land/coastal environment is healthy (
p < 0.0001 on both questions regarding land and coastal environmental settings). Similar, yet less strong results hold true in terms of participant beliefs regarding the importance of the ecosystem health. Specifically, participants who believe that the health of our land and/or coastal environment is very important have smaller attitudinal scale scores than the ones who don’t hold such strong views (
p = 0.0890). In addition, participants who believe that environmental conservation in general is very important, have considerately larger mean scale scores than the ones who don’t (
p < 0.001). Finally, participants who reported that they feel that they know a lot about environmental conservation have larger mean scale scores than the ones that reported that they feel they know a few or nothing at all about environmental conservation issues (
p < 0.001). Selected graphs of the environmental-based attitudinal comparisons among participant groups are shown in the following
Figure 5.
3.3. Analyzing ATC Scales Using Item Response Theory (IRT) Models
An alternative methodology for assessing the cognitive latent scale as a mental model representation is the use of
Item Response Theory (IRT) models. According to
Cleophas et al. (
2012) IRT models “(…) do not use reliability as a measure of their applicability, but instead use formal goodness of fit tests (…)”. In a nutshell, item response models represent a nonlinear estimation on a binary or categorical response pattern for each item (and sub-item, i.e., item class) in a scale. The nonlinear estimation of item response models follows a Gaussian exponential distribution function (
Reckase and Reckase 2009;
Drasgow and Parsons 1983).
We compared a number of IRT models on two broad estimation categories: those for ordinal categorical item classification, and those for binary item classification. The former are represented by the original ATC scale item response questions, and they reflect the 5-level Likert agreement categories. The latter represent reduced-form classification, where negative or neutral response categories (1–3) are recoded as 0 and positive response categories (4–5) are recoded as 1.
For the ordinal categorical ATC scale, we fitted four alternative IRT models, namely the
Graded Response Model (GRM), the
Partial Credit Model (PCM), the
Generalized Partial Credit Model (GPCM), and the
Rating Scale Model (RSM). The relative model performance comparison is shown in the top subpart of
Table 7. Based on all three model performance estimated metrics (model fit
−2*Log Likelihood (2LOGL),
Akaike Information Criterion (AIC),
Bayesian Information Criterion (BIC)), the best fit (minimum values) for ordinal categorical ATC scale response is the Graded Response Model (GRM) with −2LogL = −19,376.6, AIC = 38,933.3, and BIC = 39,371.6.
Similarly, for the binary categorical ATC scale, we fitted three alternative IRT models, namely the
One-Parameter Logistic Model (1PL), the
Two-Parameter Logistic Model (2PL), and the
Three-Parameter Logistic Model (3PL). The relative binary model comparison is shown in the bottom subpart of
Table 7. From the three alternative models, the best performance (minimum value of 2LOGL, AIC or BIC) is the Two-Parameter Logistic Model (2PL). The 2PL and 3PL models have the same log likelihood fit, but both the AIC and BIC estimated fit are slightly lower for the 2PL model. The selected model estimates are: −2LogL = −7924.1, AIC = 15,920.2, and BIC = 16,095.5.
3.3.1. Estimating a Two-Parameter Logistic Model (2PL)
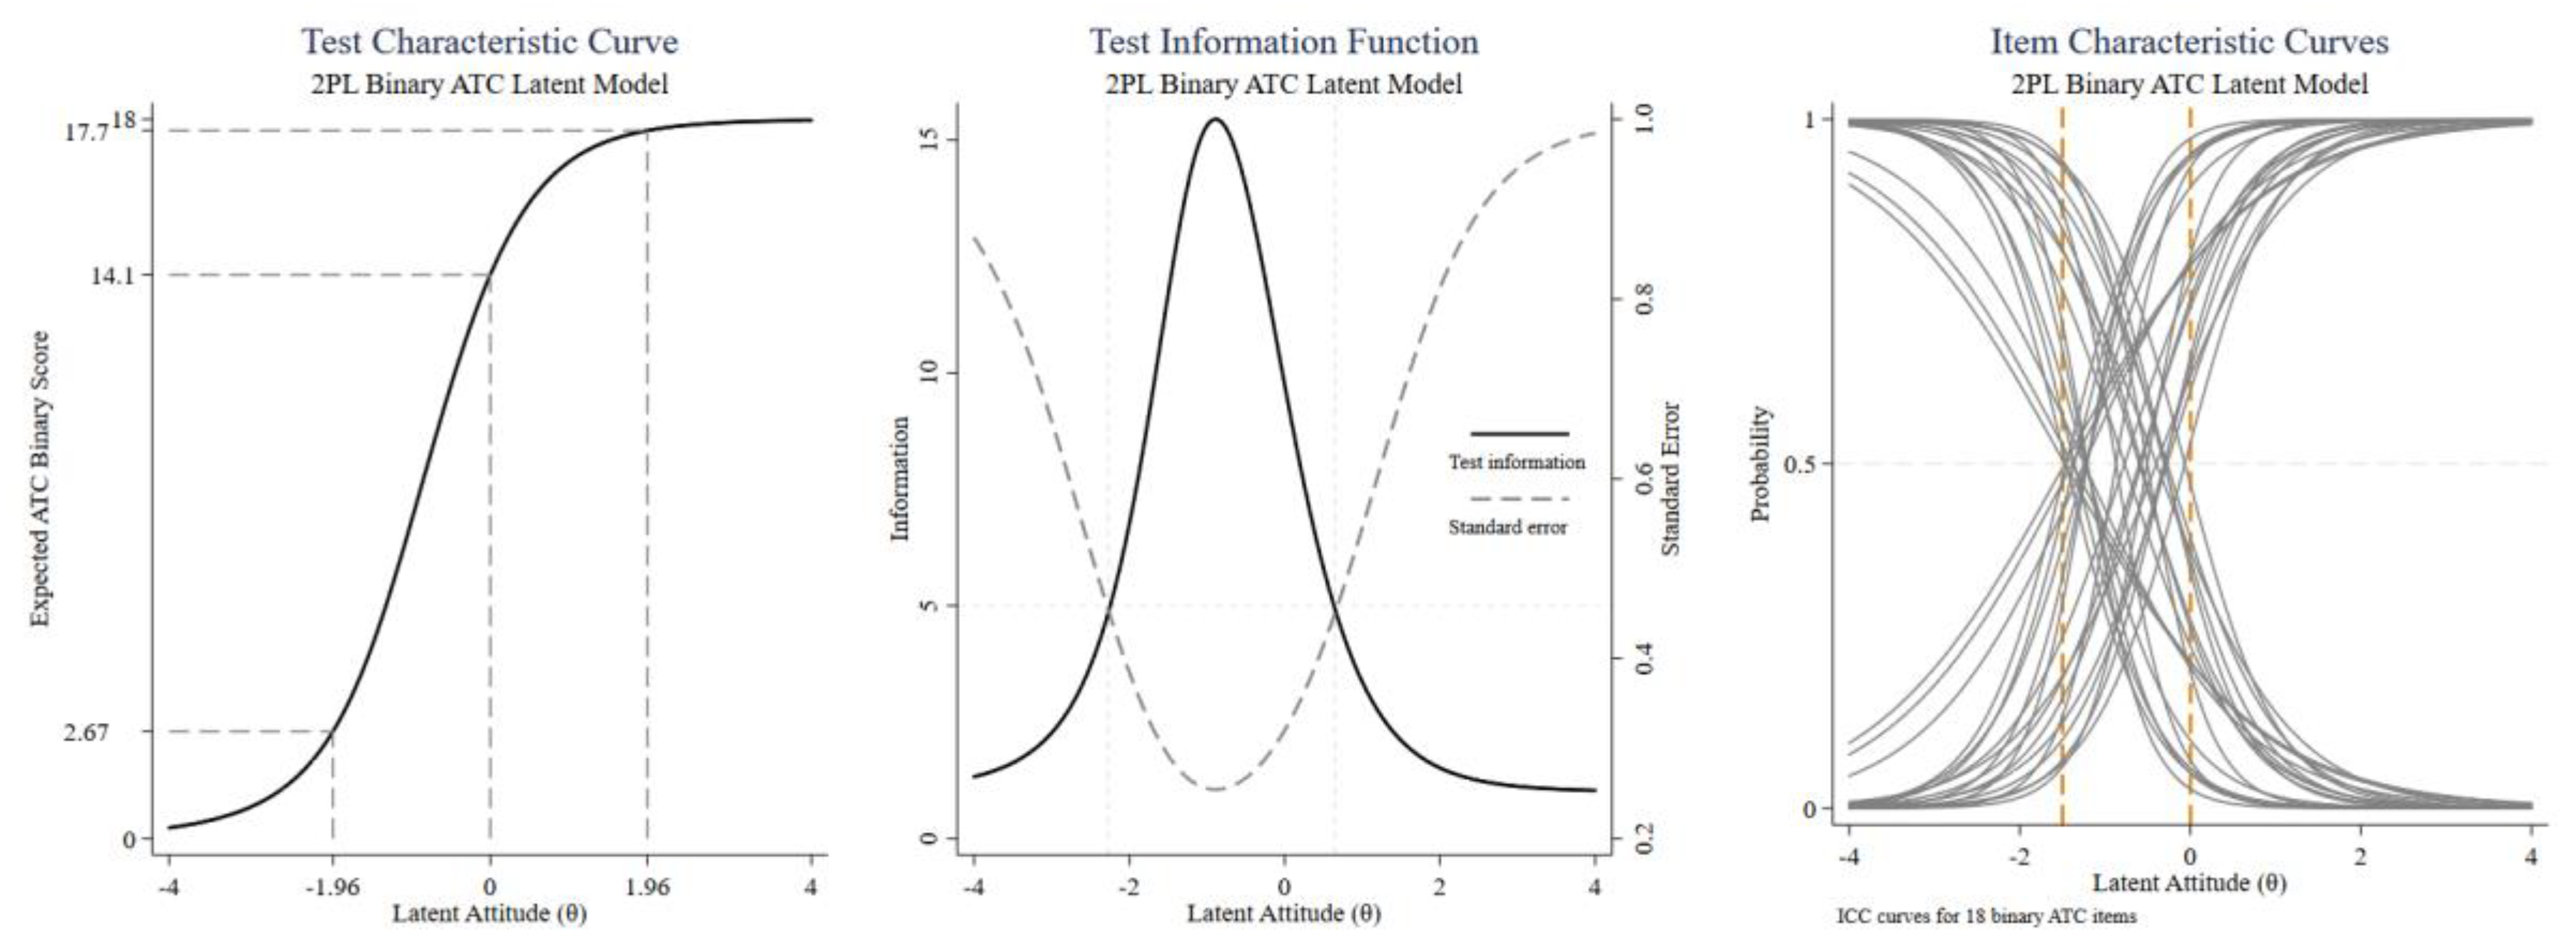
The 2PL model fits a logistic curve estimated results are shown in the following
Figure 6. The left subgraph displays the overall test characteristic curve of the estimated latent response trait. Given the binary scale item response configuration, the minimum and maximum theoretically expected scale scores are 0 and 18 respectively. Given that the expected value of the estimated latent attitude trait (θ) follows a standard normal distribution, we can see that the majority of the ATC score values fall within the (2.7, 17,7) range for the 95% two-side confidence interval for the mean theta values. The test information function shows the information value curve for the 2PL model estimation, along with the standard error of the estimation. The majority of our predicted values fall within the (−2, 2) interval for theta, where the information is maximized. Finally, the item characteristic curves for the binary categorical responses are shown in the right subgraph. The distribution of attitudinal scores allow us to clearly define areas defined in the social judgment theory (
Ajzen 2012;
Petty and Cacioppo 1996) such as the
latitude of rejection (below θ = −1.67), the
latitude of acceptance (above θ = 0), and the
latitude of noncommitment (between −1.67 and 0). These results indicate that respondents with generally negative or neutral attitudinal traits toward coral reef conservation can be persuaded to change their attitudes toward a more positive, conservation-favoring trajectory.
The results of the binary 2PL model estimation, albeit informative and insightful, nevertheless reflect a simplified assessment of latent attitudinal information obtained from the data, as the model requires the informational reduction of the Likert original categorical responses provided by the participants into a binary classification scheme, thus downscaling the value of information that can be obtained.
3.3.2. Estimating a Graded Response Model (GRM)
Fitting the
graded response model (GRM) for the ATC scale uses an ordinal logit estimation of each of the 18-item observed variable towards the latent ATC scale. It uses a Bayesian EAP estimation using empirical mean and standard deviations as priors to estimate the latent variable distribution and its moments. The key unidimensional ATC scale-level statistics of the estimation are shown in
Table 8.
The parameter estimates for the ATC latent semantic scale of the study are shown in
Table 9. The factor loadings parameter,
λ = 0.869. The slope parameter ranges from 1.374 to 3.284 with mean
α = 2.170. The ordinal logit model estimates range from −2.77 ± 0.16 to 3.46 ± 0.25 in the case of the additive logit
αθ +
c model (cutoff
c values), and from −1.65 ± 0.18 to 1.32 ± 0.97 in the case of the multiplicative logit
α(θ − b) model (model intercept,
b values). The
χ2 statistics of the estimation (
Table 9) as well as the marginal reliability and
M2 marginal statistics in
Table 8 indicate a very good model fit.
The GRM model estimated is equivalent with a generalized structural equation model (GSEM) using ordinal logit regression terms for each of the 18-items in the scale. In terms of the characteristics of the Bayesian estimation, the model estimates the conditional probabilities EAP (θ|u) of the logit model, with parameters αθ + ci, and α(θ − bi) where i is the number of graded model classes (i = 1, 2, 3, 4). For the ATC latent scale, the Kolmogorov-Smirnov hypothesis test allows us to retain the null hypothesis regarding normality of the distribution of the EAP(θ|u) model parameters with mean μ = 0 and standard deviation σ2 = 1. The K-S test statistic value was −0.00368 (p = 0.091).
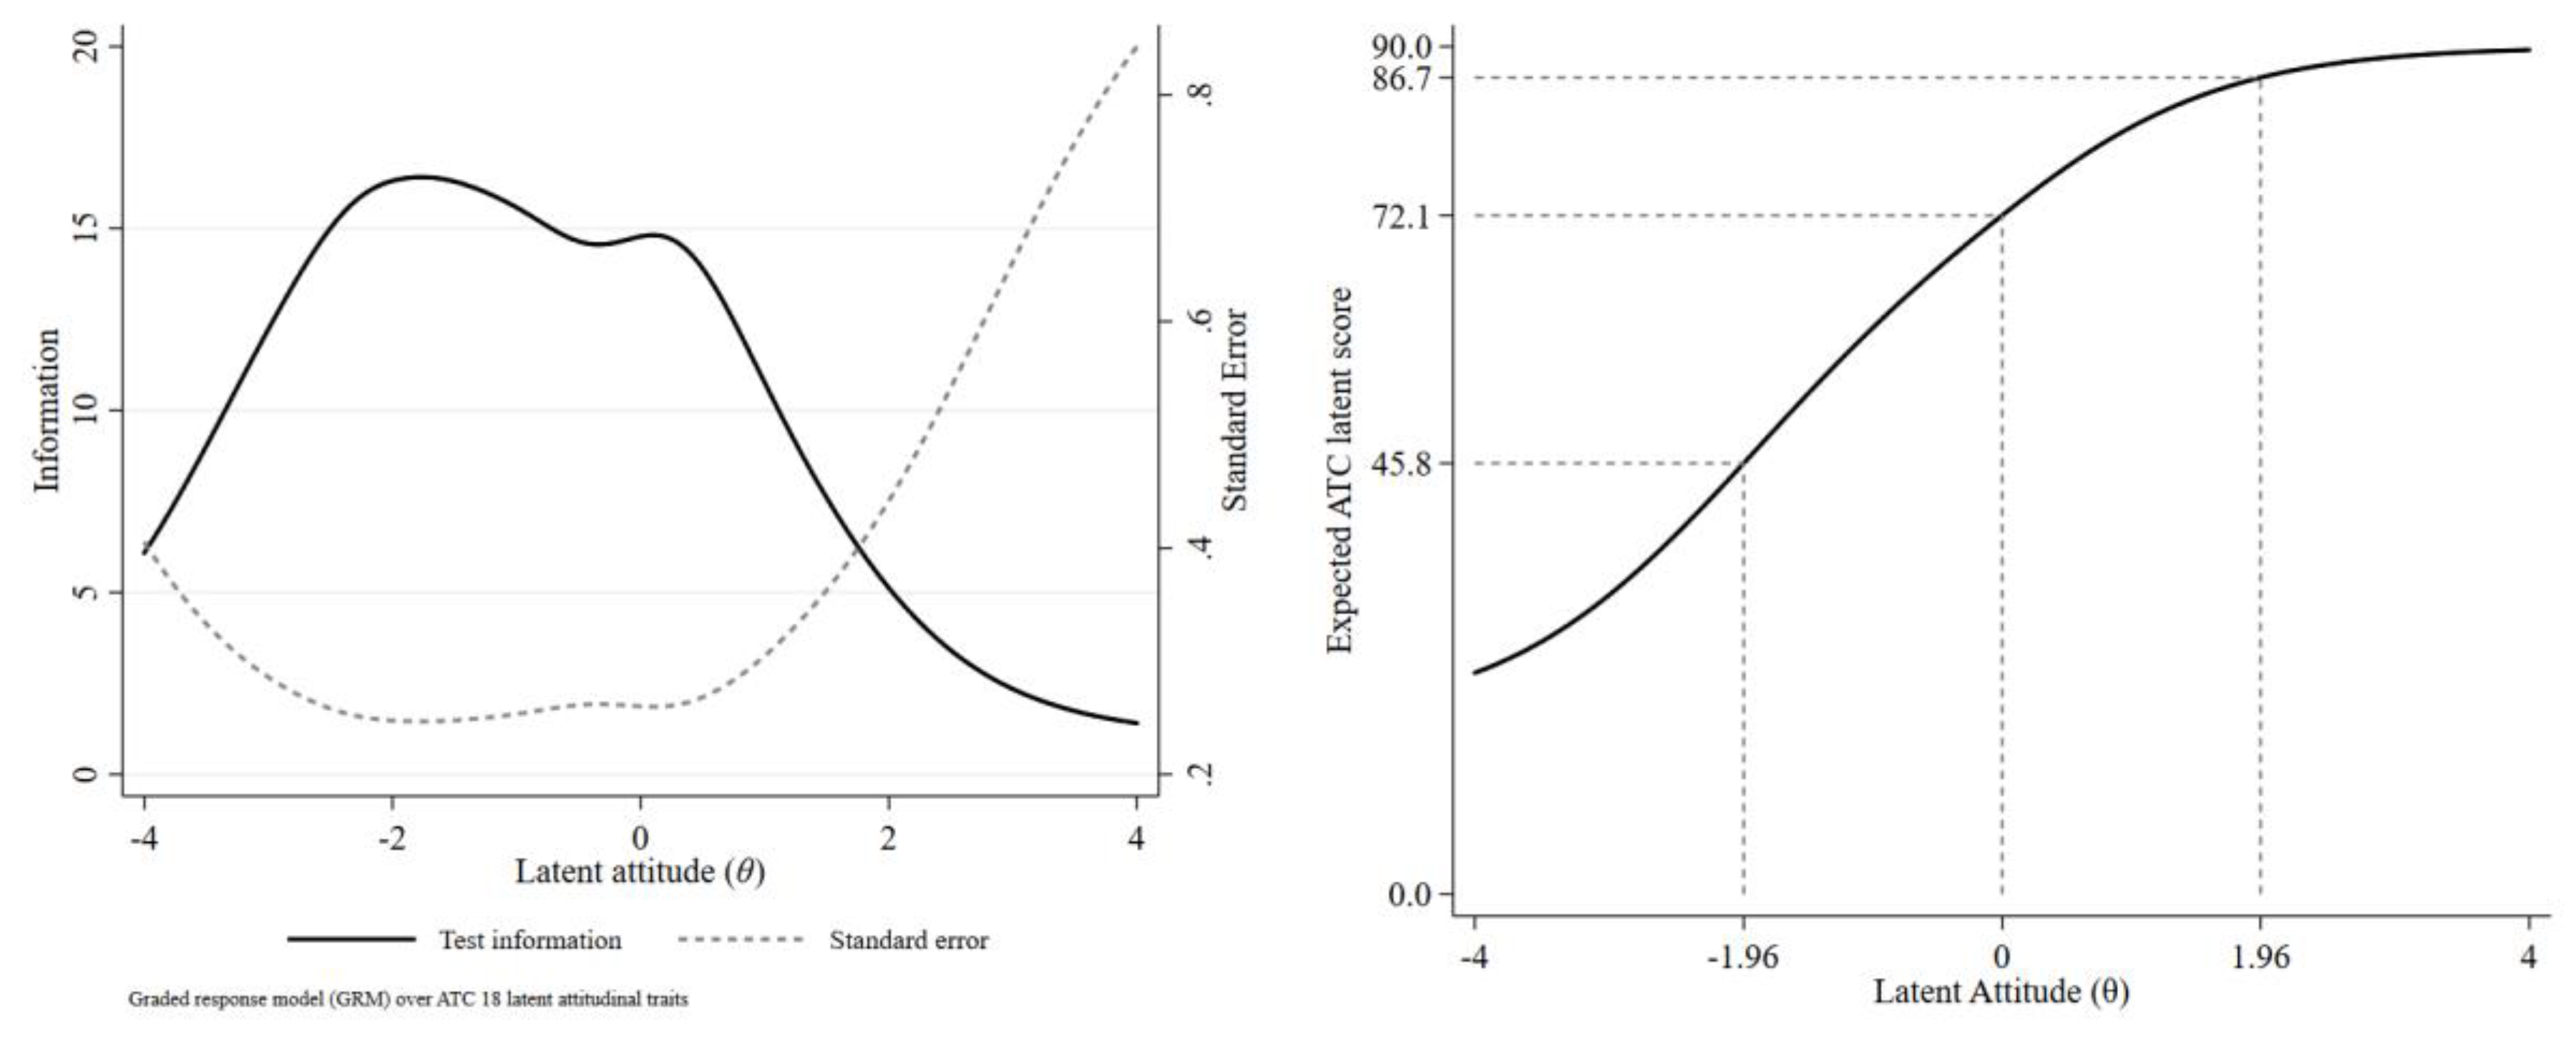
Following the GRM model fit, we obtained the inferential estimation results for the empirical assessment of the ATC latent attitudinal trait (ability). The graphs in
Figure 7 plot the overall (latent-base) information curve (along with the standard error of its estimates), and the cumulative test characteristic curve.
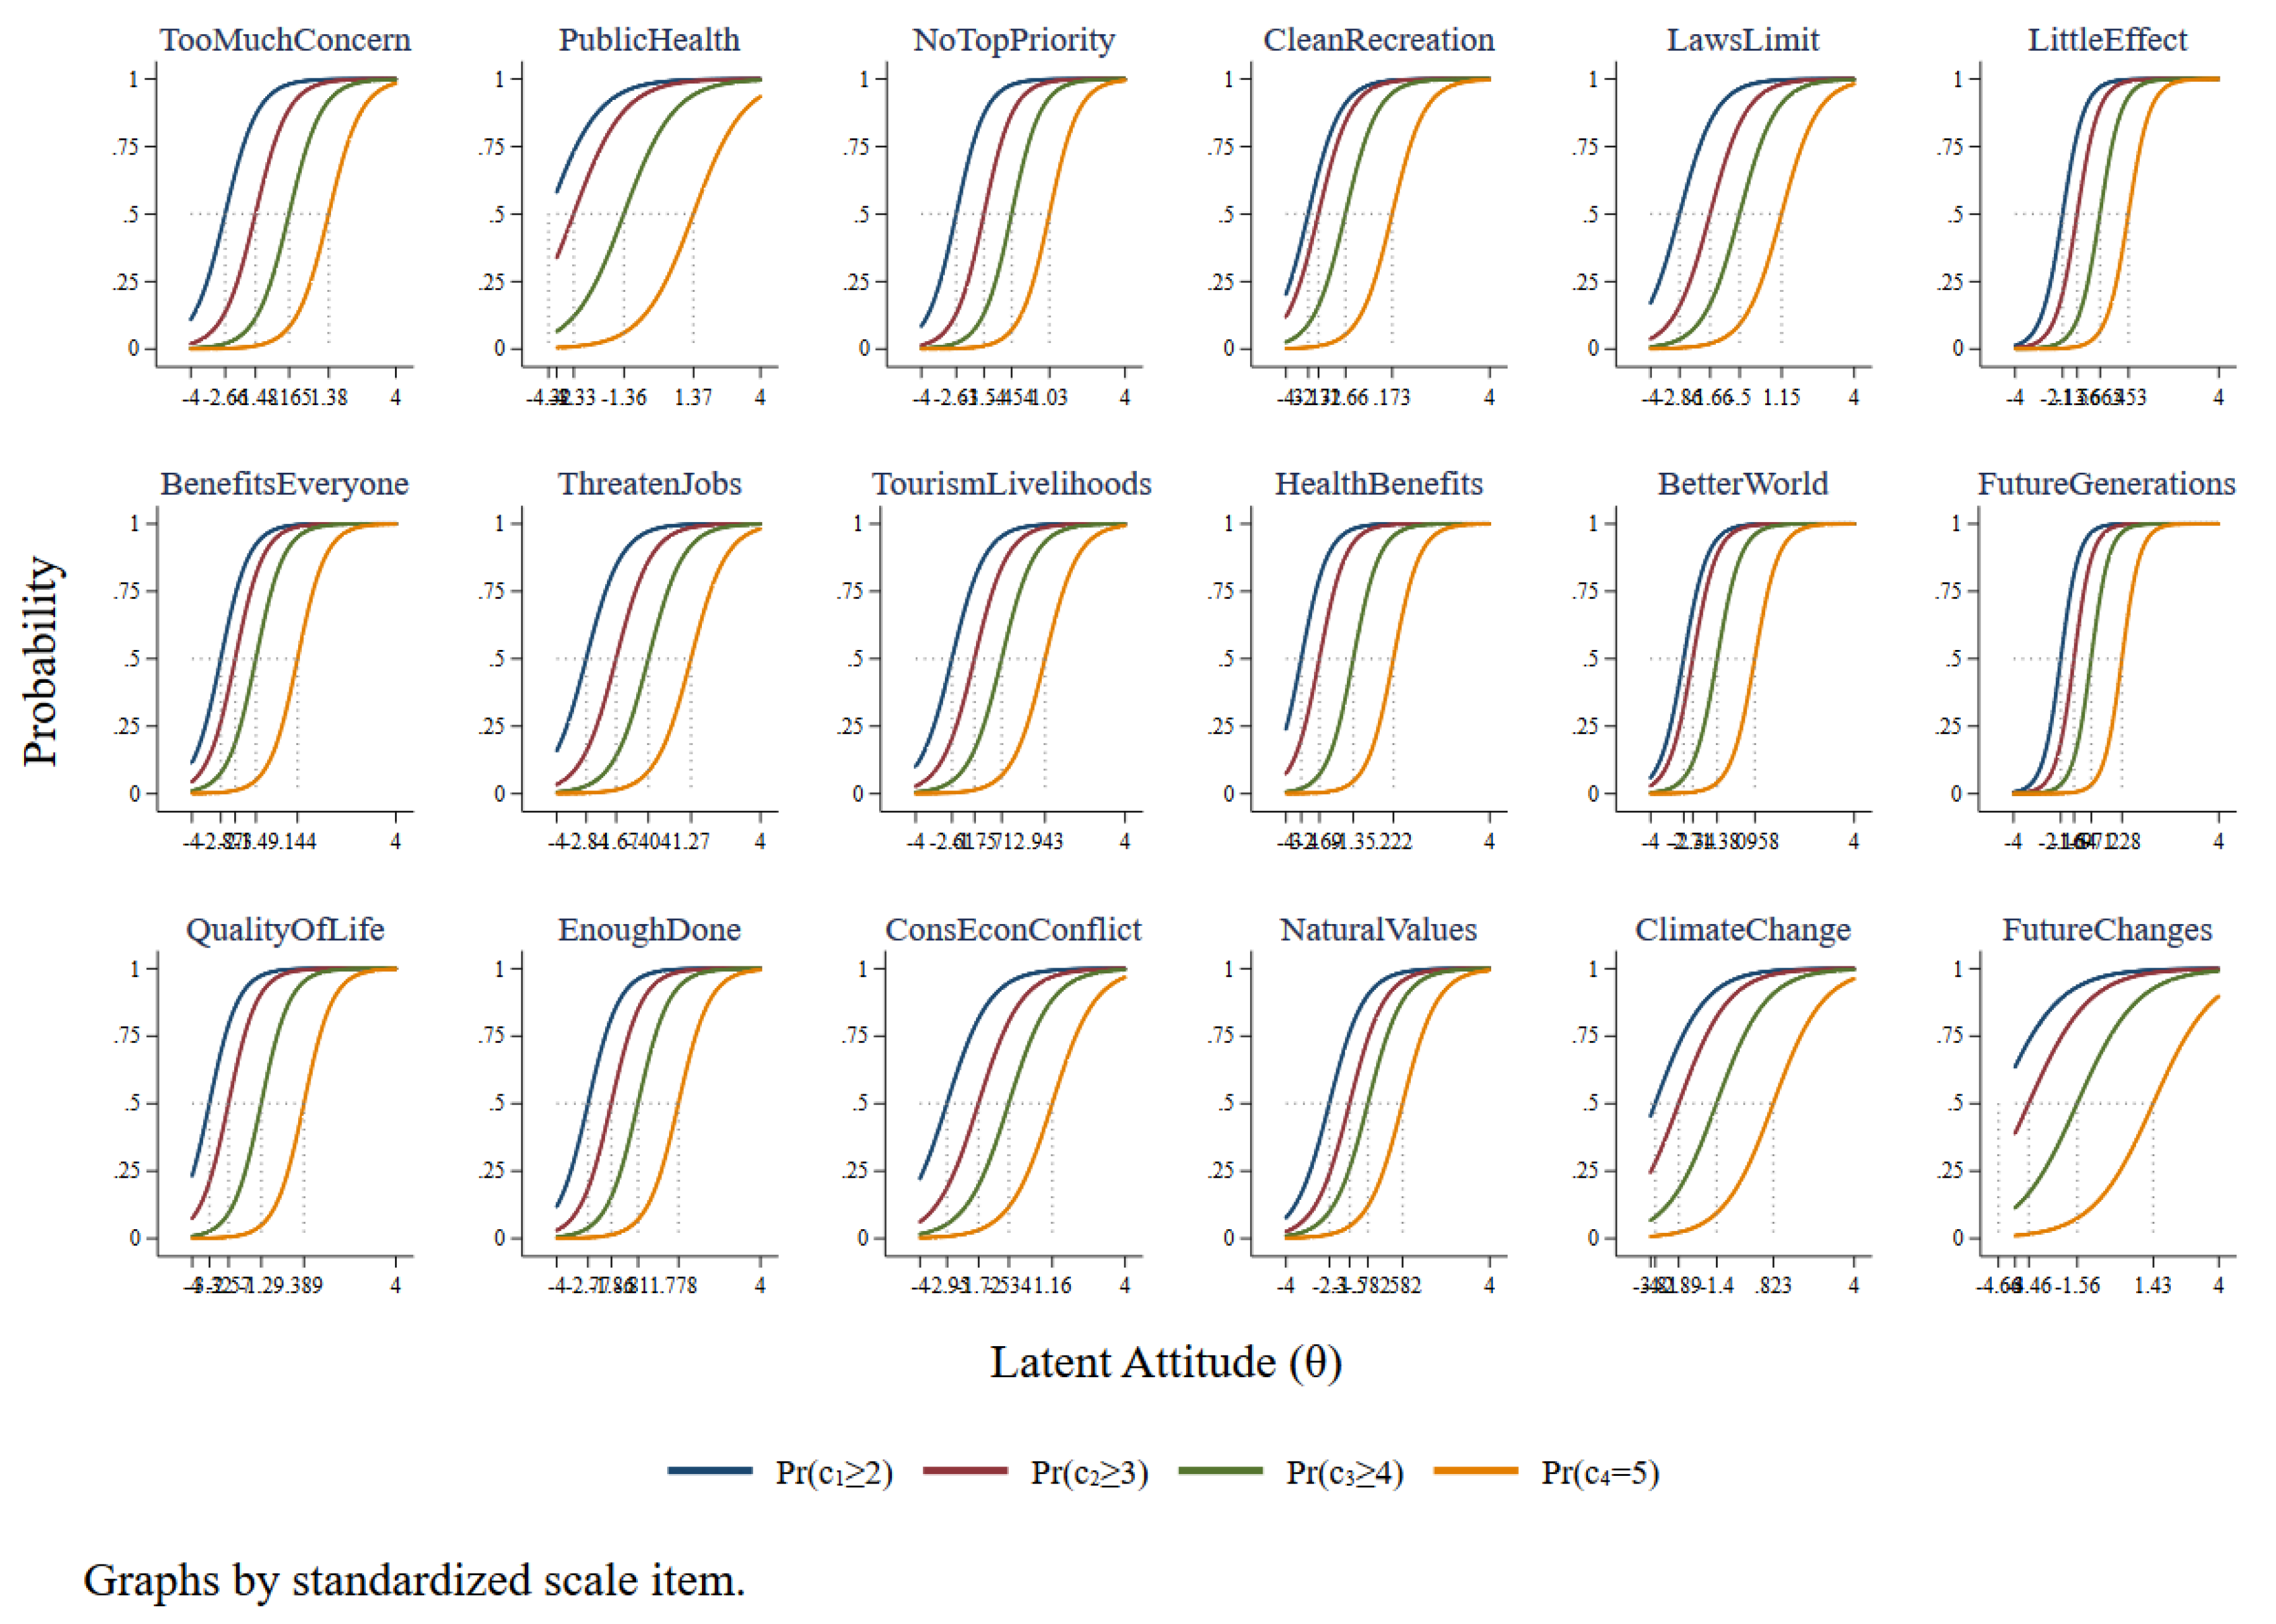
The item or boundary characteristic curves for each of the 18 of the items in the scale are shown as item-ordered subgraphs in
Figure 8. The y-axis on each subgraph shows the overall probability estimates, while the x-axes plot the latent ability (ATC scale) estimates. In each subgraph, each line represents the cumulative probability function (
CDF) of the item states (from the Likert scale, 0 = strongly negative to 4 = strongly positive). The threshold values where
Pr(
θ = 0.5) are indicated for each of the curves. i.e., where the % probability threshold exceeds 50%.
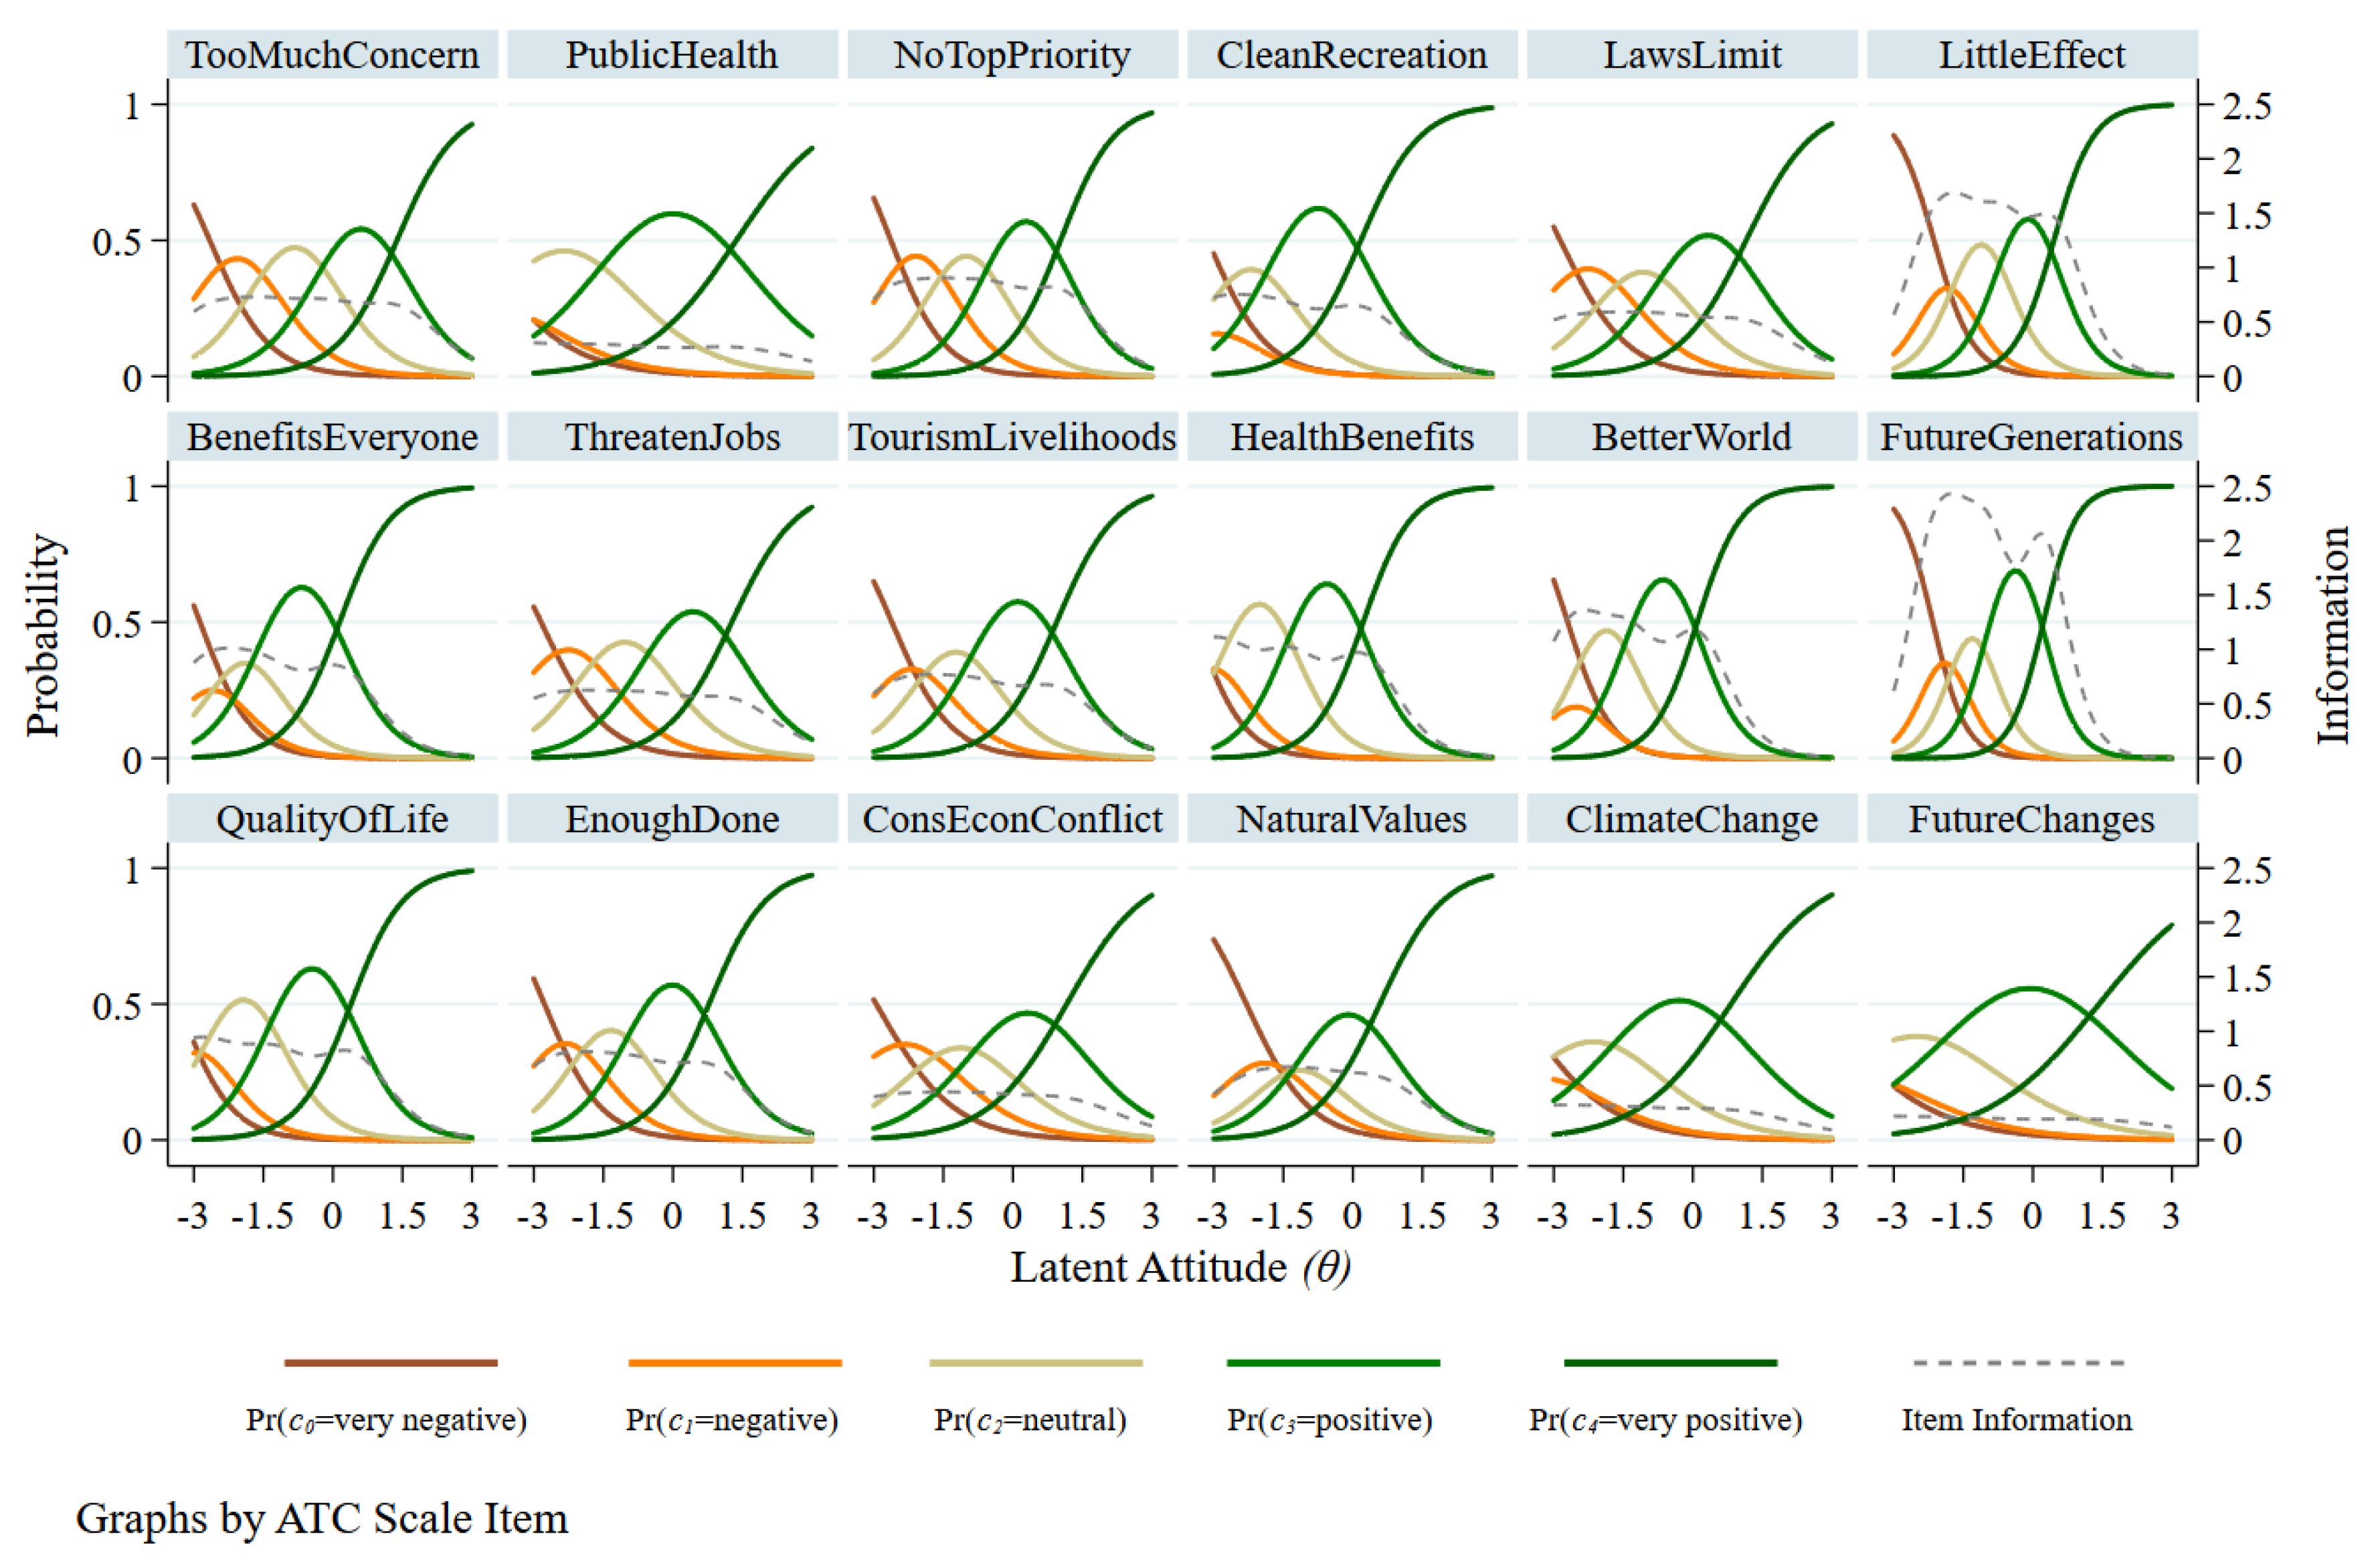
The item characteristic curves along with each item’s information curve of the GRM model estimation are shown in
Figure 9. The solid colored lines represent the item state probabilistic score estimates with respect to the overall ATC latent attitudinal scale (ability,
θ). The areas where each curve dominates the probability of any other states identify ranges of the ATC latent scale to be expected to reflect the true attitudinal state for each item. Items for which these areas a clearly distinct and have minimal overlap are generally ones where the value of information is higher.
The comparison of the GRM assessment of ATC mean scale scores by different participant attributes are shown in the following
Table 10. The estimated scale group means are shown to be statistically different for gender (females have stronger positive attitudes,
p = 0.013), ethnicity (Black/African American have more negative attitudes,
p = 0.0001), age group (participants above 25 years old have stronger positive attitudes,
p = 0.0002), education (participants with college degree and above have stronger positive attitudes, p < 0.0001), and snorkeling before (participants who snorkeled before in coral reefs have stronger positive attitudes,
p < 0.0001). On the other hand, there appear to be no statistically important differences in attitudinal scale responses for participants living in the Virgin Islands or not, or for participants who use solar power in their home or nor. Finally, participants with household income above
$90,000 appear to have slightly or marginally more positive attitudes than the ones with household income below that level (
p = 0.028).
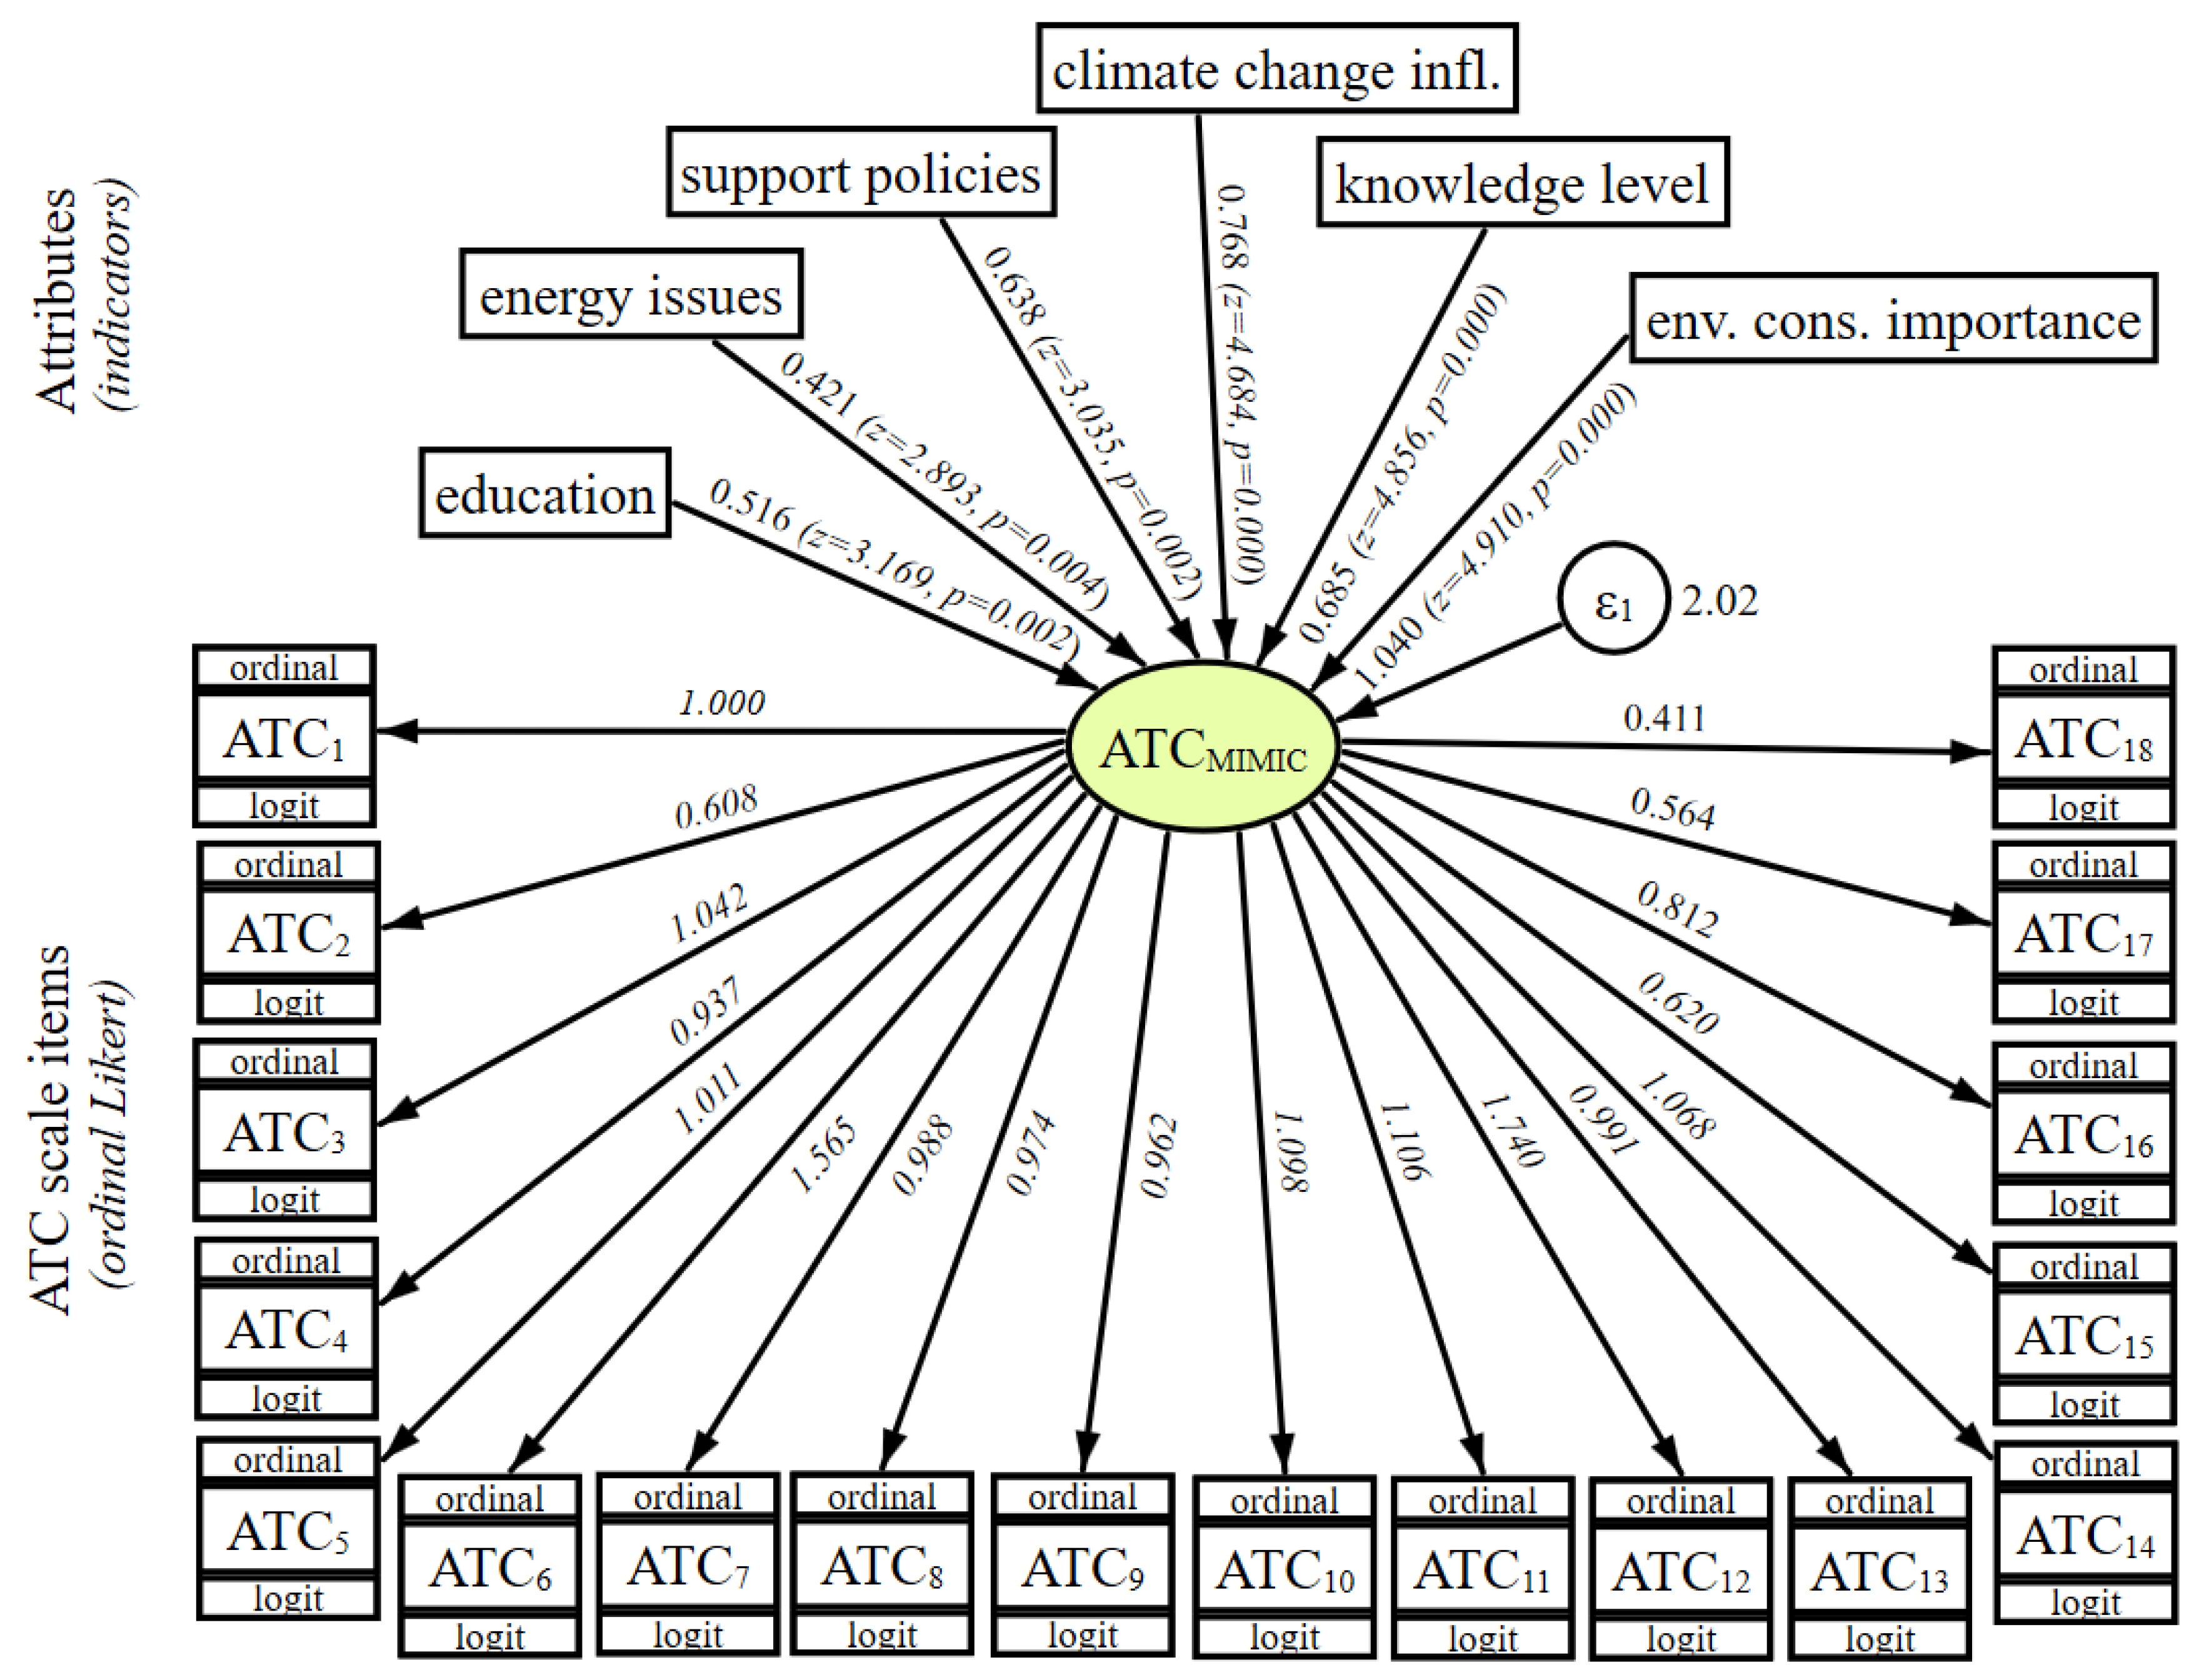
3.4. Latent Trait Analysis Using Structural Equation Models for Scale Development
We used a
structural equation model design structure to estimate the latent attitudinal effect of the ATC scale. The overall SEM model design is shown graphically in
Figure 10 and includes the fitted model parameters. The model used
n = 884 observations, over the 18 scale items (dependent variables). The log-likelihood of the model estimation was
−2LogL(model) = 19,404.45 with 37 degrees of freedom. The Akaike’s information criterion and the Bayesian information criterion was
AIC = 38,882.89 and
BIC = 39,059.92 respectively. The overall equation-level goodness of fit gave us an adjusted
R2 = 0.908. The likelihood ratio tests for both the
model vs.
saturated and the
baseline vs.
saturated configurations was statistically significant with
p < 0.0001:
(152) = 1820.08,
and (153) = 6442.23. The population-based root mean squared error of the approximate ML solution was
RMSEA = 0.111 ranging between 0.107 and 0.116 (
p < 0.0001). In comparing the SEM model estimates to the baseline model, the comparative fit index is
CFI = 0.735 and the Tucker-Lewis index,
TLI = 0.733.
The unstandardized (constrained) estimated latent ATC scale mean is 2.558 (in the 0–4 Likert scale for the ATC1-18 items). The standard error of the ATC mean scale estimate is 0.018, with z-statistic value for the mean z = 80.49 (p < 0.001). The 95% CI for the mean are [2.495, 2.620]. Thus, the mean scale parameter is closer to the positive attitudinal level (since 2 = neutral and 3 = positive). We standardized the SEM-estimated ATC scale by constraining each item’s mean empirical value from the data. The resulting standardized SEM attitudinal scale (ATCSEM) has a mean of 0 with standard error of the estimated mean of 0.37. The estimation results are congruent and compatible with both the Cronbach’s alpha scale reliability estimates and the GRM model estimates presented in the previous section.
3.5. Evaluating the Congruency or Concordance between Alternative Latent Cognitive Scale Constructs
An important question of the analysis is the inherent cognitive nature of the relationship between the constructed latent trait scales estimates. What is the degree of association among study participants between these latent scale estimates? The following figure shows the level of association between the various latent traits. We can thus see that while the majority of observations fall within the concordant regions (i.e., showcase a level of consistency between these estimated latent traits).
We used the
Hotelling T2 statistic, a multivariate test equivalent to the bivariate likelihood-ratio test (
Mardia et al. 1979) for comparing the equality of means across the all estimated ATC latent scale coefficient estimates. The
T2 statistic asymptotically approximates 0, with the
F(
2,
882) = 0.00 (
p = 0.9999). Therefore, we cannot reject the null hypothesis of equal means of the alternative ATC scale coefficient estimates at almost any level of statistical significance.
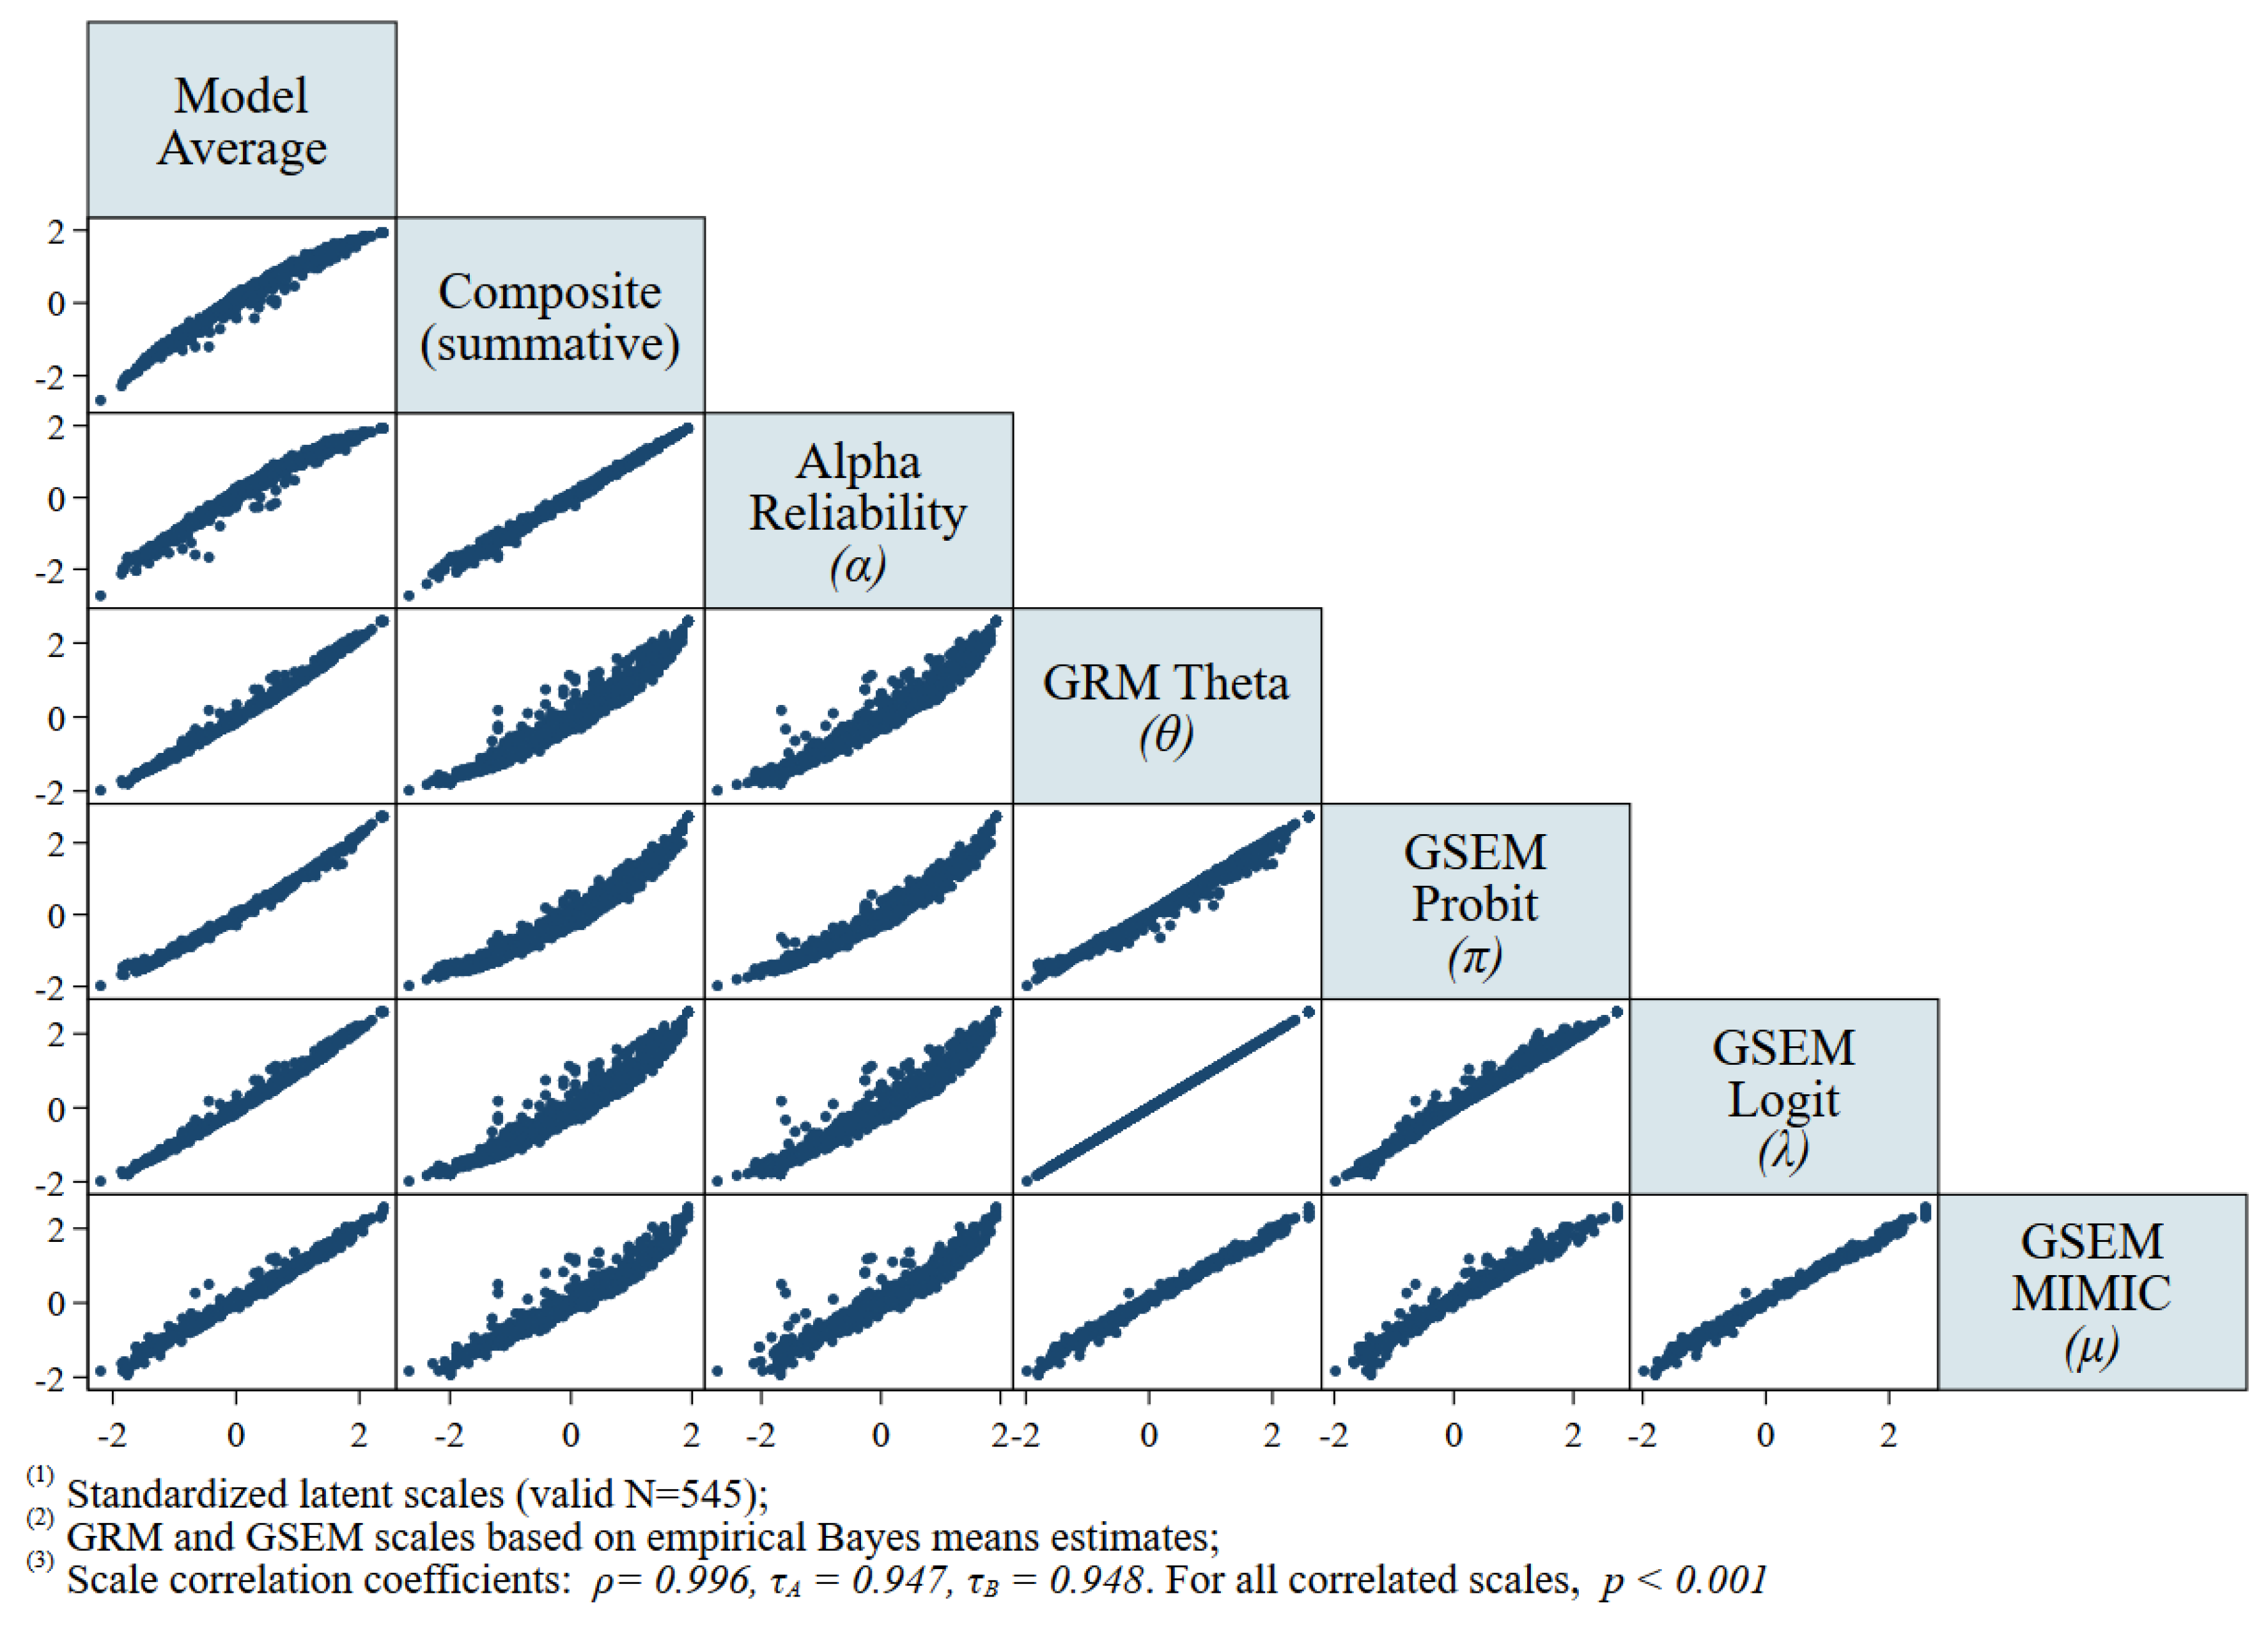
The correlation coefficients among these latent scale coefficient estimates (including also the summative composite score of the 18-items) show a very high degree of associative concordance, on average above 90%, depending on the correlational statistic used. The bi-variate Spearman’s and Kendall’s correlation coefficients for the four variables (composite and three estimated latent scale coefficients) are shown in the following
Table 11.
The characteristics of associative congruency among the alternative ATC scale estimations and across the survey item strata are shown as a bivariate scatterplot matrix in
Figure 11. Each of the subgraphs represents one of the estimated scales in the study. As can be seen from the scatterplot graphs, the relationship between the summative composite scale scores and both the alpha-reliability scale estimates and the generalized SEM empirical Bayes estimates of the latent scale is approximated linear, while the relationship between the IRT GRM empirical Bayes latent scale estimates is exponentially nonlinear.
In order to examine closely the nature of the nonlinear relationship between the alternative scale estimates, we performed a best fit analysis. As can be seen in
Figure 12, the best nonlinear fit between the Alpha-estimated ATC score (dependent) and the GRM-estimated latent ATC score (independent) was produced from 2nd order polynomial fit (
). The parameter estimates for the fit (with 95%CI) was
a = −0.1098 (−0.1264, −0.0932),
b = 0.9667 (0.9533, 0.9800), and
c = 0.1099 (0.0994, 0.1203) for normalized
μx = 0 and
σx = 0.6061. The adjusted
R2 = 0.9585 (SSE = 33.85, RMSE = 0.196).


