Article

A Multi-Level Analysis on School Connectedness, Family Support, and Adolescent Depression: Evidence from the National Longitudinal Study of Adolescent Health, 1995–1996

Center for Asian Health, Lewis Katz School of Medicine, Temple University, 3440 N Broad St., Kresge Bldg, Ste. 320, Philadelphia, PA 19140, USA
Soc. Sci. 2018, 7(5), 72; https://doi.org/10.3390/socsci7050072
Submission received: 11 March 2018 / Revised: 16 April 2018 / Accepted: 24 April 2018 / Published: 25 April 2018

Abstract

:
Objective: The purpose of this study is to gain insight into the effect of family support, school connectedness, and school environments on depressive symptoms among adolescents across racial/ethnic groups on both the student-level and school-level. Method: This study uses a sample of 4228 students (2122 girls and 2016 boys) from the public use data of the National Longitudinal Study of Adolescent Health. Students were measured at two time points (one year apart) on school connectedness, family support, socio-demographic factors, and the Center for Epidemiological Studies’ Depression Scale. Hierarchical Linear Modeling was used to examine potential predictors on adolescent depressive symptoms. This is, to the best of the author’s knowledge, the first study to examine the interplay of school connectedness, school racial composition, and adolescent depression. Results: School connectedness partially mediates the effects of family support on depressive symptoms, but both remain strong predictors of depressive symptoms. African American adolescents are the only racial/ethnic group that has constantly higher CES-D scores than the non-Hispanic white adolescents. School-level connectedness is positively related to students’ depressive symptoms. The racial composition of a school has different effects on students’ depressive symptoms on student’s race. Conclusions: Low perceived family support, low school connectedness, being female, and being African American are consistently associated with greater depressive symptoms one year later. The overall level of school connectedness of a school is found to be related with greater individual student’s depressive symptoms, while the effects of school proportion of minority students on students’ depressive symptoms differ significantly across the race/ethnicity of students. Future study is needed to explore the association between racial/ethnic segregation and adolescent depression while considering students’ racial/ethnic status.

1. Introduction

Depression is one of the most common mental disorders in the US, and it carries the heaviest burden of disability among mental and behavioral disorders (World Health Organization 2017). Data from the National Survey on Drug Use and Health showed that in 2015, 6.7% of the US adults had at least one major depressive episode in the past year (National Institute of Mental Health 2017a). The rate is almost twice as high, 12.5% to be specific, among adolescents between the age of 12 and 17 years (National Institute of Mental Health 2017b). A huge body of literature in psychology, epidemiology, and medical sociology has shown that adolescence is the critical period for depression. Incidence of adolescent depression is known to increase sharply at the age of 12 to 14 (Avenevoli et al. 2015; Kessler et al. 2005). Adolescence is also a crucial period of life that strongly influences a person’s growth, confidence, and critical life choices. Depression during adolescence is found to predict future adjustment problems in educational achievement, labor market participation, delinquent behaviors, and marriage life (Fergusson et al. 2007). An episode of depression early in life is also associated with greater risk for future episodes in life (Fergusson et al. 2007; Dunn and Goodyer 2006; Colman and Ataullahjan 2010). In one word, the effect of adolescent depression may be lifelong.
Given the serious consequences of adolescent depression, knowledge about the impact factors of depression in this population is important. On top of the growing body of literature on social networking and depression among adults (Zhu 2017; Leavy 1983; Ross et al. 1990; Zhu 2018), great academic attention has been drawn to the influence of school- and family-related factors on the mental well-being of adolescents (Bond et al. 2007; Oldfield et al. 2016; Eccles and Roeser 2011; Langille et al. 2015; Costello et al. 2008; Sander and McCarty 2005). There is a strong need to illuminate the impact of school and family factors on future depressive symptoms among children around this age. However, the mechanisms through which school and family factors interplay to affect mental health outcomes among adolescents are yet to be understood. On top of that, the way in which race/ethnicity affects these mechanisms is still unclear. This study is, to the best of the author’s knowledge, the first longitudinal examination of the link between school connectedness, family support, school racial composition, and adolescent depressive symptoms in the United States. By using Hierarchical Linear Modeling (HLM), this paper examines the associations on both student-level and school-level simultaneously, thus shedding lights on the multilevel mechanisms of adolescent depression in school contexts. Based on the existing body of literature, the author proposed four hypotheses to be tested in this study.
Hypothesis 1.
School connectedness mediates the association between family support and depressive symptoms among US adolescents.
Hypothesis 2.
I hypothesize that race/ethnicity is an effect modifier for the association between school connectedness, family support, and depressive symptoms; the magnitude of the association between family support, school connectedness, and depressive symptom are greater among racial/ethnic minority students.
Hypothesis 3.
Students in racially or ethnically segregated schools tend to have a lower level of depression symptoms and those in integrated schools tend to have greater symptoms.
Hypothesis 4.
The association between the racial/ethnic composition of school and students’ depressive symptoms differs across racial/ethnic groups.
Family being one of the most important primary agencies has great effects on the development of children and adolescents. Previous studies on adolescent mental well-being found that support from family members differentiates adolescents with depressed symptomatology from adolescents without such symptoms (Pedersen 1994; Sheeber et al. 1997; Noller and Callan 2015; Ewing et al. 2015; Angley et al. 2015; Diamond et al. 2016). In a prospective study, Sheeber and colleagues (Sheeber et al. 1997) found that less supportive family environments were associated with greater depressive symptomatology, both concurrently and prospectively, over a one-year period. Patten and colleagues (Patten et al. 1997) also found that a lack of perceived parental social support is highly related to depressive symptoms in California adolescents.
Similar to family connectedness, school connectedness has also been found to predict adolescent depression. Goodenow defined the notion of “school connectedness” as “the extent to which students feel personally accepted, respected, included, and supported by others in the school social environment” (Goodenow 1993). A number of studies have found that school connectedness is a strong predictor of adolescent depression (Millings et al. 2012; Shochet et al. 2008; Joyce and Early 2014; Shochet and Smith 2014; Zhao and Zhao 2015; Oldfield et al. 2018). Shochet and colleagues suggest that it may be one of the strongest predictors of adolescent depression (Shochet et al. 2006).
However, the links between ecological factors are not well understood. Do school environments and family factors function additively, which means they are independent of each other, or do they mediate or moderate one another? Attachment theory suggests that attachment to the primary caregivers and parents impacts future interpersonal relationships at school and among peers (Bowlby 1978). However, few studies have directly examined how school connectedness and family-related factors interrelate to affect depressive symptoms in adolescents. In a cross-sectional study using hierarchical linear modeling, Shochet and collogues (Shochet et al. 2008) found that school connectedness partially mediates the effect of attachment to parents on depressive symptoms among Australian adolescents. Similar findings are reported in a study conducted in a high school in the North West of England (Oldfield et al. 2016). If this result is replicated in the US adolescent population, it would contribute to our understanding on the nature of the relationship between ecosocial factors and their effects on adolescent depressive symptoms. Therefore, the author hypothesize that school connectedness mediates the association between family support and depressive symptoms among US adolescents (Hypothesis 1).
Race/ethnicity has been found to be associated with school connectedness on two levels. On an individual level, African American students feel less connected to school than their white counterparts. A meta-analysis on depression among children (ages 8 to 16) has found that Hispanic samples scored significantly higher on the Children’s Depression Inventory. A similar result has been found by Blazer and colleagues (Blazer et al. 1994) using a national sample of 8098 persons of the National Comorbidity Survey. On a school level, school connectedness was found to be relatively high in racially or ethnically segregated schools and lower in a racially-mixed school (McNeely et al. 2002; Walsemann et al. 2011). However, no studies have directly examined how school- and family-related predictors may affect depression differently across racial/ethnic groups.
Ross and Mirowsky summarized two competing theoretical frameworks used to examine the association between resources and outcomes (Ross and Mirowsky 2006). “Resource substitution” theory suggests that when individuals have multiple resources, the outcomes become less dependent on the presence of any specific resource. As a consequence, the effect of having a specific resource is greater for those who have fewer alternative resources. This theory suggests that the effect of school connectedness and family support on psychological well-being is greater for adolescents of racial/ethnic minority groups (persons with fewer alternative resources) than it is for non-Hispanic white. In contrast, ‘‘resource multiplication’’ theory suggests that the influence of education on wellbeing is greater for persons with more resources. In this view, advantaged groups gain the most from the resources they have, so that their resources multiply to perpetuate and augment their advantage (Ross and Mirowsky 2006). Applied to the effect of school connectedness and family support on adolescent mental health, “resource multiplication” states that the advantaged groups gain the most from the resources they have, so minority students gain less from family support and school connectedness.
The author hypothesizes that because of racial/ethnic minority students’ access to fewer alternative resources, school connectedness and family support would affect them with a stronger magnitude than for non-Hispanic white students. In other words, race/ethnicity is hypothesize to be an effect modifier for the association between school connectedness, family support, and depressive symptoms; the magnitude of the association between family support, school connectedness, and depressive symptom is hypothesized to be greater among racial/ethnic minority students (Hypothesis 2).
Past research has paid attention to the effects of school-level characteristics on students’ school connectedness. McNeely and colleagues found that students from schools with positive classroom management climates, participation in extracurricular activities, tolerant disciplinary policies, and a small school size tend to have higher school connectedness (McNeely et al. 2002). However, few studies have directly examined how school-level characteristics are related to students’ mental health outcomes. The author hypothesizes that this curvilinear pattern also applies to the association between the racial/ethnic composition of the school and students’ depressive symptoms: students in racially or ethnically segregated schools are hypothesized to have a lower level of depression symptoms and those in an integrated school tend to have greater symptoms (Hypothesis 3).
Robert Crosnoe proposed the “frog pond” perspective in his study of the socioeconomic composition of public high school and low-income students’ academic achievement, using the National Longitudinal Study of Adolescent Health (Crosnoe 2009). His research finding suggests lower achievement in math and science, and more psychosocial problems for low-income students in schools with a higher proportion of middle- or high-income parents. Additionally, the patterns were more pronounced among African American and Hispanic students. Crosnoe points out that socioeconomic status (SES) might be used by students, parents, and school personnel as a marker of ability and worth. Therefore, low SES students in high SES schools are at a greater disadvantage because they might be labeled as inferior to their peers. The author hypothesizes that race/ethnicity could also be used as such a marker, specifically, that the association between racial/ethnic composition of school and students’ depressive symptoms differs across racial/ethnic groups (Hypothesis 4). Students of different racial/ethnic groups might be affected differently by the racial/ethnic composition of the school.

2. Methods

2.1. Data Source

Data used in this study comes from the National Longitudinal Study of Adolescent Health (Harris and Udry 1998), a nationally representative study of adolescents in grades 7 to 12 in the United States in 1994–1995. The Add Health used a multistage, stratified, school-based, cluster sampling design. A stratified random sample of 80 high schools and 52 feeder schools was selected. From those 132 schools, a random sample of 12,105 adolescents completed the interview of the Wave 1 (W1) in-home survey in 1995. The Wave 2 (W2) survey was conducted in the following year, 1996, and 77% of the adolescents in W1 (N = 9278) participated in the Wave 2 study. Survey design of Add Health is detailed by Chantala and colleagues (Chantala and Tabor 1999).
The public use data, which is used in this study, consists of 6405 adolescents from all 132 schools in W1, 4837 in W2, of which 4834 cases were matched from both waves. After deleting cases with at least one missing value for the dependent and independent variables, the total sample consists of 4228 adolescents from 132 schools, with an average of 32 students per school. In this final sample, 52.32% are female (n = 2212) and 47.68% are male (n = 2016); 60.88% are non-Hispanic white (n = 2574), 22.99% are Black (n = 972), 11.07% are Hispanic (n = 468), and 3.43% are Asian (n = 145), while 1.63% are other (n = 69). Figure 1 and Figure 2 show the gender composition and race/ethnicity composition of the final sample included in this study, respectively. The grand sample weight from W2 data is used to weight the sample included in this study (Chantala and Tabor 1999).
Hierarchical Linear Modeling (HLM) analysis is applied to adjust for the nestedness of the data, students nested within schools. It also allows me to examine the effect of school-level characteristics on the outcome.

2.2. Measures

Dependent variable. The outcome variable is the adolescent report of depressive symptoms from Wave 2. Depressive symptoms are measured from the Center for Epidemiologic Studies-Depression Scale (CES-D). It is based on 20 items from the Add Health survey questionnaire that corresponded with the 20-item CES-D (Cronbach’s alpha = 0.87). Two questions on the Add Health survey, items on symptoms of “restless sleep” and “crying for no reason”, were slightly modified from the CES-D. Answer options from the respondents range from 0 to 3 on the basis of frequency of depressive symptoms reported during the past week, from “never” to “daily.” Total depressive symptom scale is created by summing up all 20 items and is then z-standardized, with a higher numeric value indicating more depressive symptoms. Please refer to Appendix A for all the constructs and scales used in this study.
Individual-level variables. School connectedness scale of adolescents in Wave 1 is constructed using six items on the Add Health survey questionnaire: “You feel close to people at your school”, “You feel like you are part of your school”, “Students at your school are not prejudiced”, “You are happy to be at your school”, “The teachers at your school treat students fairly”, and “You feel safe in your school” (Cronbach’s alpha = 0.73). Individual items were scored from 1 “Strongly agree” to 5 “Strongly disagree.” The summed scores are z-standardized to create the final index, with the higher value indicating a stronger level of school connectedness of individuals. Family support scale in Wave 1 is created by using five items: “How much do you feel that your parents care about you”, “How much do you feel that people in your family understand you”, “How much do you feel that you and your family have fun together”, “How much do you feel that you want to leave home”, and “How much do you feel that your family pays attention to you” (Cronbach’s alpha = 0.75). Option categories range from 1 “Not at all” to 5 “Very much”. The summed scores are z-standardized to create the final index, with the higher scores indicating stronger perceived family support.
For this study, racial/ethnic was coded into five dummy variables: non-Hispanic White, Black, Hispanic, Asian, and Other.1 The Other category includes American Indian, Native American, and non-specified racial/ethnic groups. Gender and age information are collected in W1, and are also included as control variables. Gender variable is coded as 0 “Male” and 1 “Female.” Age is measured as a continuous variable. CES-D depressive symptom scale in W1 was created using the same items for the scale in W2 (Cronbach’s alpha = 0.86).
School-level variable. All school-level variables are calculated before listwise deletion. School-mean connectedness is calculated by taking the average of the W1 school connectedness (z) score of an individual student within one school. The proportion of racial/ethnic minority students within one school is calculated by taking the average of the minority status of all the students within that school. After listwise deletion, the number of participating students within one school ranges from four to 92, with an average of 32 students per school.

3. Results

Table 1 presents the means and the standard deviations for each of the seven continuous variables. All student-level predictors, except for W1 Age, are normally distributed to meet the normality assumption of regression. Figure 3 shows the W1 and W2 CES-D score, W1 family support, and W1 school connectedness by racial/ethnic categories. Figure 3a,b show that non-Hispanic white and Hispanic are the racial/ethnic groups with lower W1 and W2 z-standardized CES-D scores, while Asian is the one with high scores. Figure 3c shows that Asian is the group with a high level of W1 school connectedness, while Other is the lowest. Figure 3d shows that the perceived W1 perceived family support values for Asian and Other are low, while they are high for Black and Hispanic.
Table 2 presents the coefficients from regression of W2 CES-D Depressive Symptom score 2 on student-level predictors and intra-class interaction terms between W1 school connectedness (z) and race/ethnicity dummy variables. Analyses were first conducted to see if W1 school connectedness mediates the association between W2 depression and W1 family support. Coefficients in Model 1 indicate that being female, a higher W1 depression score, and being Black are related to higher W2 depression scores. Higher perceived family support in Wave 1 is associated with lower CES-D in Wave 2. W1 school connectedness is added into Model 2. The magnitude of the association between W1 family support and W2 depression decreased (from −0.061 to −0.048), but the association remains statistically significant (p < 0.05). School connectedness mediates the relationship between family support and depressive symptoms in adolescents, but they are both strong predictors of depressive symptoms. Part of the influence of family support on depression is carried through its influence on school connectedness. The coefficient for W1 school connectedness (−0.56, p < 0.01) suggests that school connectedness is strongly and negatively associated with the W2 depressive symptom score.
To test if the effects of school connectedness on depression are different across racial/ethnic groups, I included intra-class interaction terms between race/ethnicity dummy variables and W1 school connectedness (z) in Model 3.2 None of the intra-class interaction terms are significant.
Presented in Table 3 are the results from the regression of W2 CES-D score on student-level and school-level predictors. All predictors are grand-mean centered, except for race/ethnicity dummy variables, which are school-mean centered. By adding school-level connectedness as an indicator for school environment, I was able to isolate the within-school and between-school effect of school connectedness. As for the school proportion of minority students, a linear term and a quadratic term were included as school-level predictors to test for a non-linear relationship.
As is shown in Model 4, being female, a higher W1 CES-D score, lower W1 family support, and lower W1 school connectedness are associated with a higher W2 CES-D score. In addition, being African American is associated with a higher W2 CES-D score, compared with being non-Hispanic white. Because race/ethnicity dummy variables are school-mean centered, they are measuring the within-school effect of race/ethnicity. More specifically, being African American is associated with a higher W2 depression score compared with being non-Hispanic White, holding other variables constant.
As for school-level predictors, the coefficients for the linear term and quadratic term suggest that the association between the proportion of minority students of the school and individual depression score is reversely U-shaped. If we have three students from three different schools, they are the same in terms of the student-level W1 CES-D score, family support, school connectedness, gender, and age, and they are the average race of their school; their school has the same level of average school connectedness; one school has a really low proportion minority, one school has a really high, and one school has a moderate proportion. Then, students from the low and high proportion minority schools would have a lower W2 depression score than the third one, which is a more integrated school. In other words, students from racially or ethnically segregated schools tend to have lower W2 depression scores than their counterparts in racially or ethnically integrated schools. Figure 4 presents the association between proportion minority students of the school and individual depression score from Wave 2 among students from schools of average mean connectedness among all schools; these students have an average W1 CES-D score, W1 family support, W1 school connectedness, gender, and age, and are of average race within their schools. The five dots represent five students from five schools that are of zero, half, and one standard deviation below and above the average proportion of minority students among all schools3.
The school average connectedness, however, it positively related to depression and it is marginally significant (coefficient = 0.94, p < 0.10). This suggests the comparison between two students with the same student-level gender, age, W1 CES-D score, W1 family support, and W1 school connectedness; they come from two different schools with the same proportion of minority students, and are both of the average race of the school; one school is one standard deviation higher than the other one, and the student from the higher school mean connectedness has a 0.094 standard deviation higher W2 CES-D score than the other student. This finding is also found in previous literature. A plausible interpretation is the relative deprivation; in other words, the relative level of school connectedness individuals perceive is an important factor. Even though two students have the same individual level school connectedness, the one from a school where everyone else is a lot more connected to the school might be unconsciously exposed to greater stress than the one from a school where everyone else has a similar school connectedness with him or her.
In Model 5, I included cross-level interaction terms between race/ethnicity and proportion of minority students in the school population to test if race/ethnicity is associated with depression differently across schools with different racial/ethnic diversities. Coefficients for student-level predictors, except for race/ethnicity, did not change greatly from those in Model 4. As for race/ethnicity, being African American is no longer significantly related to a higher W2 depression score, while Other became a marginally significant predictor (coefficient = 0.399, p < 0.10). The linear term of school proportion of minority students for non-Hispanic white remains significant, while the quadratic term loses its significance. This suggests a positive linear relationship between the school-level proportion of minority students and students’ depressive symptoms; as school-level proportion of minority students increases, the W2 CES-D score of non-Hispanic white students also increases.
Both the interaction terms for “Hispanic” are marginally significant (linear interaction term coefficient = −0.693, p < 0.10; quadratic interaction term coefficient = 1.774, p < 0.10). For “Other,” only the linear interaction term is significant (1.202, p < 0.05). Figure 5 is the visual presentation of the cross-level interaction effects4. As is seen in the figures, the association for non-Hispanic white is linear, reversed U-shaped for Hispanic, and a curve with increasing steepness. This indicates that for non-Hispanic white students, as the percentage of minority students of their school increases, individual depressive symptom scores also increase, holding other variables constant. For Hispanic students, the depressive symptom score of students decreases as school proportion of minority students increases, but only slightly. For students in the “Other” category (Native Americans, American Indians, and non-specified groups), student depressive symptoms increase as school proportion of minority students increases, and the slope becomes gradually steeper.

4. Discussion

Results of this study suggest that school connectedness, perceived family support, gender, and previous depressive symptoms are strong predictors of adolescent depressive symptoms one year later. In addition, we found that school connectedness partially mediated the relationship between family support and adolescent depressive symptoms. When considered together, school connectedness has a stronger effect on depressive symptoms than family support, highlighting the importance of the former. These findings are consistent with the aforementioned Australian and English studies (Oldfield et al. 2016; Shochet et al. 2008), and shed light on the complex mechanism through which family and school environments interplay to affect adolescent’s psychological well-being, suggesting the need for an integrative approach that takes family and school factors into account when considering adolescent depression prevention and treatment.
Overall, school-level average connectedness is found to be positively related to student-level depressive symptoms. This effect was only marginally significant, and was not found in previous literature. Although the effects of school connectedness on adolescent mental health have been greatly examined in previous studies, there has been no research that has explored the school-level connectedness. Ecosocial perspective in medical sociology and epidemiology would suggest that school-level characteristics, school environment, and qualities, could affect student-level well-being through psychological mechanisms. Future investigators should assemble a package of school-level measurements and examine their effects on student-level health outcomes. Race/ethnicity has been found to be a moderator of the effect on school-level proportion of minority students, but the specific mechanisms of this are yet to be well explained.
Race/ethnicity at the individual level was not significantly associated with adolescent depressive disorder. People who were in the Other category, i.e., Native Americans, American Indians, and non-specified groups, showed a tendency of statistical significance (p < 0.10) to vary from the reference group, non-Hispanic whites, when the W1 depressive symptom score was set at zero. On top of that, the significant interaction term between school connectedness and being part of the “Other” racial/ethnic group (vs. non-Hispanic white) indicated that the effects of school connectedness affect non-Hispanic whites and those of the “Other” racial/ethnic group in a different way. Previous studies have found elevated depression risks among Native American adolescents compared to those of other racial/ethnic groups (Saluja et al. 2004).
In addition, this study found significant gender differences of depressive symptoms among adolescents. Adolescent girls had significantly higher depressive symptoms than the boy adolescents, even with all other individual- and school-level covariates controlled for. This is consistent with previous findings of female predominance of adolescent depression (Petersen et al. 1991; Bennett et al. 2005; Zahn-Waxler et al. 2008; Hyde et al. 2008). Gender differences in depression emerge at the age of 13, and scholars have proposed an integrated, developmental model to explain the gender differences. Various affective, biological, and cognitive factors contribute to the higher depression risks among girl adolescents (Hyde et al. 2008). Yet, it is not fully clear whether school and family environments affect boys and girls differently, and the intersectionality between gender and race is yet to be fully explored. Future research efforts are needed to explore how gender may interact with other individual- and school-level factors to influence depression among adolescents.
This study addressed several issues that were not clearly explained in previous studies, but it is not without limitations. First, the data used in this paper comes from the public use data of the Add Health survey, which means that it is a random selection from the whole dataset. The sample size is only one third of the original data, which decreased the study power. Future study should consider replicating the analyses using the full dataset. Furthermore, the data were collected two decades ago, which might have limited the implications of the findings. Research in school contexts using more recent data is clearly warranted. Second, the main predictors are self-reported perceptions of school and family environment. Psychological theories in cognitive vulnerability suggest that depressed individuals tend to focus on negative feelings and perception of the environment. In that case, it might be that previous depression might result in a lower perception of family support and lower attachment to school peers. This would indicate reverse causality issues. Shochet and colleagues (2006) have found that previous depression is not a significant predictor of later connectedness to school and family environments. I was not able to find similar evidence to address the potential causality issue in this study. A better understanding of the causality demands efforts in future research.
In sum, school environment, family factors, and individual characteristics are found to be associated with adolescent depression. Clinic diagnosis, treatment, and interventions should take an ecosocial perspective and pay attention to not only individual-level risk factors, but also various contexts of adolescents’ lives.

Compliance with Ethical Standards

All procedures performed in studies involving human participants were in accordance with the ethical standards of the institutional and/or national research committee and with the 1964 Helsinki declaration and its later amendments or comparable ethical standards.

Funding

There is no funding source to disclose.

Ethical Approval

This study uses secondary data, and does not contain any studies with human participants performed by the author. The study was exempted by Temple University institutional review board (IRB).

Informed Consent

Informed consent was obtained from all individual participants included in the study.

Acknowledgment

The author thanks Joshua Klugman, Temple University for his comments and suggestions on an earlier draft of the manuscript.

Conflicts of Interest

The author declares no conflict of interest.

Appendix A

Table A1. Measurement of Depressive Symptoms, Perceived Family Support, and School Connectedness.
Depressive Symptoms: CES-D Scale
Having trouble falling asleep or staying asleep
Frequency crying
Bothered by things that usually don’t bother you
Didn’t feel like eating, your appetite was poor
Felt that could not shake off the blues, even with help from your family and your friends
Felt that you were not as good as other people
Had trouble keeping your mind on what you were doing
Felt depressed
Felt that you were too tired to do things
Didn’t feel hopeful about the future
Thought your life had been a failure
Felt fearful
Were not happy
Talked less than usual
Felt lonely
People were not friendly to you
Did not enjoy life
Felt sad
Felt that people dislike you
It was hard to get started doing things
Perceived Family Support
Feel that your parents care about you?
Feel that people in your family understand you?
Feel that you want to leave home?
Feel that you and your family have fun together?
Feel that your family pays attention to you?
School Connectedness Scale
Feet close to people at your school
Feel like you are part of your school
Students at your school are not prejudiced
Were happy to be at your school last year
Teachers at your school treated students fairly last year
Feel safe at your school

References

  1. Angley, Meghan, Anna Divney, Urania Magriples, and Trace Kershaw. 2015. Social support, family functioning and parenting competence in adolescent parents. Maternal and Child Health Journal 19: 67–73. [Google Scholar] [CrossRef] [PubMed]
  2. Avenevoli, Shelli, Joel Swendsen, Jian-Ping He, Marcy Burstein, and Kathleen Ries Merikangas. 2015. Major depression in the National Comorbidity Survey–Adolescent Supplement: Prevalence, correlates, and treatment. Journal of the American Academy of Child & Adolescent Psychiatry 54: 37–44. [Google Scholar] [CrossRef]
  3. Bennett, David S., Paul J. Ambrosini, Diana Kudes, Claudia Metz, and Harris Rabinovich. 2005. Gender differences in adolescent depression: Do symptoms differ for boys and girls? Journal of Affective Disorders 89: 35–44. [Google Scholar] [CrossRef] [PubMed]
  4. Blazer, Dan G., Ronald C. Kessler, Katherine A. McGonagle, and Marvin S. Swartz. 1994. The prevalence and distribution of major depression in a national community sample: The National Comorbidity Survey. American Journal of Psychiatry 151: 979–86. [Google Scholar] [CrossRef] [PubMed]
  5. Bond, Lyndal, Helen Butler, Lyndal Thomas, John Carlin, Sara Glover, Glenn Bowes, and George Patton. 2007. Social and school connectedness in early secondary school as predictors of late teenage substance use, mental health, and academic outcomes. Journal of Adolescent Health 40: 357.e9–357.e18. [Google Scholar] [CrossRef] [PubMed]
  6. Bowlby, John. 1978. Attachment theory and its therapeutic implications. Adolescent Psychiatry 6: 5–33. [Google Scholar]
  7. Chantala, Kim, and Joyce Tabor. 1999. National Longitudinal Study of Adolescent Health: Strategies to Perform a Design-Based Analysis Using the Add Health Data. Available online: http://citeseerx.ist.psu.edu/viewdoc/summary?doi=10.1.1.629.5502 (accessed on 24 April 2018).
  8. Colman, Ian, and Anushka Ataullahjan. 2010. Life course perspectives on the epidemiology of depression. The Canadian Journal of Psychiatry 55: 622–32. [Google Scholar] [CrossRef] [PubMed]
  9. Costello, Darcé M., Joel Swendsen, Jennifer S. Rose, and Lisa C. Dierker. 2008. Risk and protective factors associated with trajectories of depressed mood from adolescence to early adulthood. Journal of Consulting and Clinical Psychology 76: 173–83. [Google Scholar] [CrossRef] [PubMed]
  10. Crosnoe, Robert. 2009. Low-income students and the socioeconomic composition of public high schools. American Sociological Review 74: 709–30. [Google Scholar] [CrossRef] [PubMed]
  11. Diamond, Guy, Jody Russon, and Suzanne Levy. 2016. Attachment-Based Family Therapy: A Review of the Empirical Support. Family Process 55: 595–610. [Google Scholar] [CrossRef] [PubMed]
  12. Dunn, Valerie, and Ian M. Goodyer. 2006. Longitudinal investigation into childhood-and adolescence-onset depression: Psychiatric outcome in early adulthood. The British Journal of Psychiatry 188: 216–22. [Google Scholar] [CrossRef] [PubMed]
  13. Eccles, Jacquelynne S., and Robert W. Roeser. 2011. Schools as developmental contexts during adolescence. Journal of Research on Adolescence 21: 225–41. [Google Scholar] [CrossRef]
  14. Ewing, E. Stephanie Krauthamer, Guy Diamond, and Suzanne Levy. 2015. Attachment-based family therapy for depressed and suicidal adolescents: Theory, clinical model and empirical support. Attachment & Human Development 17: 136–56. [Google Scholar] [CrossRef]
  15. Fergusson, David M., Joseph M. Boden, and L. John Horwood. 2007. Recurrence of major depression in adolescence and early adulthood, and later mental health, educational and economic outcomes. The British Journal of Psychiatry 191: 335–42. [Google Scholar] [CrossRef] [PubMed]
  16. Goodenow, Carol. 1993. The psychological sense of school membership among adolescents: Scale development and educational correlates. Psychology in the Schools 30: 79–90. [Google Scholar] [CrossRef]
  17. Harris, Kathleen Mullan, and J. Richard Udry. 1998. National Longitudinal Study of Adolescent to Adult Health, Public Use Contextual Database, Wave I. Available online: http://www.thearda.com/Archive/Files/Descriptions/ADDHW1C.asp (accessed on 8 April 2018).
  18. Hyde, Janet Shibley, Amy H. Mezulis, and Lyn Y. Abramson. 2008. The ABCs of depression: Integrating affective, biological, and cognitive models to explain the emergence of the gender difference in depression. Psychological Review 115: 291–313. [Google Scholar] [CrossRef] [PubMed]
  19. Joyce, Hilary D., and Theresa J. Early. 2014. The impact of school connectedness and teacher support on depressive symptoms in adolescents: A multilevel analysis. Children and Youth Services Review 39: 101–7. [Google Scholar] [CrossRef] [PubMed]
  20. Kessler, Ronald C., Patricia Berglund, Olga Demler, Robert Jin, Kathleen R. Merikangas, and Ellen E. Walters. 2005. Lifetime prevalence and age-of-onset distributions of DSM-IV disorders in the National Comorbidity Survey Replication. Archives of General Psychiatry 62: 593–602. [Google Scholar] [CrossRef] [PubMed]
  21. Langille, Donald B., Mark Asbridge, Amber Cragg, and Daniel Rasic. 2015. Associations of school connectedness with adolescent suicidality: Gender differences and the role of risk of depression. The Canadian Journal of Psychiatry 60: 258–67. [Google Scholar] [CrossRef] [PubMed]
  22. Leavy, Richard L. 1983. Social support and psychological disorder: A review. Journal of Community Psychology 11: 3–21. [Google Scholar] [CrossRef]
  23. McNeely, Clea A., James M. Nonnemaker, and Robert W. Blum. 2002. Promoting school connectedness: Evidence from the national longitudinal study of adolescent health. Journal of School Health 72: 138–46. [Google Scholar] [CrossRef] [PubMed]
  24. Millings, Abigail, Rhiannon Buck, Alan Montgomery, Melissa Spears, and Paul Stallard. 2012. School connectedness, peer attachment, and self-esteem as predictors of adolescent depression. Journal of Adolescence 35: 1061–67. [Google Scholar] [CrossRef] [PubMed]
  25. National Institute of Mental Health. 2017a. Major Depression among Adults. Available online: https://www.nimh.nih.gov/health/statistics/prevalence/major-depression-among-adults.shtml (accessed on 8 June 2017).
  26. National Institute of Mental Health. 2017b. Major Depression among Adolescents. Available online: https://www.nimh.nih.gov/health/statistics/prevalence/major-depression-among-adolescents.shtml (accessed on 7 June 2017).
  27. Noller, Patricia, and Victor Callan. 2015. The Adolescent in the Family. Abingdon: Routledge, ISBN 978-1-317-35930-2. [Google Scholar]
  28. Oldfield, Jeremy, Neil Humphrey, and Judith Hebron. 2016. The role of parental and peer attachment relationships and school connectedness in predicting adolescent mental health outcomes. Child and Adolescent Mental Health 21: 21–29. [Google Scholar] [CrossRef]
  29. Oldfield, Jeremy, Andrew Stevenson, Emily Ortiz, and Bethany Haley. 2018. Promoting or suppressing resilience to mental health outcomes in at risk young people: The role of parental and peer attachment and school connectedness. Journal of Adolescence 64: 13–22. [Google Scholar] [CrossRef] [PubMed]
  30. Patten, Christi A., J. Christian Gillin, Arthur J. Farkas, Elizabeth A. Gilpin, Charles C. Berry, and John P. Pierce. 1997. Depressive symptoms in California adolescents: Family structure and parental support. Journal of Adolescent Health 20: 271–78. [Google Scholar] [CrossRef]
  31. Pedersen, Willy. 1994. Parental relations, mental health, and delinquency in adolescents. Adolescence 29: 975–90. [Google Scholar] [PubMed]
  32. Petersen, Anne C., Pamela A. Sarigiani, and Robert E. Kennedy. 1991. Adolescent depression: Why more girls? Journal of Youth and Adolescence 20: 247–71. [Google Scholar] [CrossRef] [PubMed]
  33. Ross, Catherine E., and John Mirowsky. 2006. Sex differences in the effect of education on depression: Resource multiplication or resource substitution? Social Science & Medicine 63: 1400–13. [Google Scholar] [CrossRef]
  34. Ross, Catherine E., John Mirowsky, and Karen Goldsteen. 1990. The impact of the family on health: The decade in review. Journal of Marriage and Family 52: 1059. [Google Scholar] [CrossRef]
  35. Saluja, Gitanjali, Ronaldo Iachan, Peter C. Scheidt, Mary D. Overpeck, Wenyu Sun, and Jay N. Giedd. 2004. Prevalence of and risk factors for depressive symptoms among young adolescents. Archives of Pediatrics & Adolescent Medicine 158: 760–65. [Google Scholar] [CrossRef]
  36. Sander, Janay B., and Carolyn A. McCarty. 2005. Youth depression in the family context: Familial risk factors and models of treatment. Clinical Child and Family Psychology Review 8: 203–19. [Google Scholar] [CrossRef] [PubMed]
  37. Sheeber, Lisa, Hyman Hops, Anthony Alpert, Betsy Davis, and Judy Andrews. 1997. Family support and conflict: Prospective relations to adolescent depression. Journal of abnormal child psychology 25: 333–44. [Google Scholar] [CrossRef] [PubMed]
  38. Shochet, Ian M., and Coral L. Smith. 2014. A prospective study investigating the links among classroom environment, school connectedness, and depressive symptoms in adolescents. Psychology in the Schools 51: 480–92. [Google Scholar] [CrossRef]
  39. Shochet, Ian M., Mark R. Dadds, David Ham, and Roslyn Montague. 2006. School connectedness is an underemphasized parameter in adolescent mental health: Results of a community prediction study. Journal of Clinical Child & Adolescent Psychology 35: 170–79. [Google Scholar] [CrossRef]
  40. Shochet, Ian M., Ross Homel, Wendell D. Cockshaw, and Danielle T. Montgomery. 2008. How do school connectedness and attachment to parents interrelate in predicting adolescent depressive symptoms? Journal of Clinical Child & Adolescent Psychology 37: 676–81. [Google Scholar]
  41. Walsemann, Katrina M., Bethany A. Bell, and Debeshi Maitra. 2011. The intersection of school racial composition and student race/ethnicity on adolescent depressive and somatic symptoms. Social Science & Medicine 72: 1873–83. [Google Scholar] [CrossRef]
  42. World Health Organization. 2017. Depression and Other Common Mental Disorders: Global Health Estimates. Geneva: World Health Organization. [Google Scholar]
  43. Zahn-Waxler, Carolyn, Elizabeth A. Shirtcliff, and Kristine Marceau. 2008. Disorders of childhood and adolescence: Gender and psychopathology. Annual Review of Clinical Psychology 4: 275–303. [Google Scholar] [CrossRef] [PubMed]
  44. Zhao, Yanhua, and Guoxiang Zhao. 2015. Emotion regulation and depressive symptoms: Examining the mediation effects of school connectedness in Chinese late adolescents. Journal of Adolescence 40: 14–23. [Google Scholar] [CrossRef] [PubMed]
  45. Zhu, Lin. 2017. Depression Risks and Correlates among Different Generations of Chinese Americans: The Effects of Relationships with Friends and Relatives. Social Sciences 6: 56. [Google Scholar] [CrossRef]
  46. Zhu, Lin. 2018. Depression Symptom Patterns and Social Correlates among Chinese Americans. Brain Sciences 8: 16. [Google Scholar] [CrossRef] [PubMed]
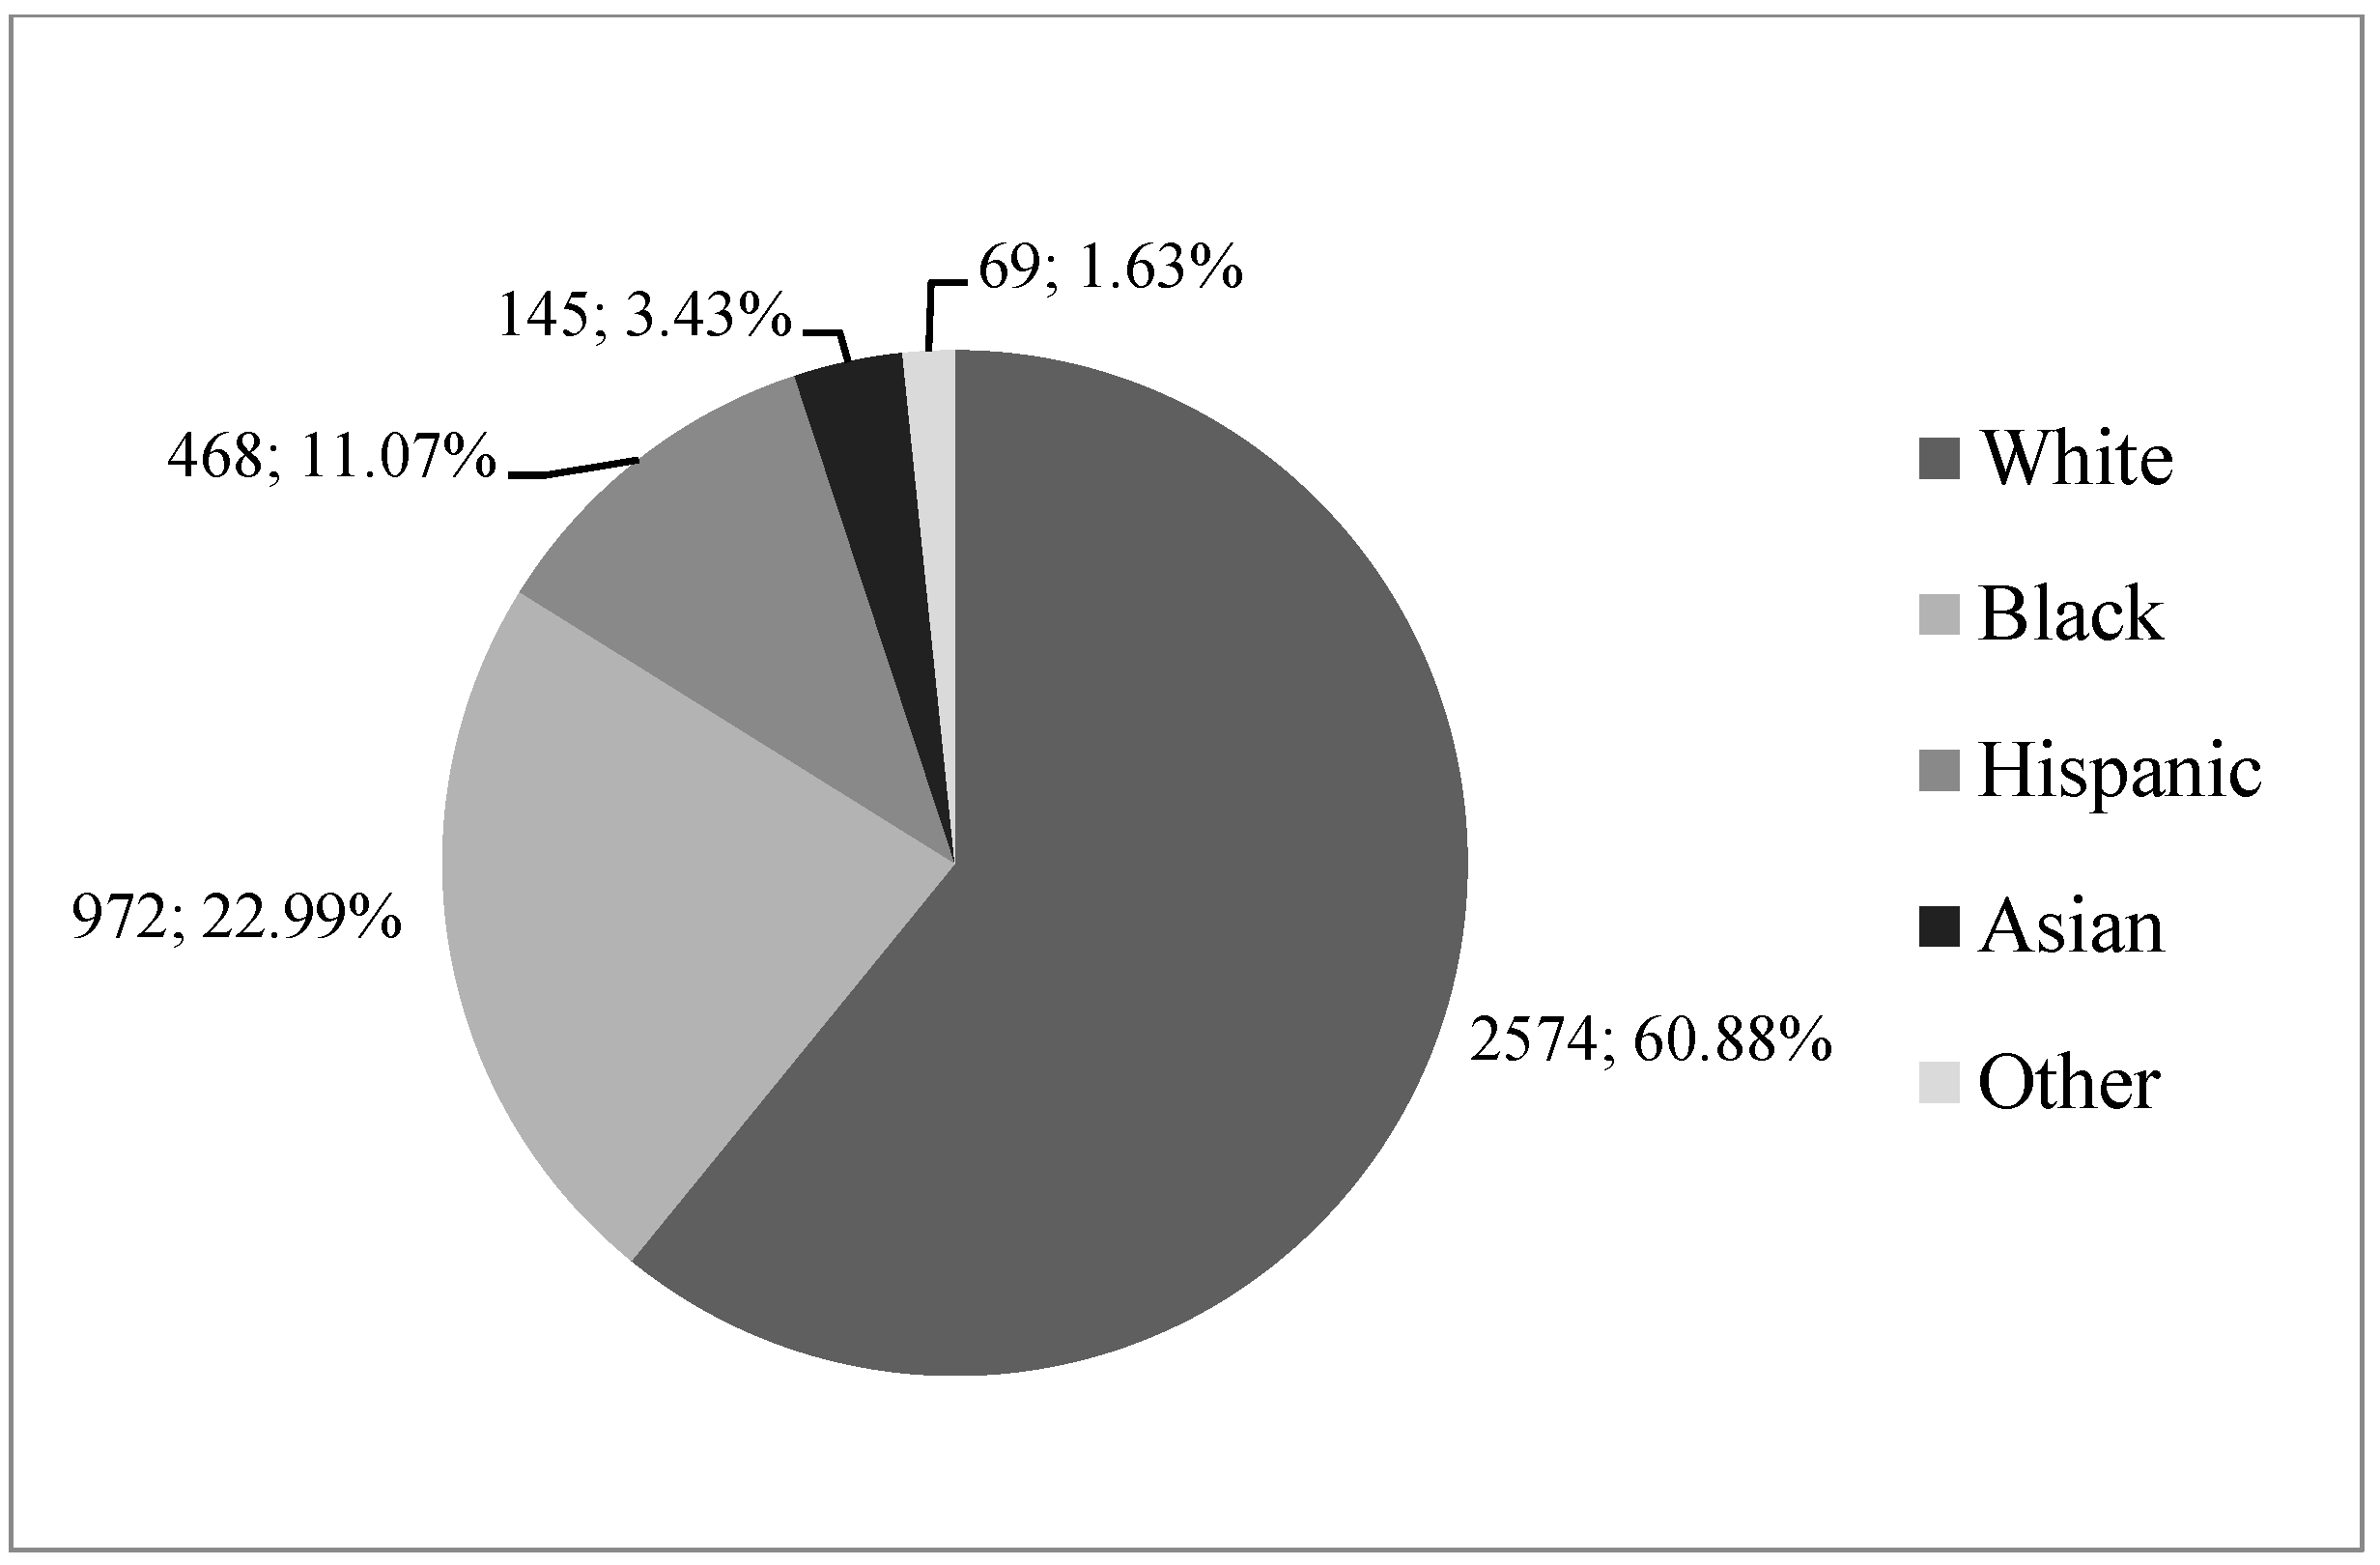
1
Respondents who identified with multiple racial/ethnic groups were able to mark more than one answer in the survey. However, they were placed in a primary racial/ethnic category. Those who chose “Hispanic” were designated as Hispanic and eliminated from any other race categories; those who chose “black or African American” and other race were designated as black or African American, and eliminated from the other categories. The process was repeated for the other racial/ethnic categories in the following order: Asian, Native American, other, and white. In this study, Native Americans and other races were combined, because of the limited sample size.
2
I tested the interaction between W1 family support and race/ethnicity, the results of which not presented. The interaction terms are not significant, and the coefficients of other variables are the same as those in Model 3.
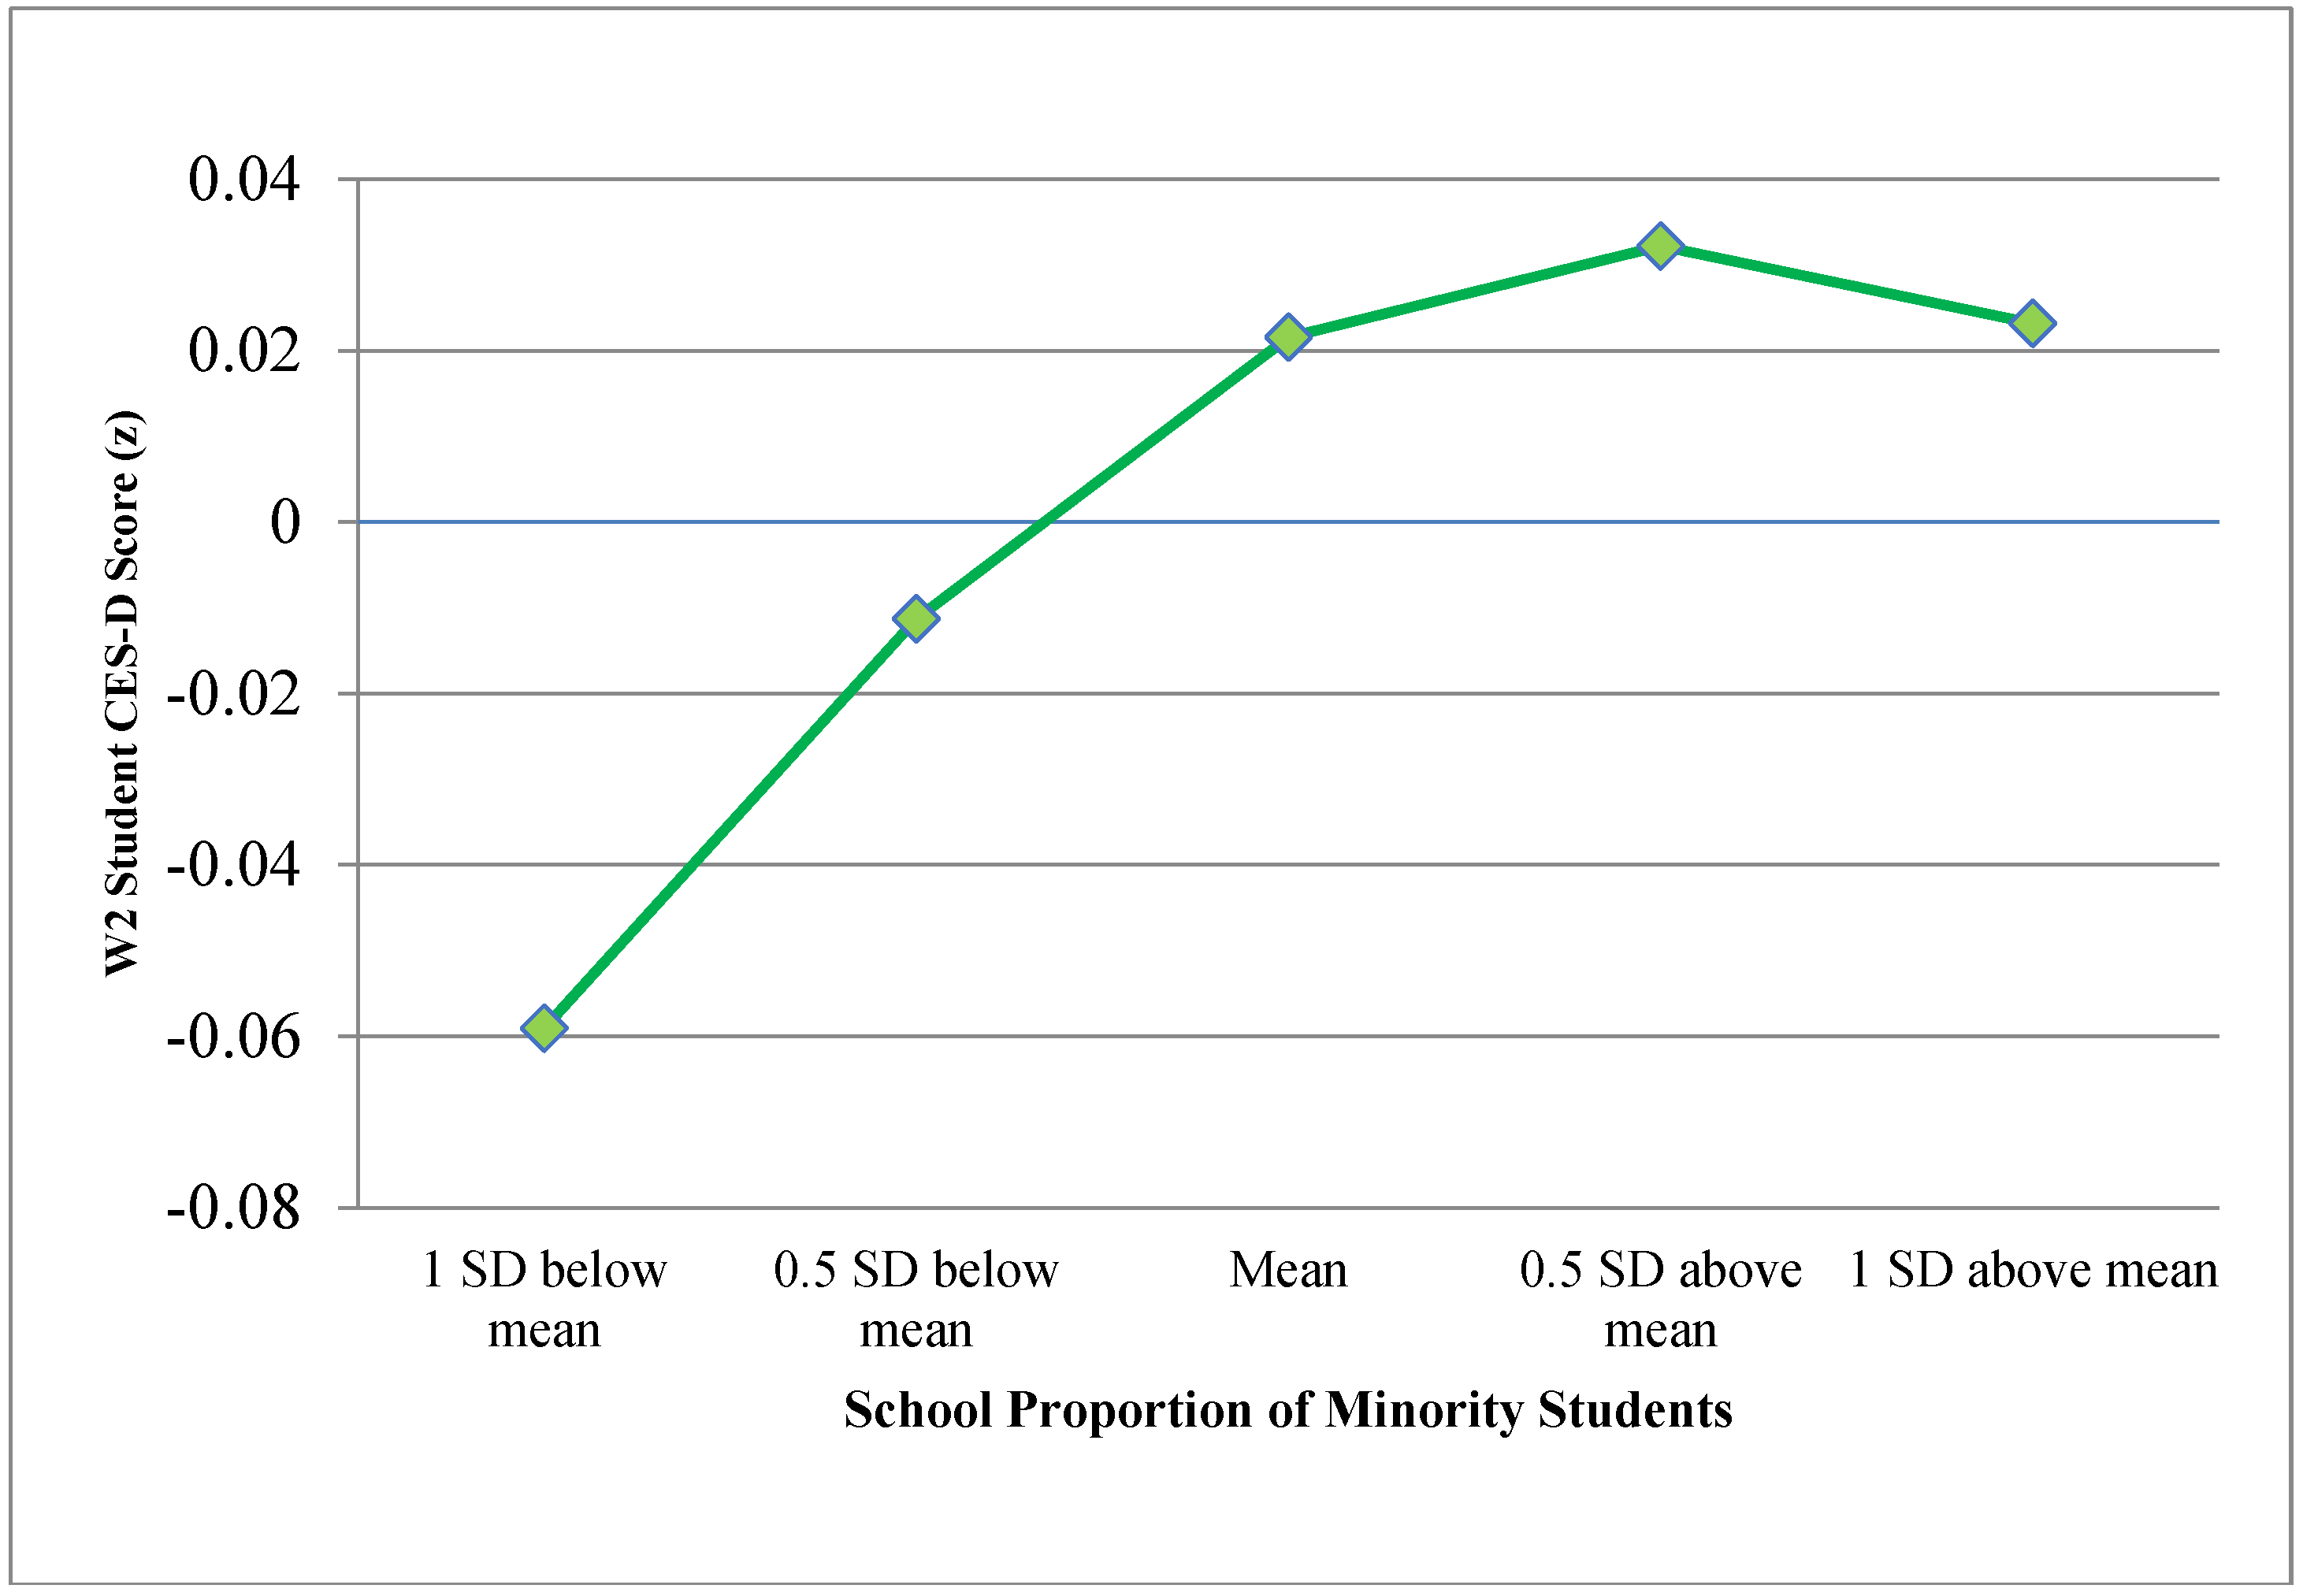
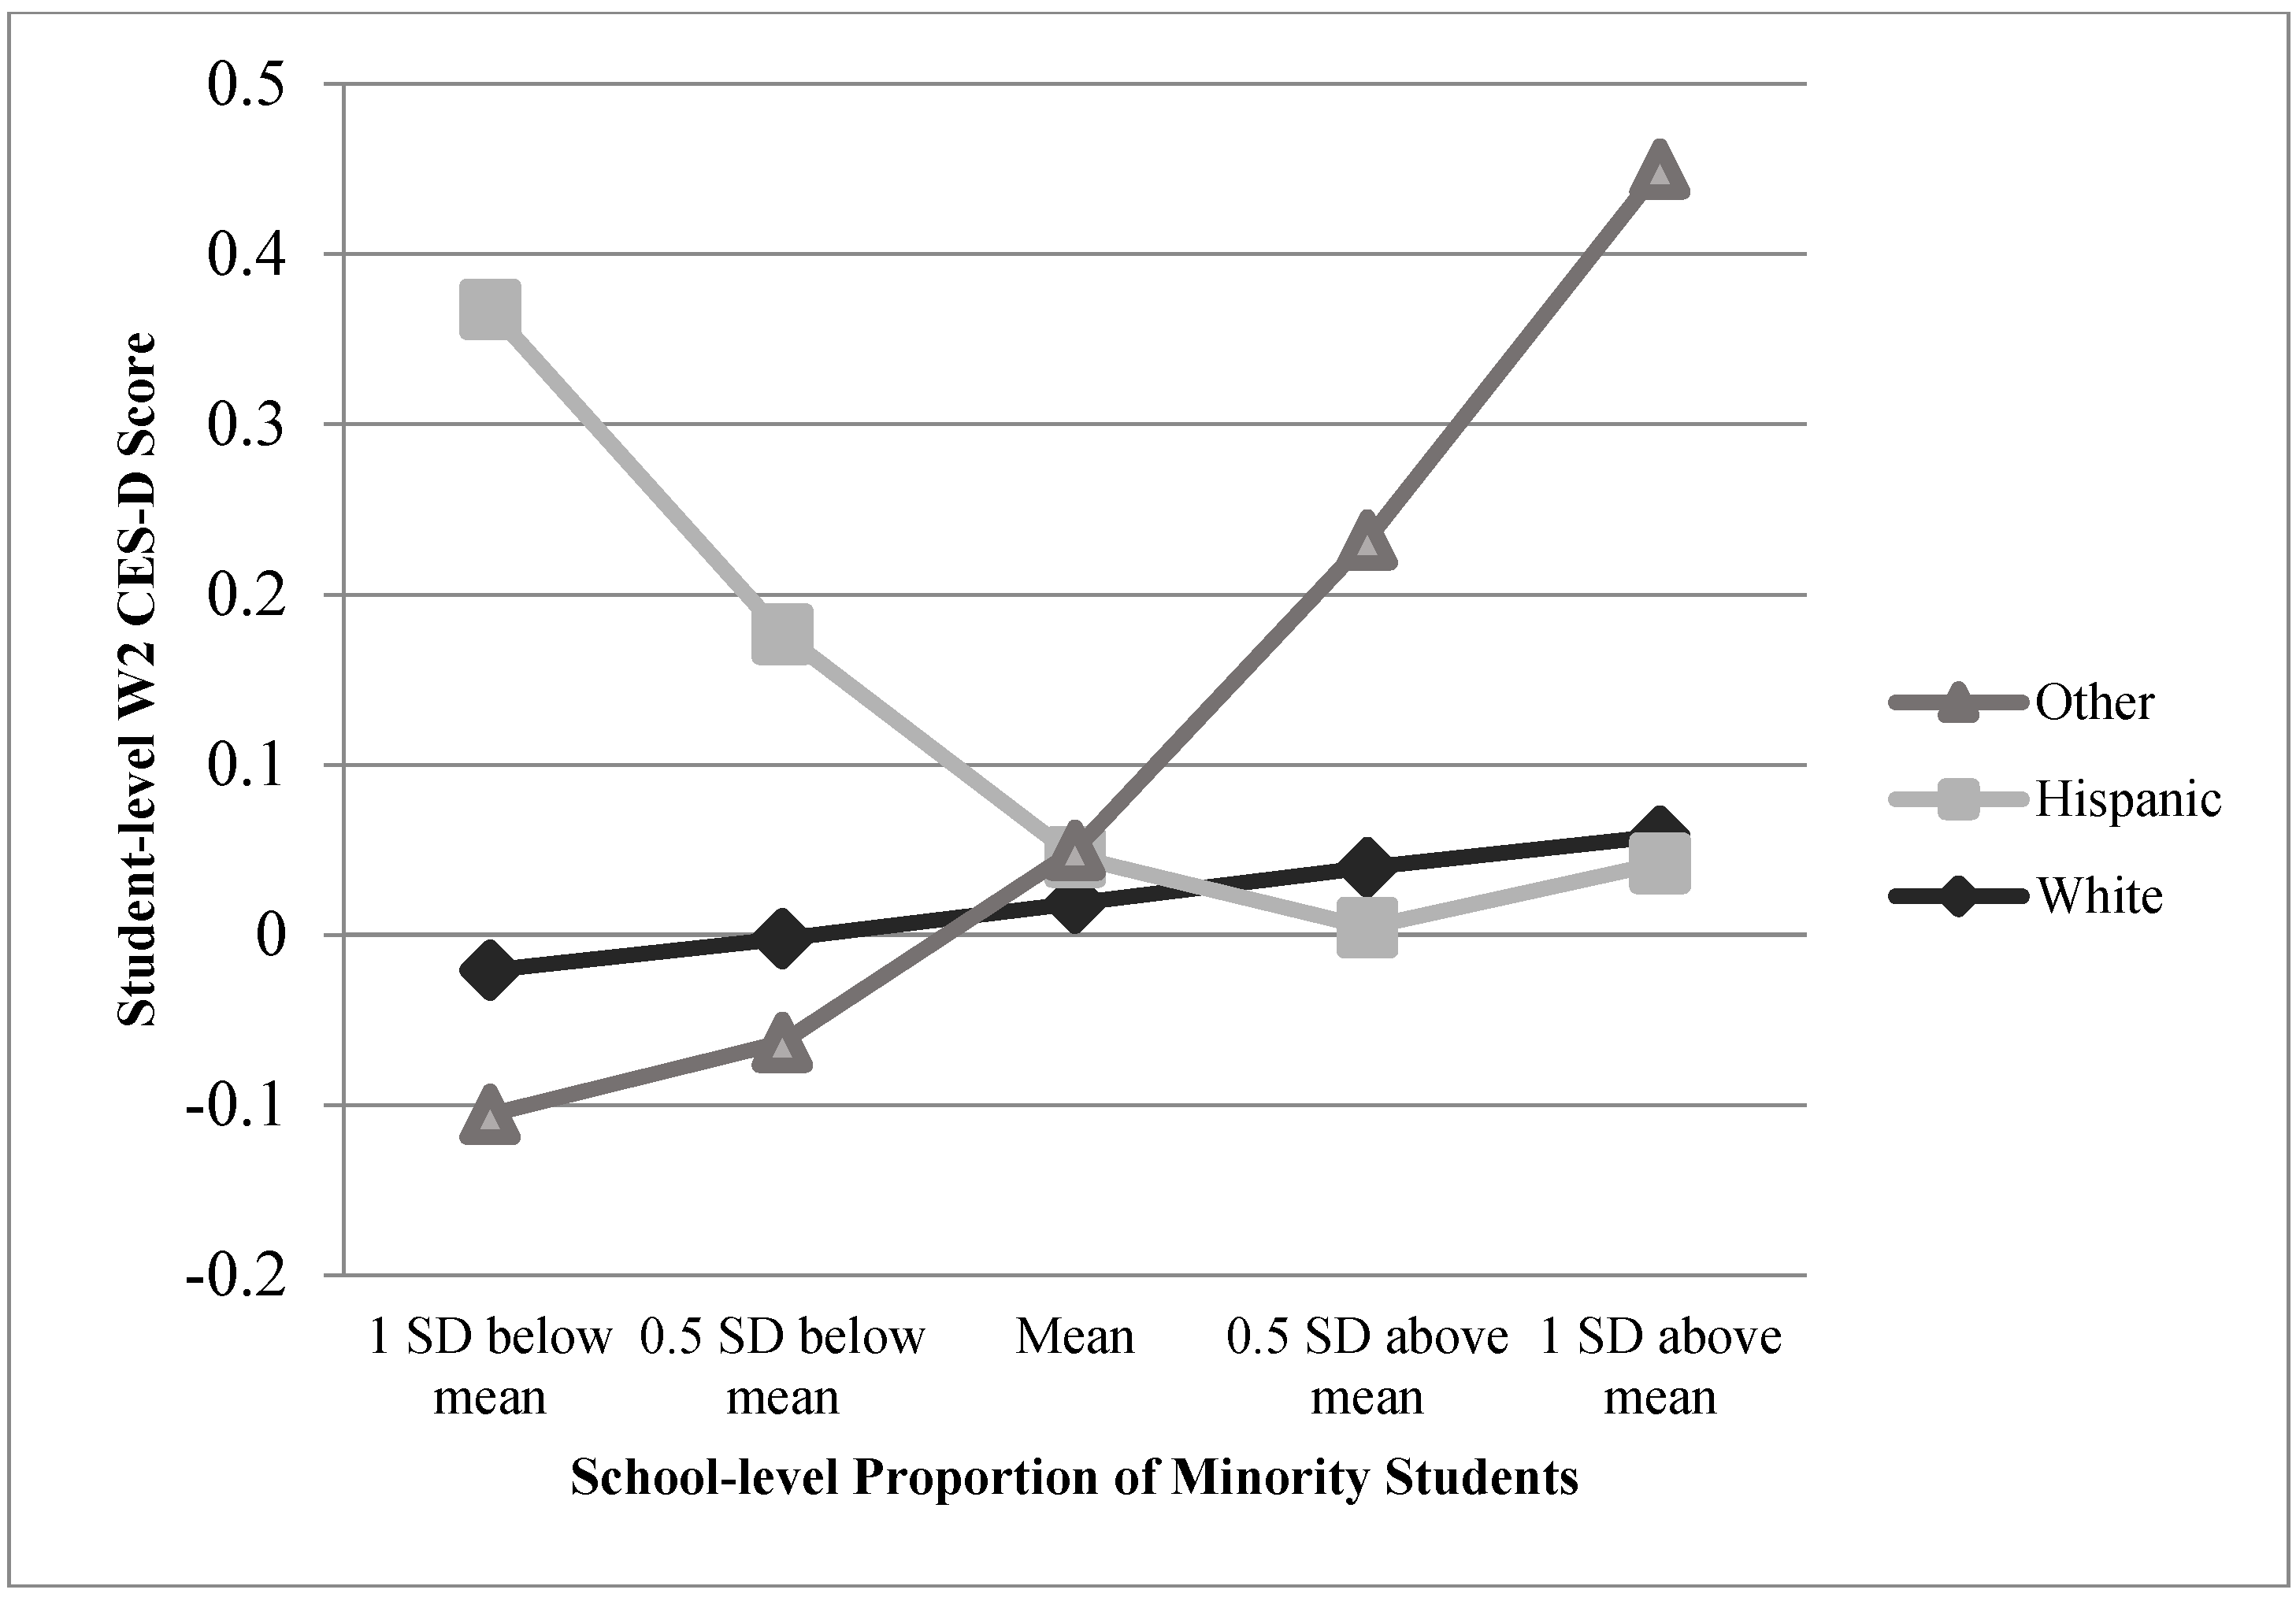
3
School-level proportion of minority students are grand-mean centered when entered into the models. The mean is −0.012, while the standard deviation is 0.176. Therefore, the proportion of minority students of the five schools presented in the figure are, from lowest to highest: −0.344, −0.188, −0.012, 0.164, and 0.319.
4
The five values of school proportion of minority students used in calculation in Figure 5 are the same with those used in Figure 4.
Figure 1. Gender Composition.
Socsci 07 00072 g001
Figure 2. Racial/ethnic Composition.
Socsci 07 00072 g002
Figure 3. (a) W2 CES-D score (z) by Racial/ethnic Group; (b) W1 CES-D score (z) by Racial/ethnic Group; (c) W1 School connectedness score (z) by Racial/ethnic Group; (d) W1 Family support score (z) by Racial/ethnic Group.
Socsci 07 00072 g003
Figure 4. Curvilinear Relationship between School Proportion Minority Students and Student W2 CES-D Score.
Socsci 07 00072 g004
Figure 5. School Proportion of Minority Students and Student W2 CES-D Score.
Socsci 07 00072 g005
Table 1. Descriptive Statistics of Continuous Variables: W2 Depressive Symptoms CES-D Score, W1 Family Support (z), W1 School Connectedness (z), and W1 School-level Predictors in Add Health Survey 1995–1996 (4228 students in 132 schools).
NMeanMinMaxS.D.
Dependent variable
 W2 CES-D score (z)4228−0.02−2.965.070.97
Student-Level Predictors
 W1 Age422814.4711201.52
 W1 CES-D (z)4228−0.06−2.875.700.94
 W1 School connectedness (z)42280.07−3.642.020.97
 W1 Family support (z)42280.01−5.252.660.96
School-Level Predictors
 School mean connectedness (z)1320.02−0.620.760.32
 Prop. of minority1320.39010.33
Table 2. Weighted HLM Coefficients from Regression of W2 CES-D Depressive Symptom Score (z) on W1 Student-level Predictors: Add Health Survey, 1995–1996 (4228 Students in 132 Schools).
Coefficient (s.e.)Model 1Model 2Model 3
Student-level predictors
 W1 CES-D score (z)0.477 *** (0.020)0.465 *** (0.020)0.465 *** (0.020)
 Female0.230 *** (0.029)0.231 *** (0.029)0.232 *** (0.029)
 Age0.020 (0.012)0.017 (0.013)0.016 (0.013)
 W1 Family support (z)−0.061 *** (0.018)−0.048 * (0.019)−0.049 ** (0.019)
 W1 School connectedness (z) −0.056 ** (0.019)−0.054 ** (0.021)
 Race/ethnicity
  WhiteOmittedOmittedOmitted
  Black0.079 * (0.036)0.079 * (0.035)0.078 * (0.036)
  Hispanic0.086 (0.058)0.089 (0.058)0.084 (0.060)
  Asian0.058 (0.064)0.075 (0.063)0.105 (0.064)
  Other0.183 (0.121)0.175 (0.122)0.180 (0.124)
 Intercept−0.024 (0.016)−0.021 (0.016)−0.021 (0.016)
Intra-class interaction term
 W1 School connectedness (z) × Black 0.046 (0.057)
 W1 School connectedness (z) × Hispanic 0.048 (0.060)
 W1 School connectedness (z) × Asian −0.105 (0.077)
 W1 School connectedness (z) × Other 0.056 (0.118)
All predictors grand-mean centered. p < 0.10; * p < 0.05; ** p < 0.01; *** p < 0.001.
Table 3. Weighted HLM coefficients from Regression of CES-D Depressive Symptom Score (z) from Wave 2 on Student-level, School-level Predictors and Cross-level Interaction Terms: Add Health Survey, 4228 Students in 132 Schools, 1995–1996.
Model 4Model 5
Student-level predictors
 W1 CES-D score ( z )   a 0.463 *** (0.019)0.461 *** (0.019)
 Female a0.232 *** (0.029)0.235 *** (0.028)
 Age a0.022 (0.013)0.022 (0.013)
 W1 Family support (z) a−0.048 * (0.019)−0.047 ** (0.019)
 W1 School connectedness (z) a−0.062 *** (0.019)−0.063 *** (0.018)
 Race/ethnicity
  WhiteOmittedOmitted
  Black b0.116 * (0.053)0.045 (0.064)
  Hispanic b0.104 (0.068)0.035 (0.074)
  Asian b0.087 (0.086)0.007 (0.124)
  Other b0.175 (0.127)0.399 (0.226)
School-level predictors
 Intercept0.023 (0.029)0.020 (0.028)
 School mean connectedness a0.094 (0.055)0.096 (0.055)
 Prop. minority a0.115 * (0.055)0.119 * (0.054)
 Prop. minority squared a−0.359 (0.215)−0.328 (0.210)
Cross-level interaction terms
 Black × Prop. minority 0.087 (0.281)
 Black × Prop. minority squared 0.709 (0.752)
 Hispanic × Prop. minority −0.693 (0.415)
 Hispanic × Prop. minority squared 1.774 (1.052)
 Asian × Prop. minority 0.256 (0.466)
 Asian × Prop. minority squared 0.470 (1.272)
 Other × Prop. minority 1.202 * (0.541)
 Other × Prop. minority squared −3.592 (0.057)
a Predictor is grand-mean centered; b Predictor is school-mean centered; p < 0.10; * p < 0.05; ** p < 0.01; *** p < 0.001.

