1. Introduction
Energy is essential to the well-being and functioning of a related system. For modern society, energy drives the day-to-day activities of people, societies, and economies. The role of energy is more than just to provide basic services, but also to facilitate functionality. Since energy plays a significant part across all sectors of activity, it involves a wide range of actors of all levels and permeates through time; threats to energy would affect everything within this context [
1]. Energy security has emerged as policy concerns and as a concept since the era of modern energy systems and hydrocarbon [
2]. Decision-makers implement policies to ensure the security of nations and economies presumably threatened by energy vulnerabilities while analysts and scholars pursue the elaboration of energy security studies.
Despite the importance and widely referenced terminology, there is no consensus on the concept of energy security. Energy security as a concept has raised controversies over its definition, scope, and approaches. Developed countries may refer to energy security as “a resilient energy system with uninterrupted availability of energy sources at an affordable price” [
3,
4,
5,
6], whereas developing countries simply define energy security as the access to modern energy services [
7]. From an energy commodity perspective, energy-importing countries consider energy import dependency and vulnerability significant whereas energy-exporting countries prioritize the security of demand [
8]. Its high context-dependence does not only affect the perception towards energy security, but also the extent to which the energy sector of a country can be considered secured and how it should be measured [
9,
10,
11]. While previous studies that quantitatively measure energy security using indexes and indicators have addressed the multi-dimensionality and context-dependence of the concept [
12,
13,
14,
15,
16,
17], they merely discuss how different energy contexts affect the assessment. Some scholars have emphasized the significance of the balance between generalized and context-specific indicators [
18]. Nevertheless, the question remains to what extent the assessment is general enough to allow comparison among countries or specific enough to capture a country-specific context and its concerns.
Since the concept of security is highly perceptual and contextual, in this paper, energy security is defined as the security of the national energy sector, specifically referring to an adequate and stable amount of energy supply to meet demand and function within the economy of a country. To cover energy-exporting countries, this study also considers the security of energy demand from overseas. In existing literature, the security of energy supply is commonly associated with keywords that suggest the secure continuity of supply to an energy system, e.g., a supply that is adequate, reliable, uninterrupted, stable, sufficient [
19,
20,
21,
22], and, for a socio-economic dimension, the affordability or reasonability of energy prices [
23,
24,
25]. Using a broad definition makes it possible to cut through the complexity caused by different interpretations of energy security. In addition, this generic framework allows comparative discussions across countries with different energy contexts.
The purpose of this study is not to debate over the conceptualization of energy security or to offer a novel method of measuring it. It does, however, aim to examine energy contexts among countries by quantitatively assessing the energy security situation of a group of countries at the national level in order to identify different energy security contexts that are reflected through the indicators. Induced country-specific energy security contexts from the assessment are aimed to illustrate primary issues of concern based on actual energy security situations, not just perceived security. To achieve that, nine countries of the Association of Southeast Asian Nations (ASEAN) were selected as case study, due mainly to the diversity of energy contexts within the cluster and the lack of available studies. In spite of numerous regional cooperative frameworks on energy, e.g., ASEAN Power Grid, Trans-ASEAN Gas Pipeline, Coal and Clean Coal Technology, Renewable Energy, Energy Efficiency and Conservation, Regional Energy Policy and Planning, and Civilian Nuclear Energy [
26,
27], there has been a small number of studies that assess how each country performs in terms of energy security or addresses the diversity in energy contexts among the member countries [
28,
29,
30].
In order to identify country-specific energy contexts of nine ASEAN member countries, this study uses a selected set of indicators to assess their energy security performances at the national level. The findings aim to provide an overall country-specific evaluation of the energy security performances of ASEAN countries and their primary issues of concern, which could serve as a stepping-stone for further study on regional cooperation for energy security. The paper is composed of four main sections. Following this introduction,
Section 2 describes the methodology and indicators used to assess energy security.
Section 3 presents empirical results, and
Section 4 discusses energy security contexts of ASEAN member countries and policy implications based on the assessment.
2. Methods
Using an indicator-based assessment, this study quantitatively measures the energy security of nine ASEAN member nations: Brunei Darussalam (hereafter referred to as Brunei), Cambodia, Indonesia, Malaysia, Myanmar, the Philippines, Singapore, Thailand, and Vietnam. Laos has been excluded due to energy data inaccessibility. The study examines whether and how the performance of energy security of each ASEAN member nation has evolved over the past 12 years and how different energy security contexts can be identified and reflected through selected indicators.
Indicators of energy security were determined based on energy demand and supply security and socio-economic dimensions. However, the study put an emphasis on the security of energy supply, and the physical availability of energy sources, which is the central dimension of energy security [
12], as well as energy security from the perspective of energy-exporting countries. Energy supply insecurity ranges from overreliance on external energy resources to insufficiently diversified energy sources, while the socio-economic dimension highlights energy efficiency from a macroeconomic perspective. An indicator-based assessment allows a wide range of issues to be tackled since the selected indicators are not explicitly linked, and is thus able to identify wider vulnerability issues. Nevertheless, to sufficiently cover multifaceted aspects of energy security, it requires a large number of individual indicators. Thus, the assessment was conducted using 42 individual indicators (as shown in
Table 1), most of which were adapted from existing energy security studies [
31,
32,
33].
Table 1.
List of selected energy security indicators.
Table 1.
List of selected energy security indicators.
| No. | Indicators | C1 | C2 | C3 | C4 | C5 |
|---|
| 1 | Primary energy mix | √ | | | | |
| 2 | Electricity generation by source | √ | | | | |
| 3 | Sectoral energy consumption | √ | | | | |
| 4 | Access to electricity | | √ | | | |
| 5 | Total primary energy supply per capita | | √ | | | |
| 6 | Final energy consumption per capita | | √ | | | |
| 7 | Electricity consumption per capita | | √ | | | |
| 8 | Primary energy intensity | | √ | | | |
| 9 | Energy consumption intensity | | √ | | | |
| 10 | Electricity intensity | | √ | | | |
| 11 | Energy self-sufficiency | | | √ | | |
| 12 | Coal self-sufficiency | | | √ | | |
| 13 | Crude oil self-sufficiency | | | √ | | |
| 14 | Natural gas self-sufficiency | | | √ | | |
| 15 | Coal R/P ratio | | | √ | | |
| 16 | Crude oil R/P ratio | | | √ | | |
| 17 | Natural gas R/P ratio | | | √ | | |
| 18 | Refining capacity | | | √ | | |
| 19 | Energy trade per GDP | | | | √ | |
| 20 | Coal export-to-production ratio | | | | √ | |
| 21 | Crude oil export-to-production ratio | | | | √ | |
| 22 | Natural gas export-to-production ratio | | | | √ | |
| 23 | Energy import dependency | | | | √ | |
| 24 | Coal import dependency | | | | √ | |
| 25 | Crude oil import dependency | | | | √ | |
| 26 | Natural gas import dependency | | | | √ | |
| 27 | Reliance on Middle East crude oil imports | | | | √ | |
| 28 | Reliance on Middle East natural gas imports | | | | √ | |
| 29 | Reliance on Middle East refined oil imports | | | | √ | |
| 30 | Intra-regional coal import dependency | | | | √ | |
| 31 | Intra-regional crude oil import dependency | | | | √ | |
| 32 | Intra-regional natural gas import dependency | | | | √ | |
| 33 | Intra-regional refined oil import dependency | | | | √ | |
| 34 | SWI: PES diversification | | | | | √ |
| 35 | HHI: Coal export destination diversification | | | | | √ |
| 36 | HHI: Crude oil export destination diversification | | | | | √ |
| 37 | HHI: Natural gas export destination diversification | | | | | √ |
| 38 | HHI: Refined oil export destination diversification | | | | | √ |
| 39 | HHI: Coal import source diversification | | | | | √ |
| 40 | HHI: Crude oil import source diversification | | | | | √ |
| 41 | HHI: Natural gas import source diversification | | | | | √ |
| 42 | HHI: Refined oil import source diversification | | | | | √ |
2.1. Selecting Energy Security Indicators
In addition to thematic relevance, indicator selection was based on the “SMART” criteria (specific, measurable, achievable, realistic, and time-based) [
34]. In short, indicators should represent specific attributes and be quantitatively measurable and comparable across countries and temporal conditions. They must also be achievable, realistic, and timely. Selected indicators were categorized into five components: (1) overall energy balance; (2) socio-economic aspect; (3) security of domestic resources; (4) vulnerability to overseas resources and external demands; and (5) diversification of energy supply and trade partners. Selected indicators are quite specific in terms of energy products, which include primary energy (coal, crude oil, and natural gas) and refined oil (for certain indicators), but the indicators are rather open to including different roles of energy actors (importer, producer, or exporter). Using generic indicators allows us to identify country-specific energy security contexts, which are not only useful for national-level analysis but also the discussion on a regional level.
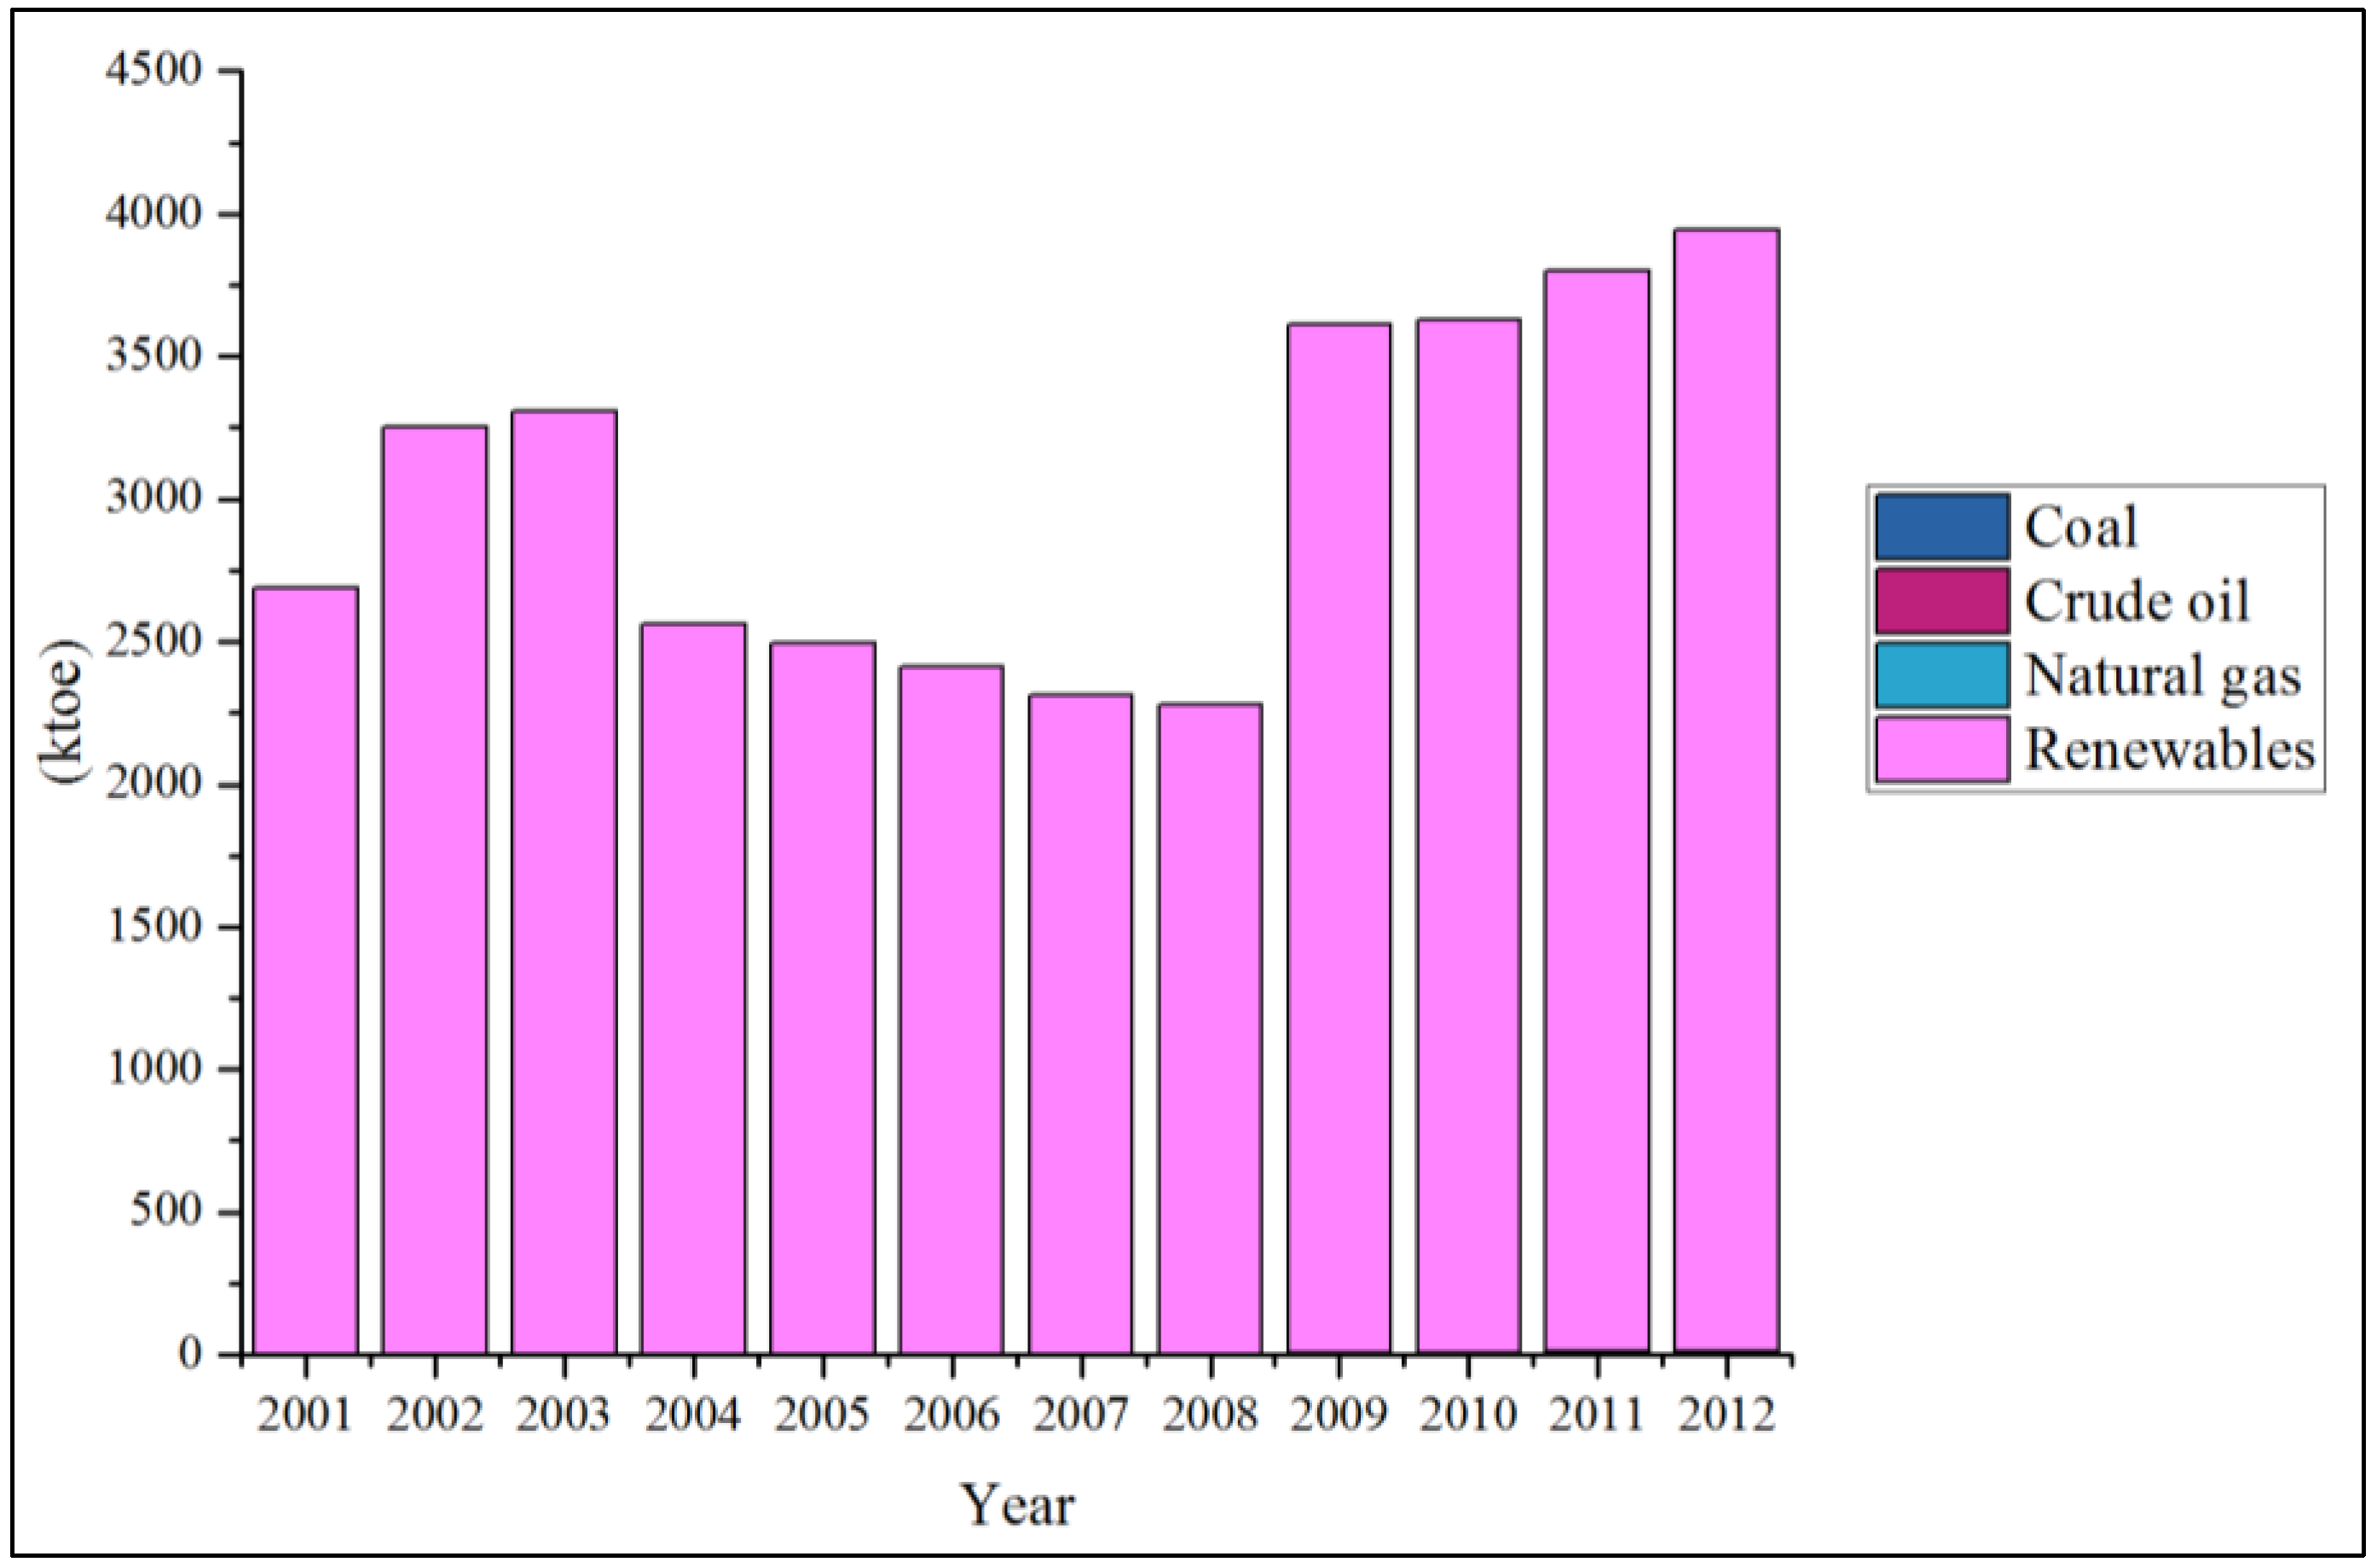
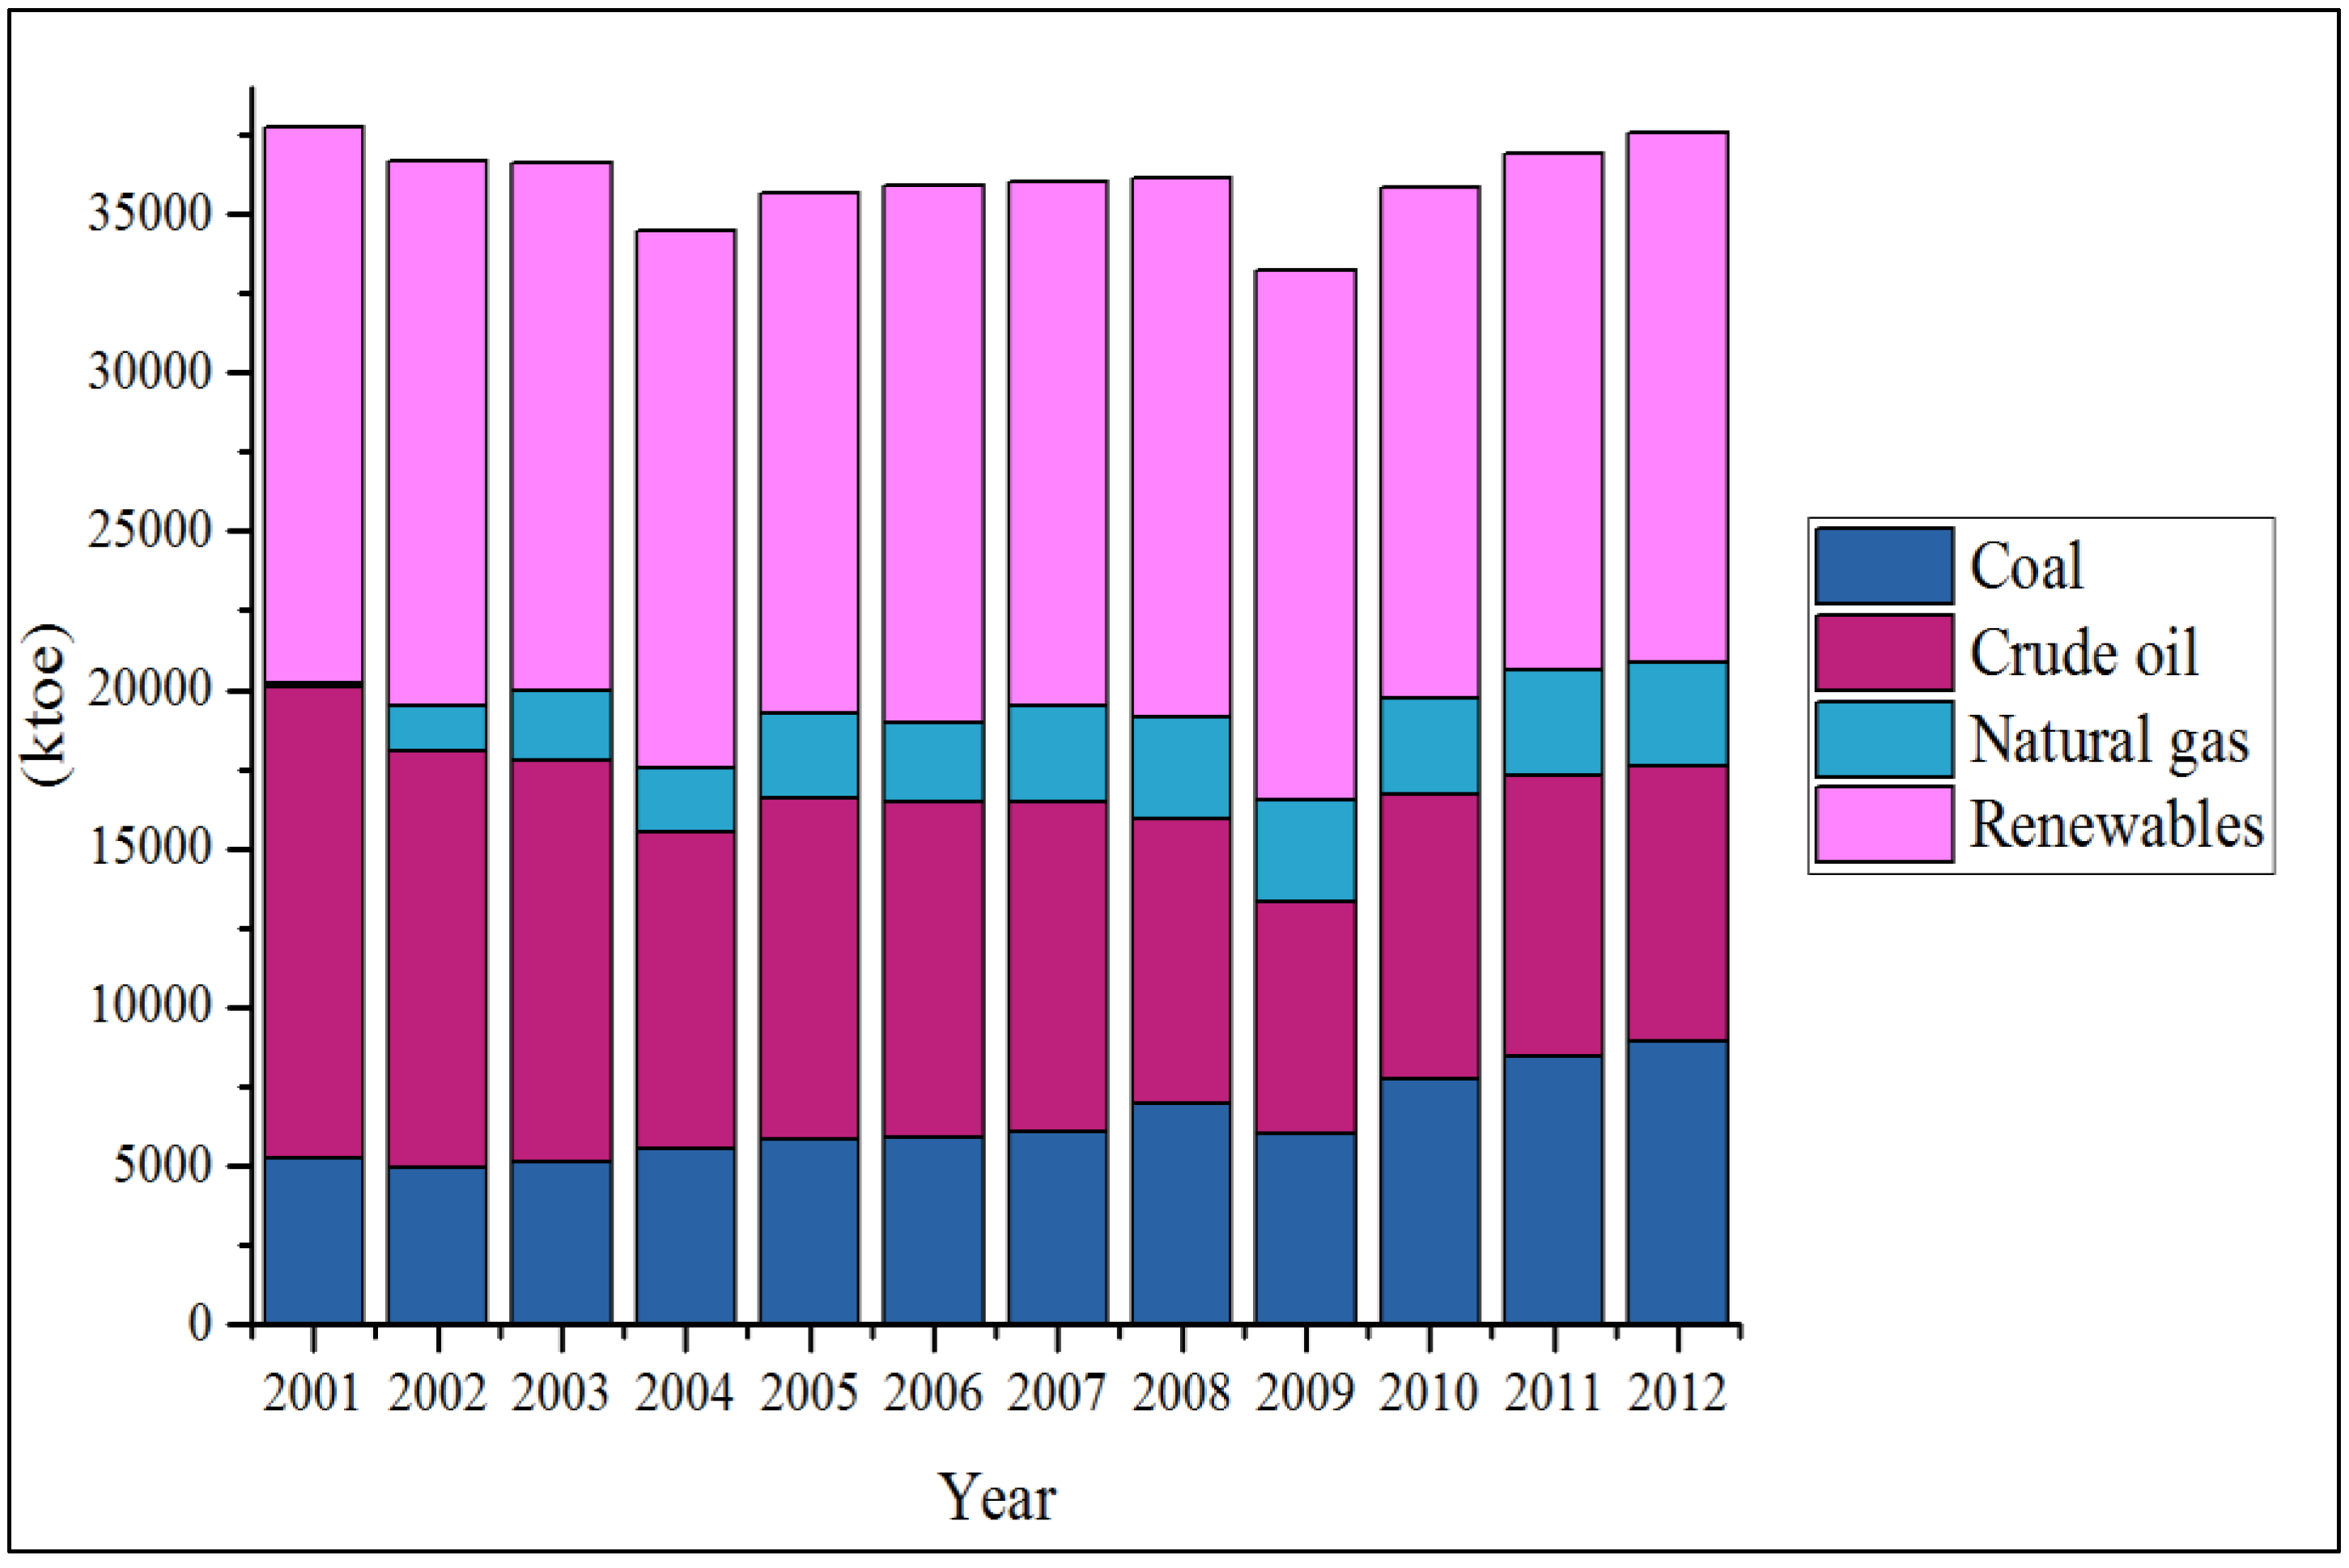
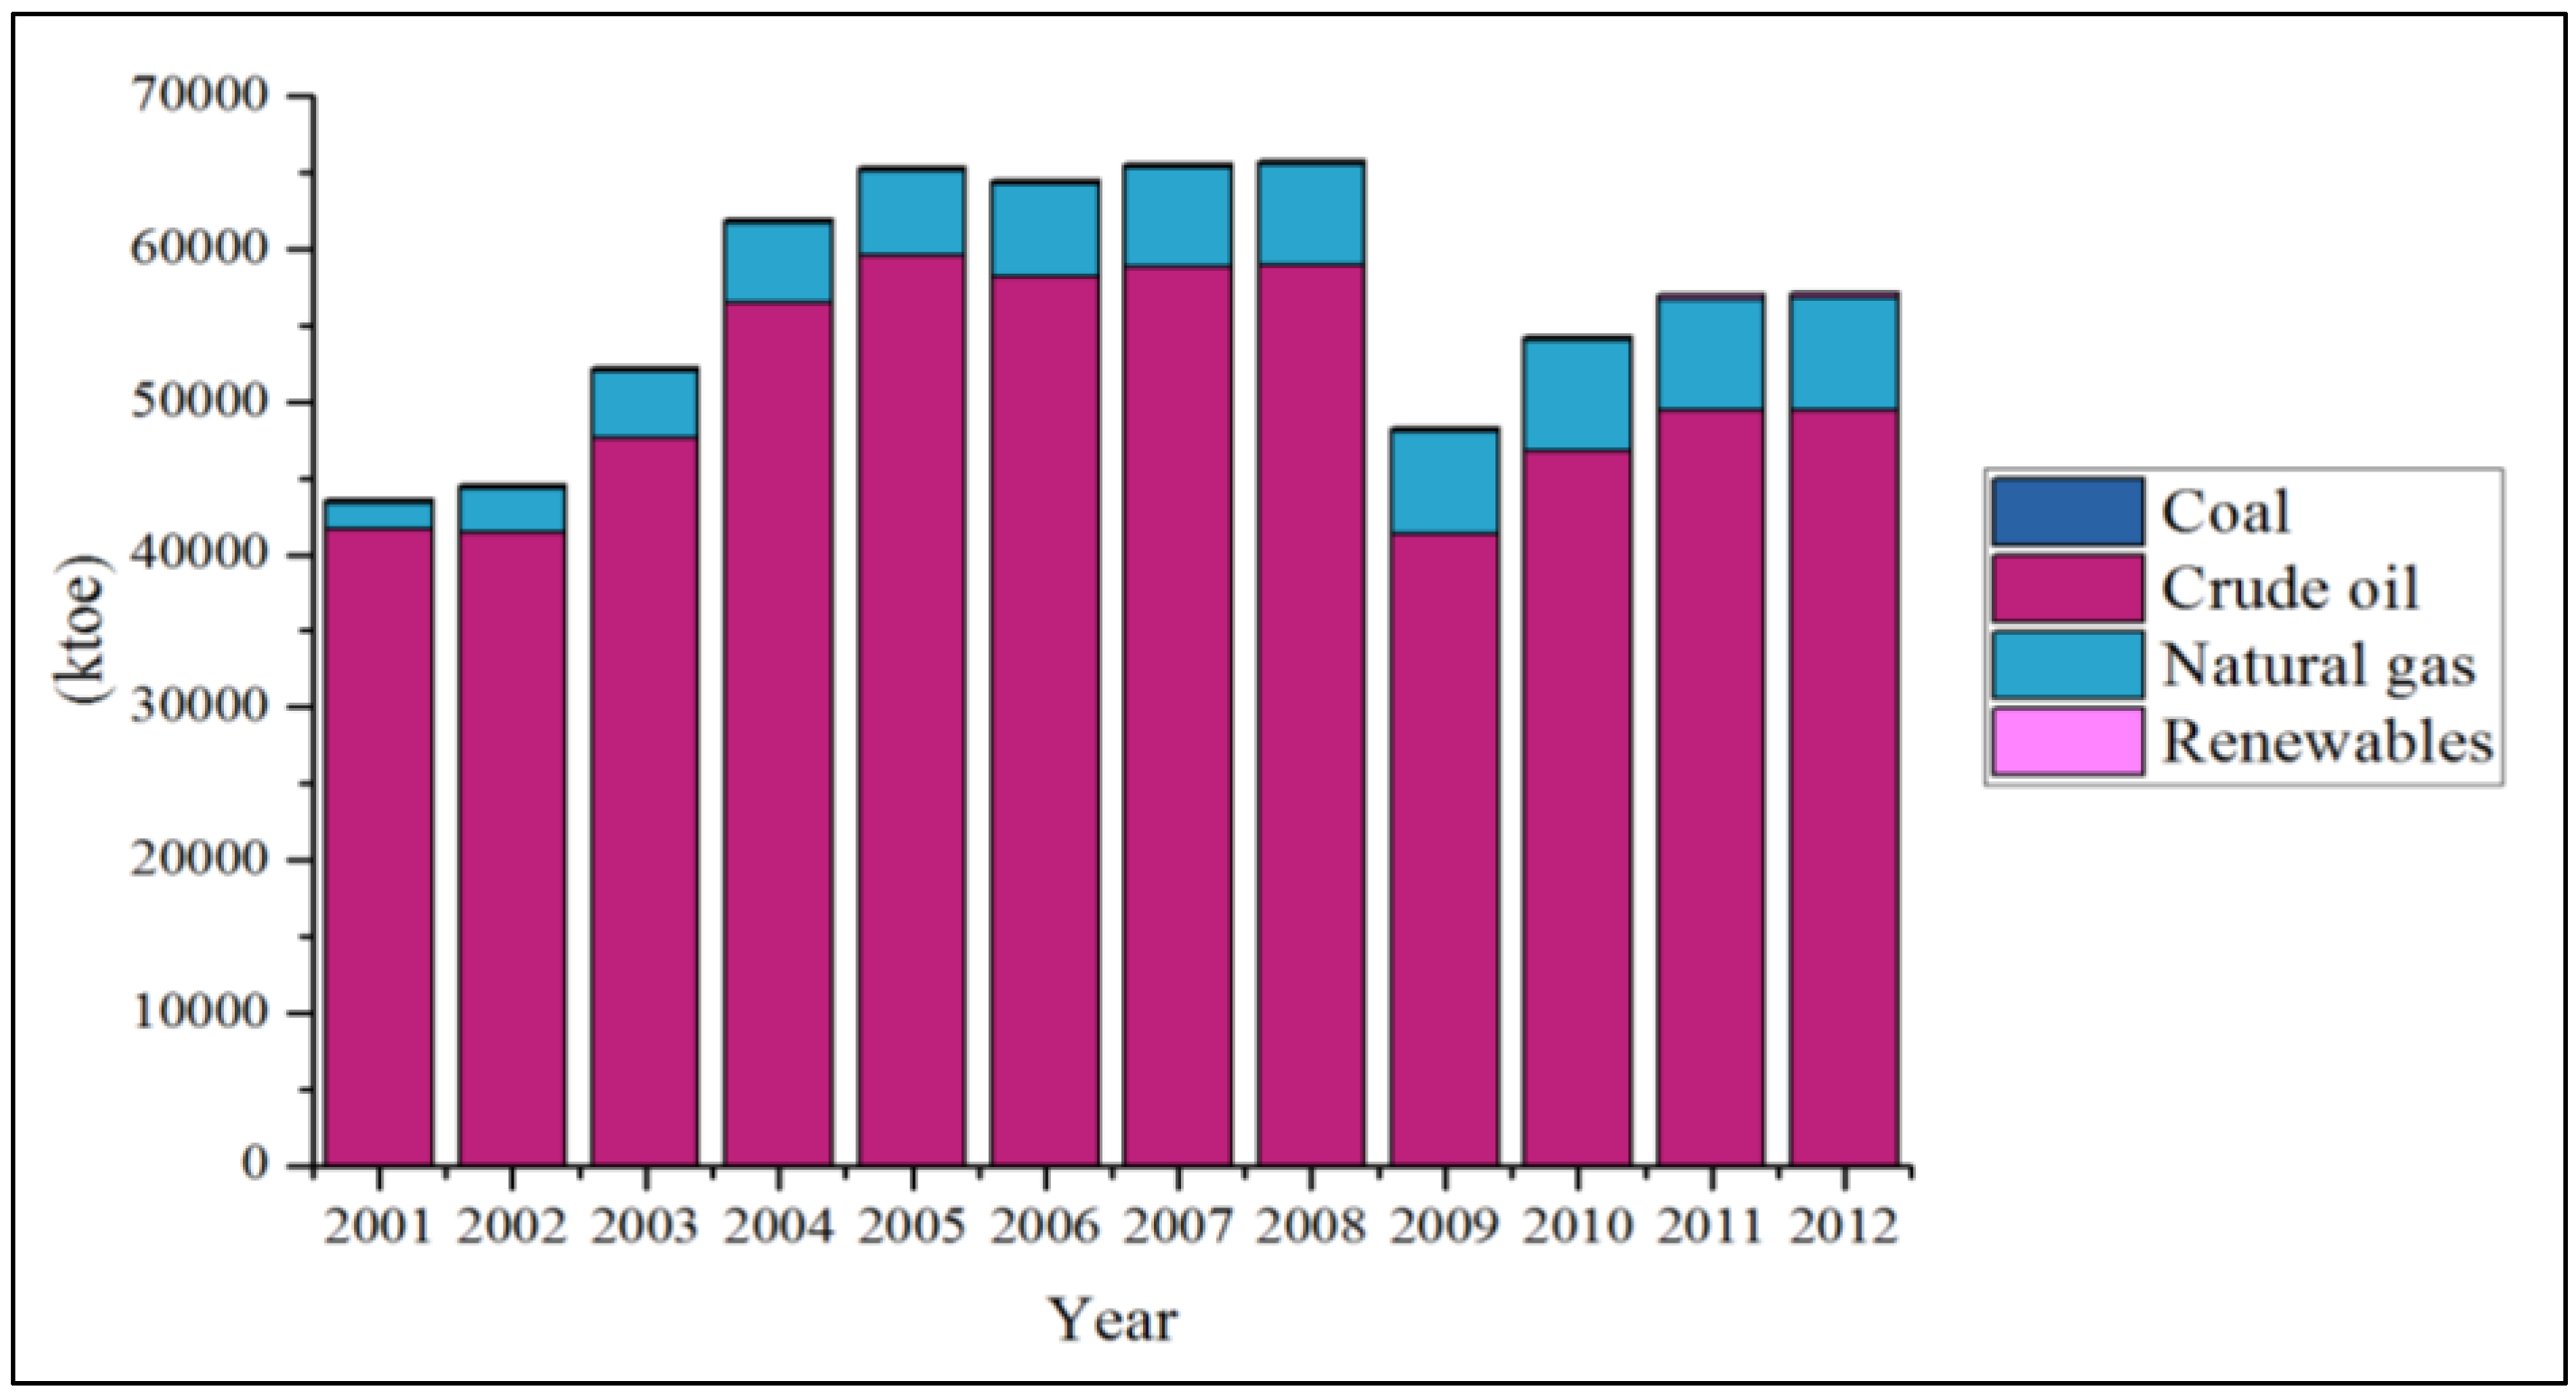
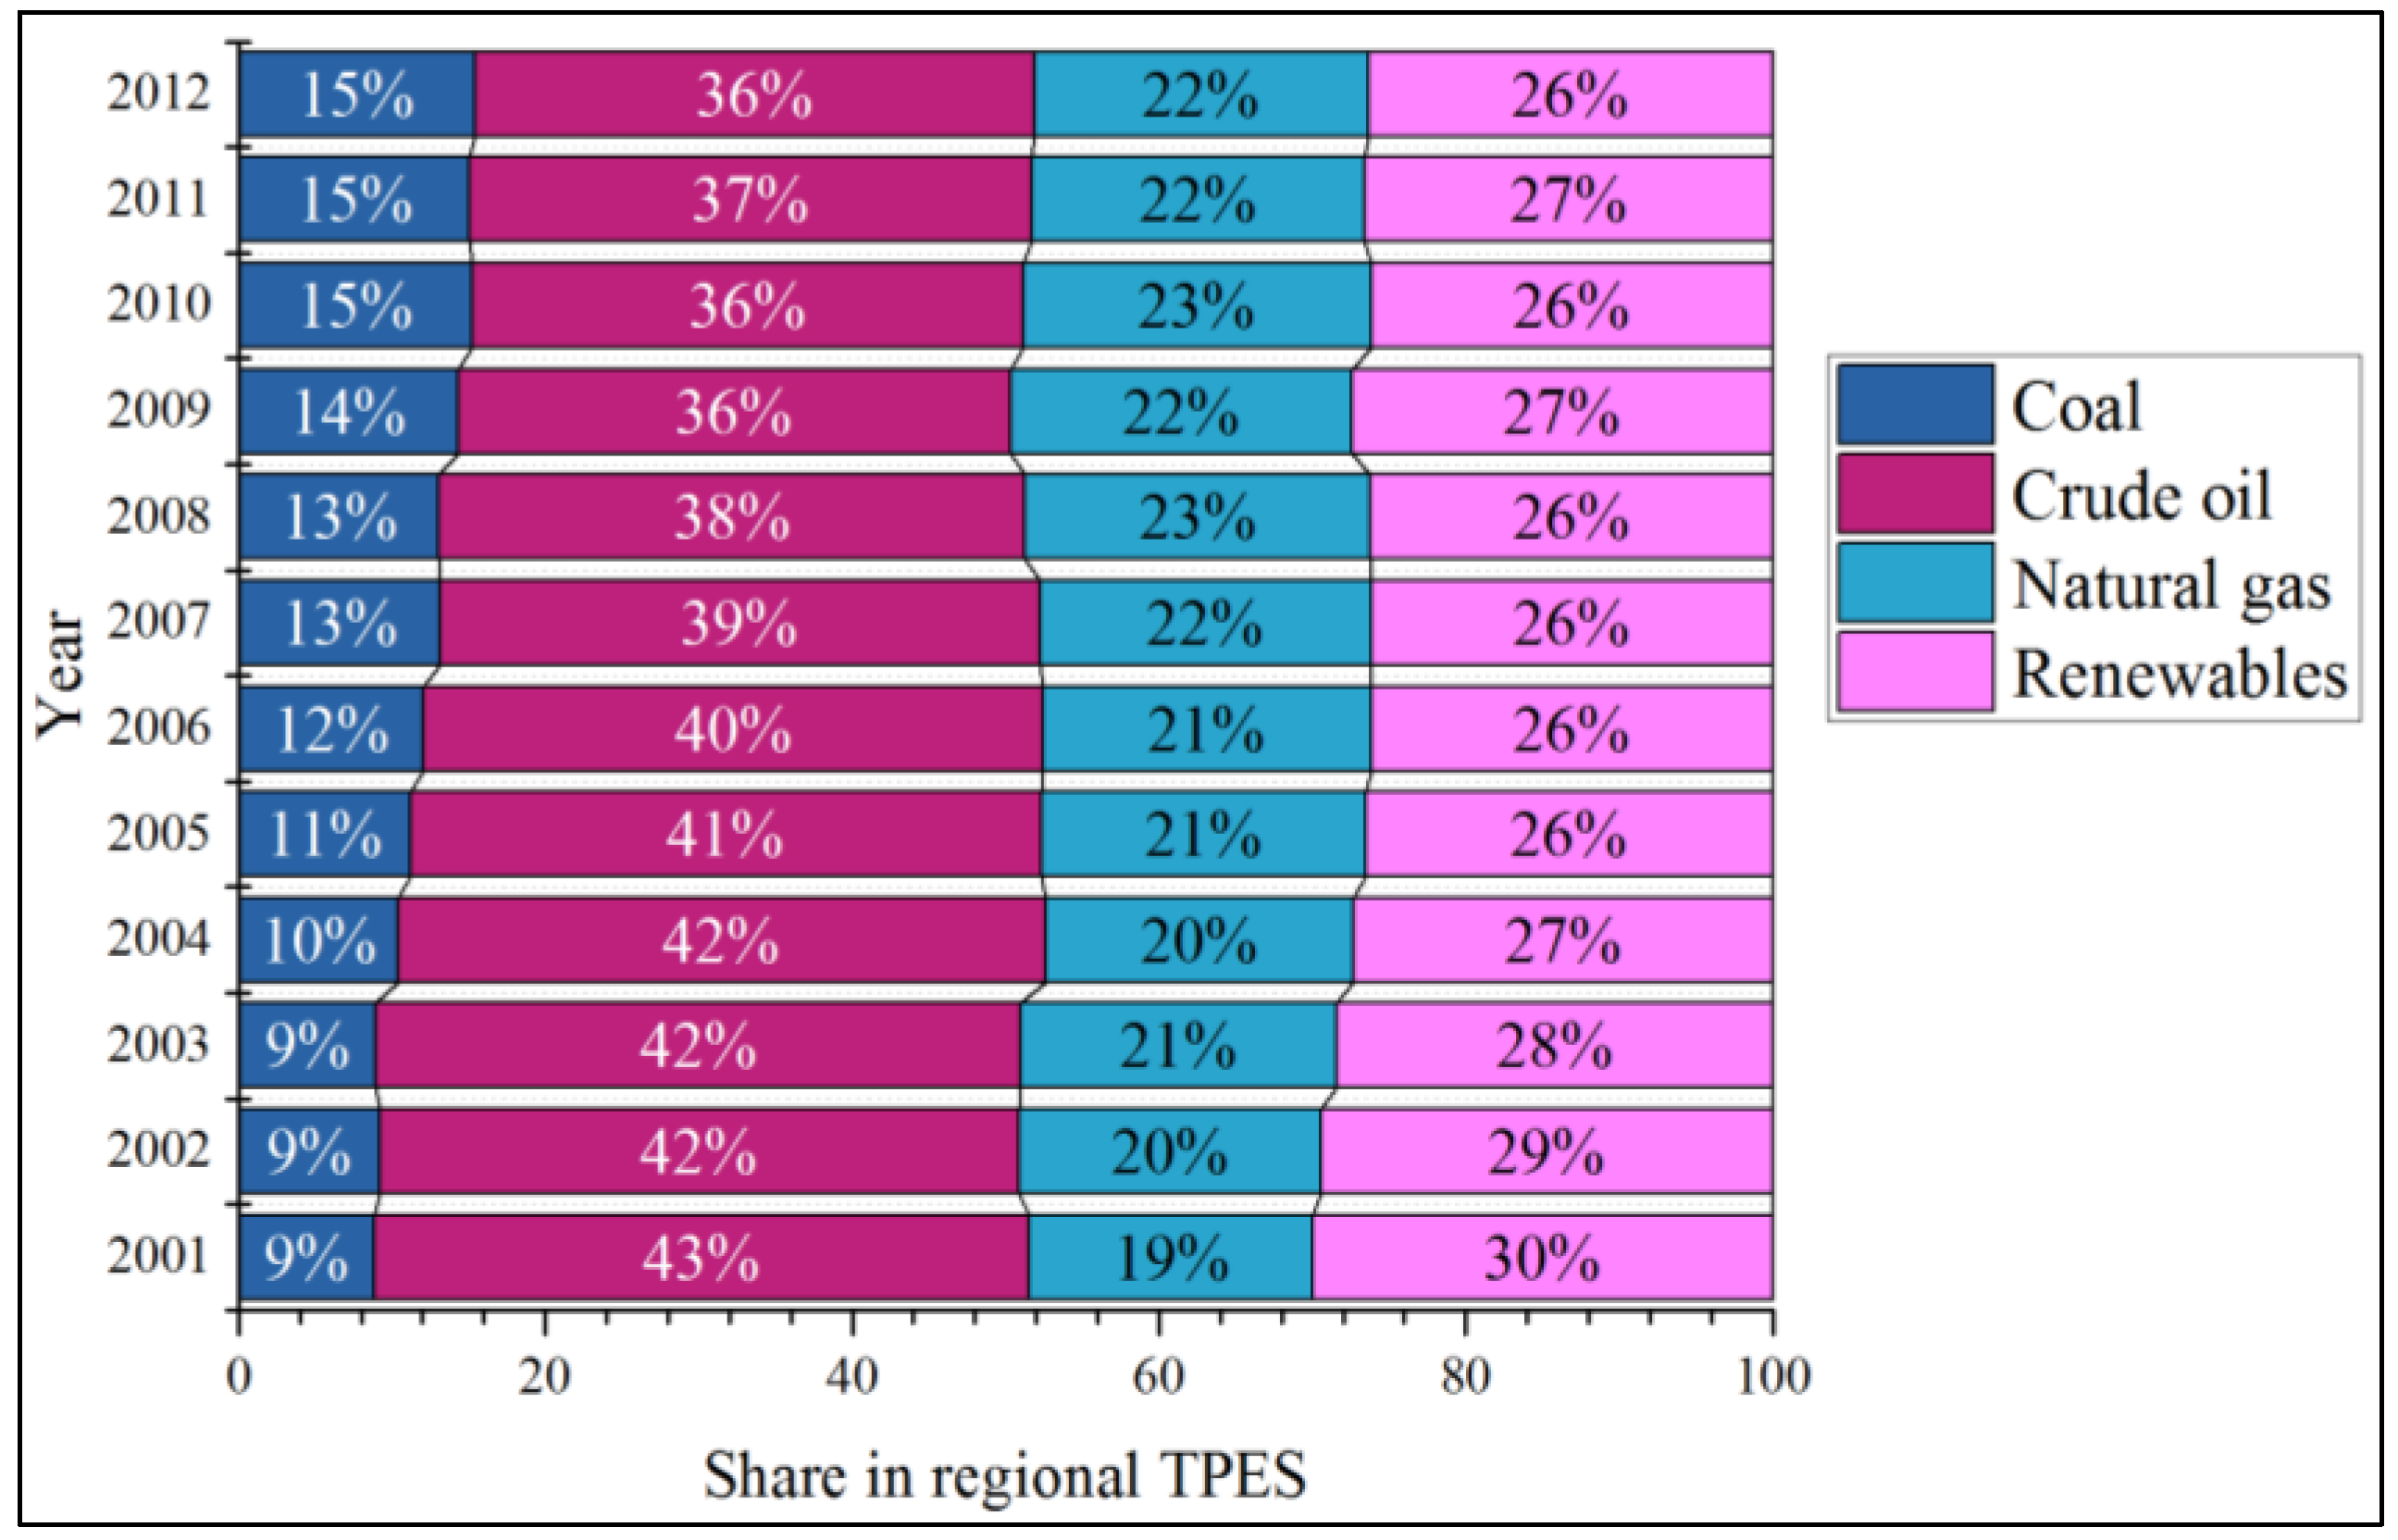
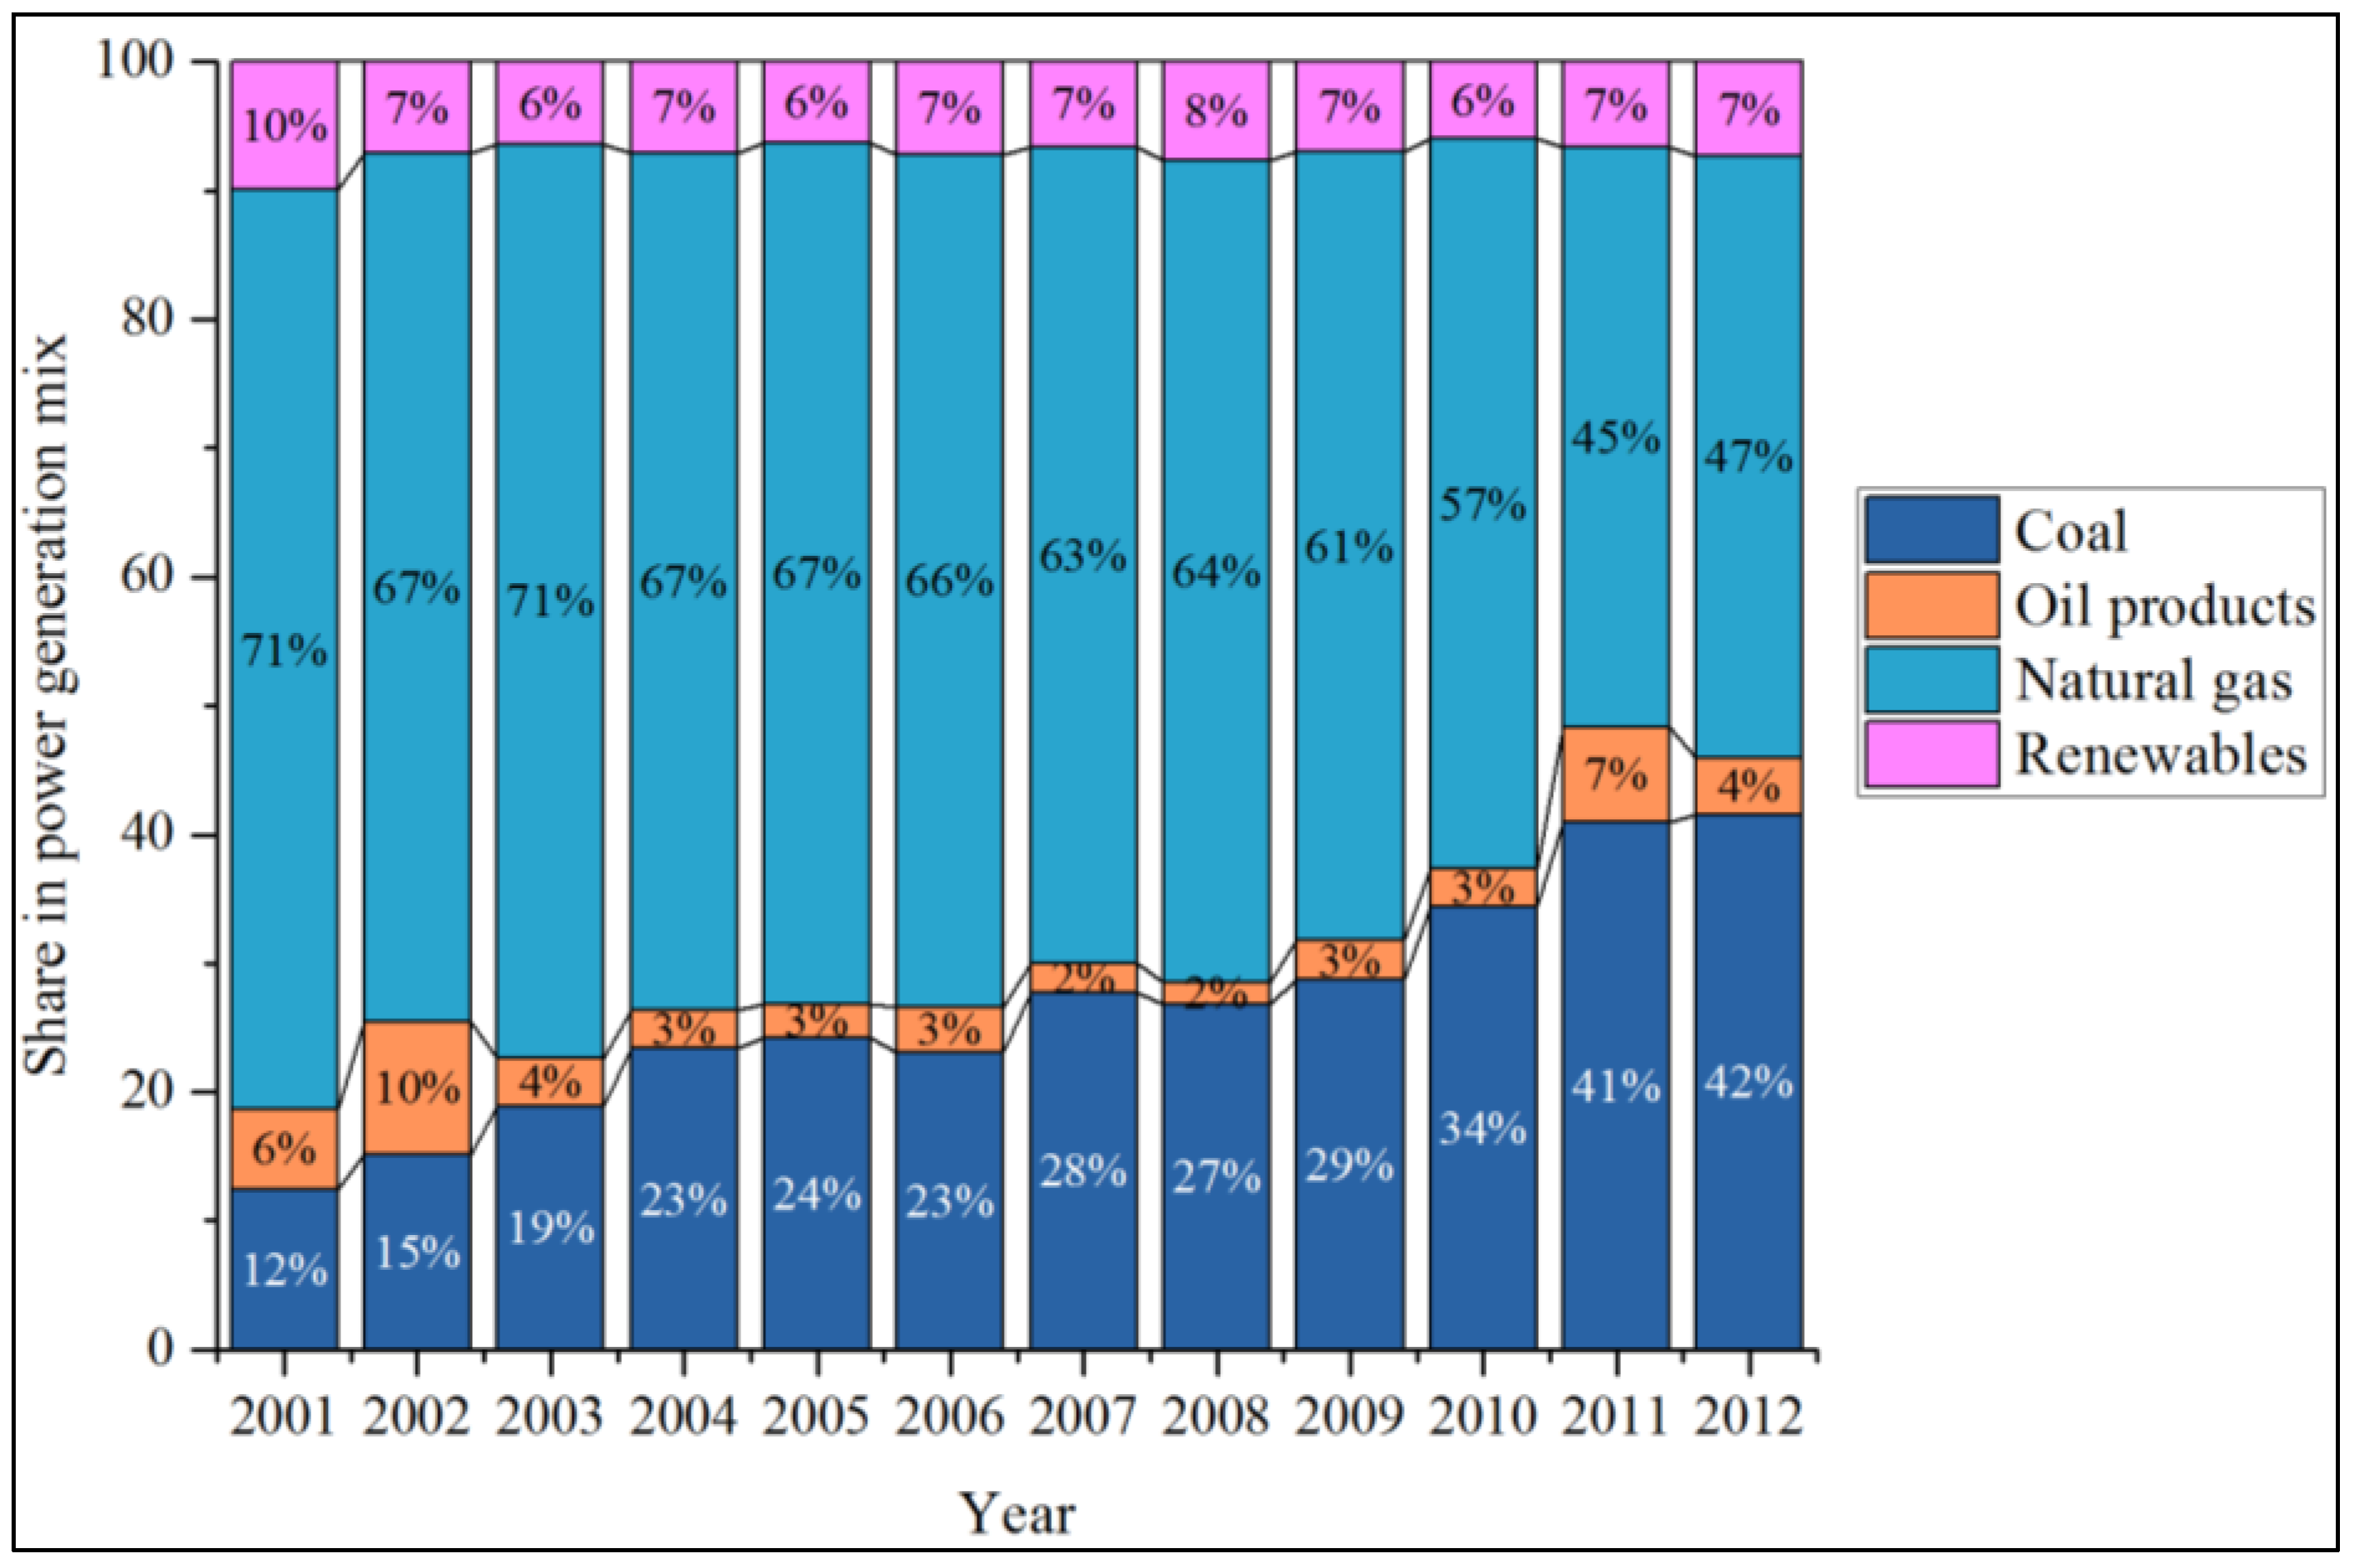
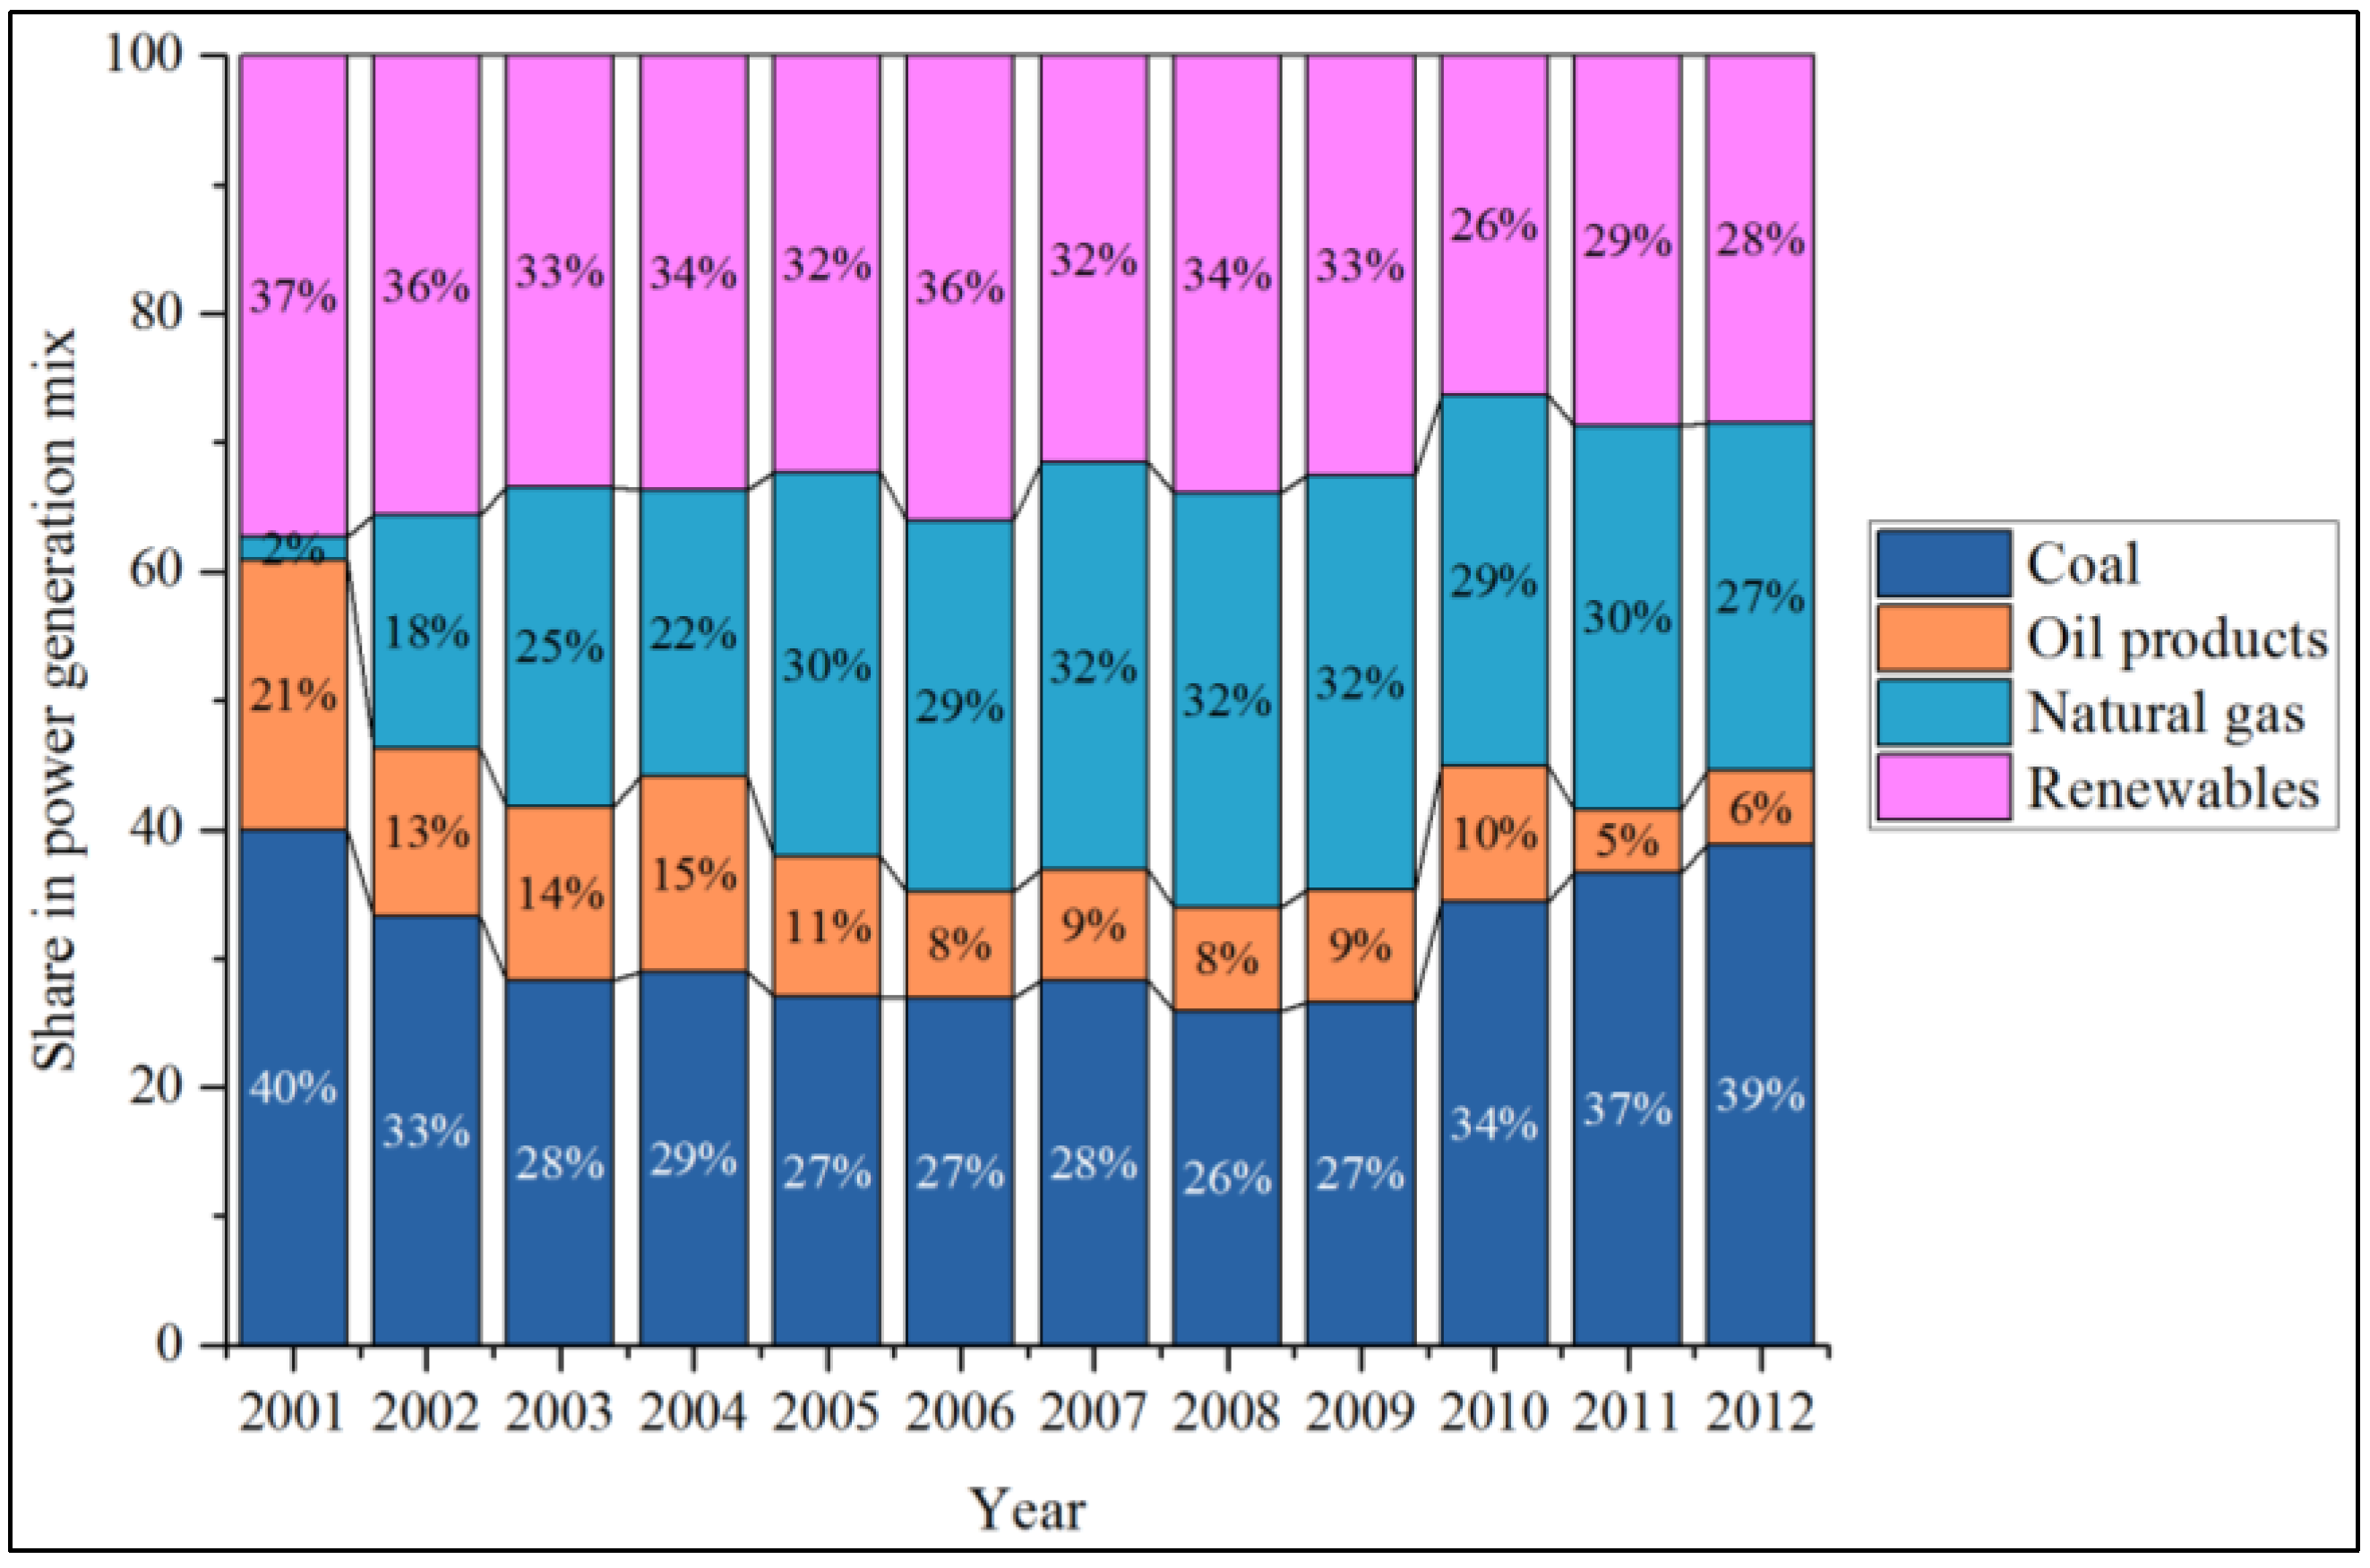
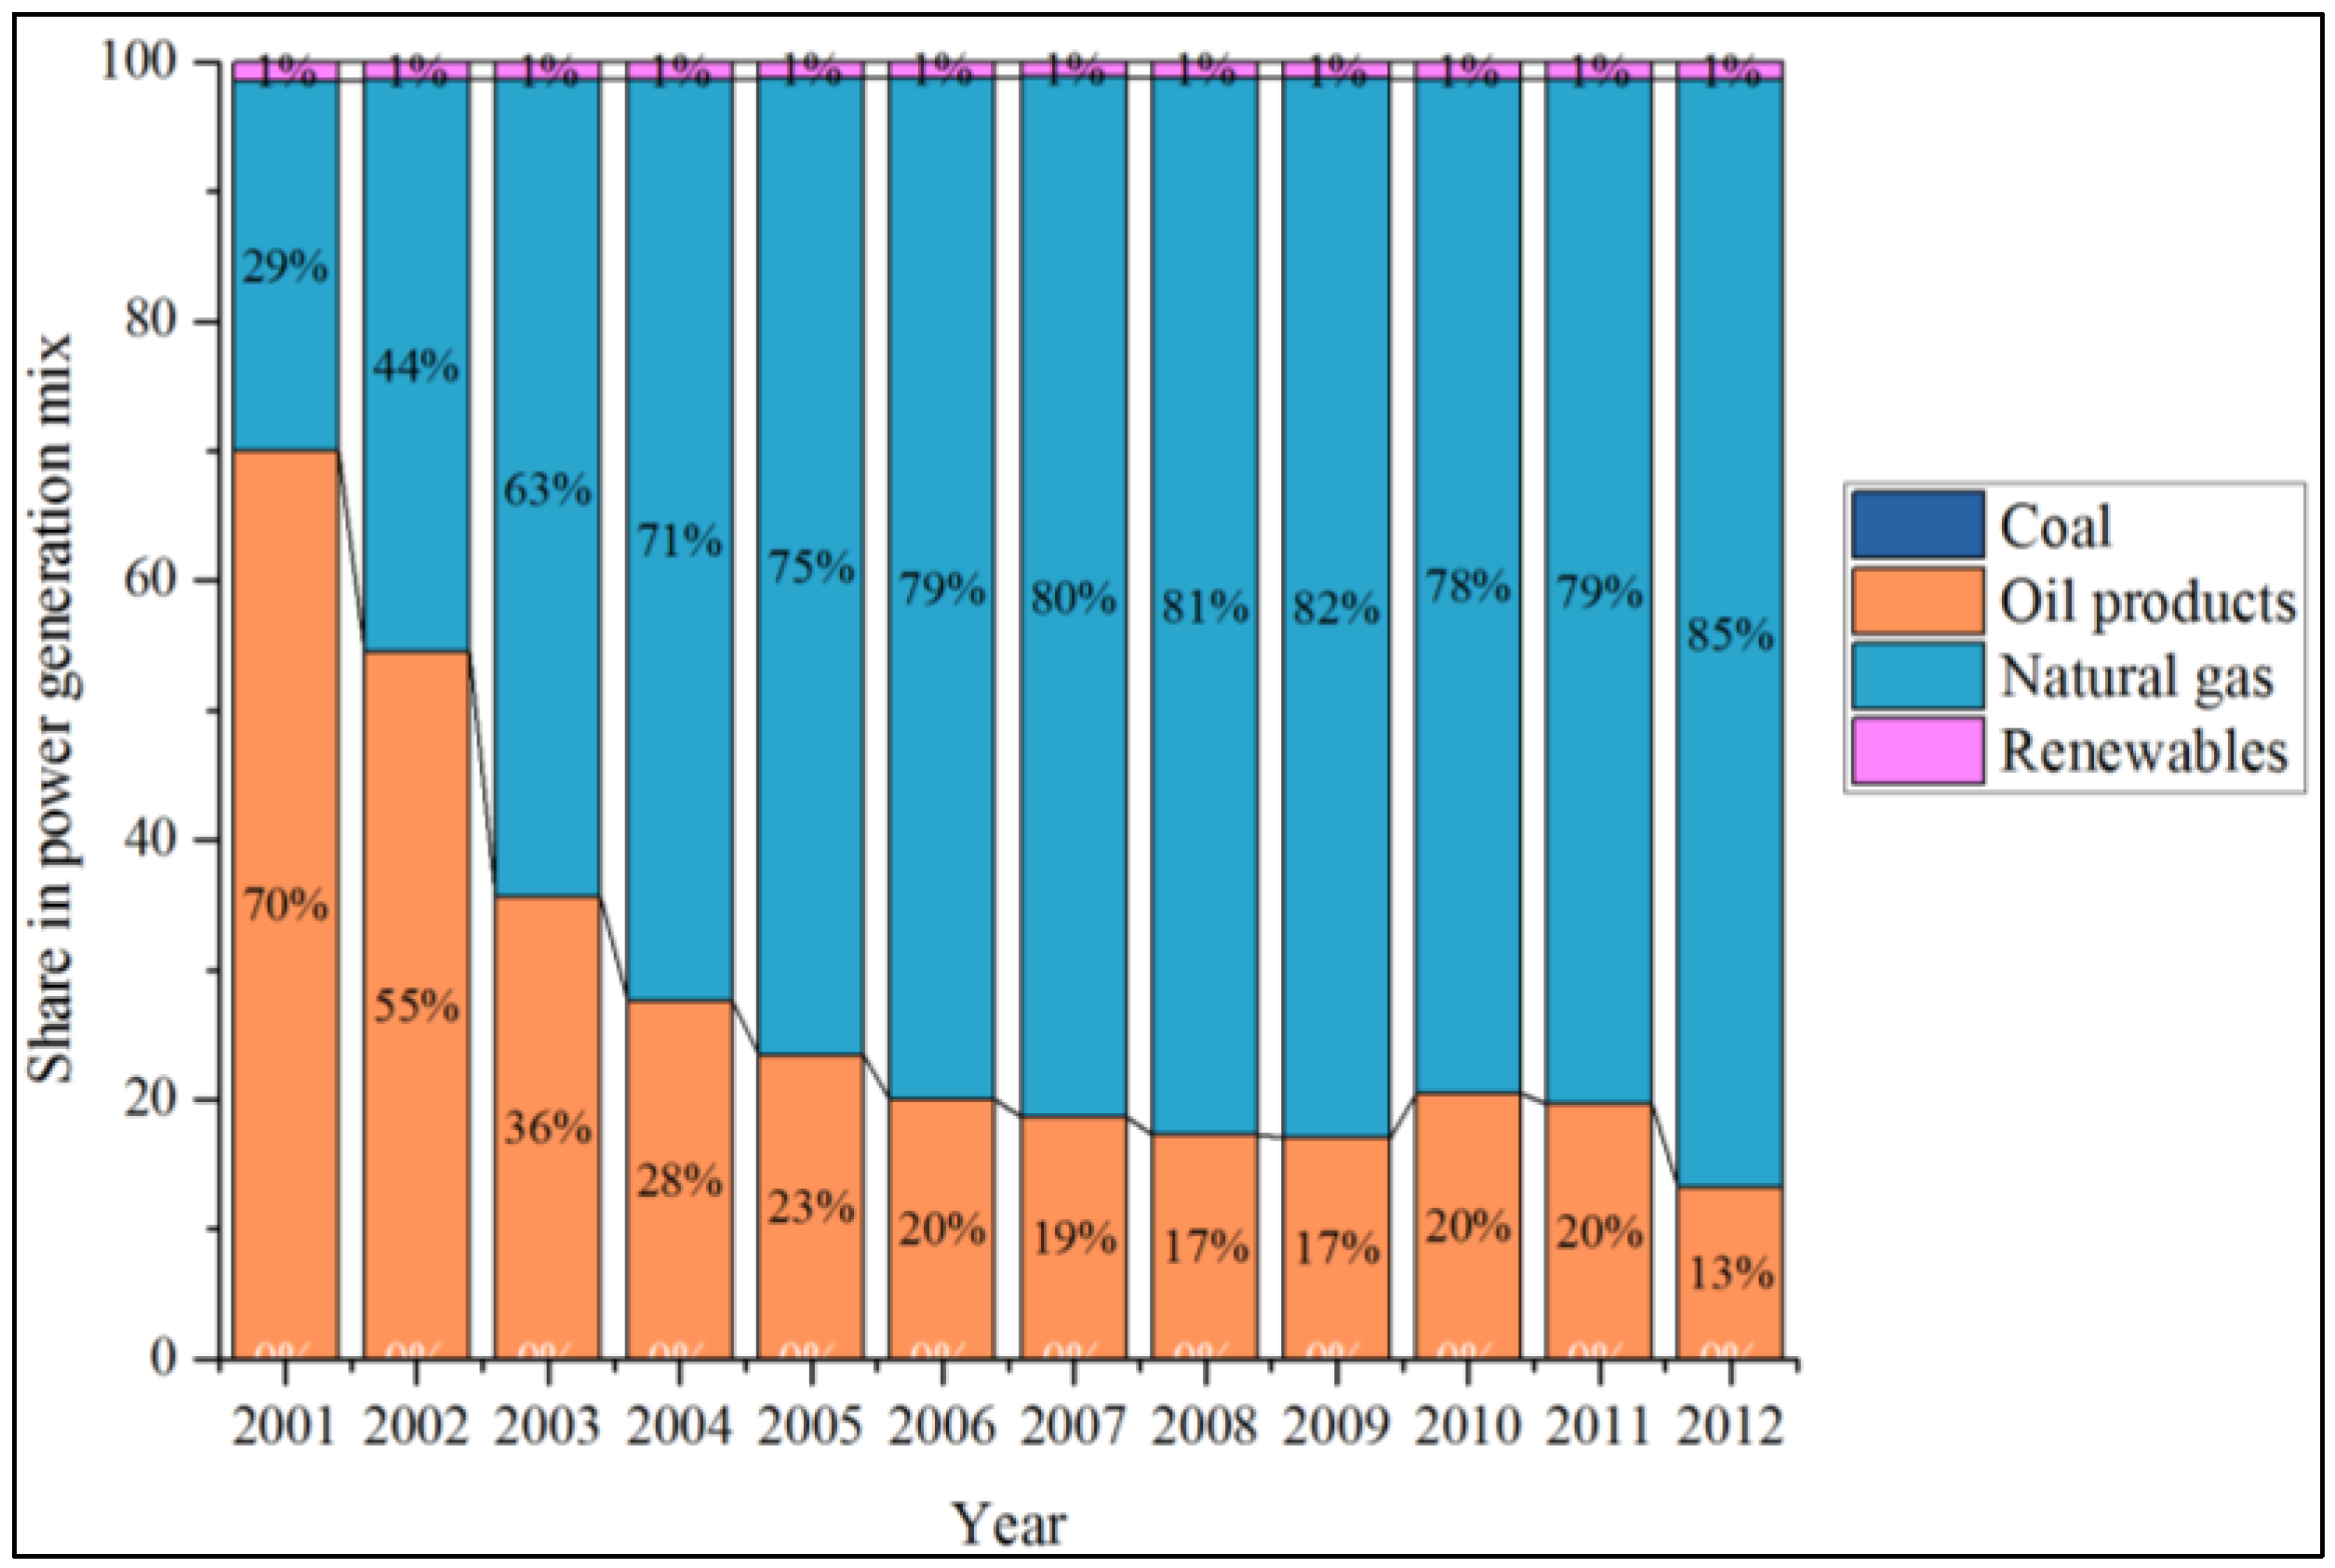
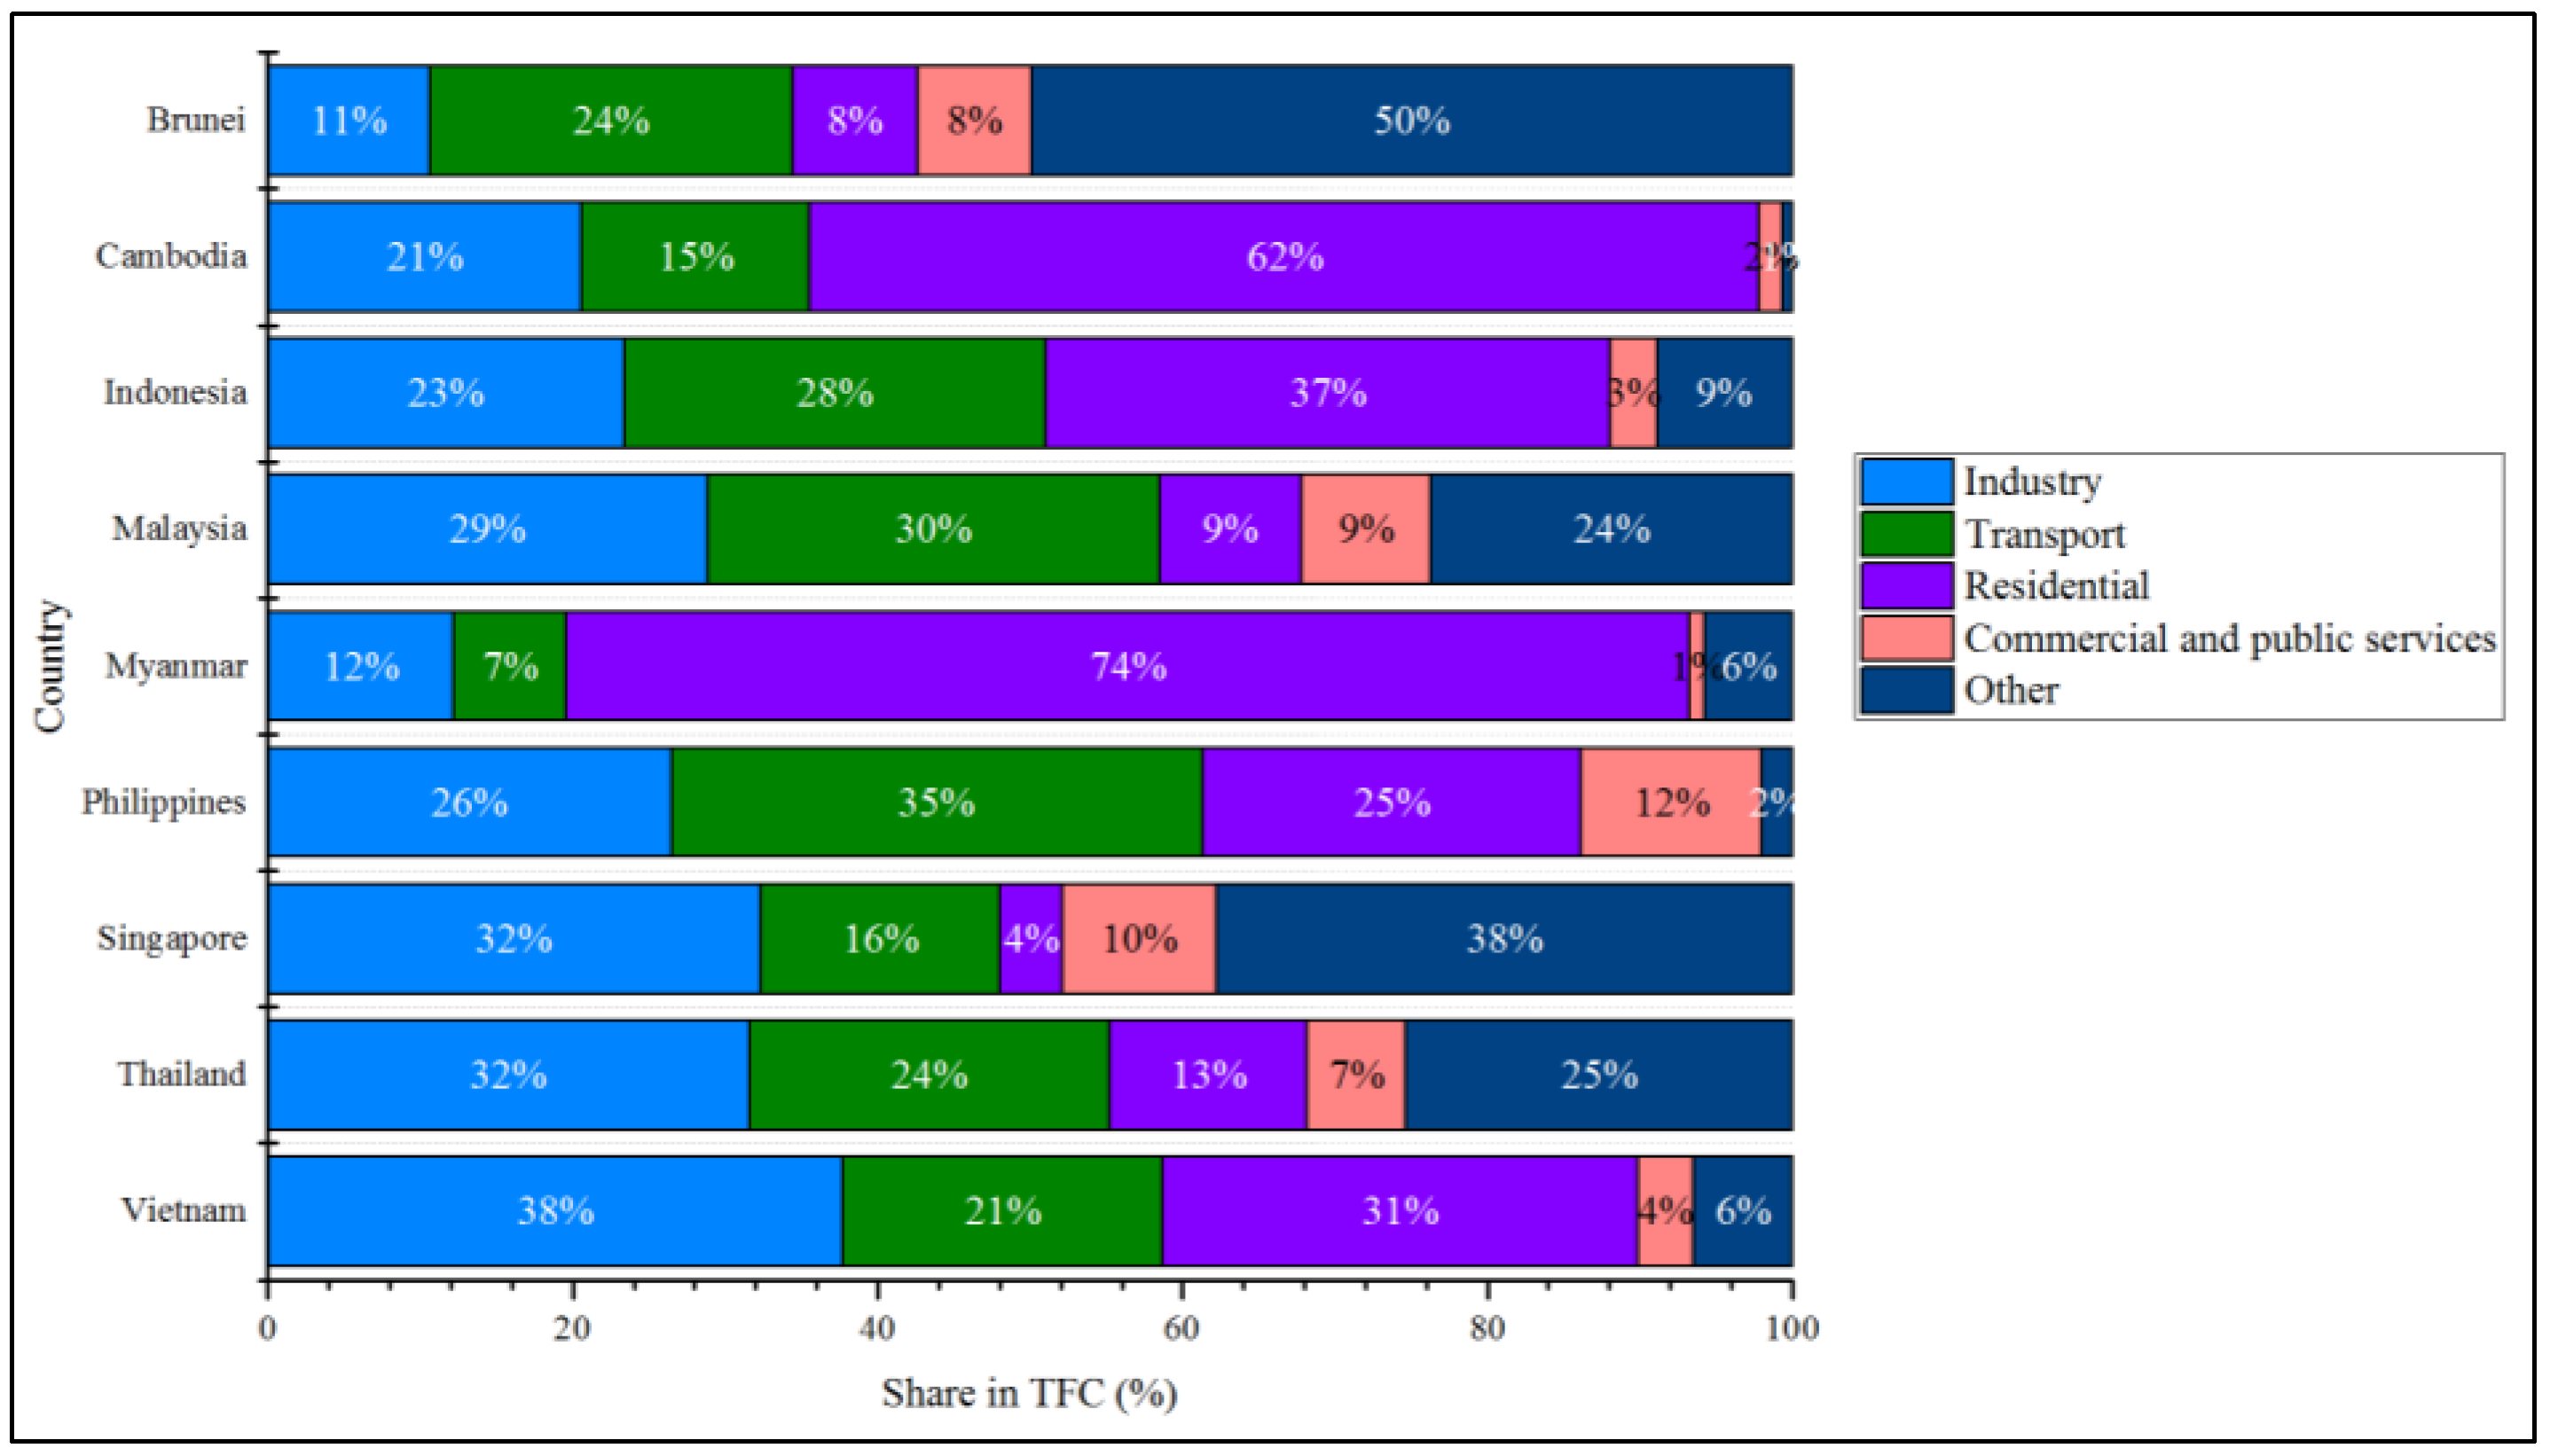
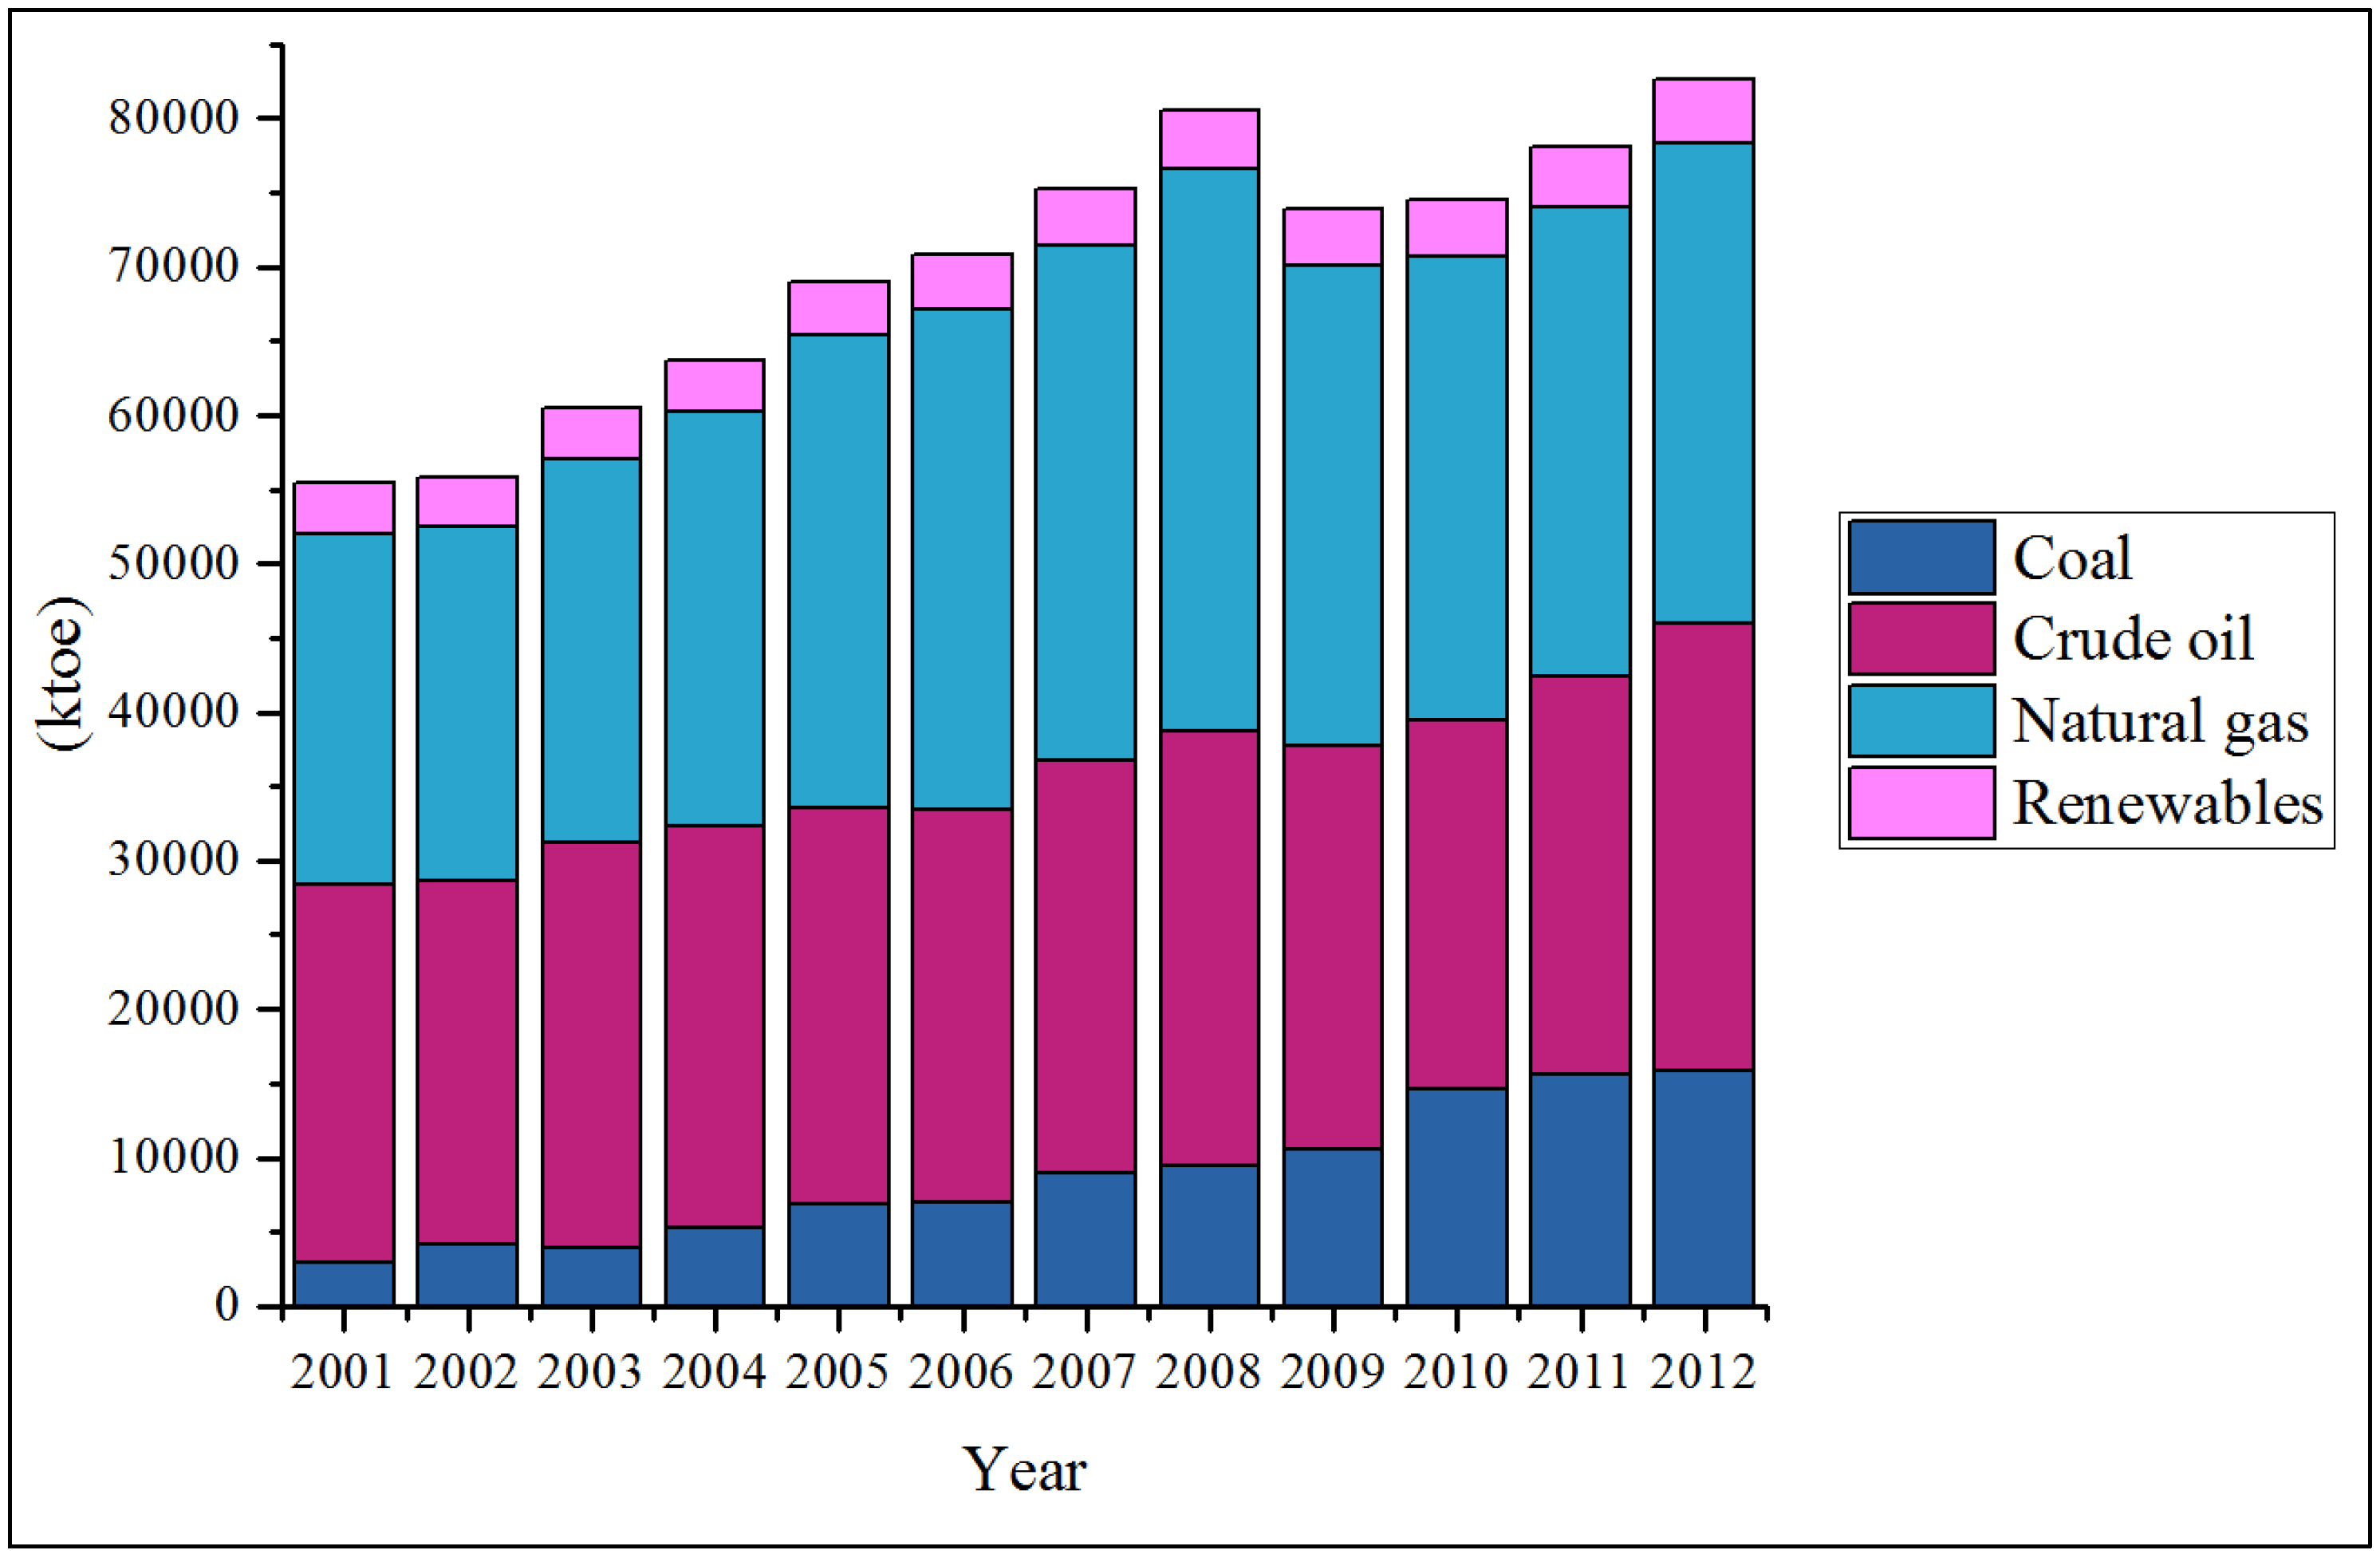
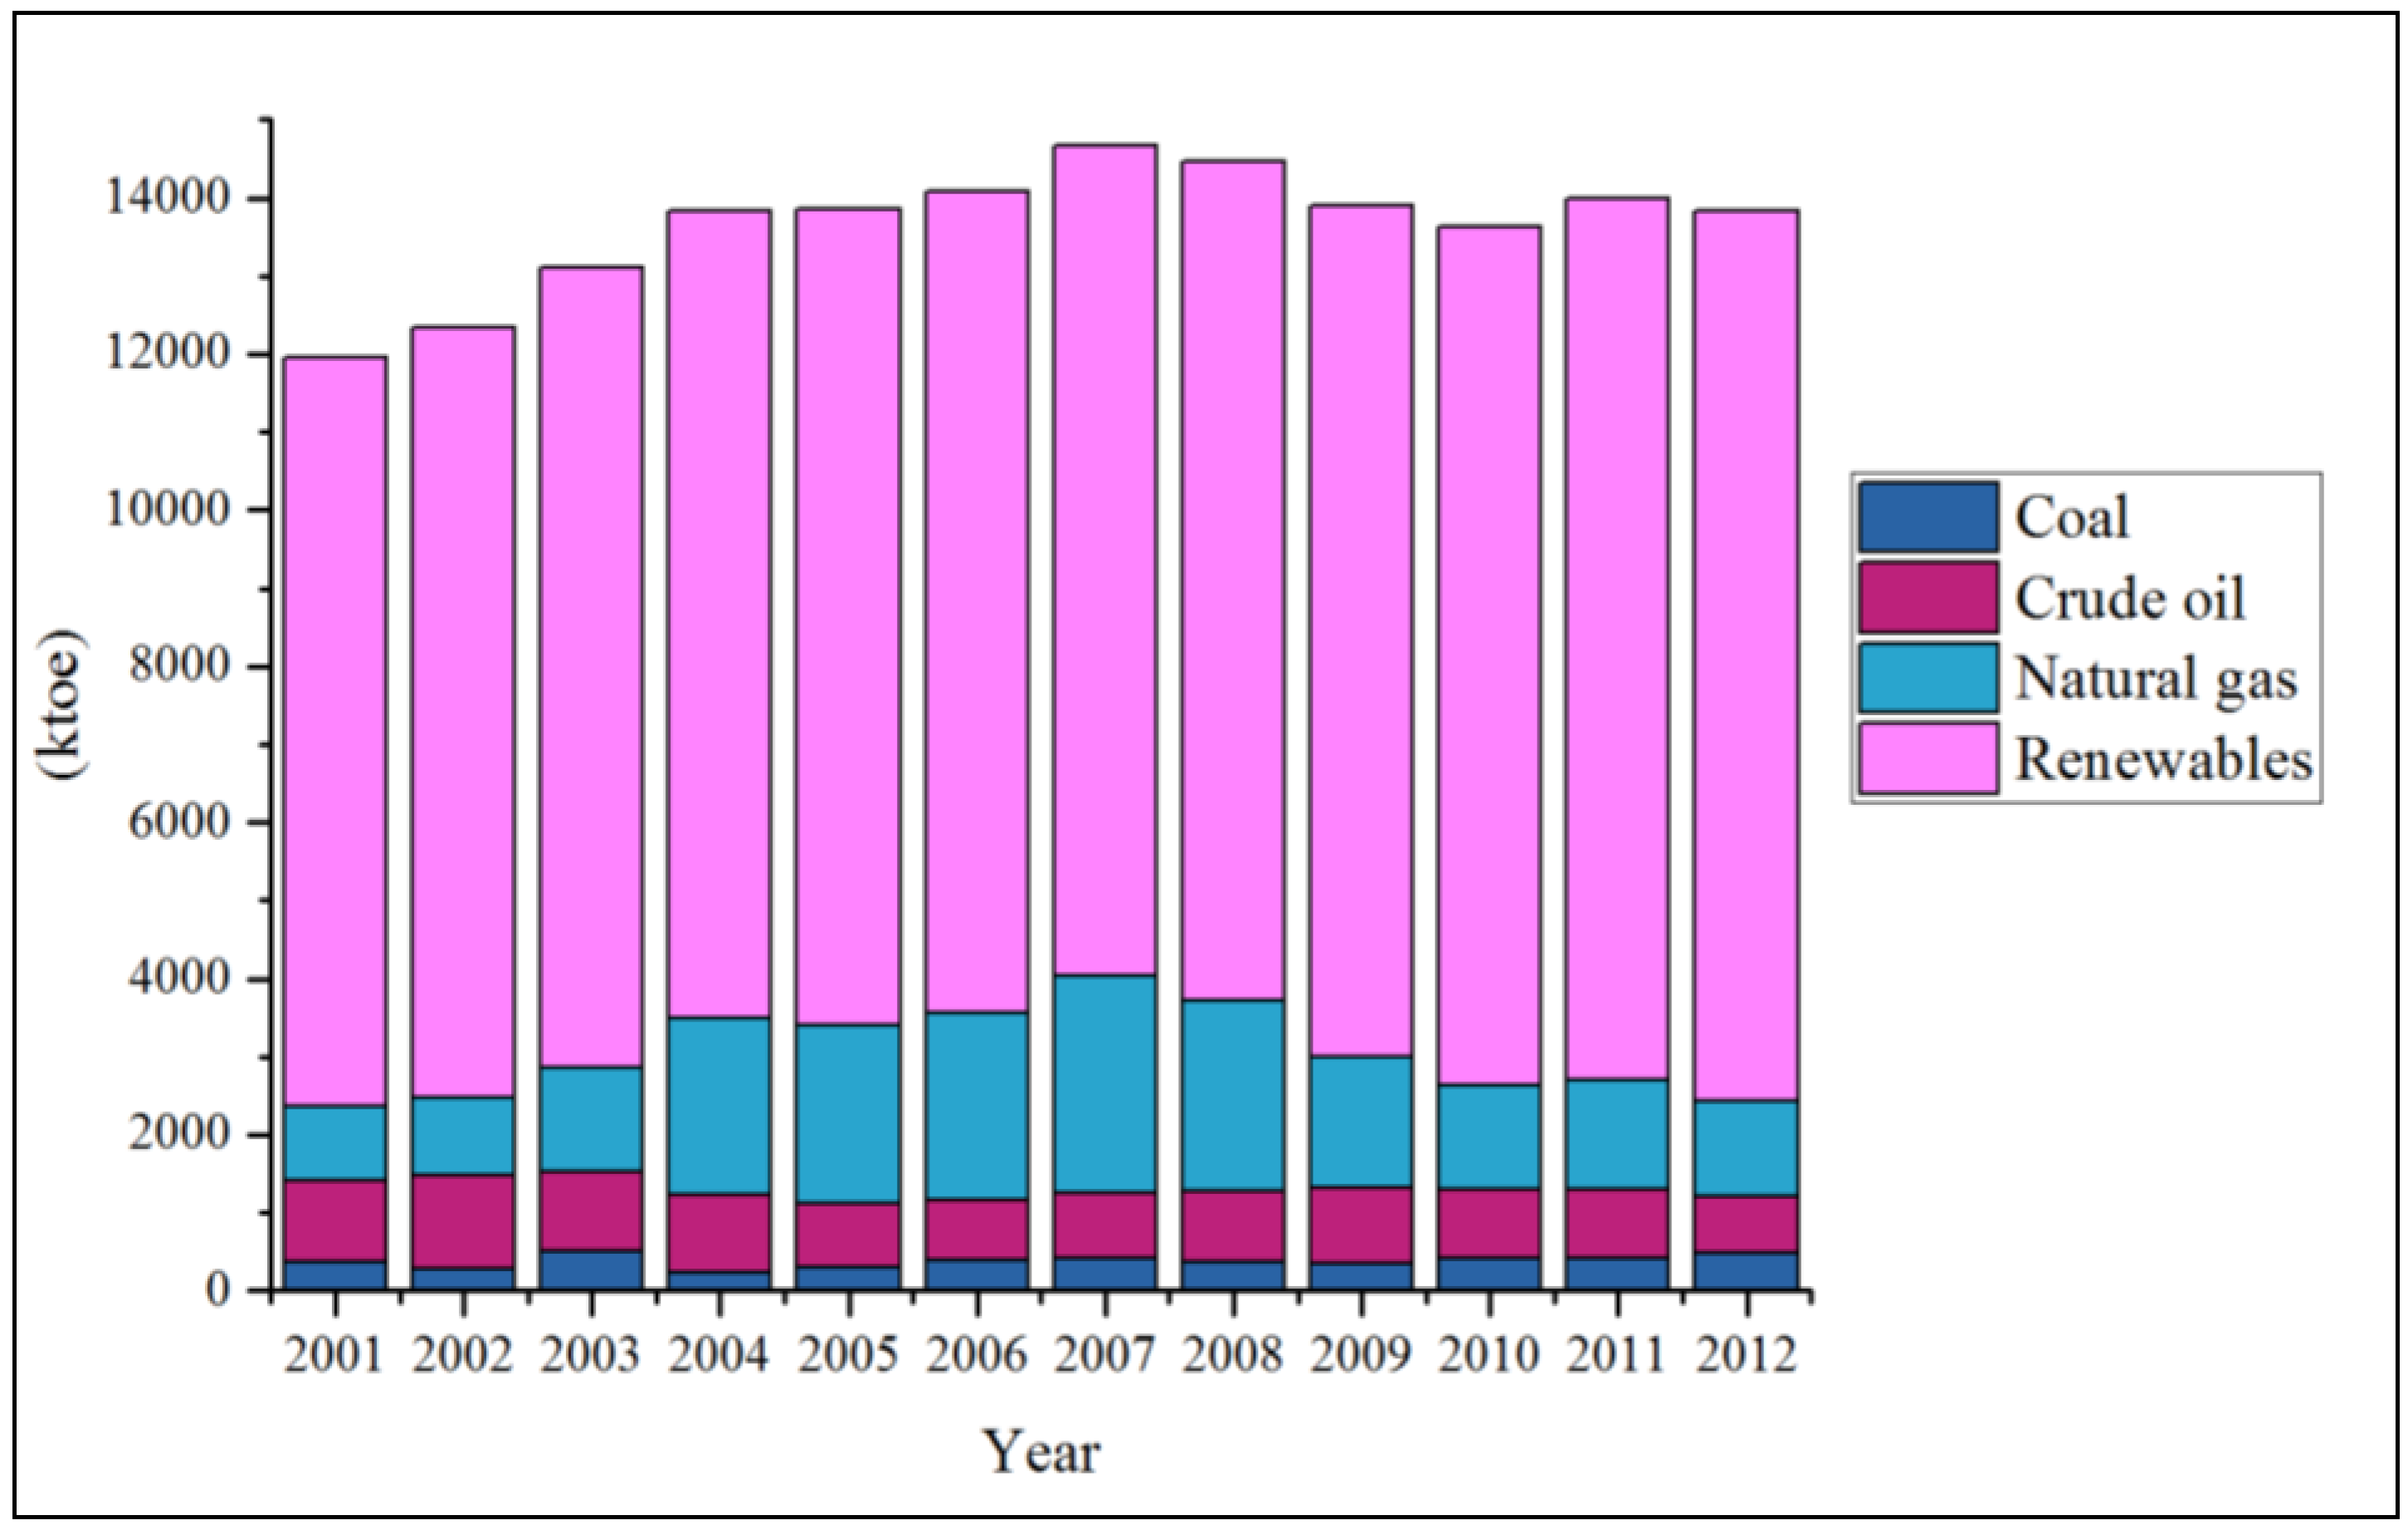
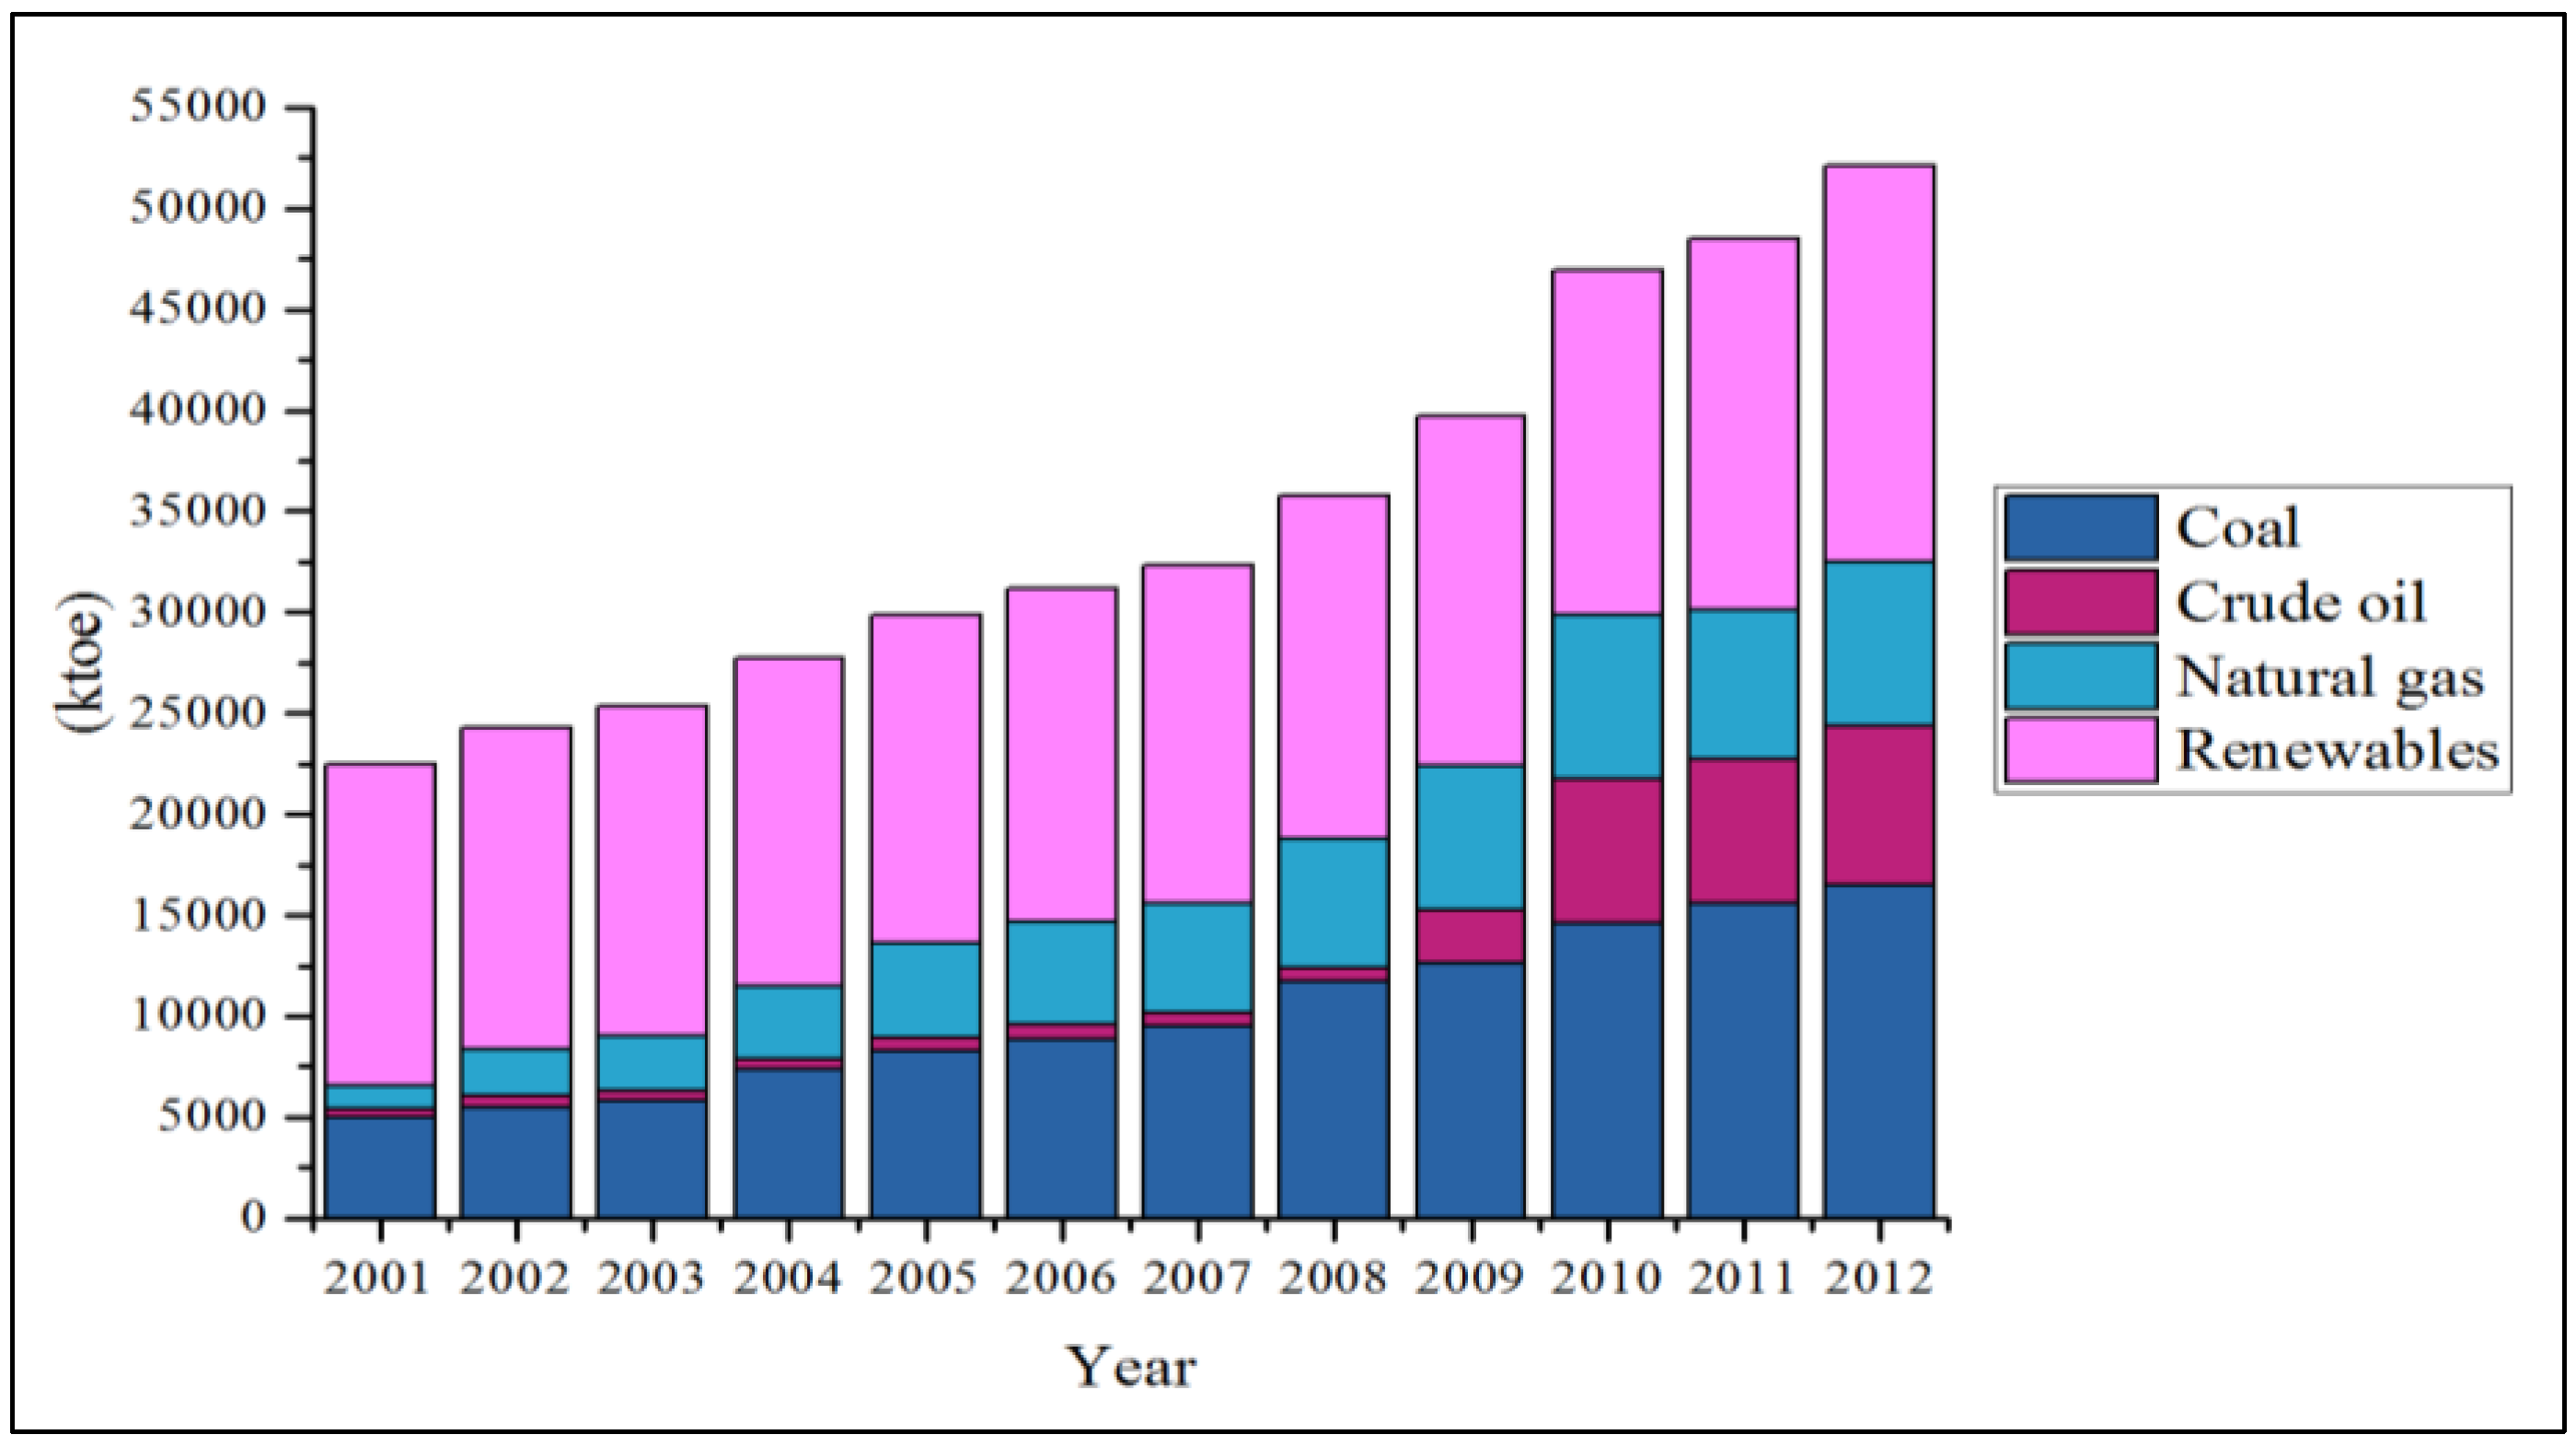
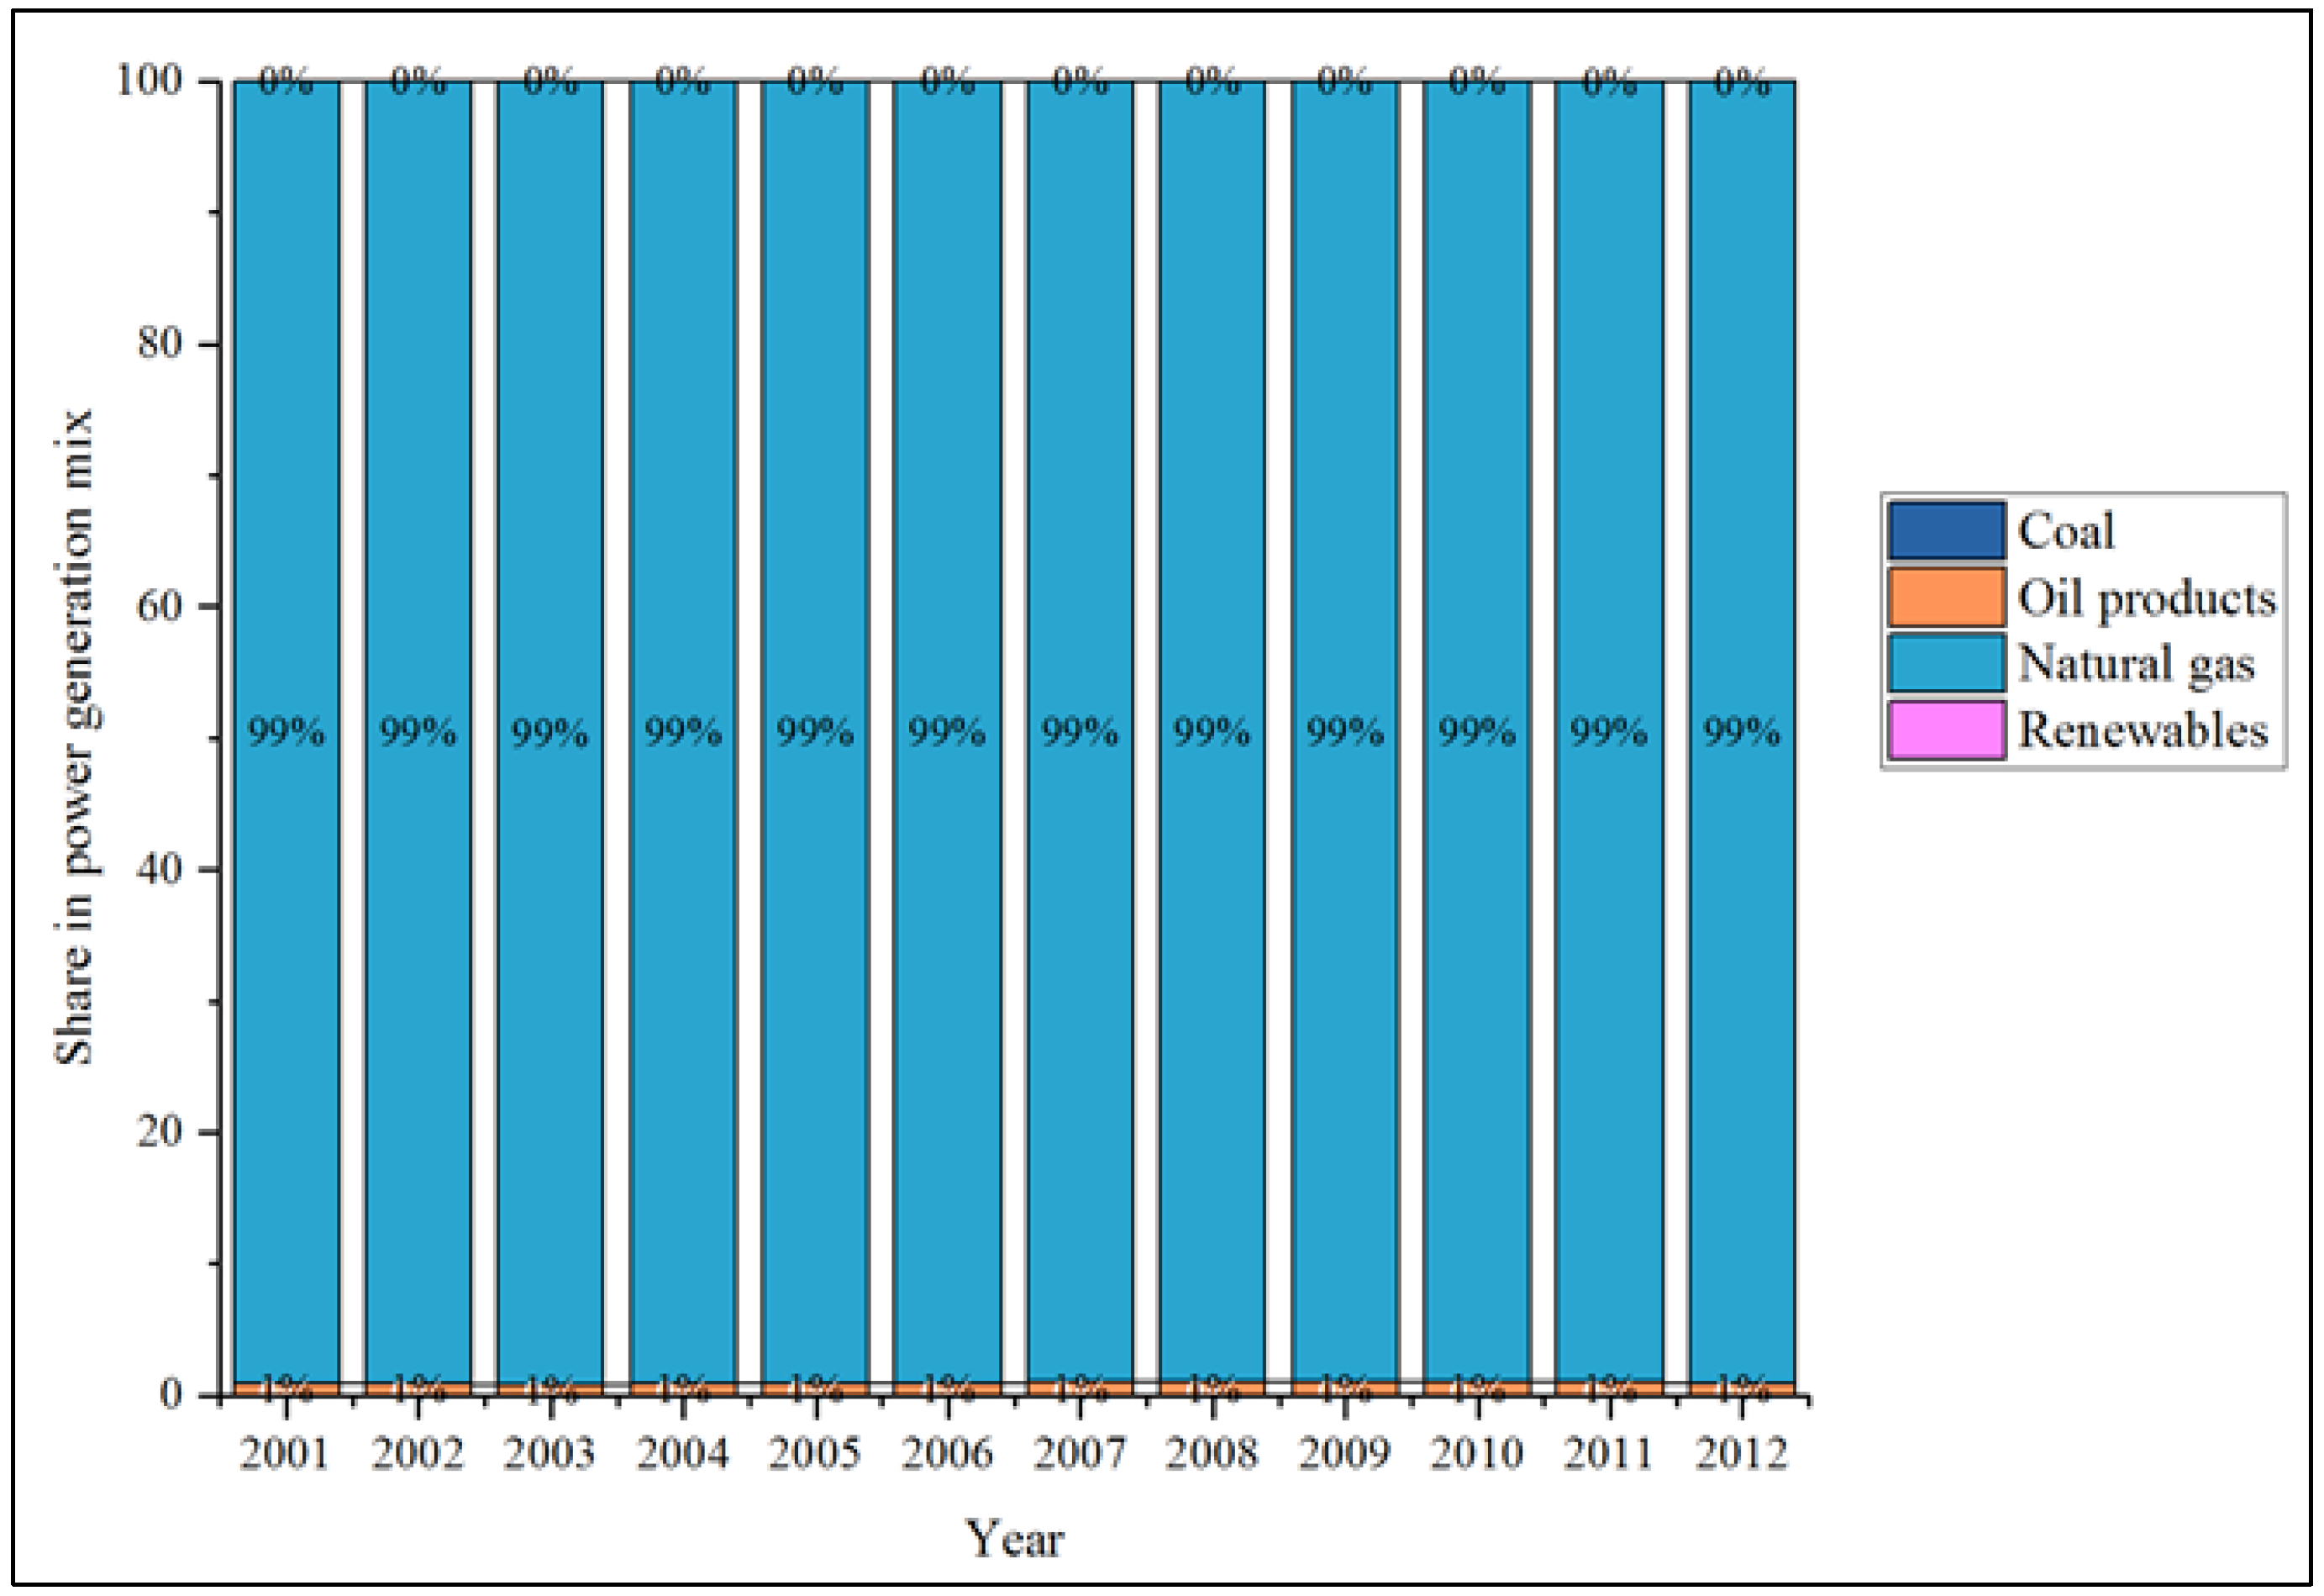
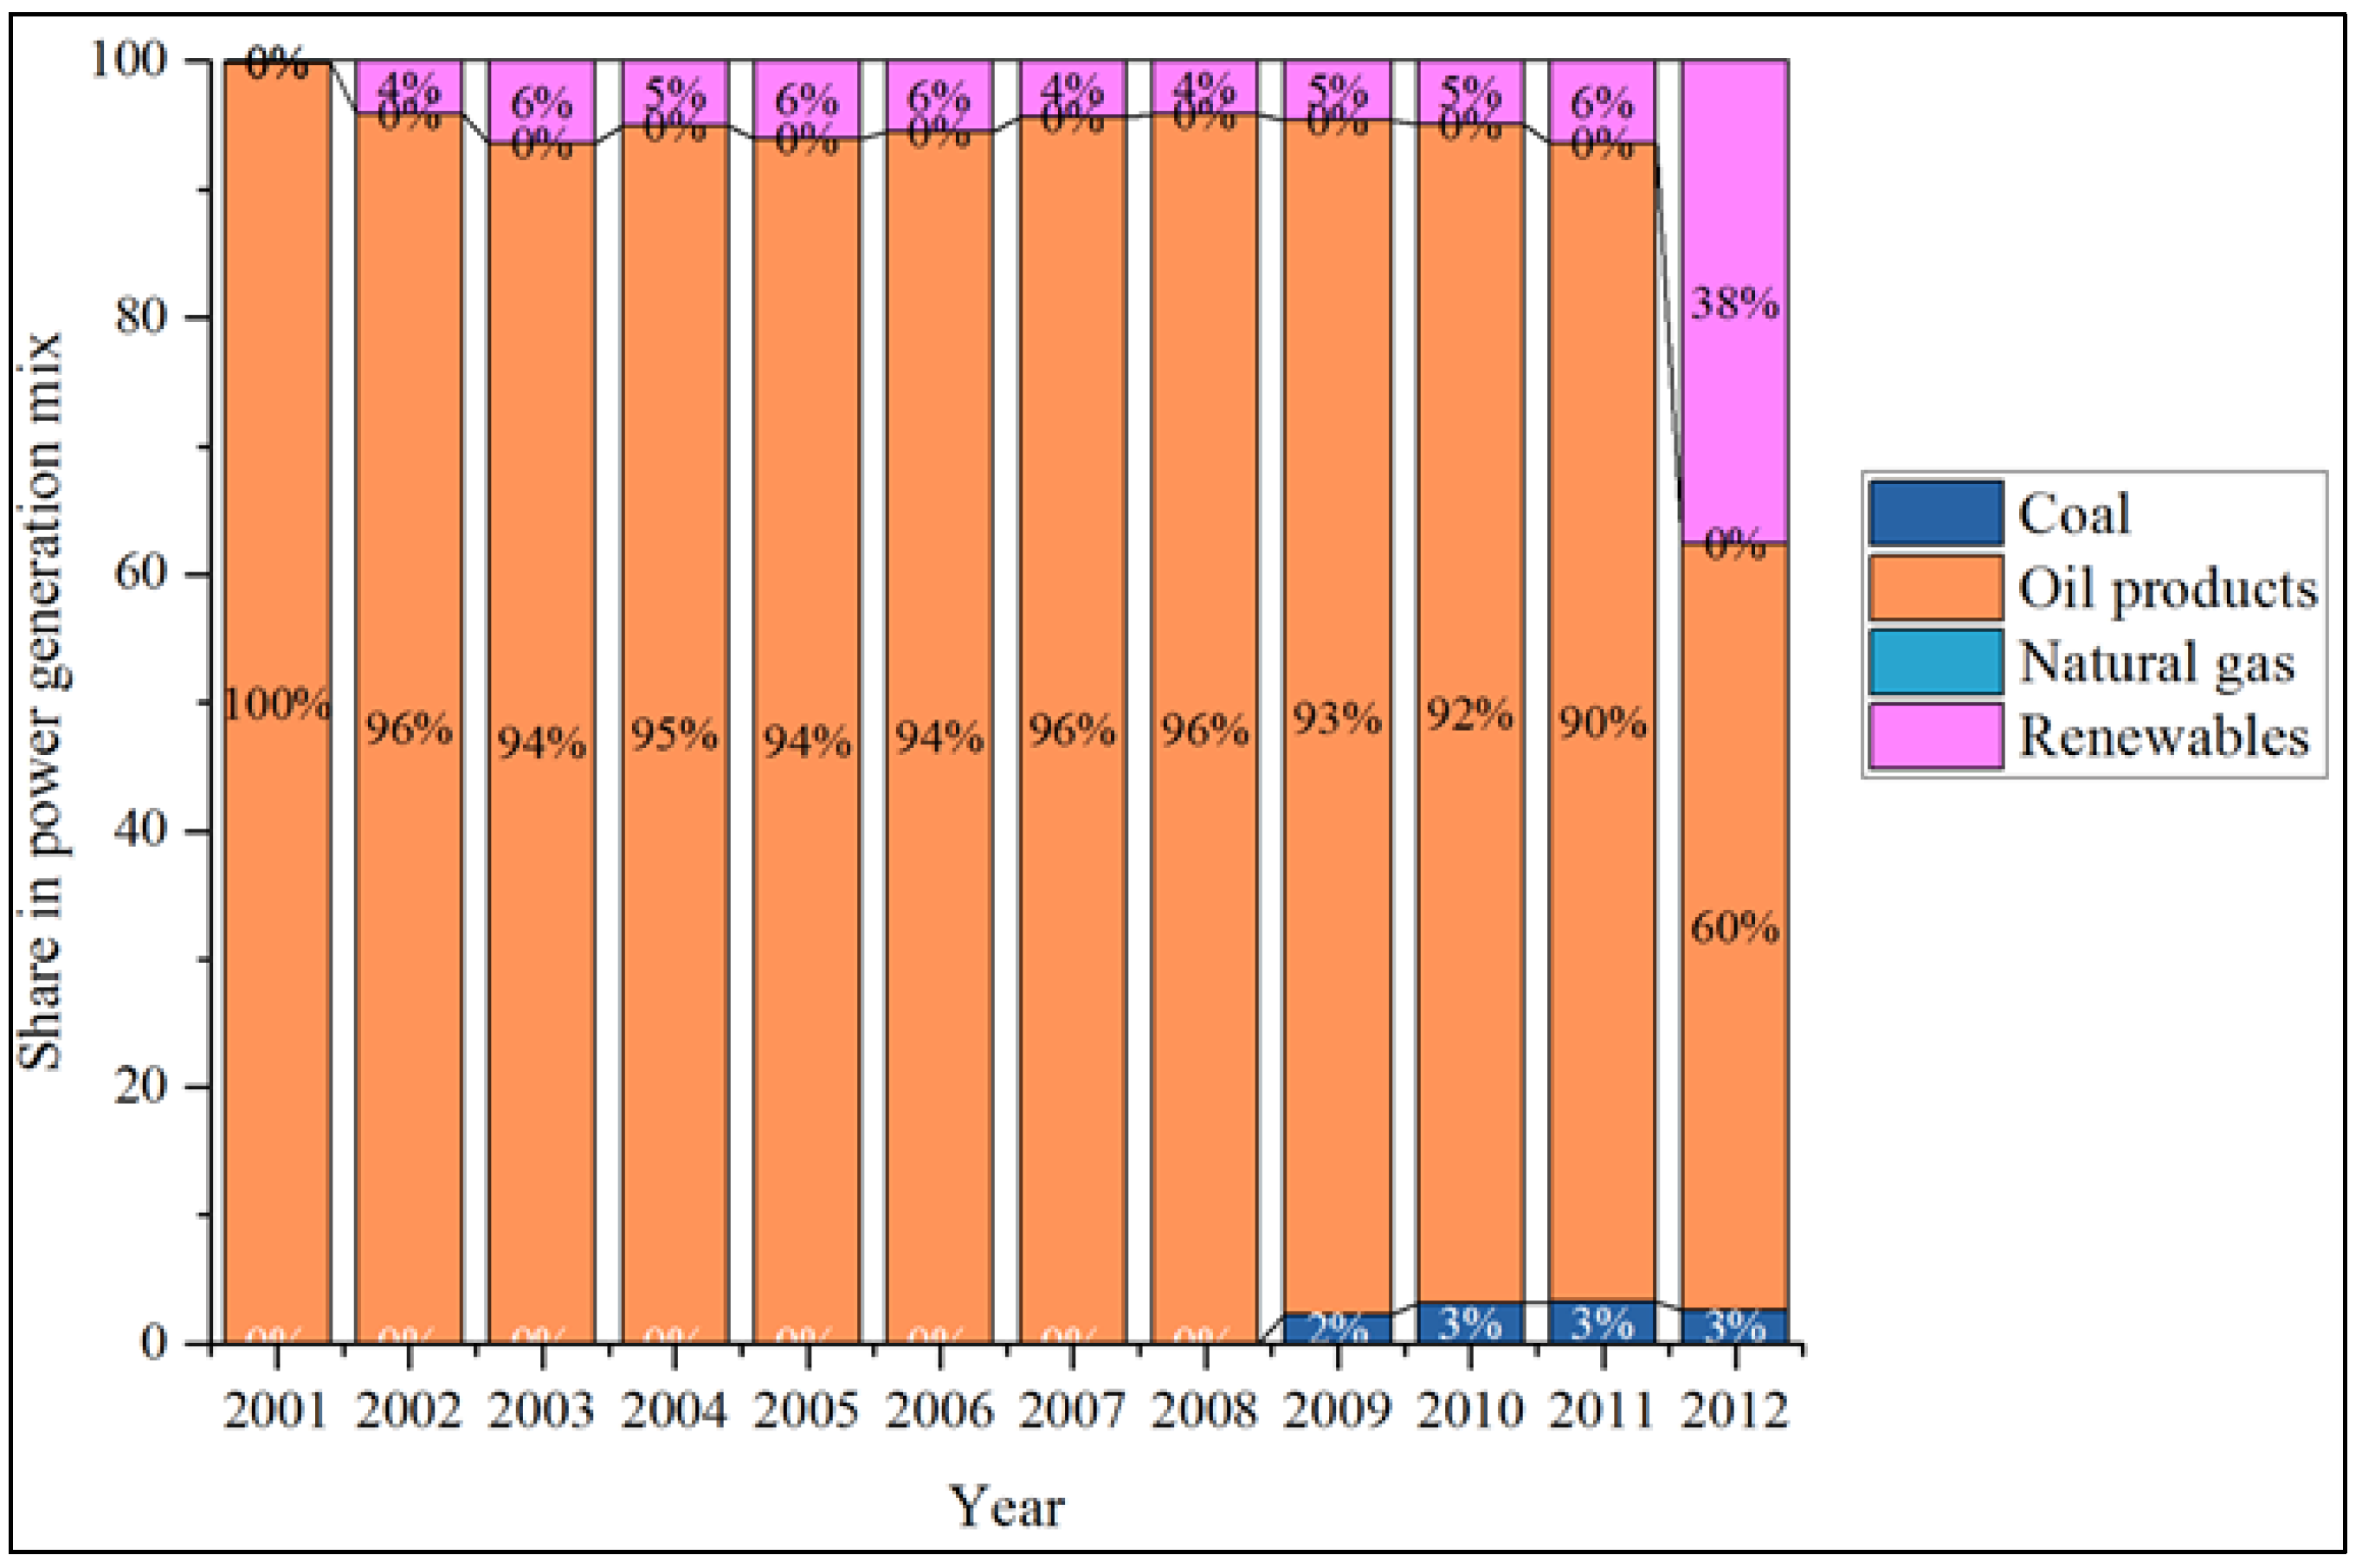
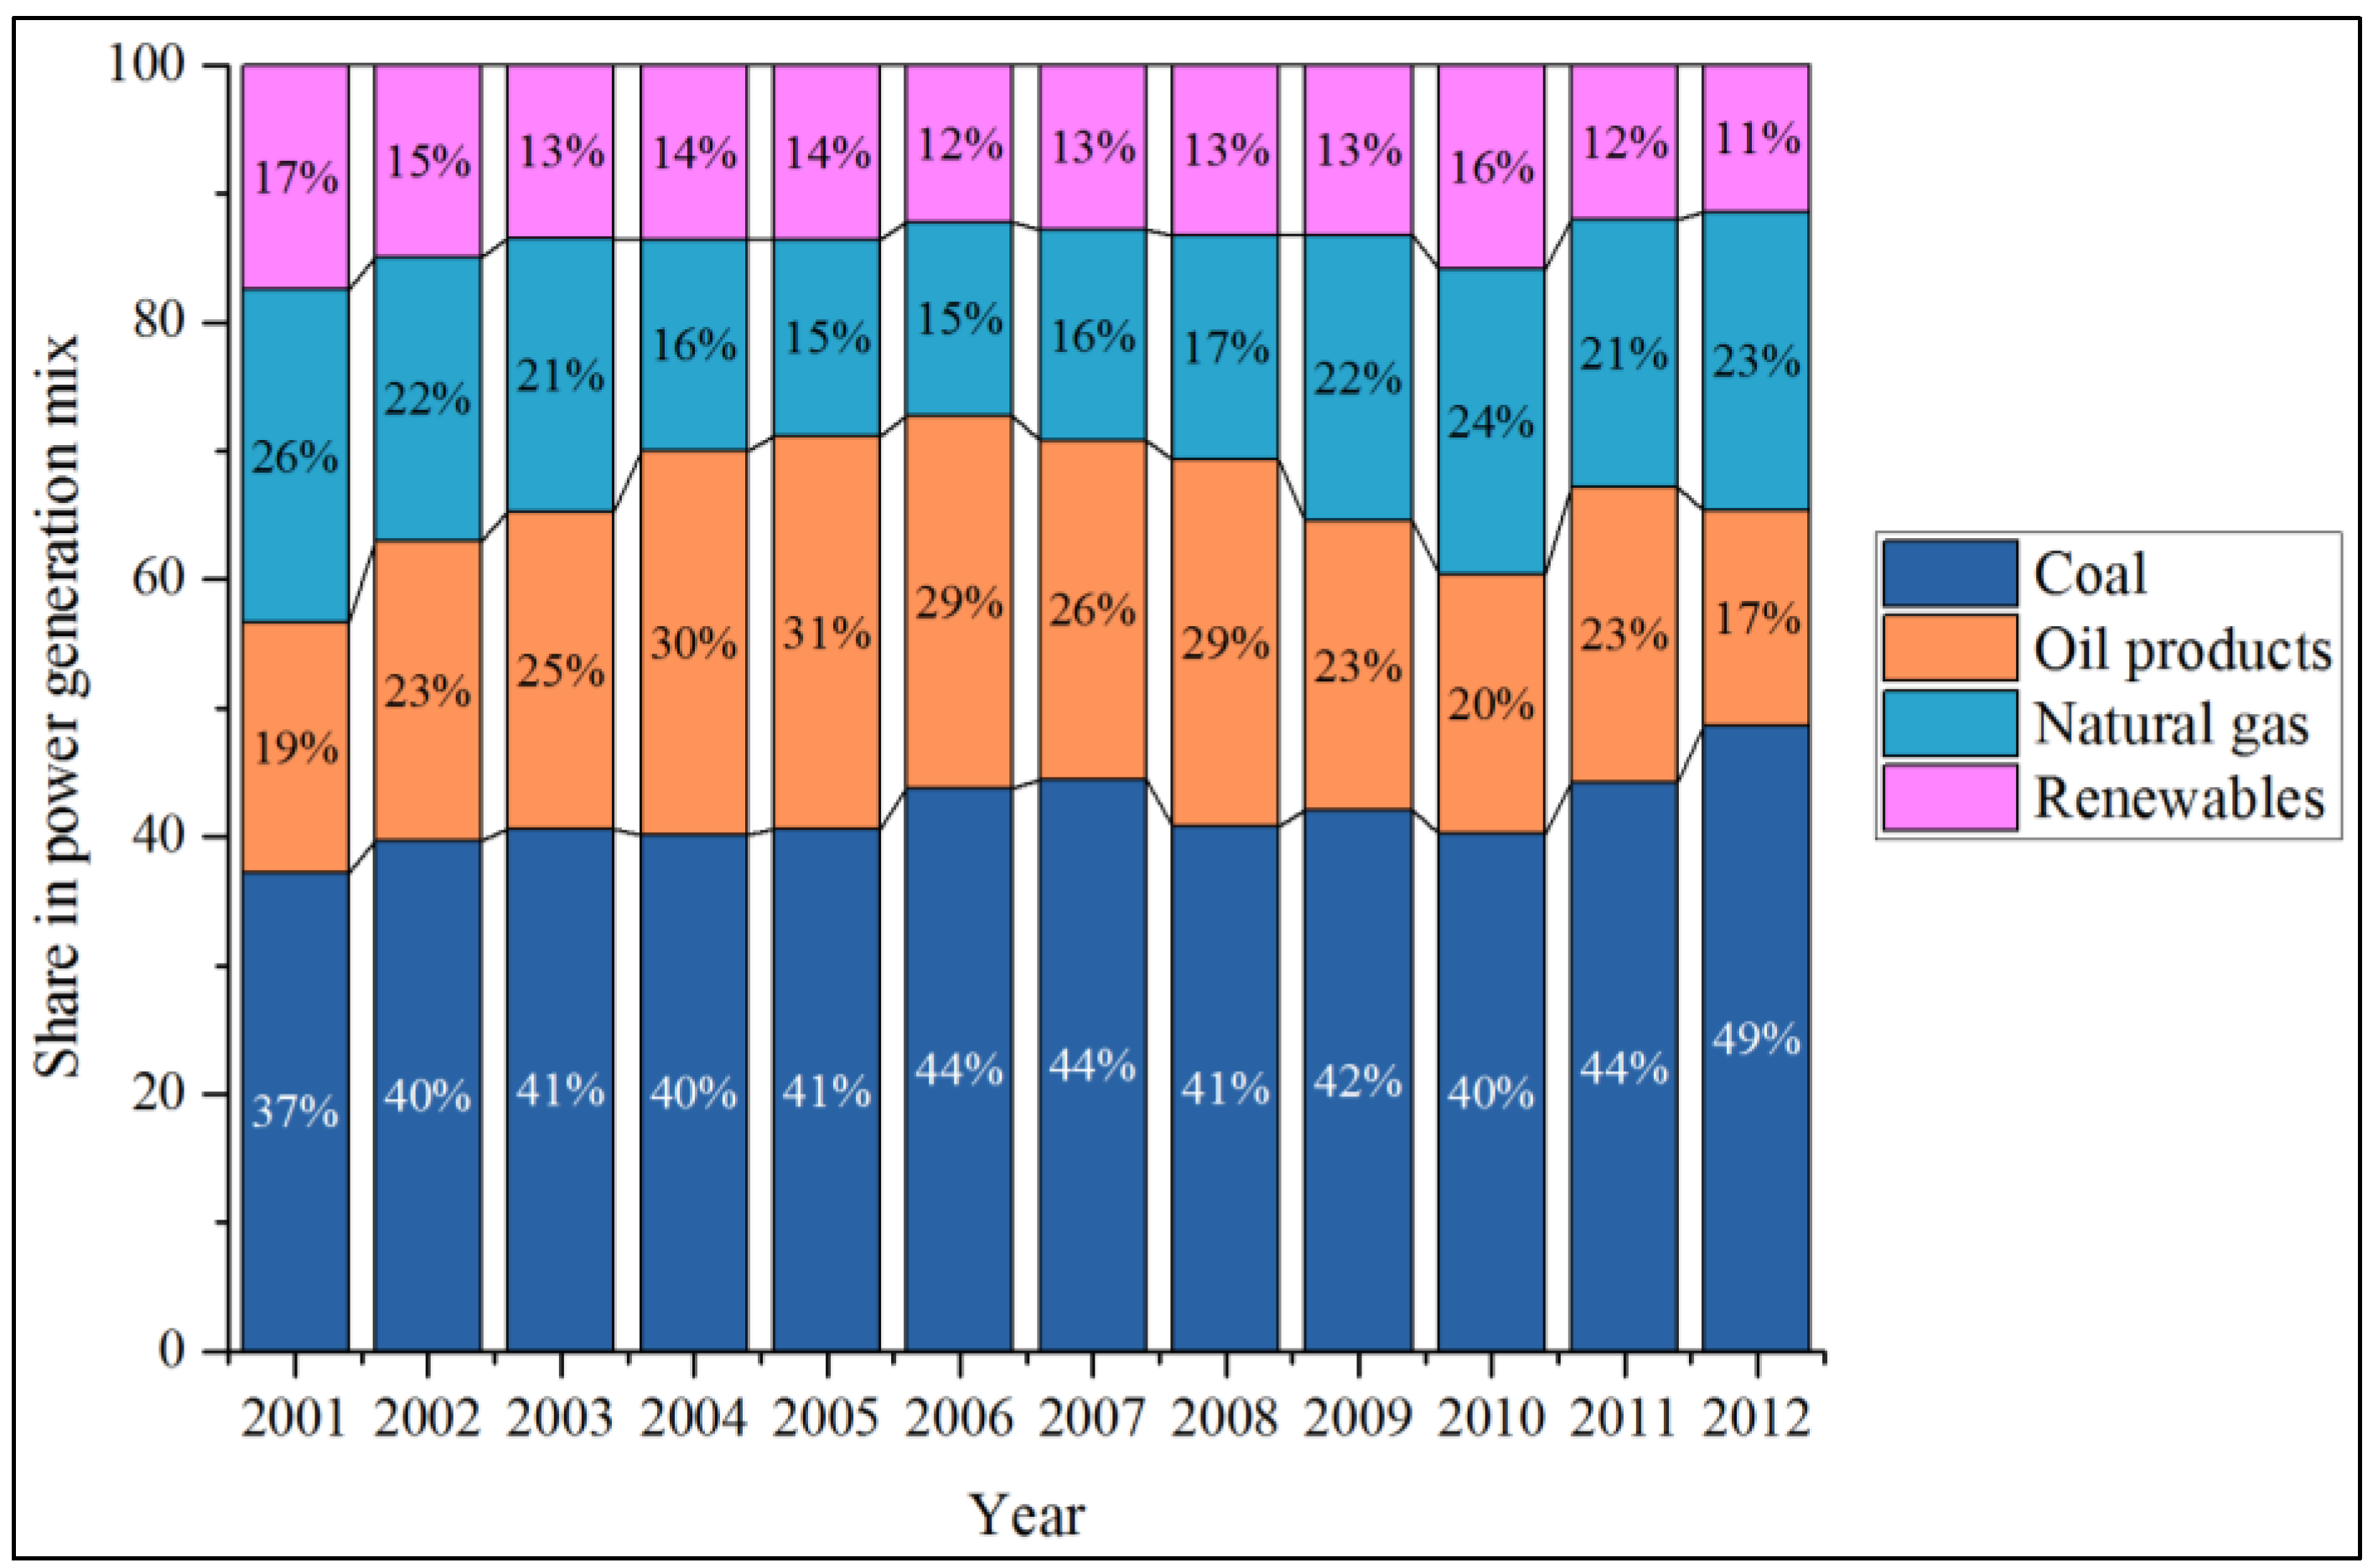
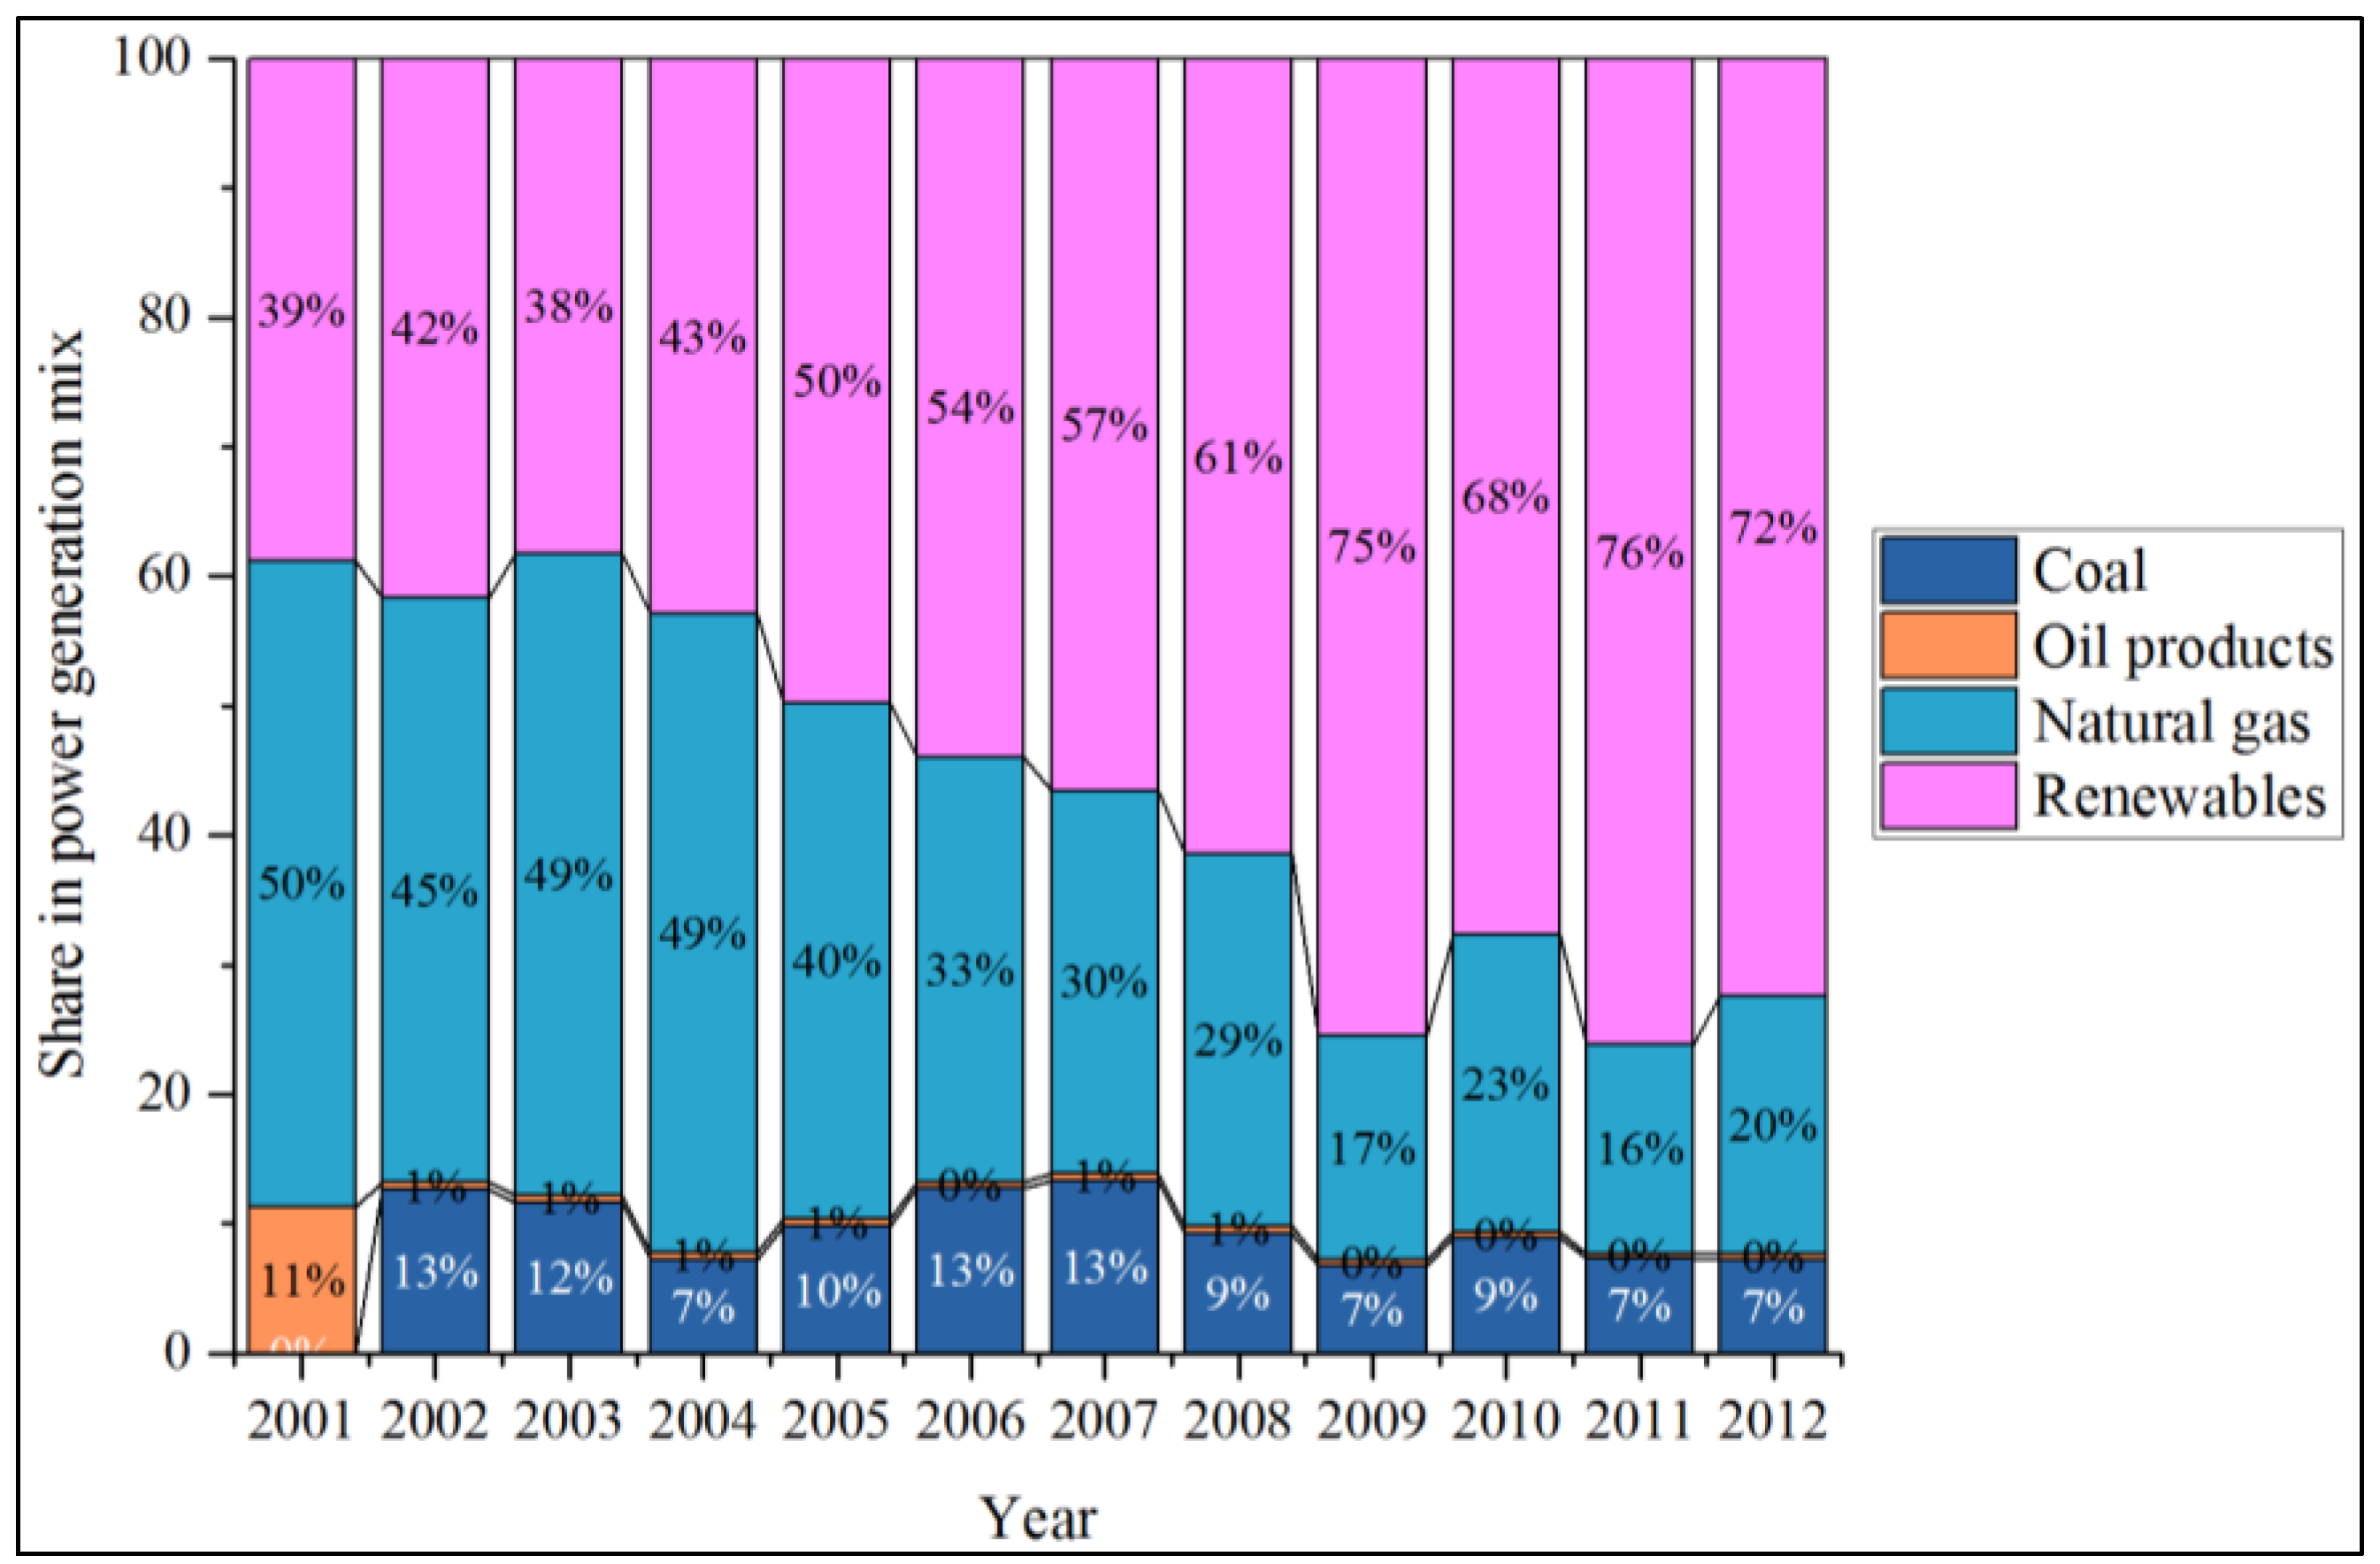
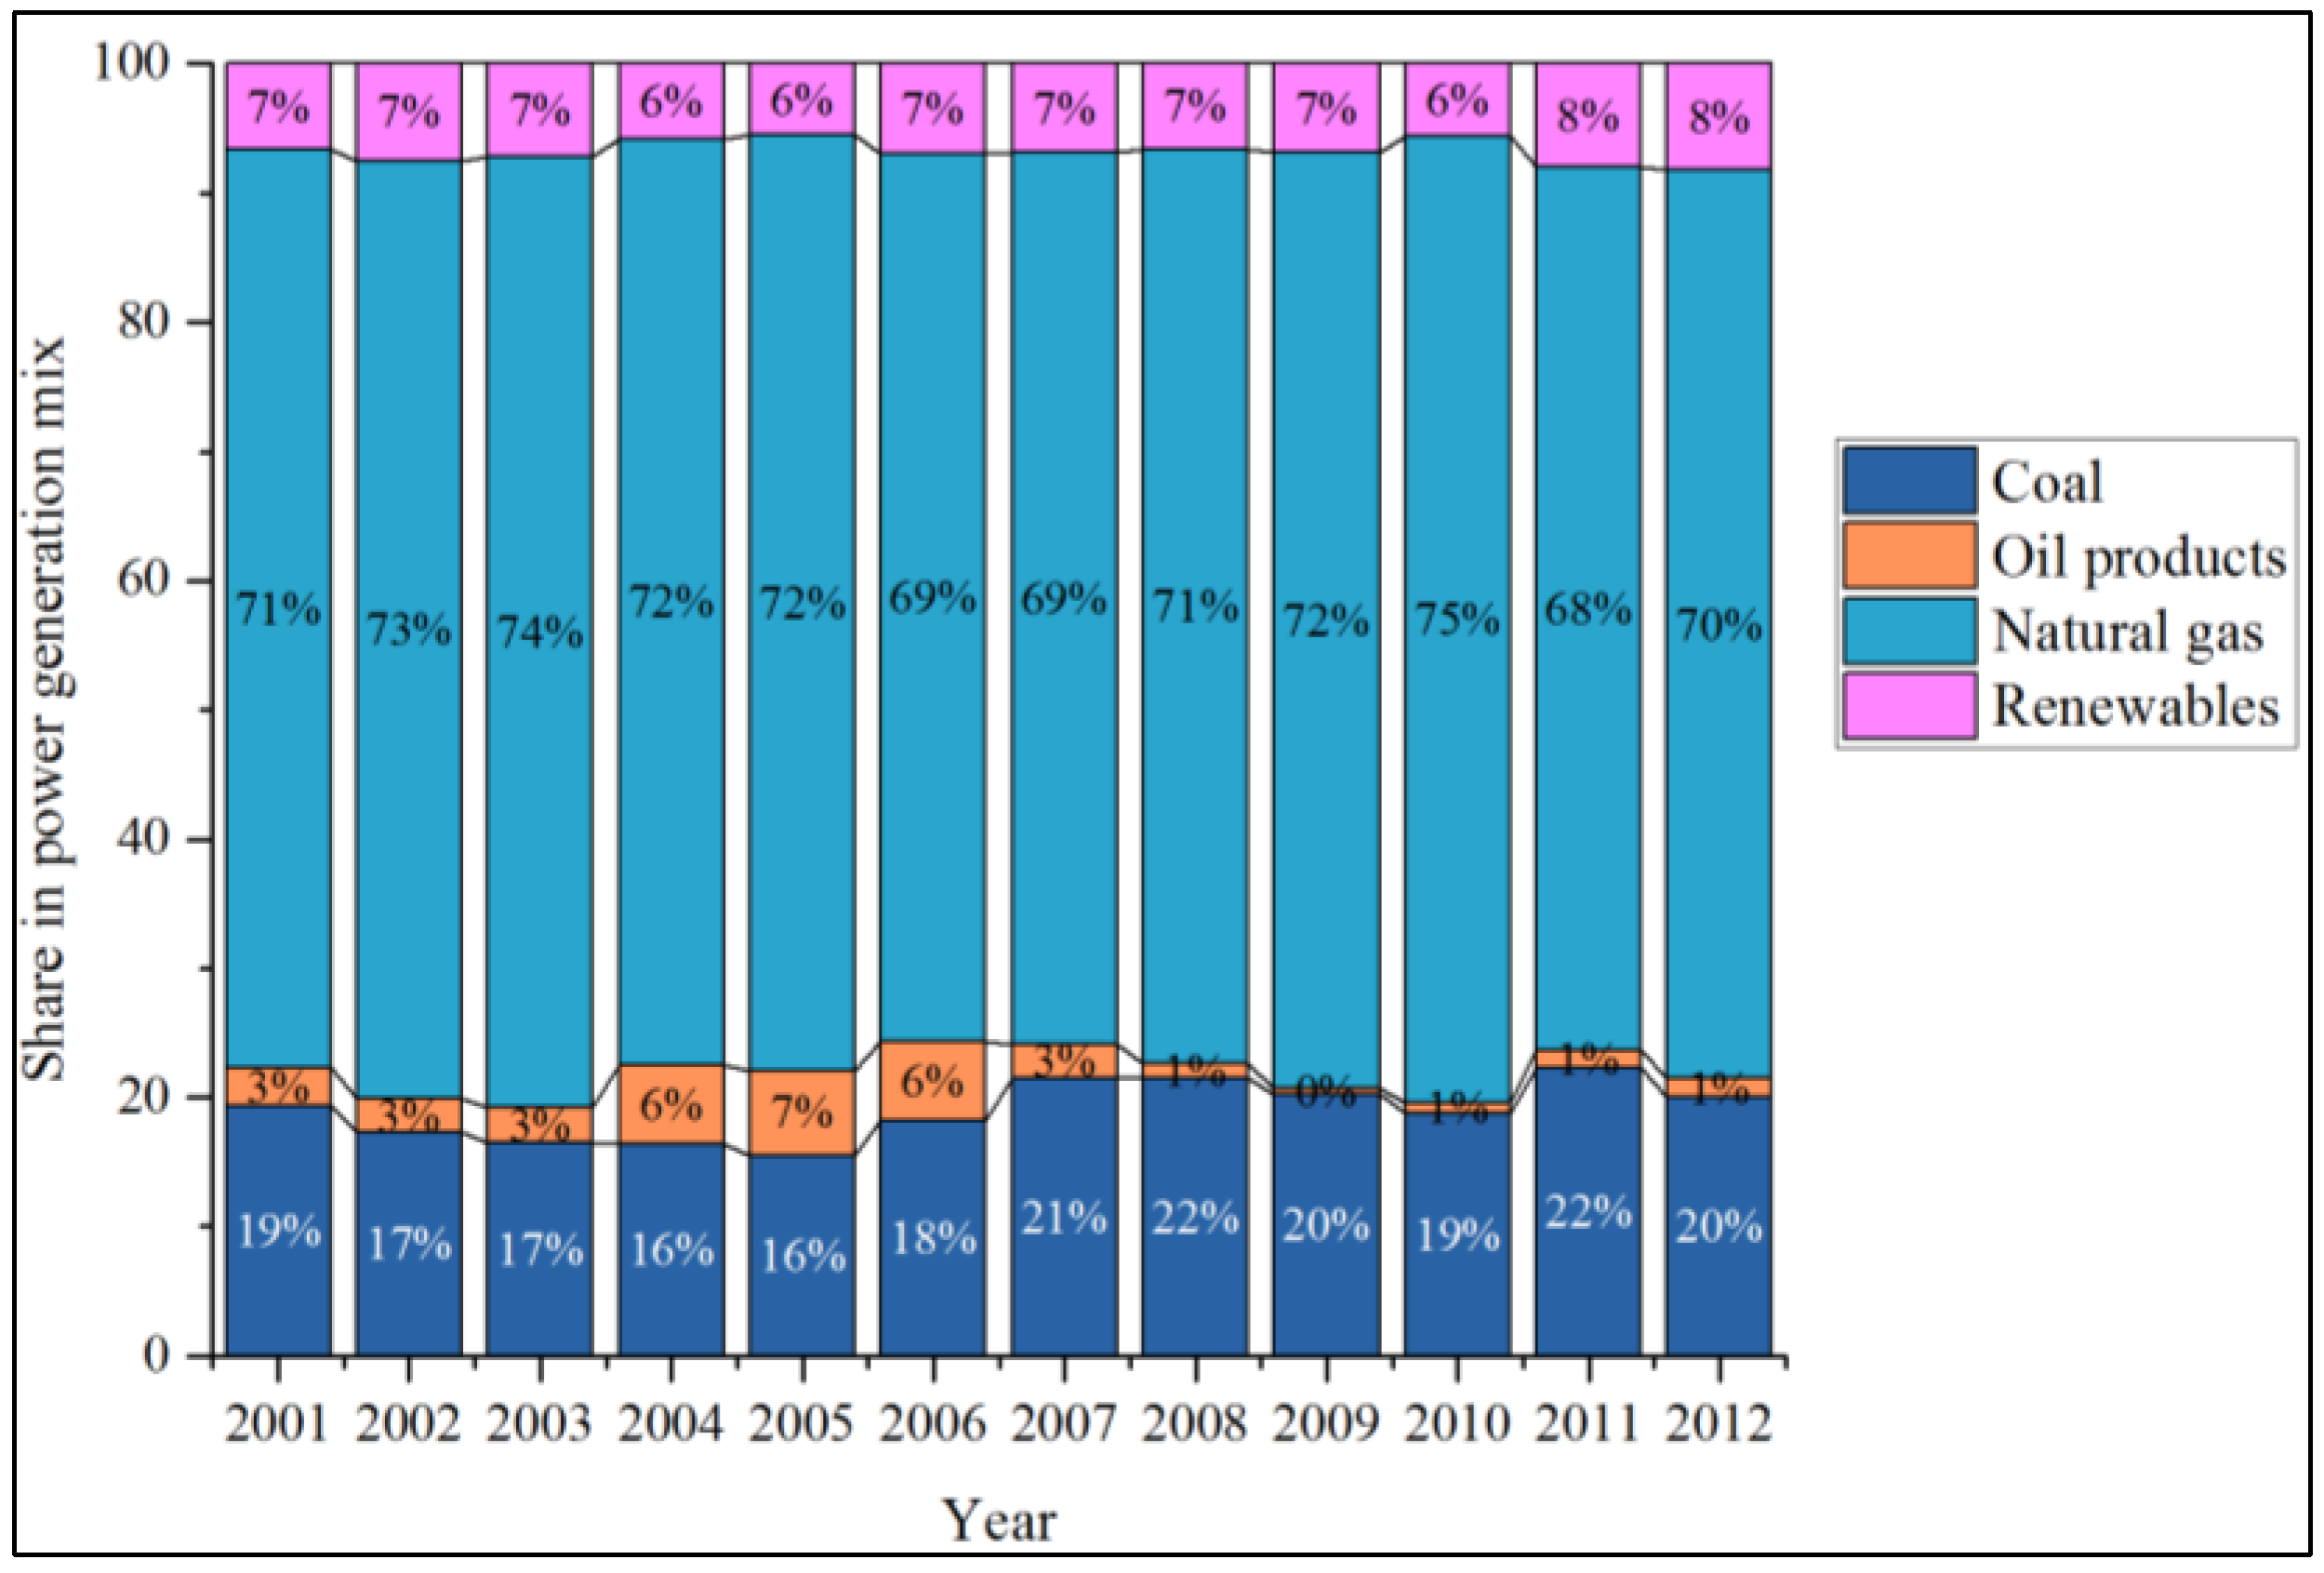
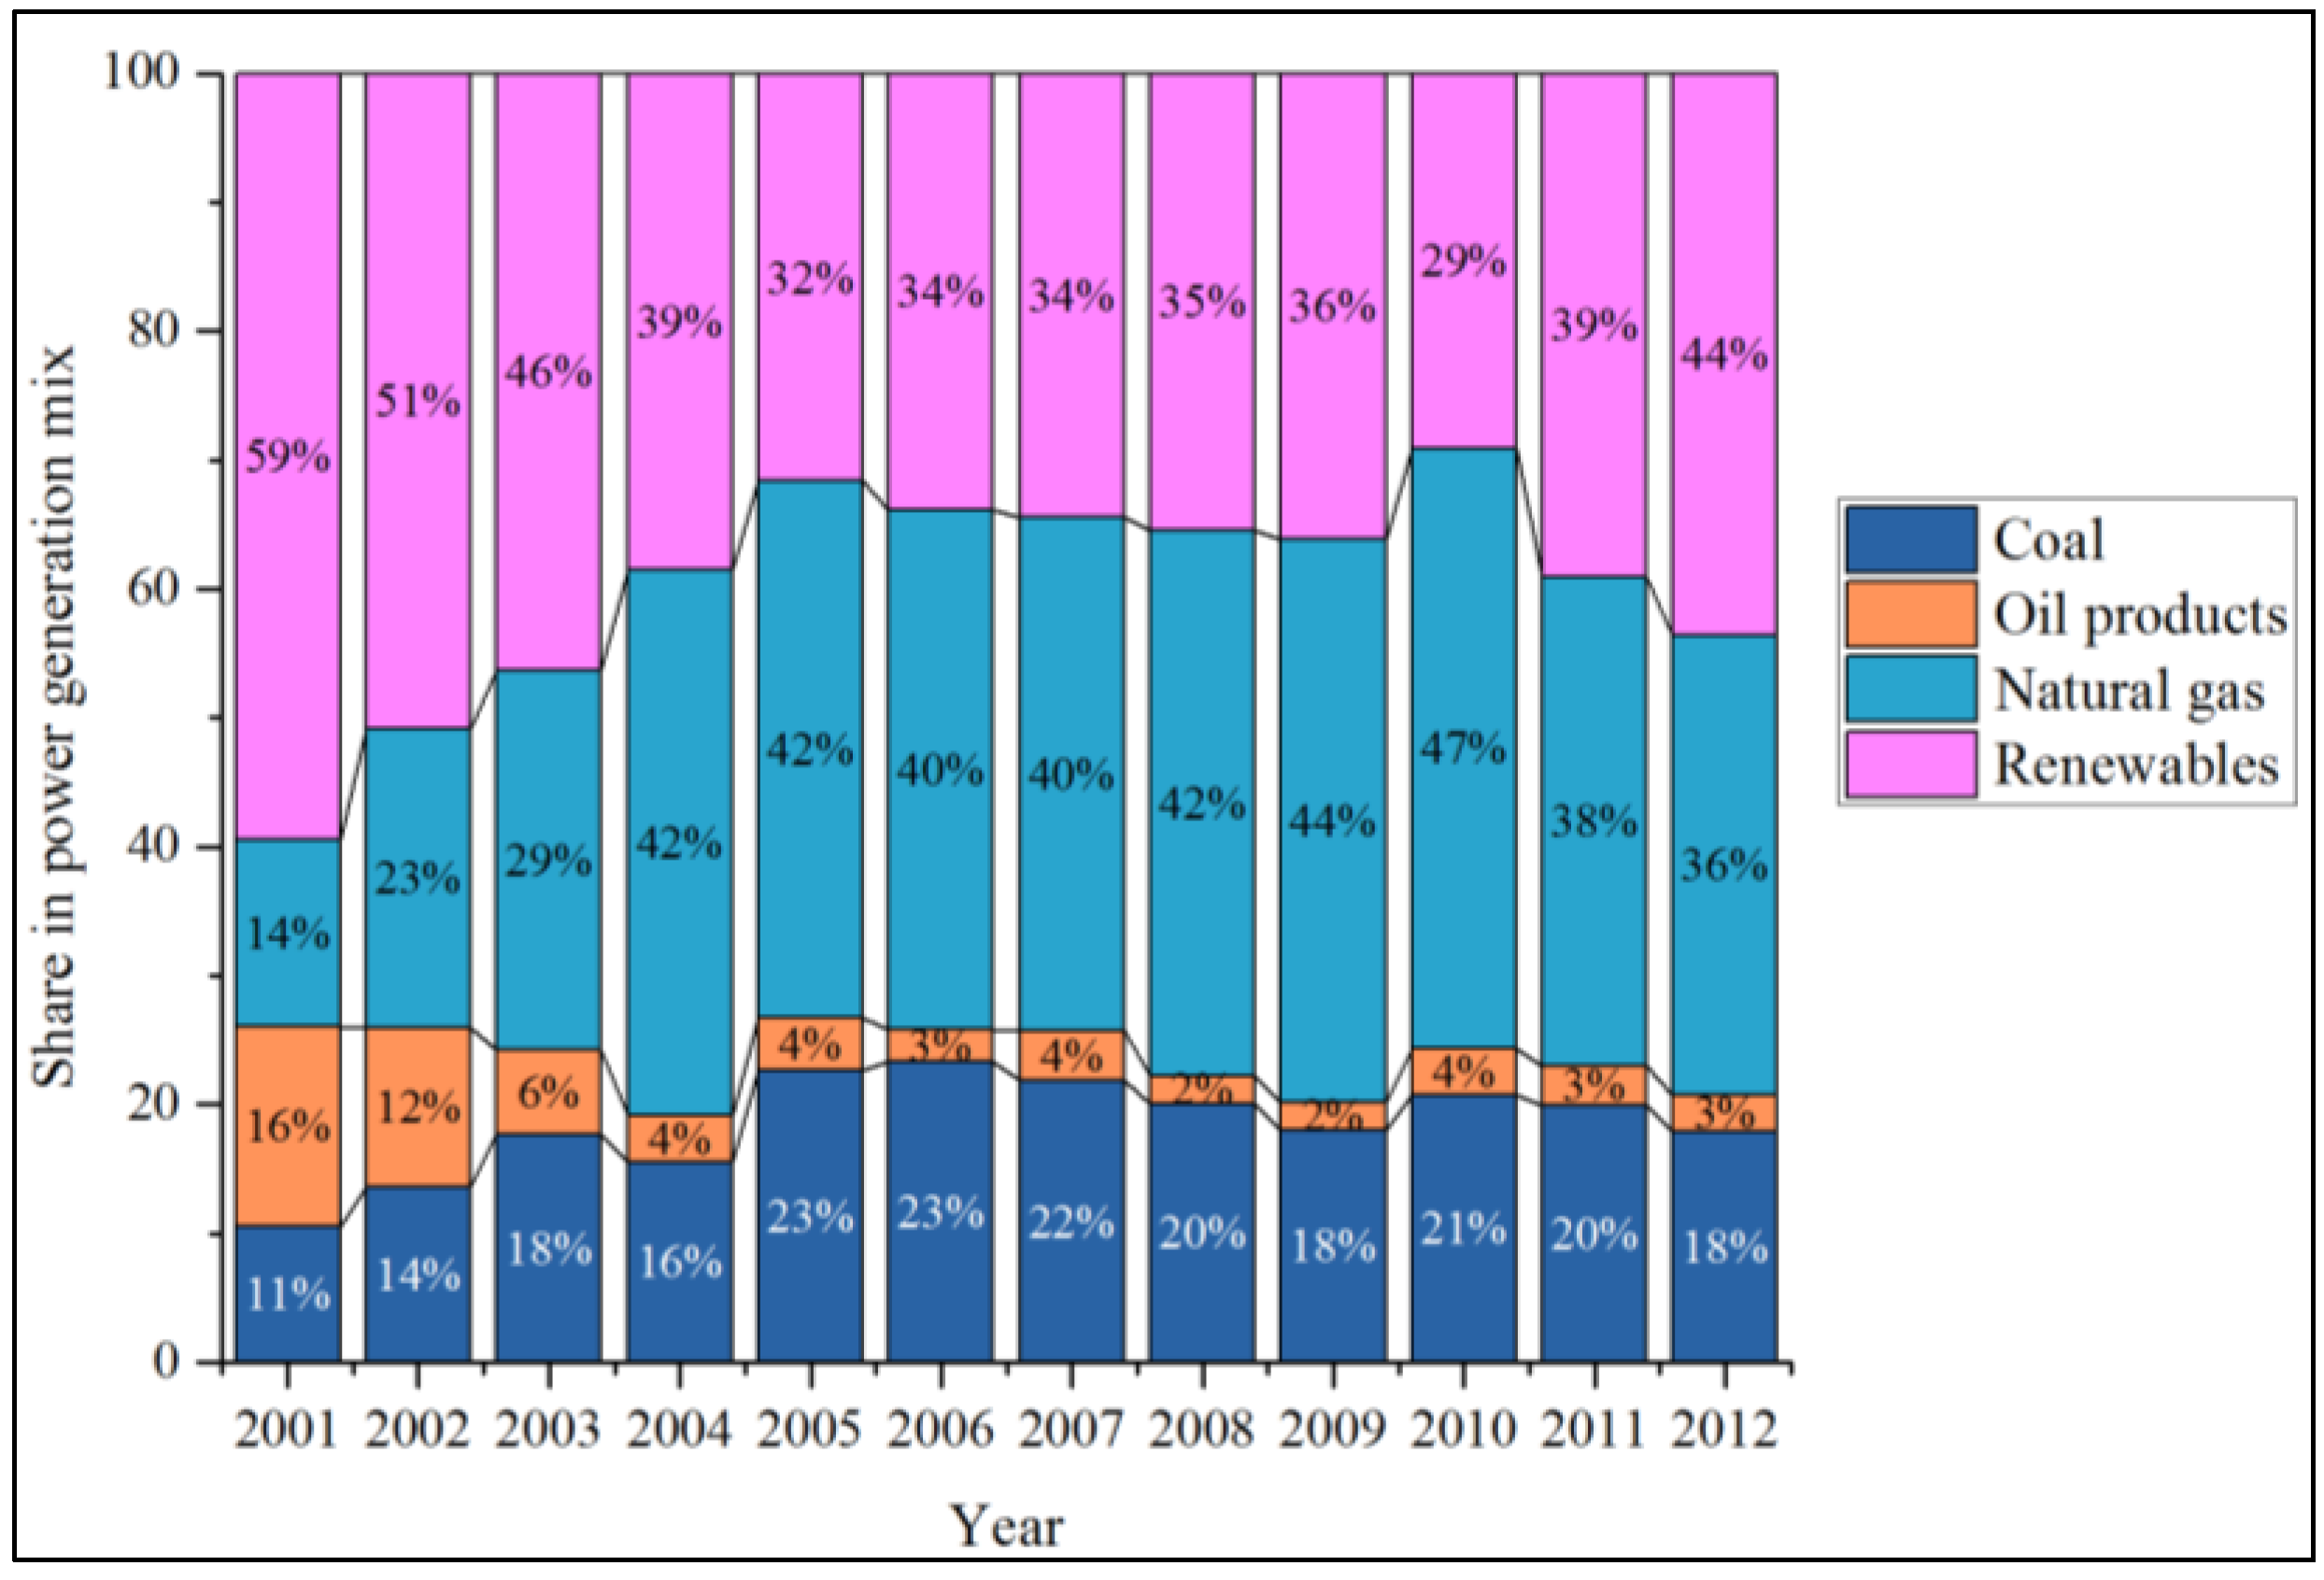
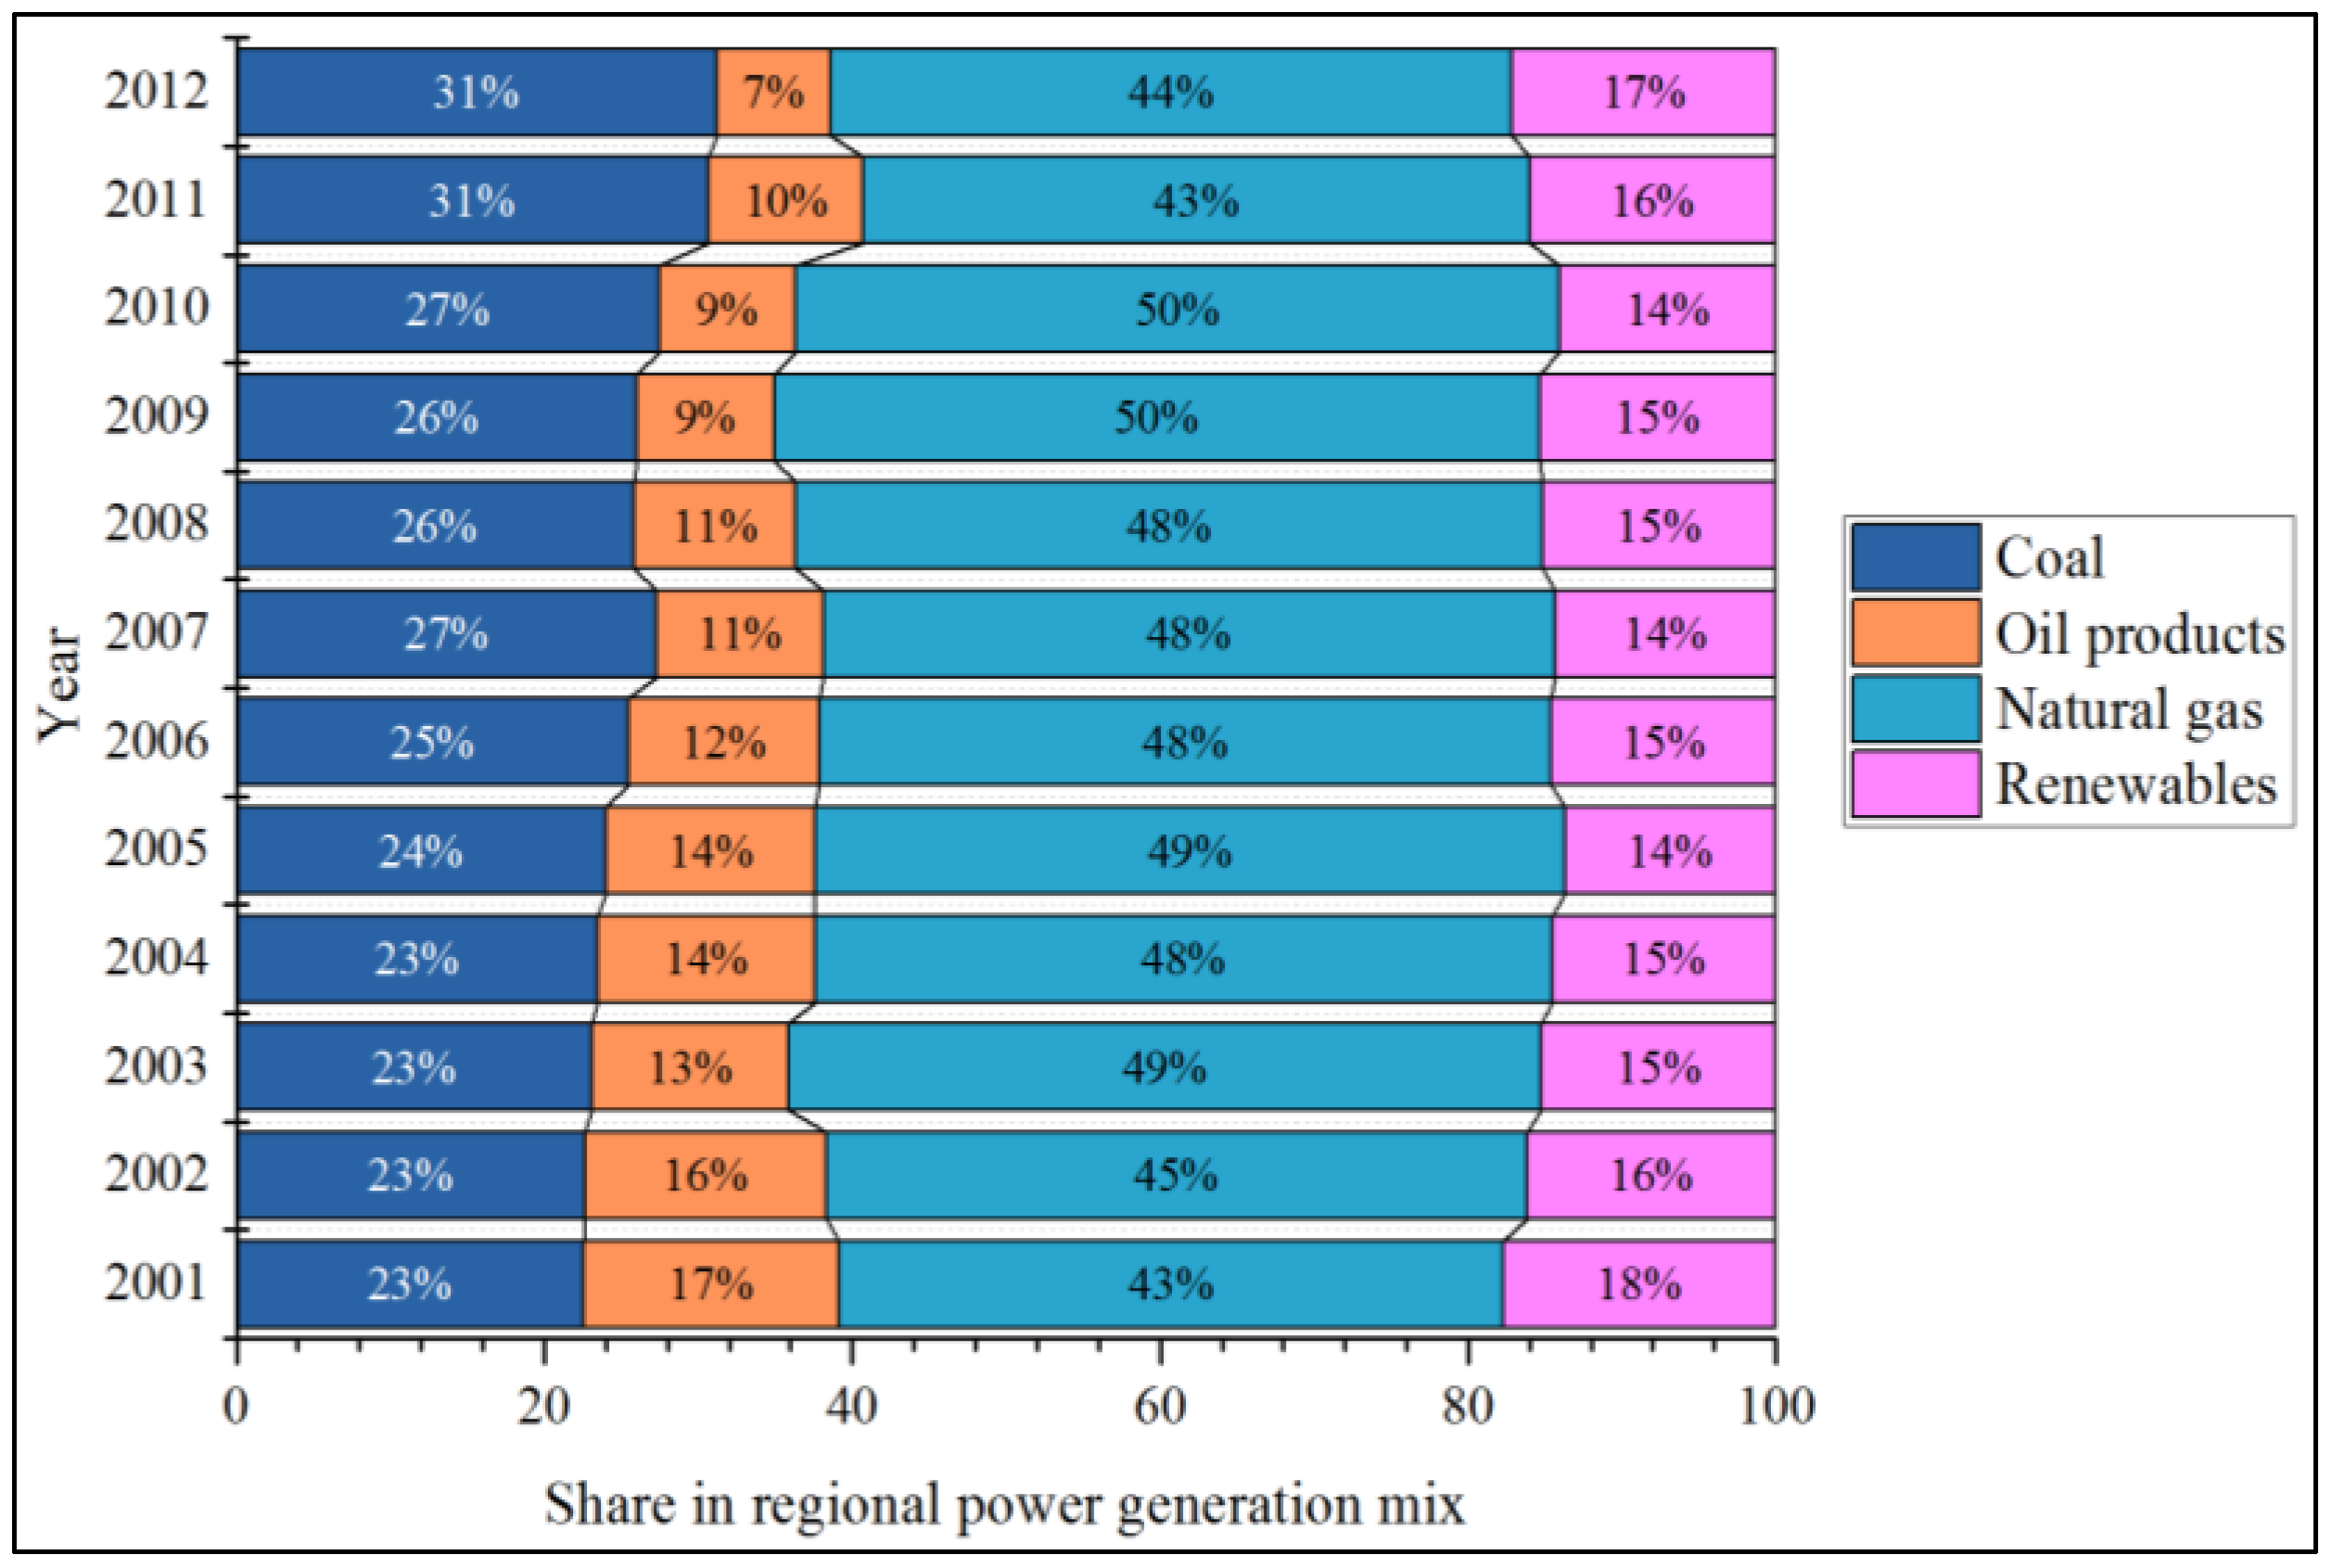
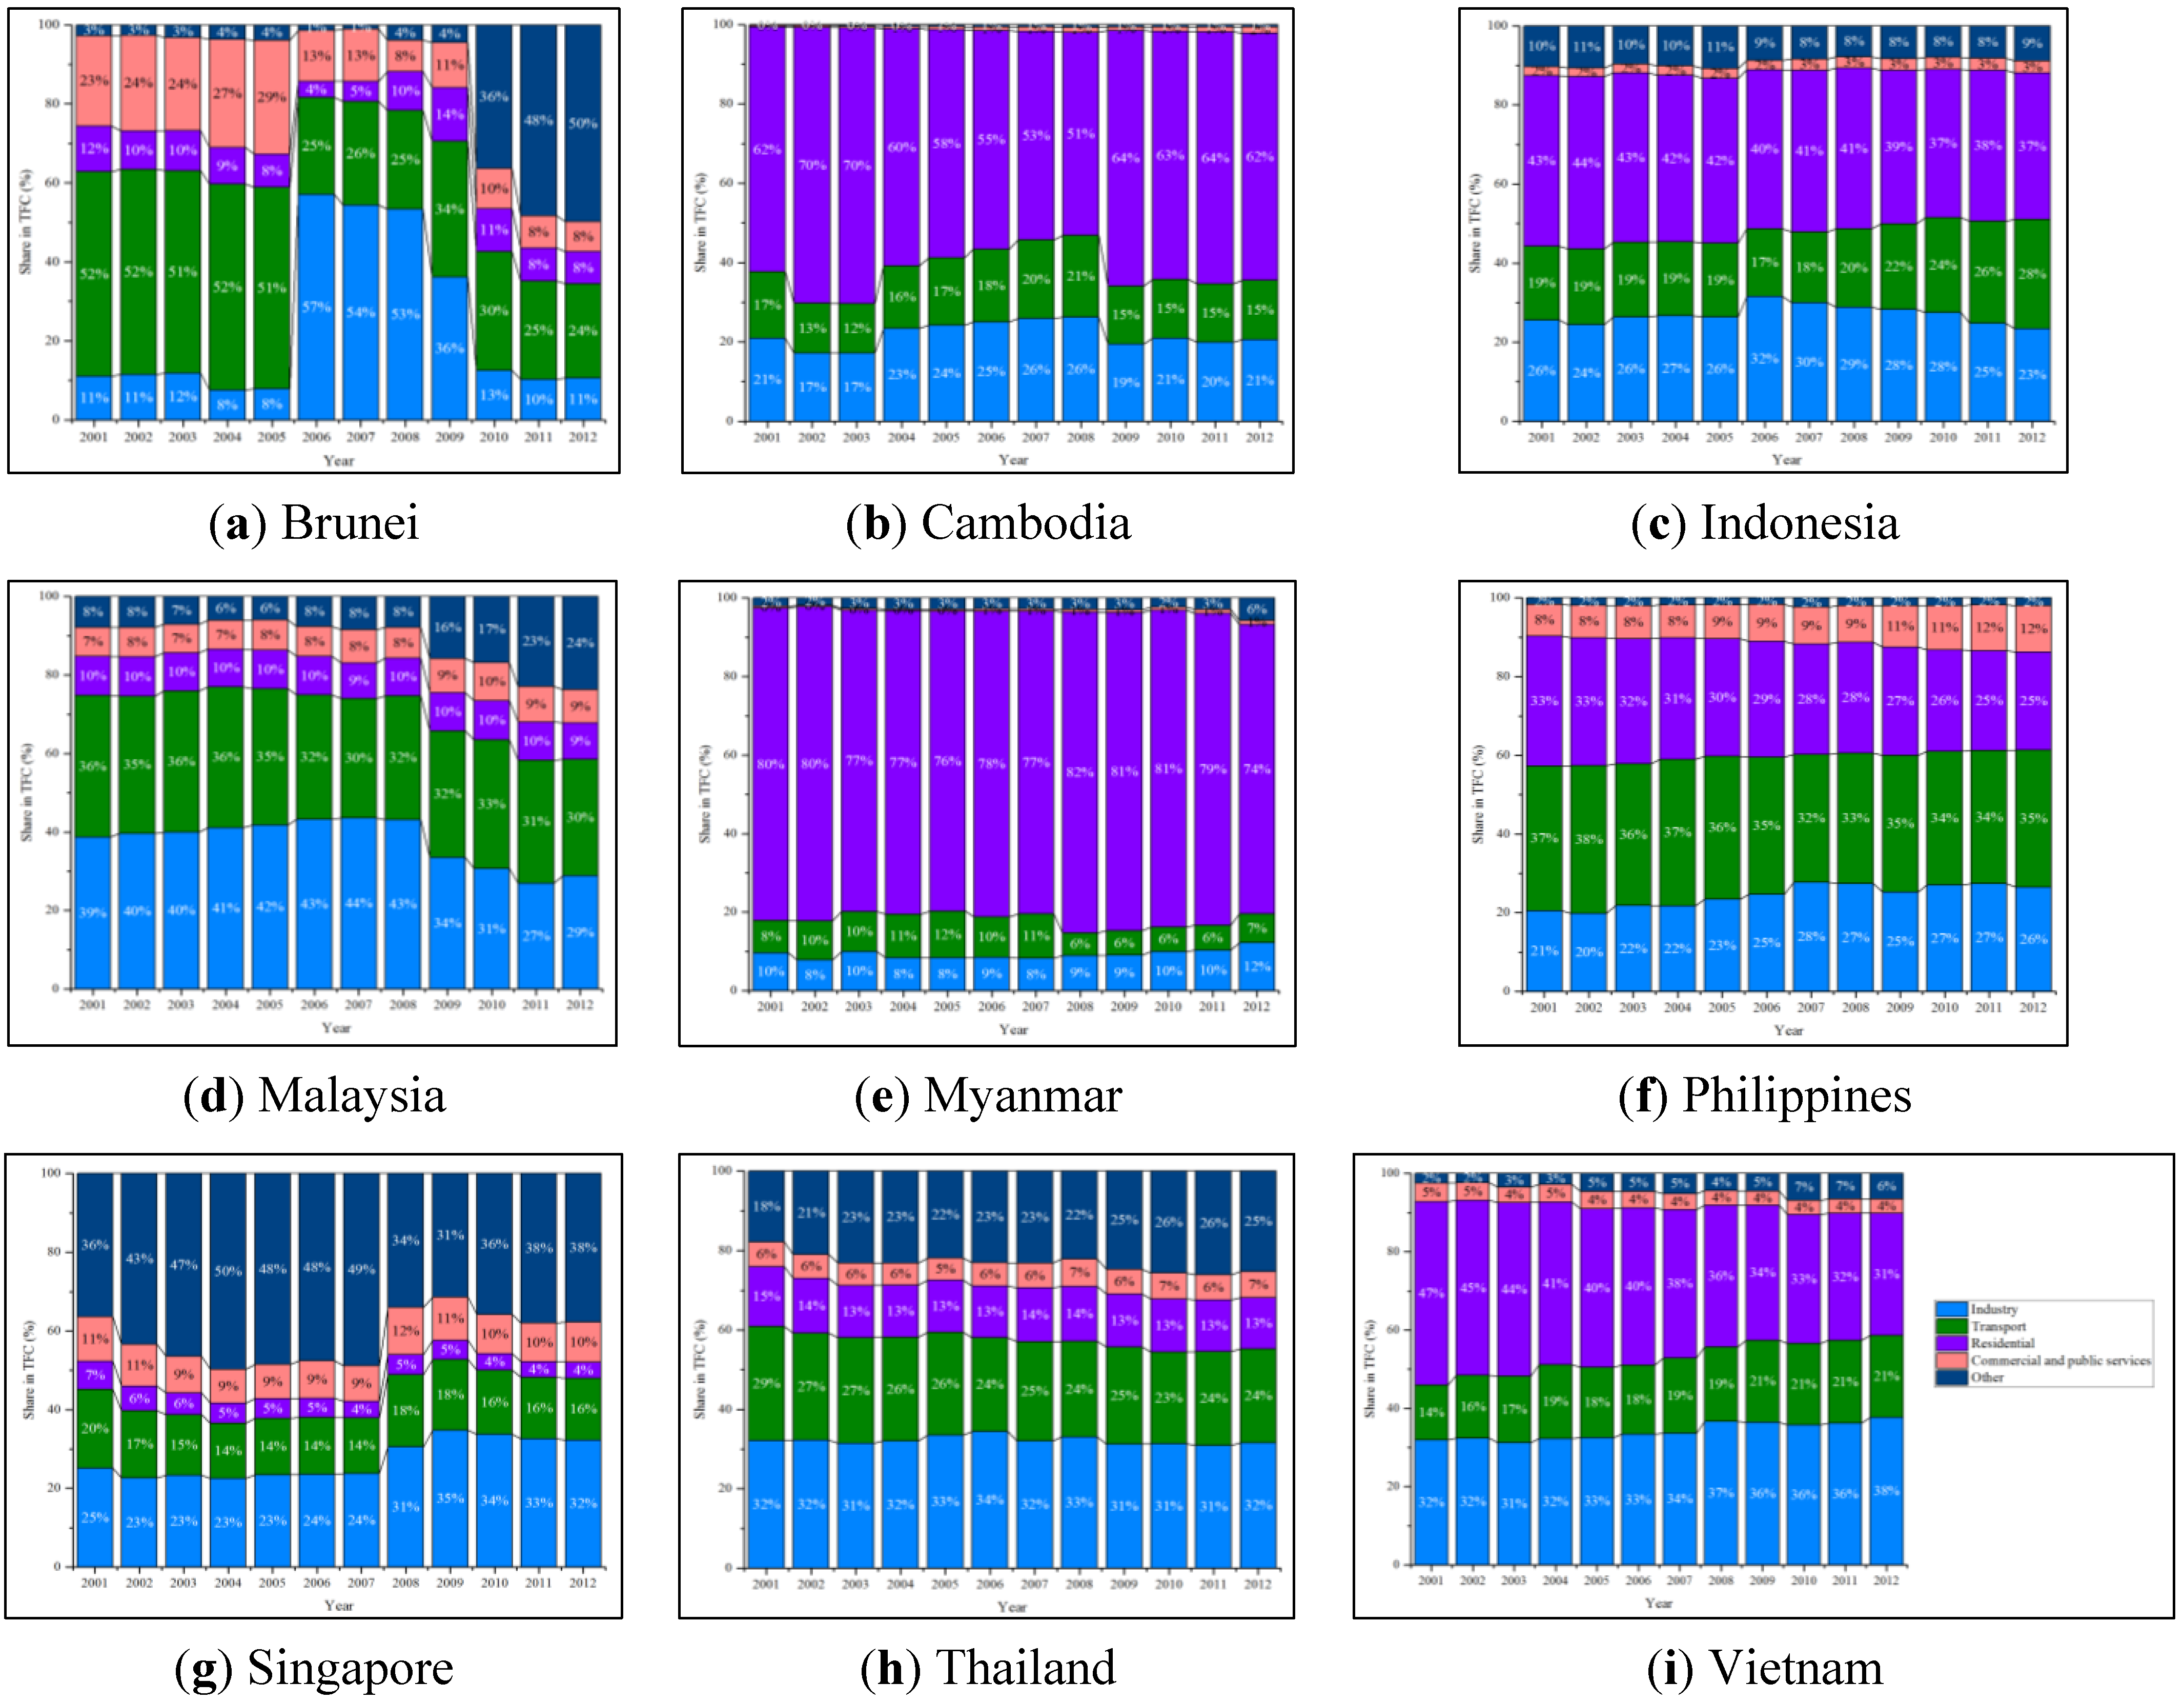
Under the overall energy balance component, three indicators, primary energy mix, power generation mix, and sectoral energy consumption, were selected to show the overview of development and trends of ASEAN energy balances. In the “primary energy mix”, sources referred to in the indicator include coal, crude oil, natural gas, and renewables, whereas sources in the “electricity generation mix” are coal, oil products, natural gas, and renewables. “Sectoral energy consumption” shows how each sector of the economy (industry, transport, residential, commercial and public services, and others) contributes to energy consumption.
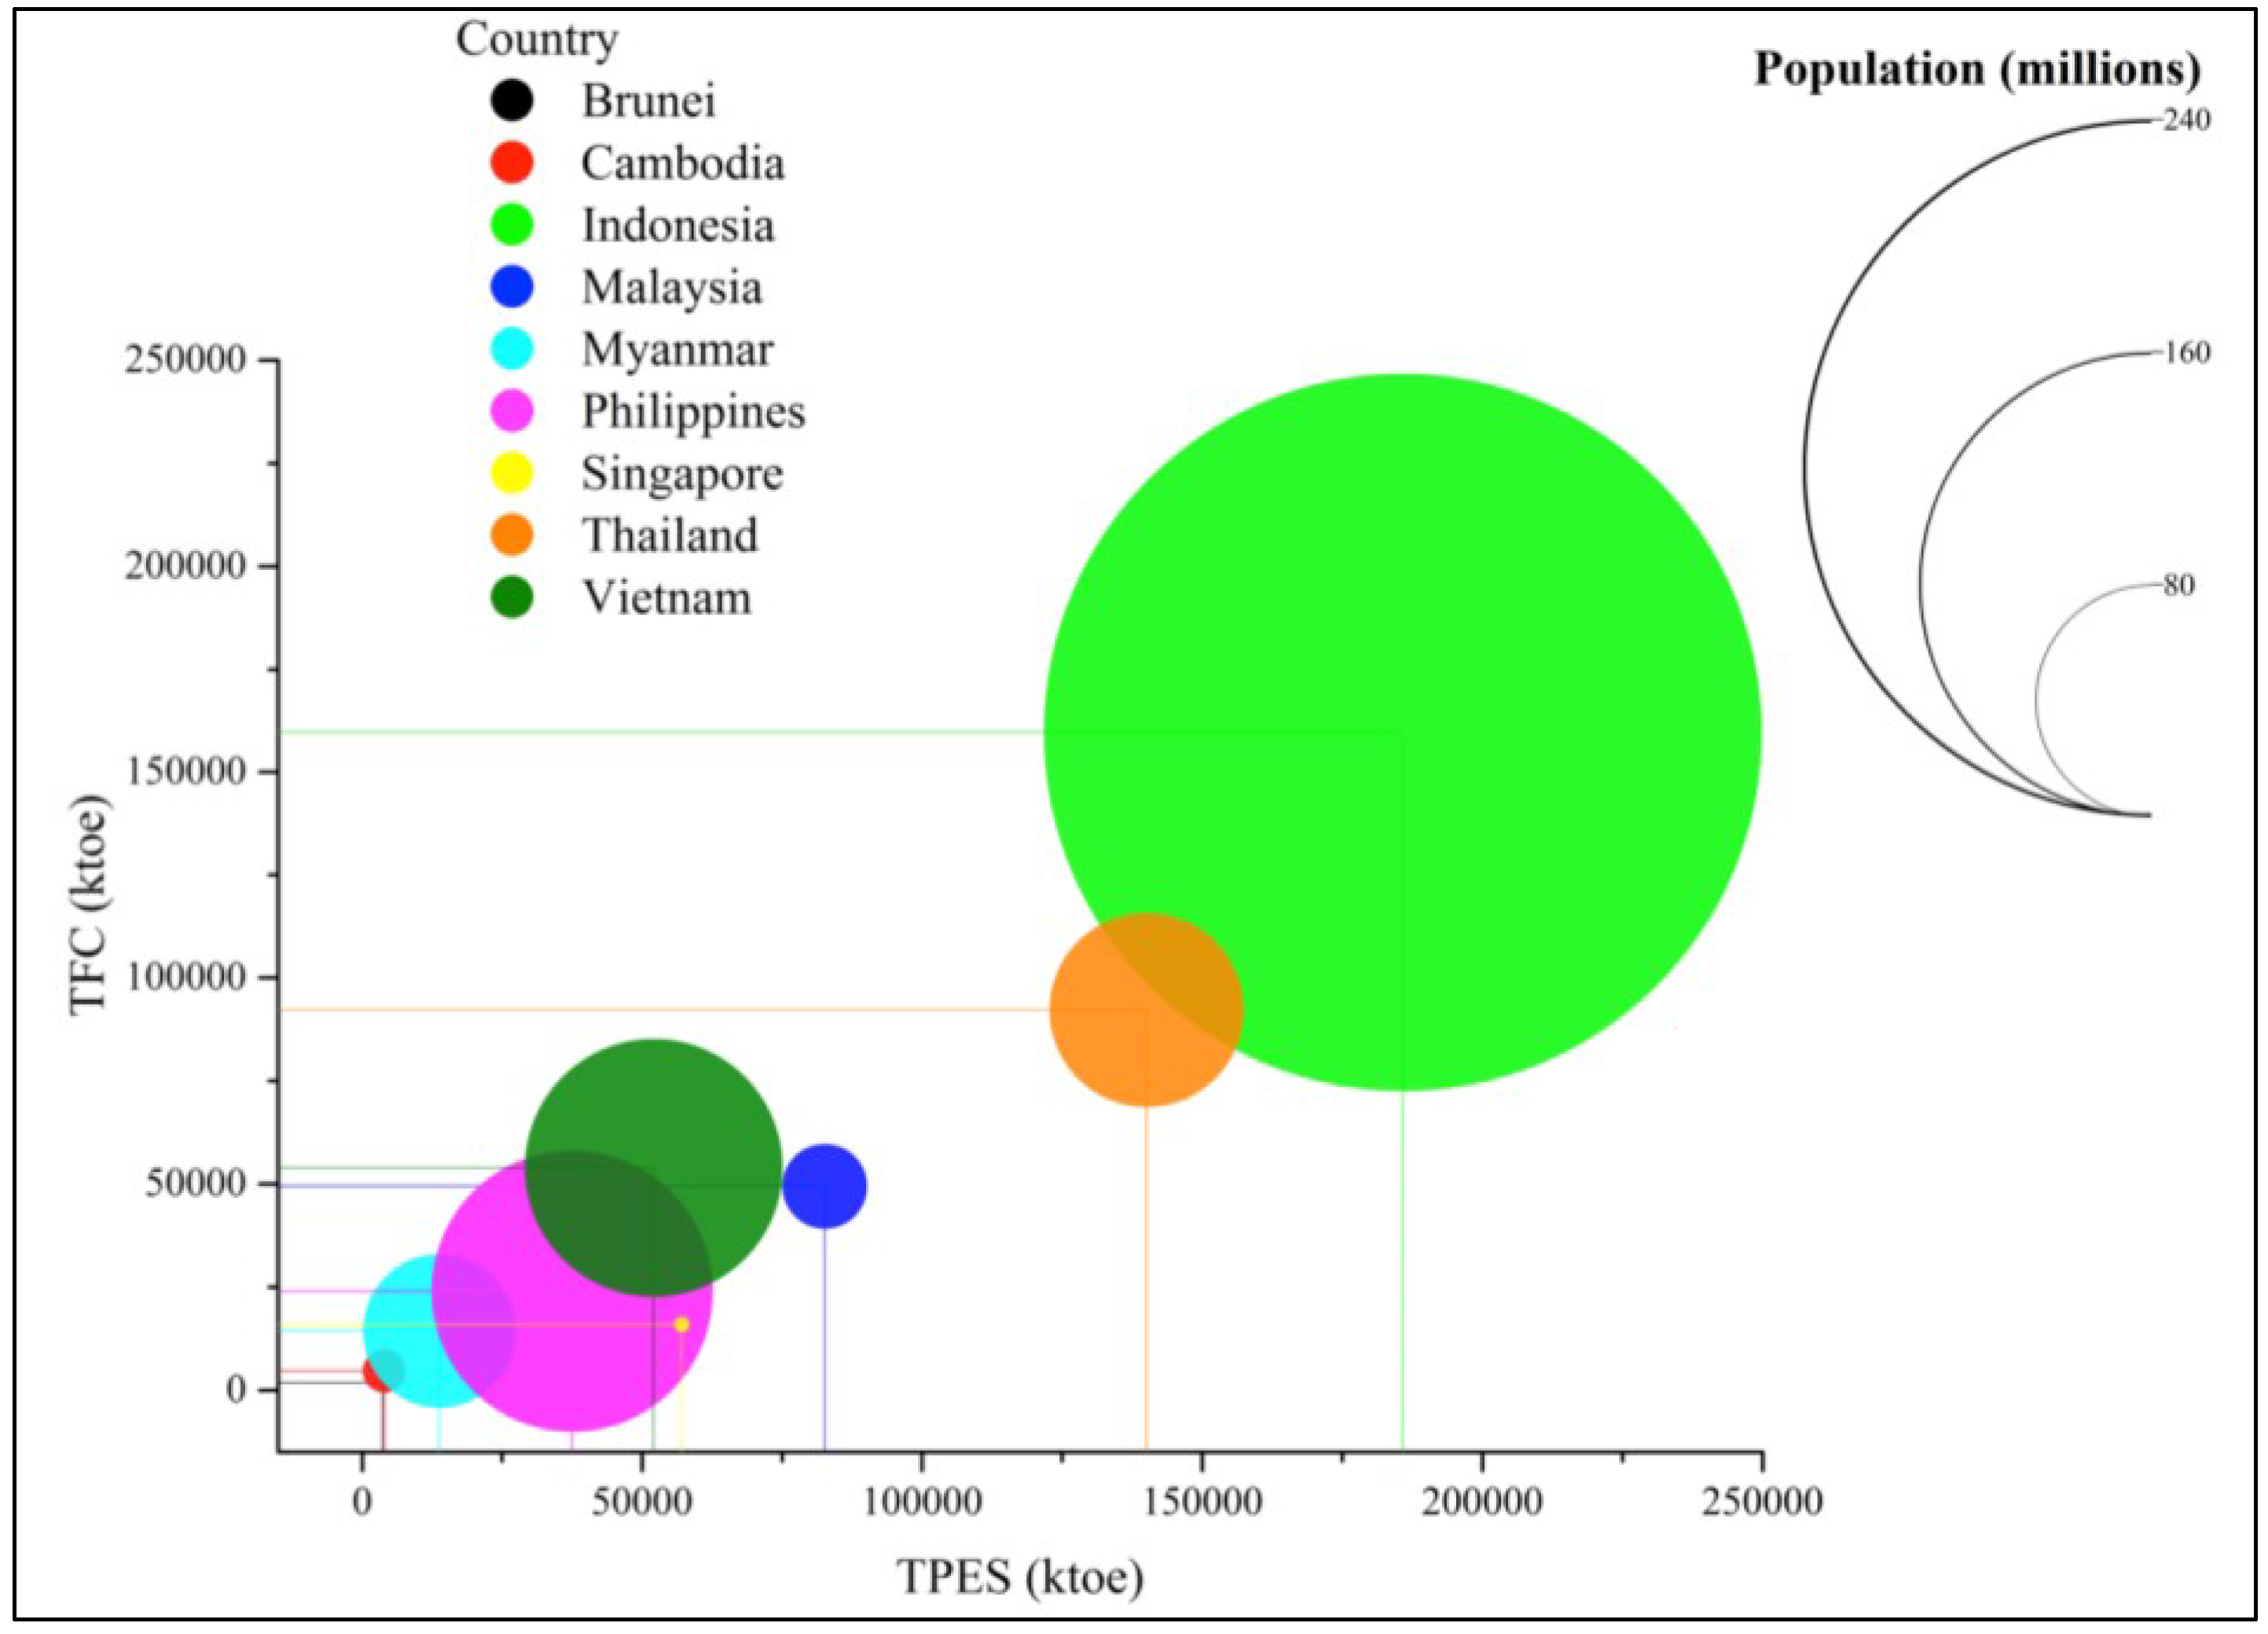
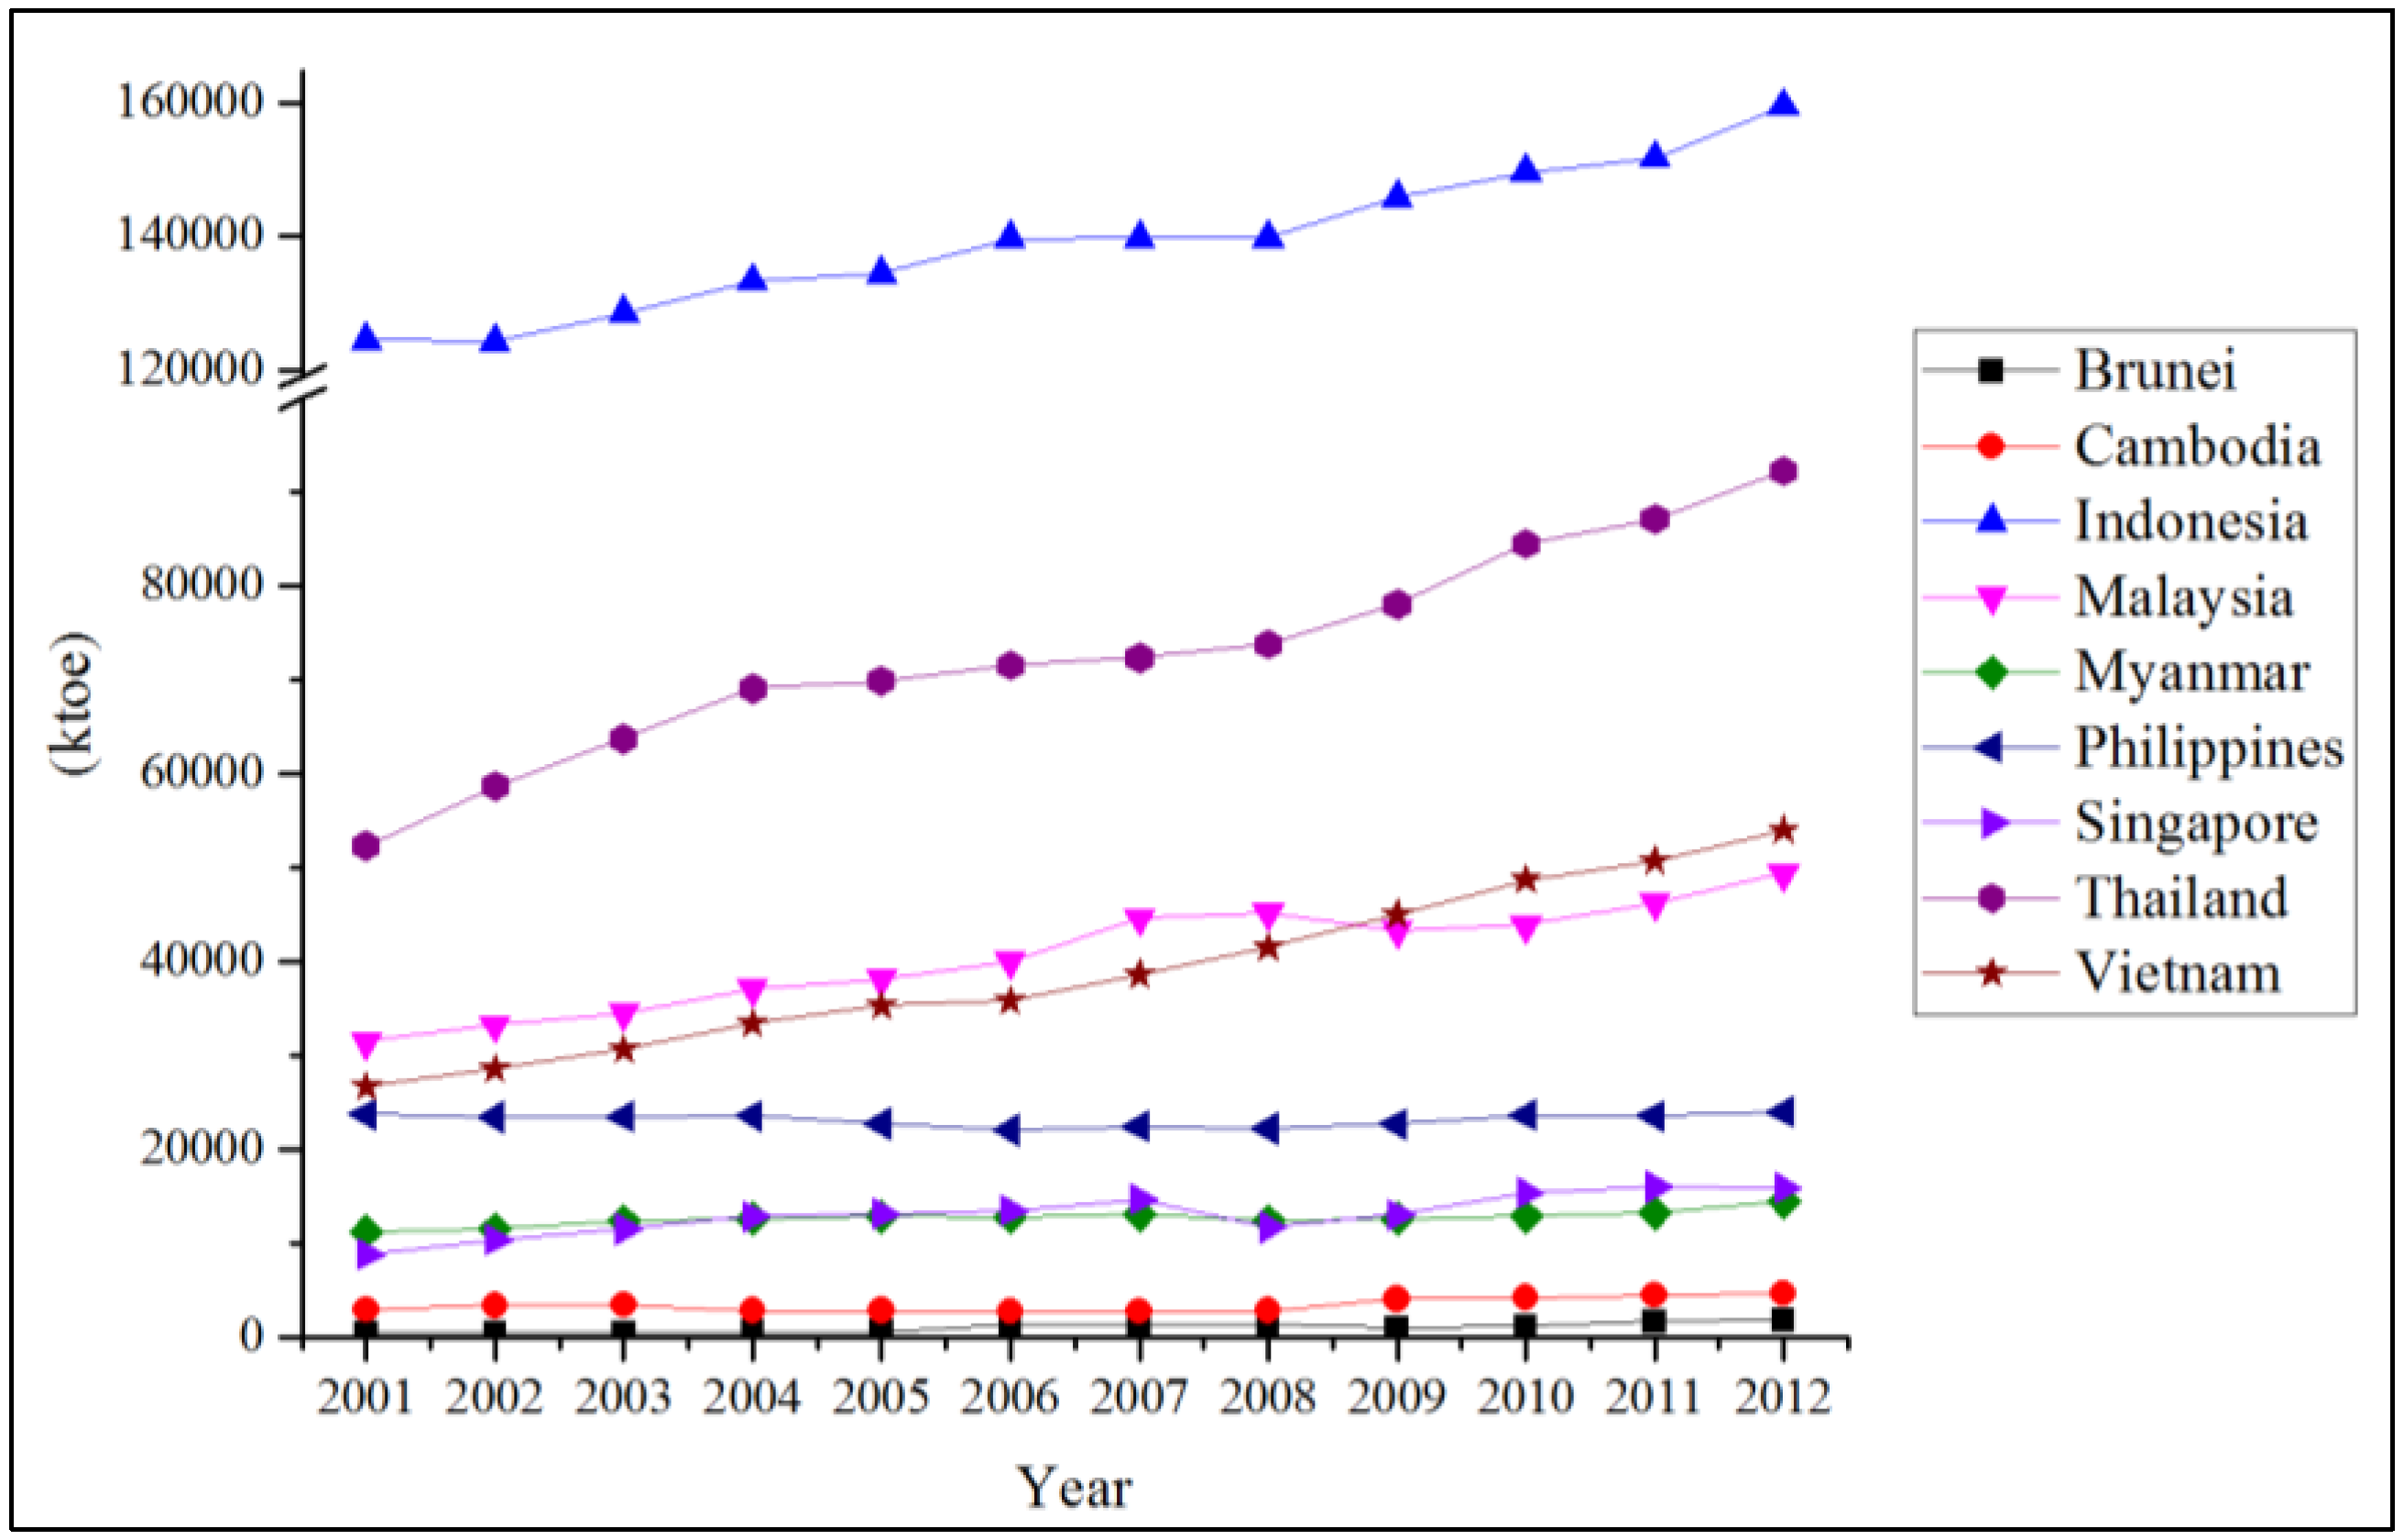
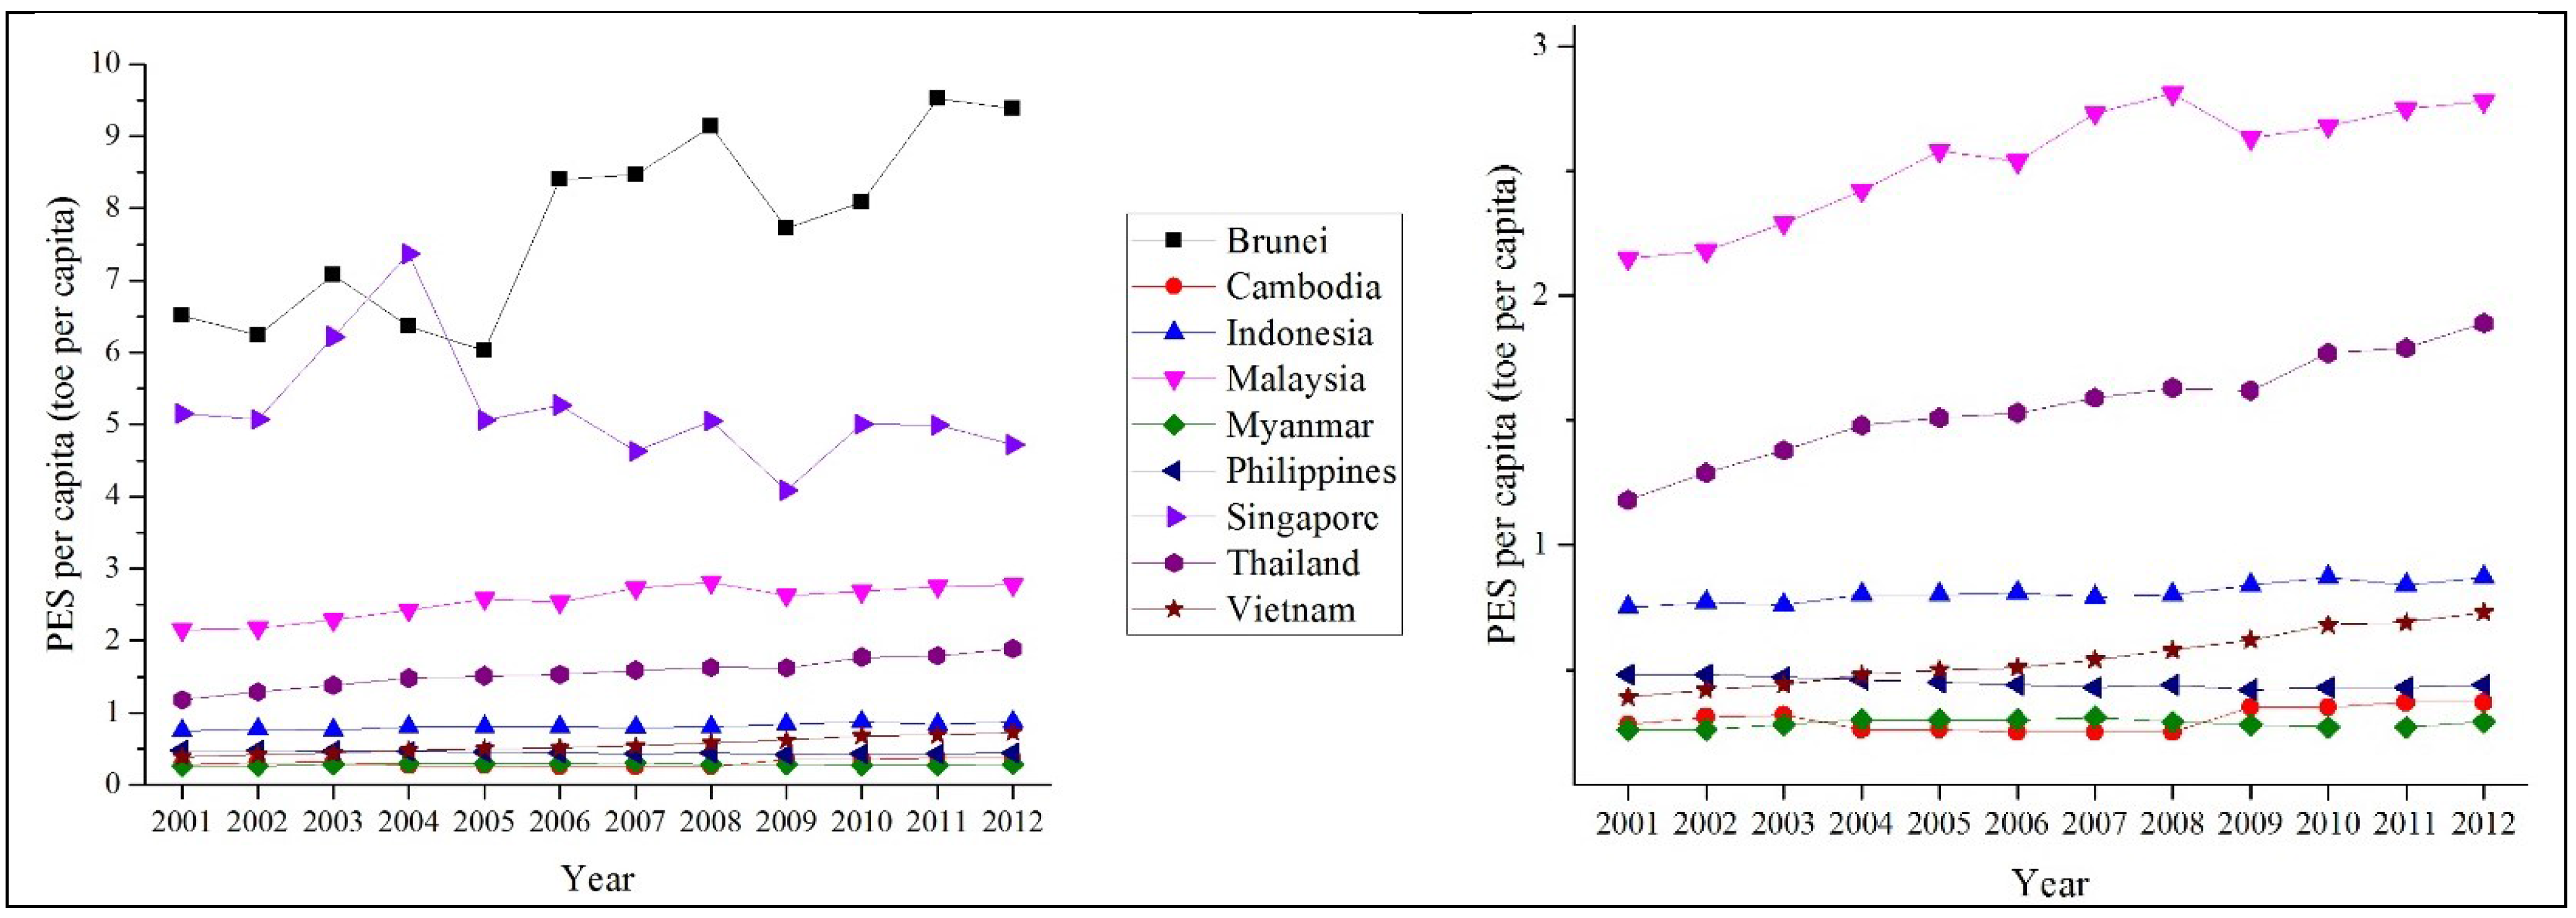
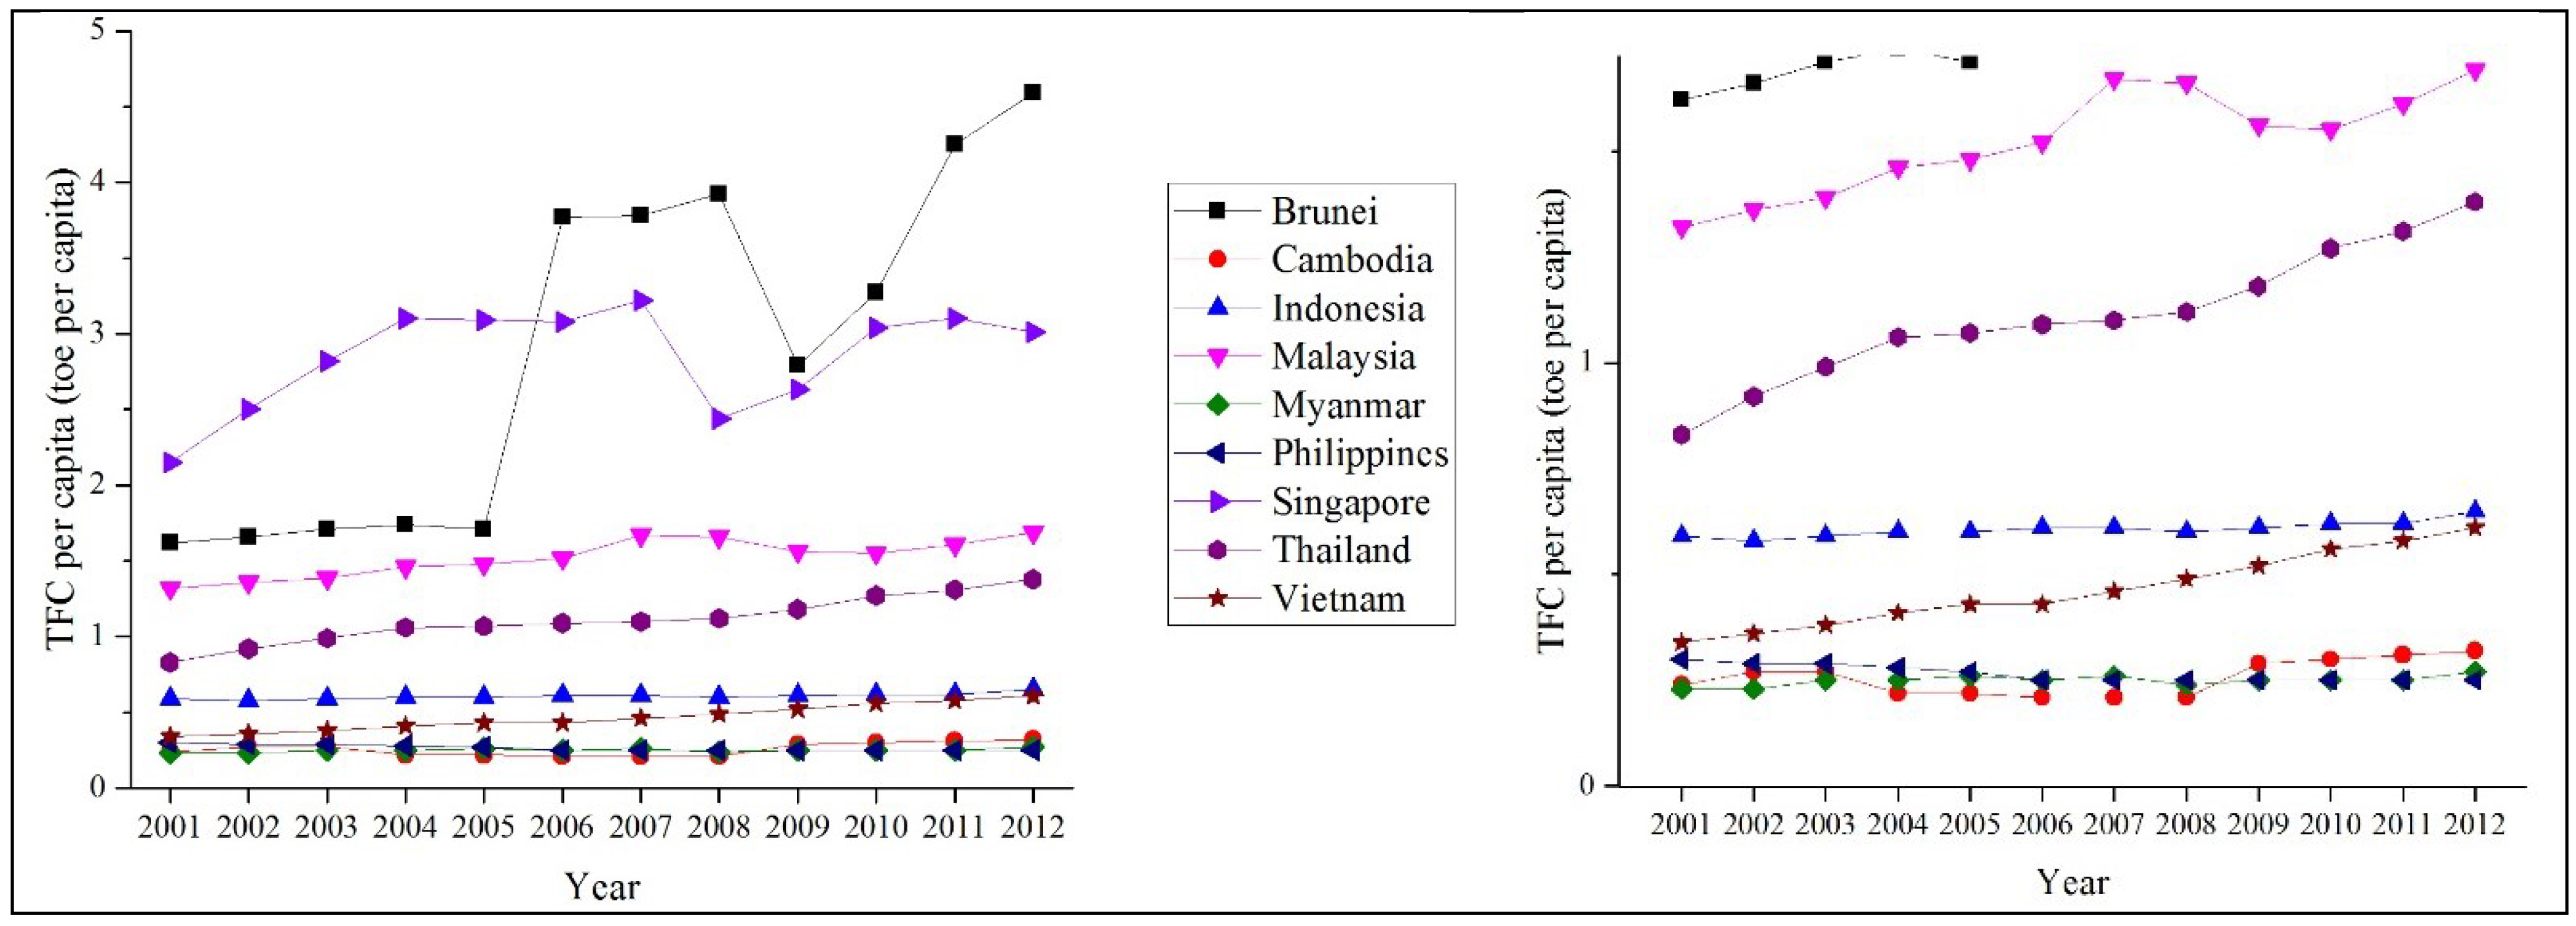
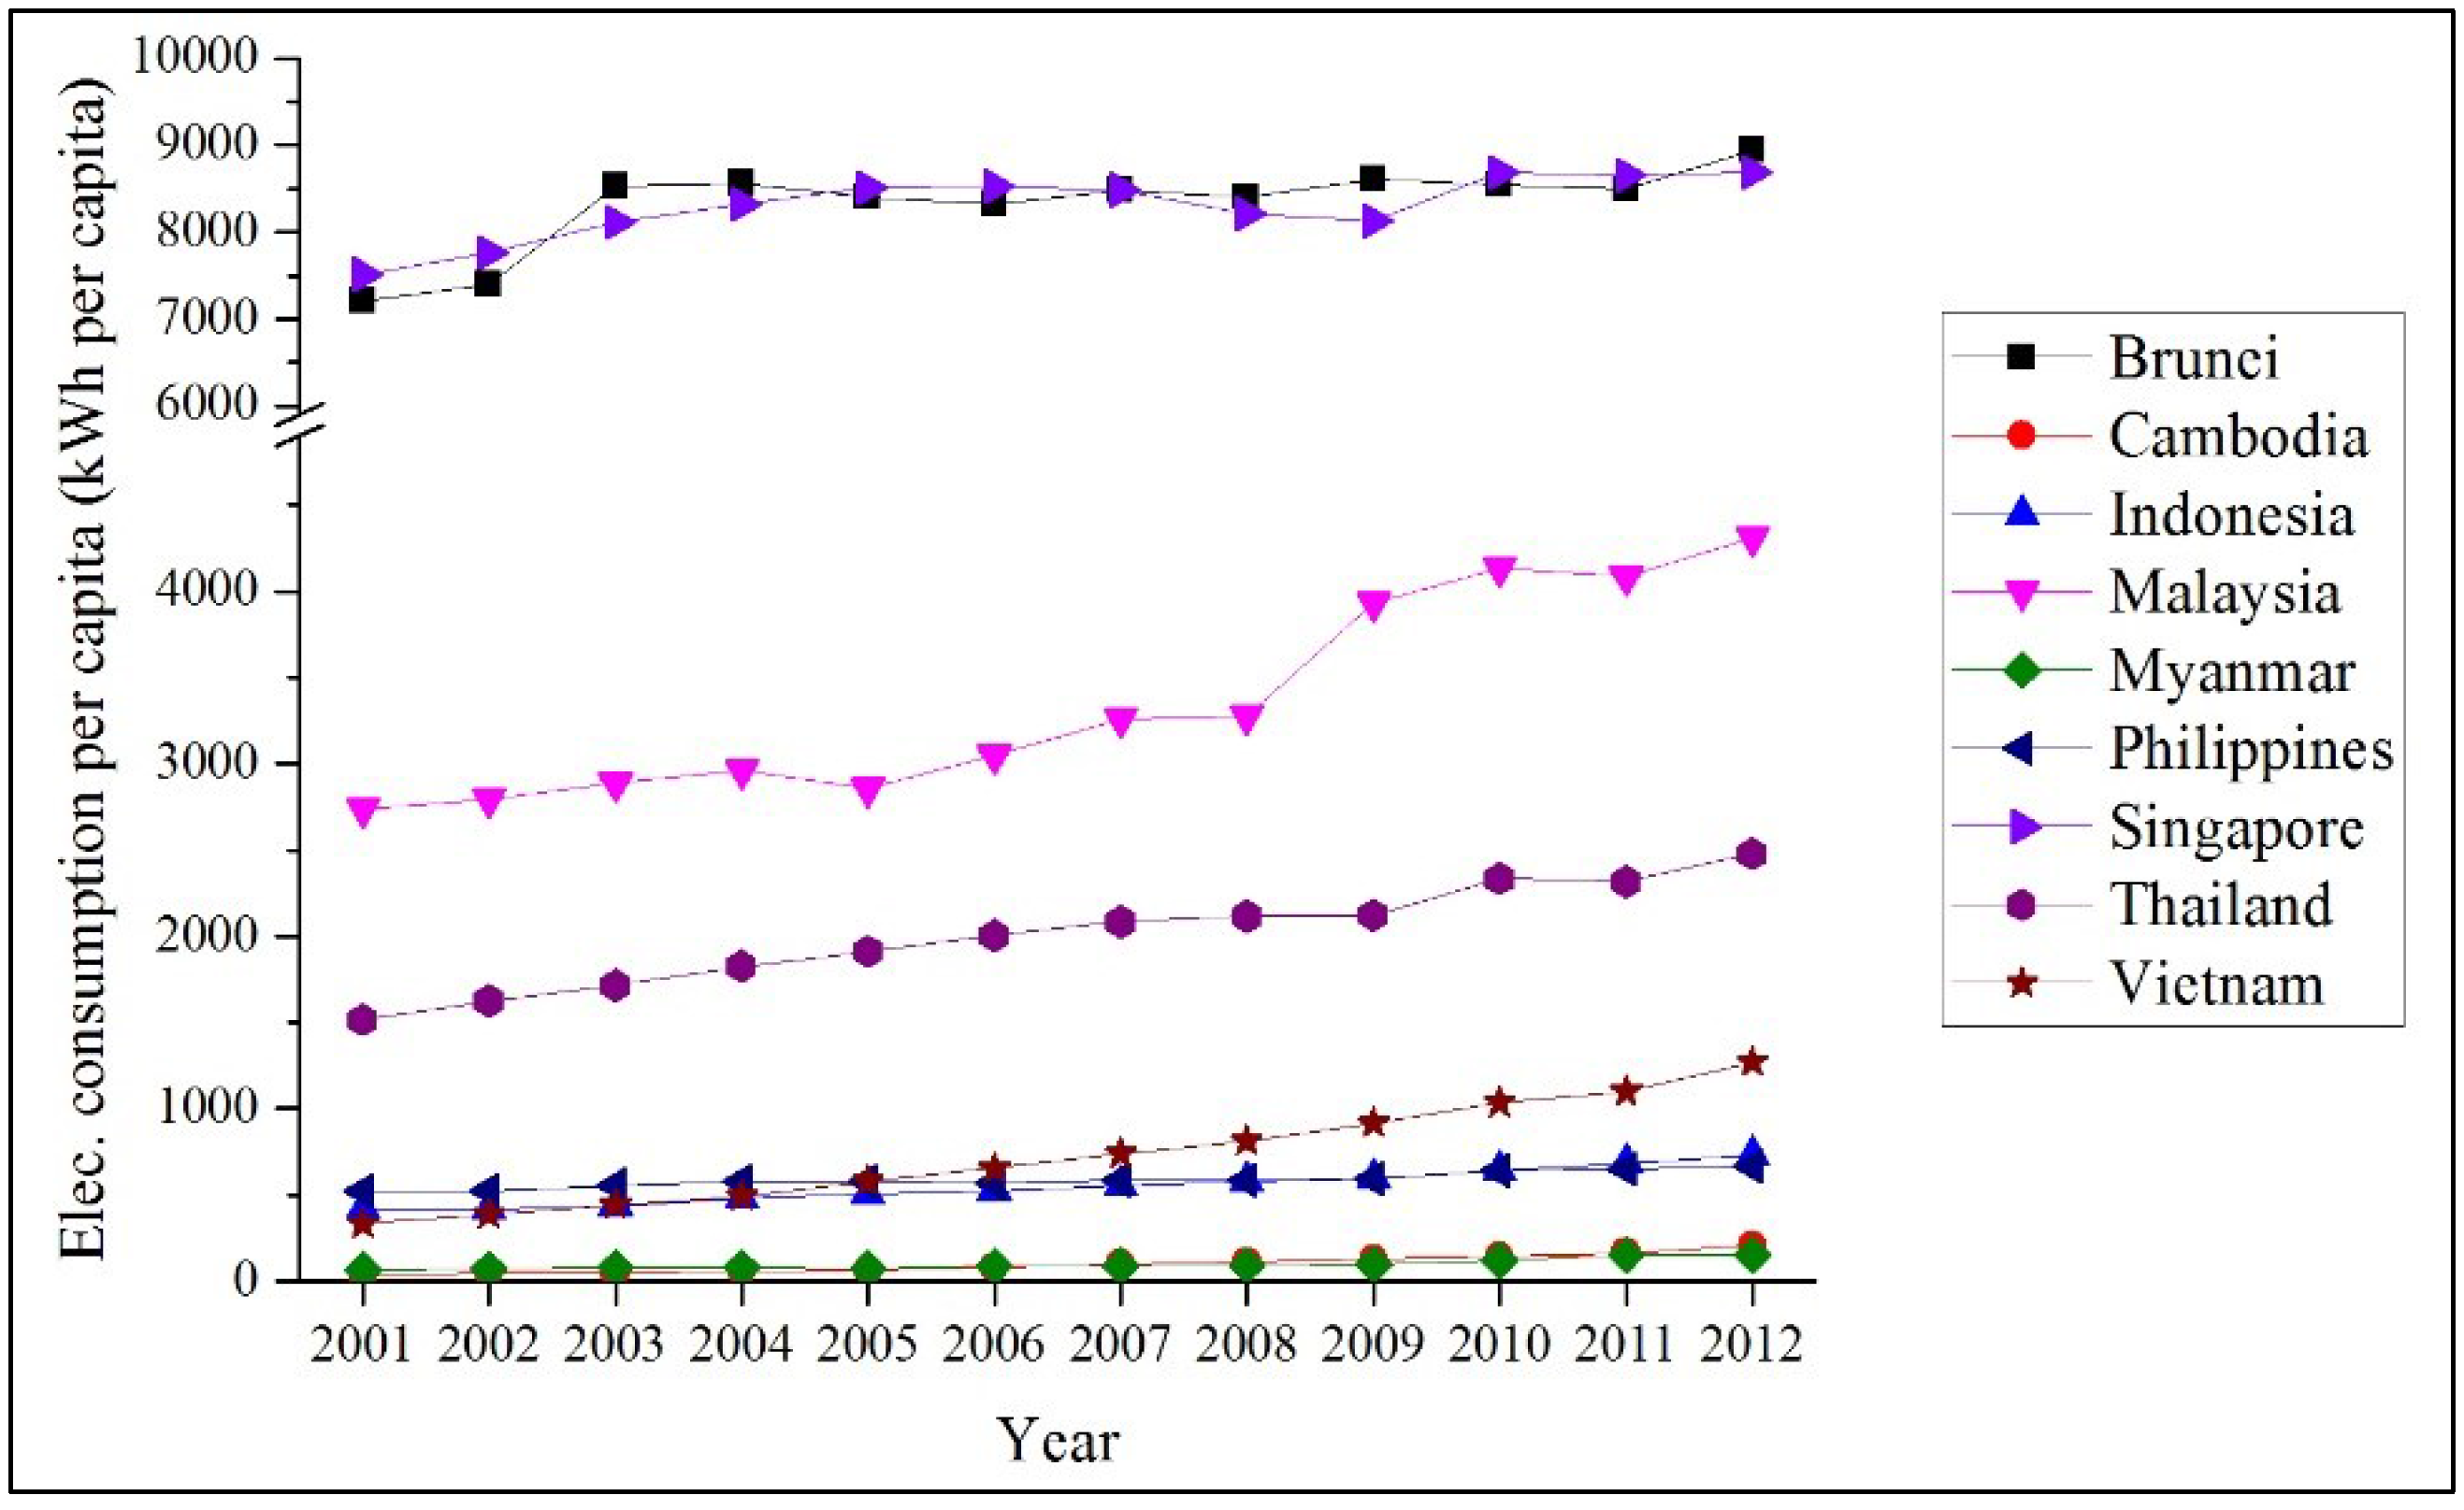
The second component, socio-economic aspect, reflects energy accessibility and efficiency. “Access to electricity”, which is measured through the electrification rate (national and rural), shows to what extent the country has access to modern energy services. It also reflects the security of energy supply from a human-centric perspective. “Total primary energy supply per capita”, “final energy consumption per capita”, and “electricity consumption per capita” reflect the intensity of energy use among the population.
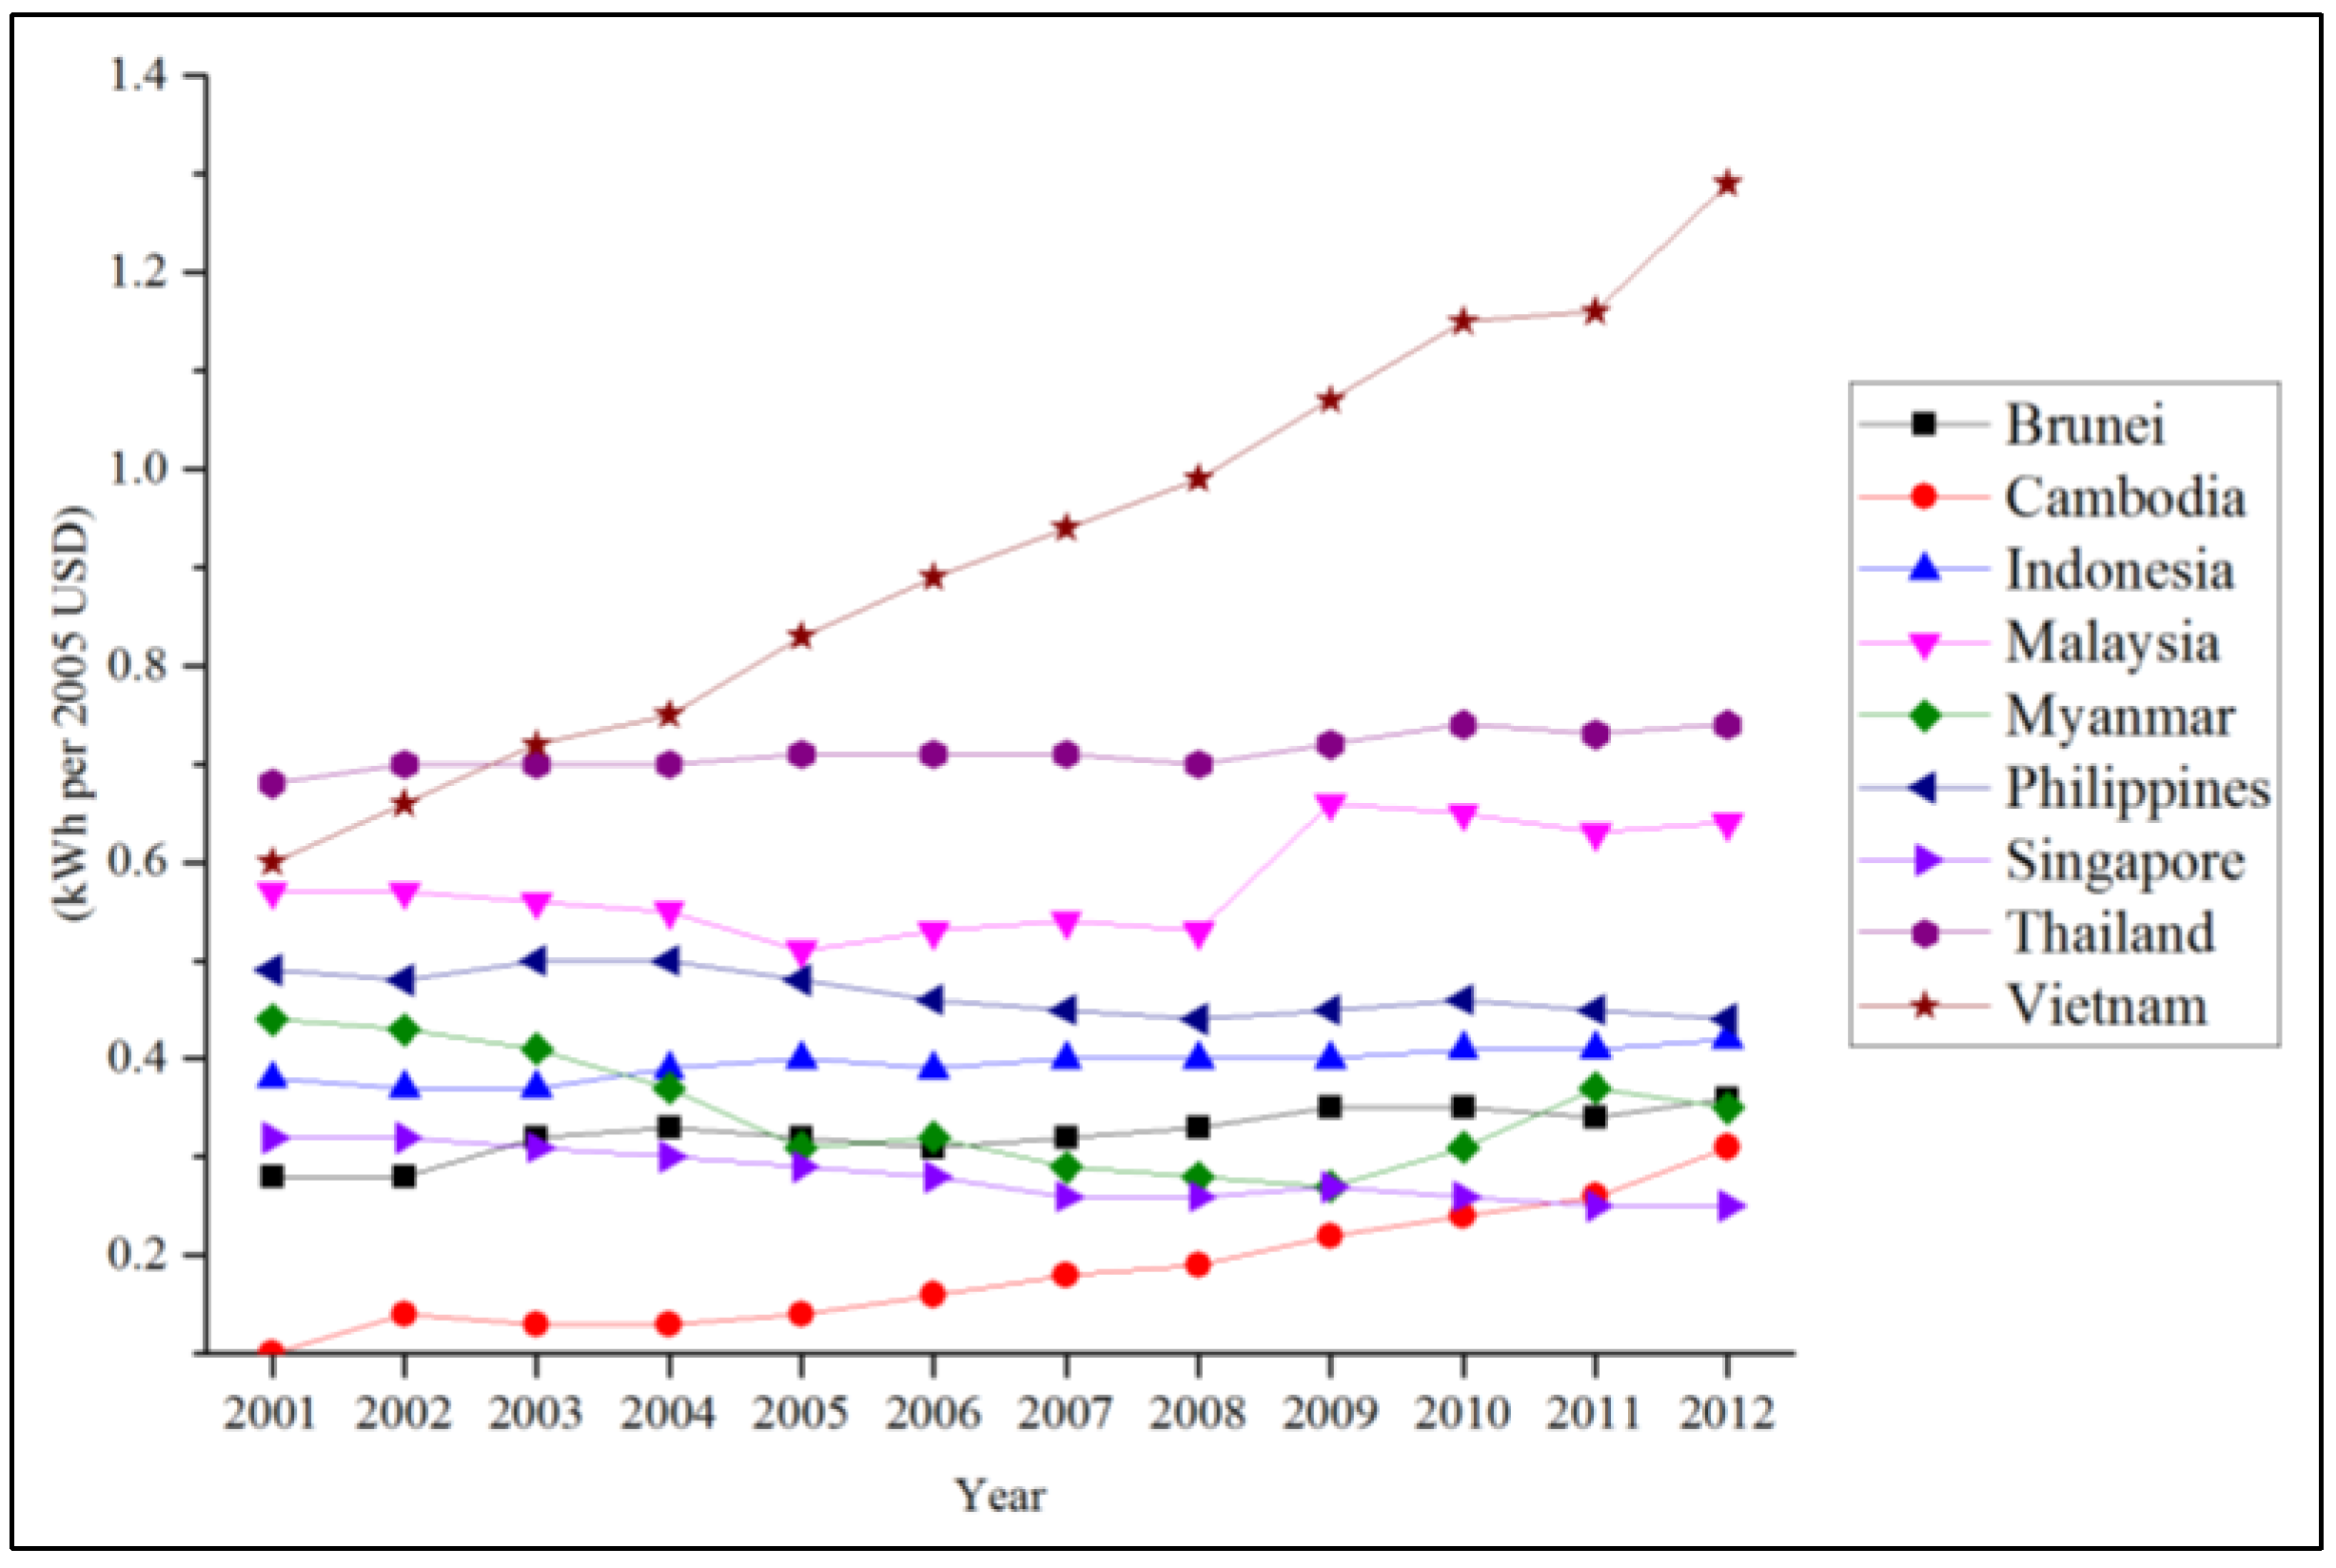
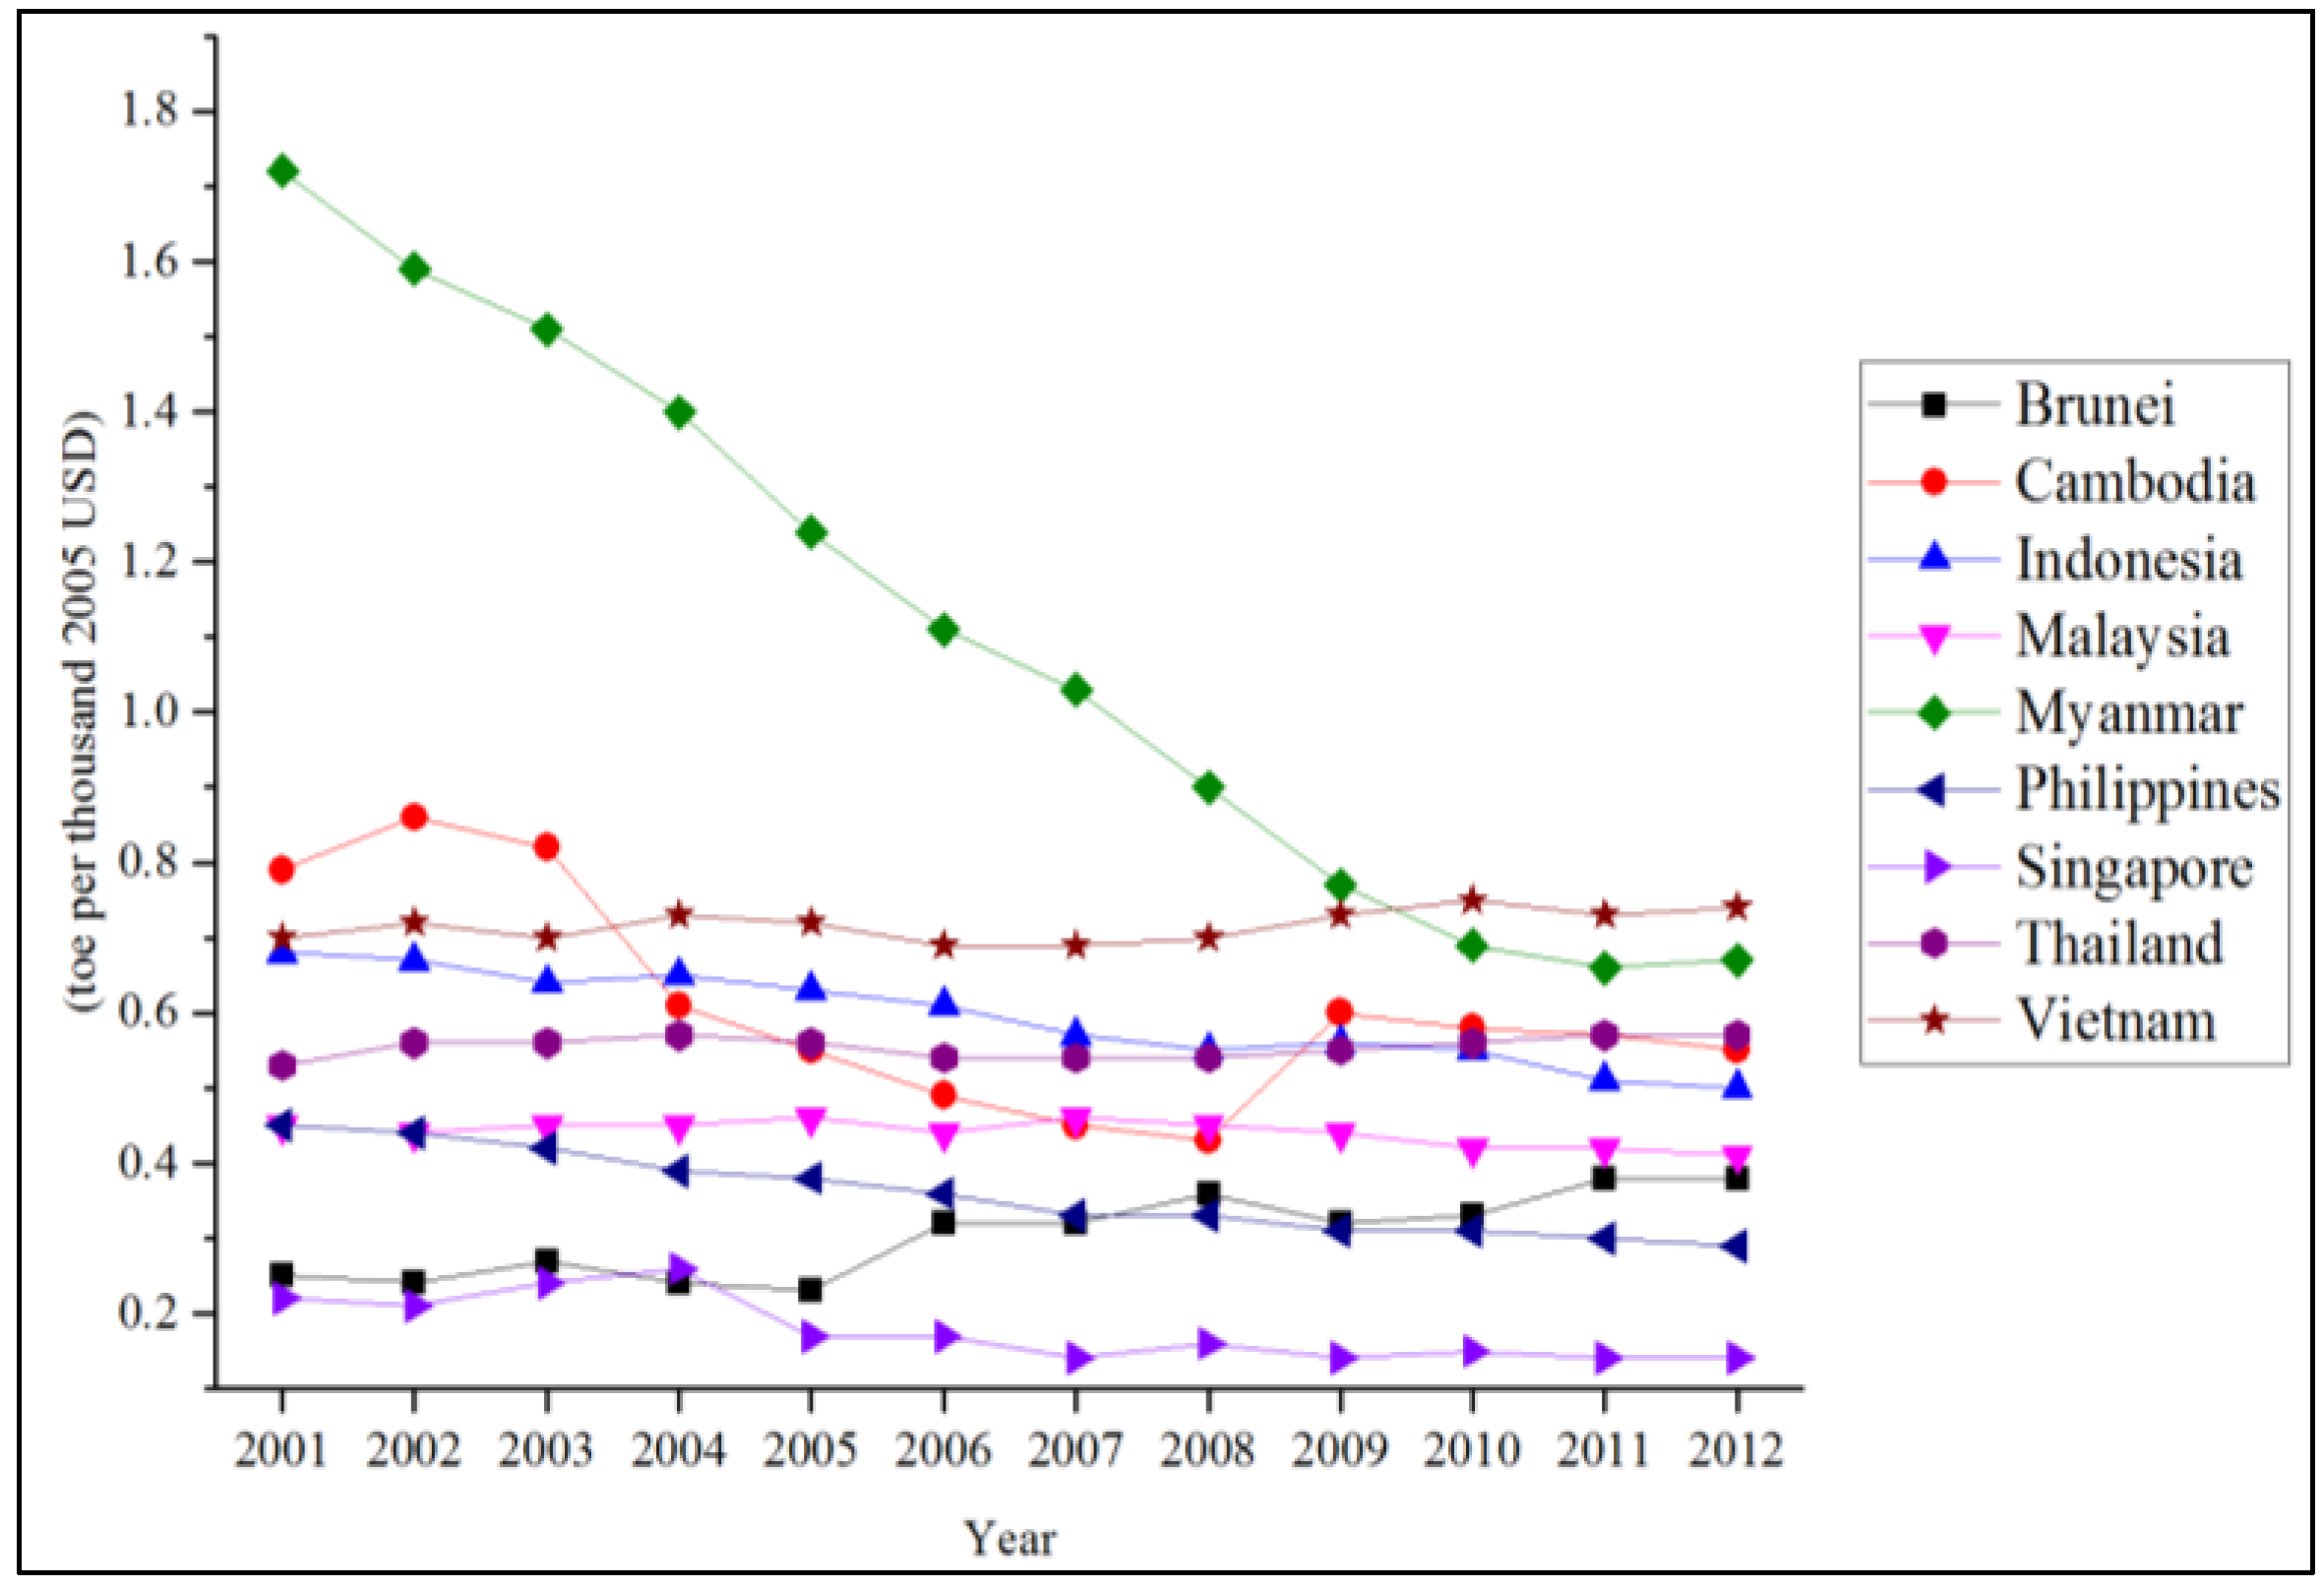
Per capita indicators can be interpreted differently depending on the context. For countries with energy poverty problems, higher energy and electricity consumption per capita would mean better accessibility to energy for the people. For countries that hit a plateau of energy infrastructure development, a lower indicator could indicate energy efficiency. These four indicators highlight the energy demand of the country while indicators on energy efficiency assess the management of energy demand. Energy efficiency of the economy was measured by “primary energy supply intensity”, “energy consumption intensity”, and “electricity consumption intensity”, showing the amount of energy/electricity consumed to produce certain units of GDP. This indicator shows the energy efficiency of the economy. A lower value of energy intensity refers to a higher energy efficiency.
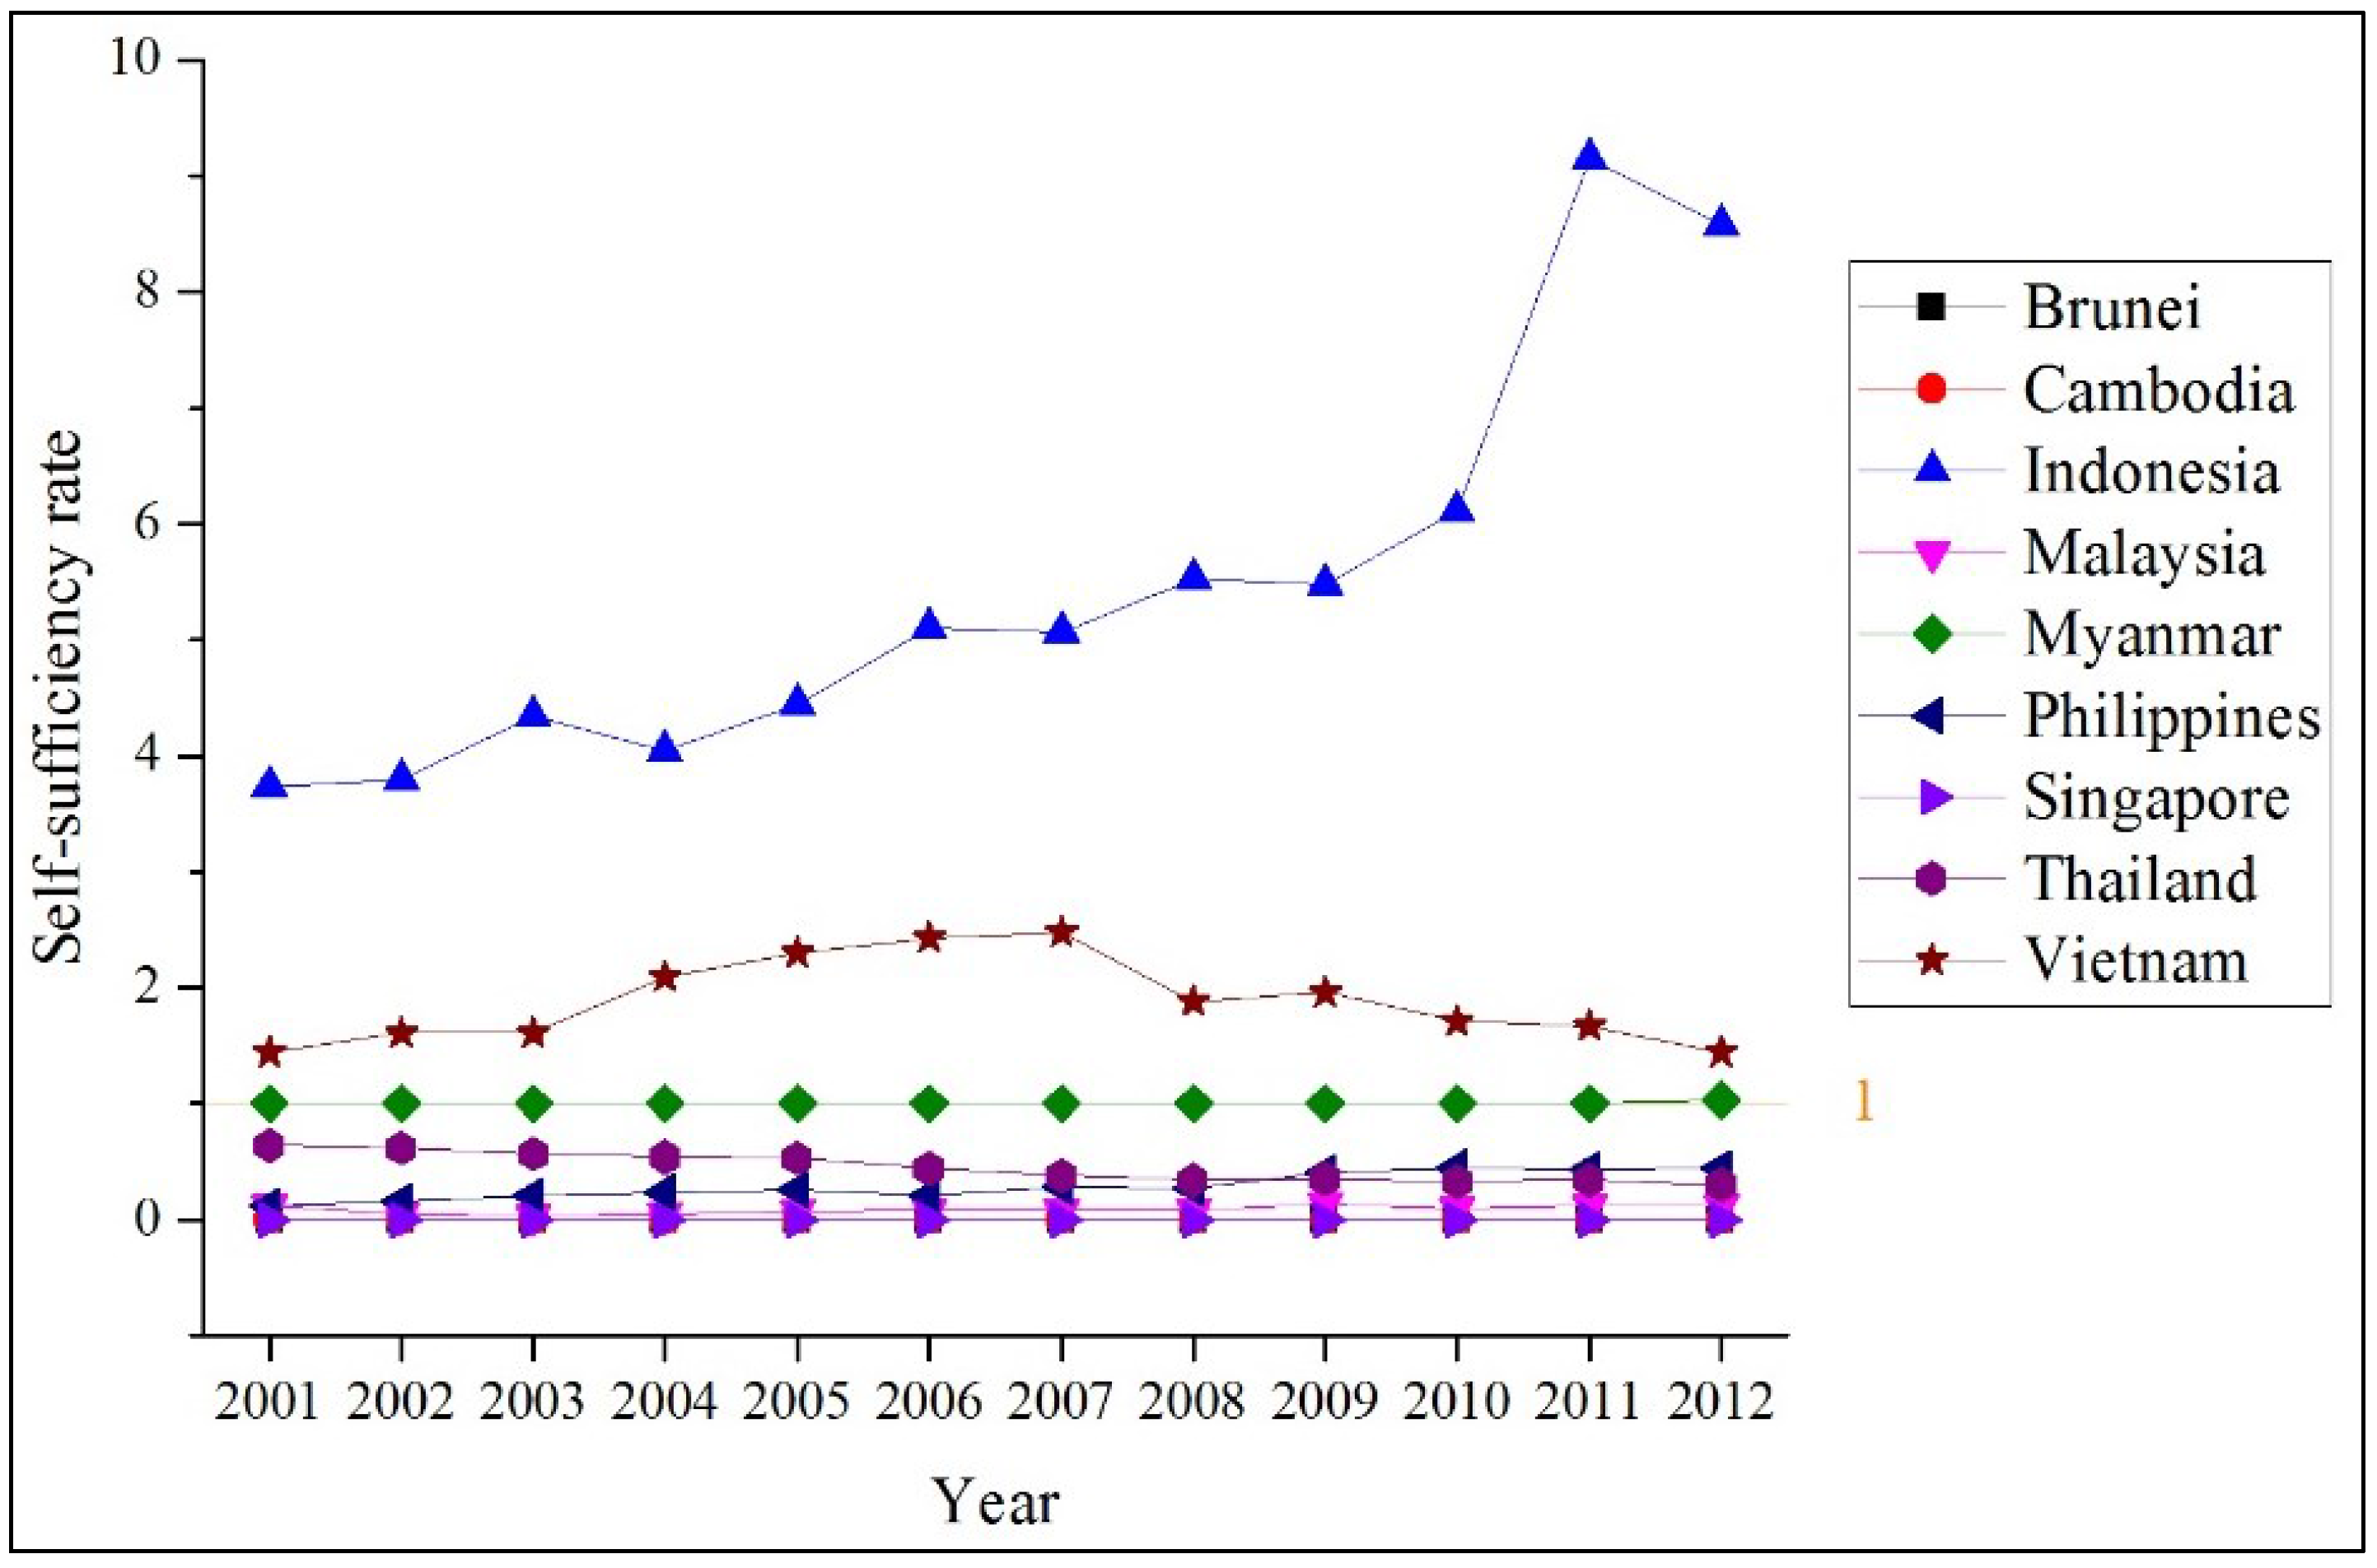
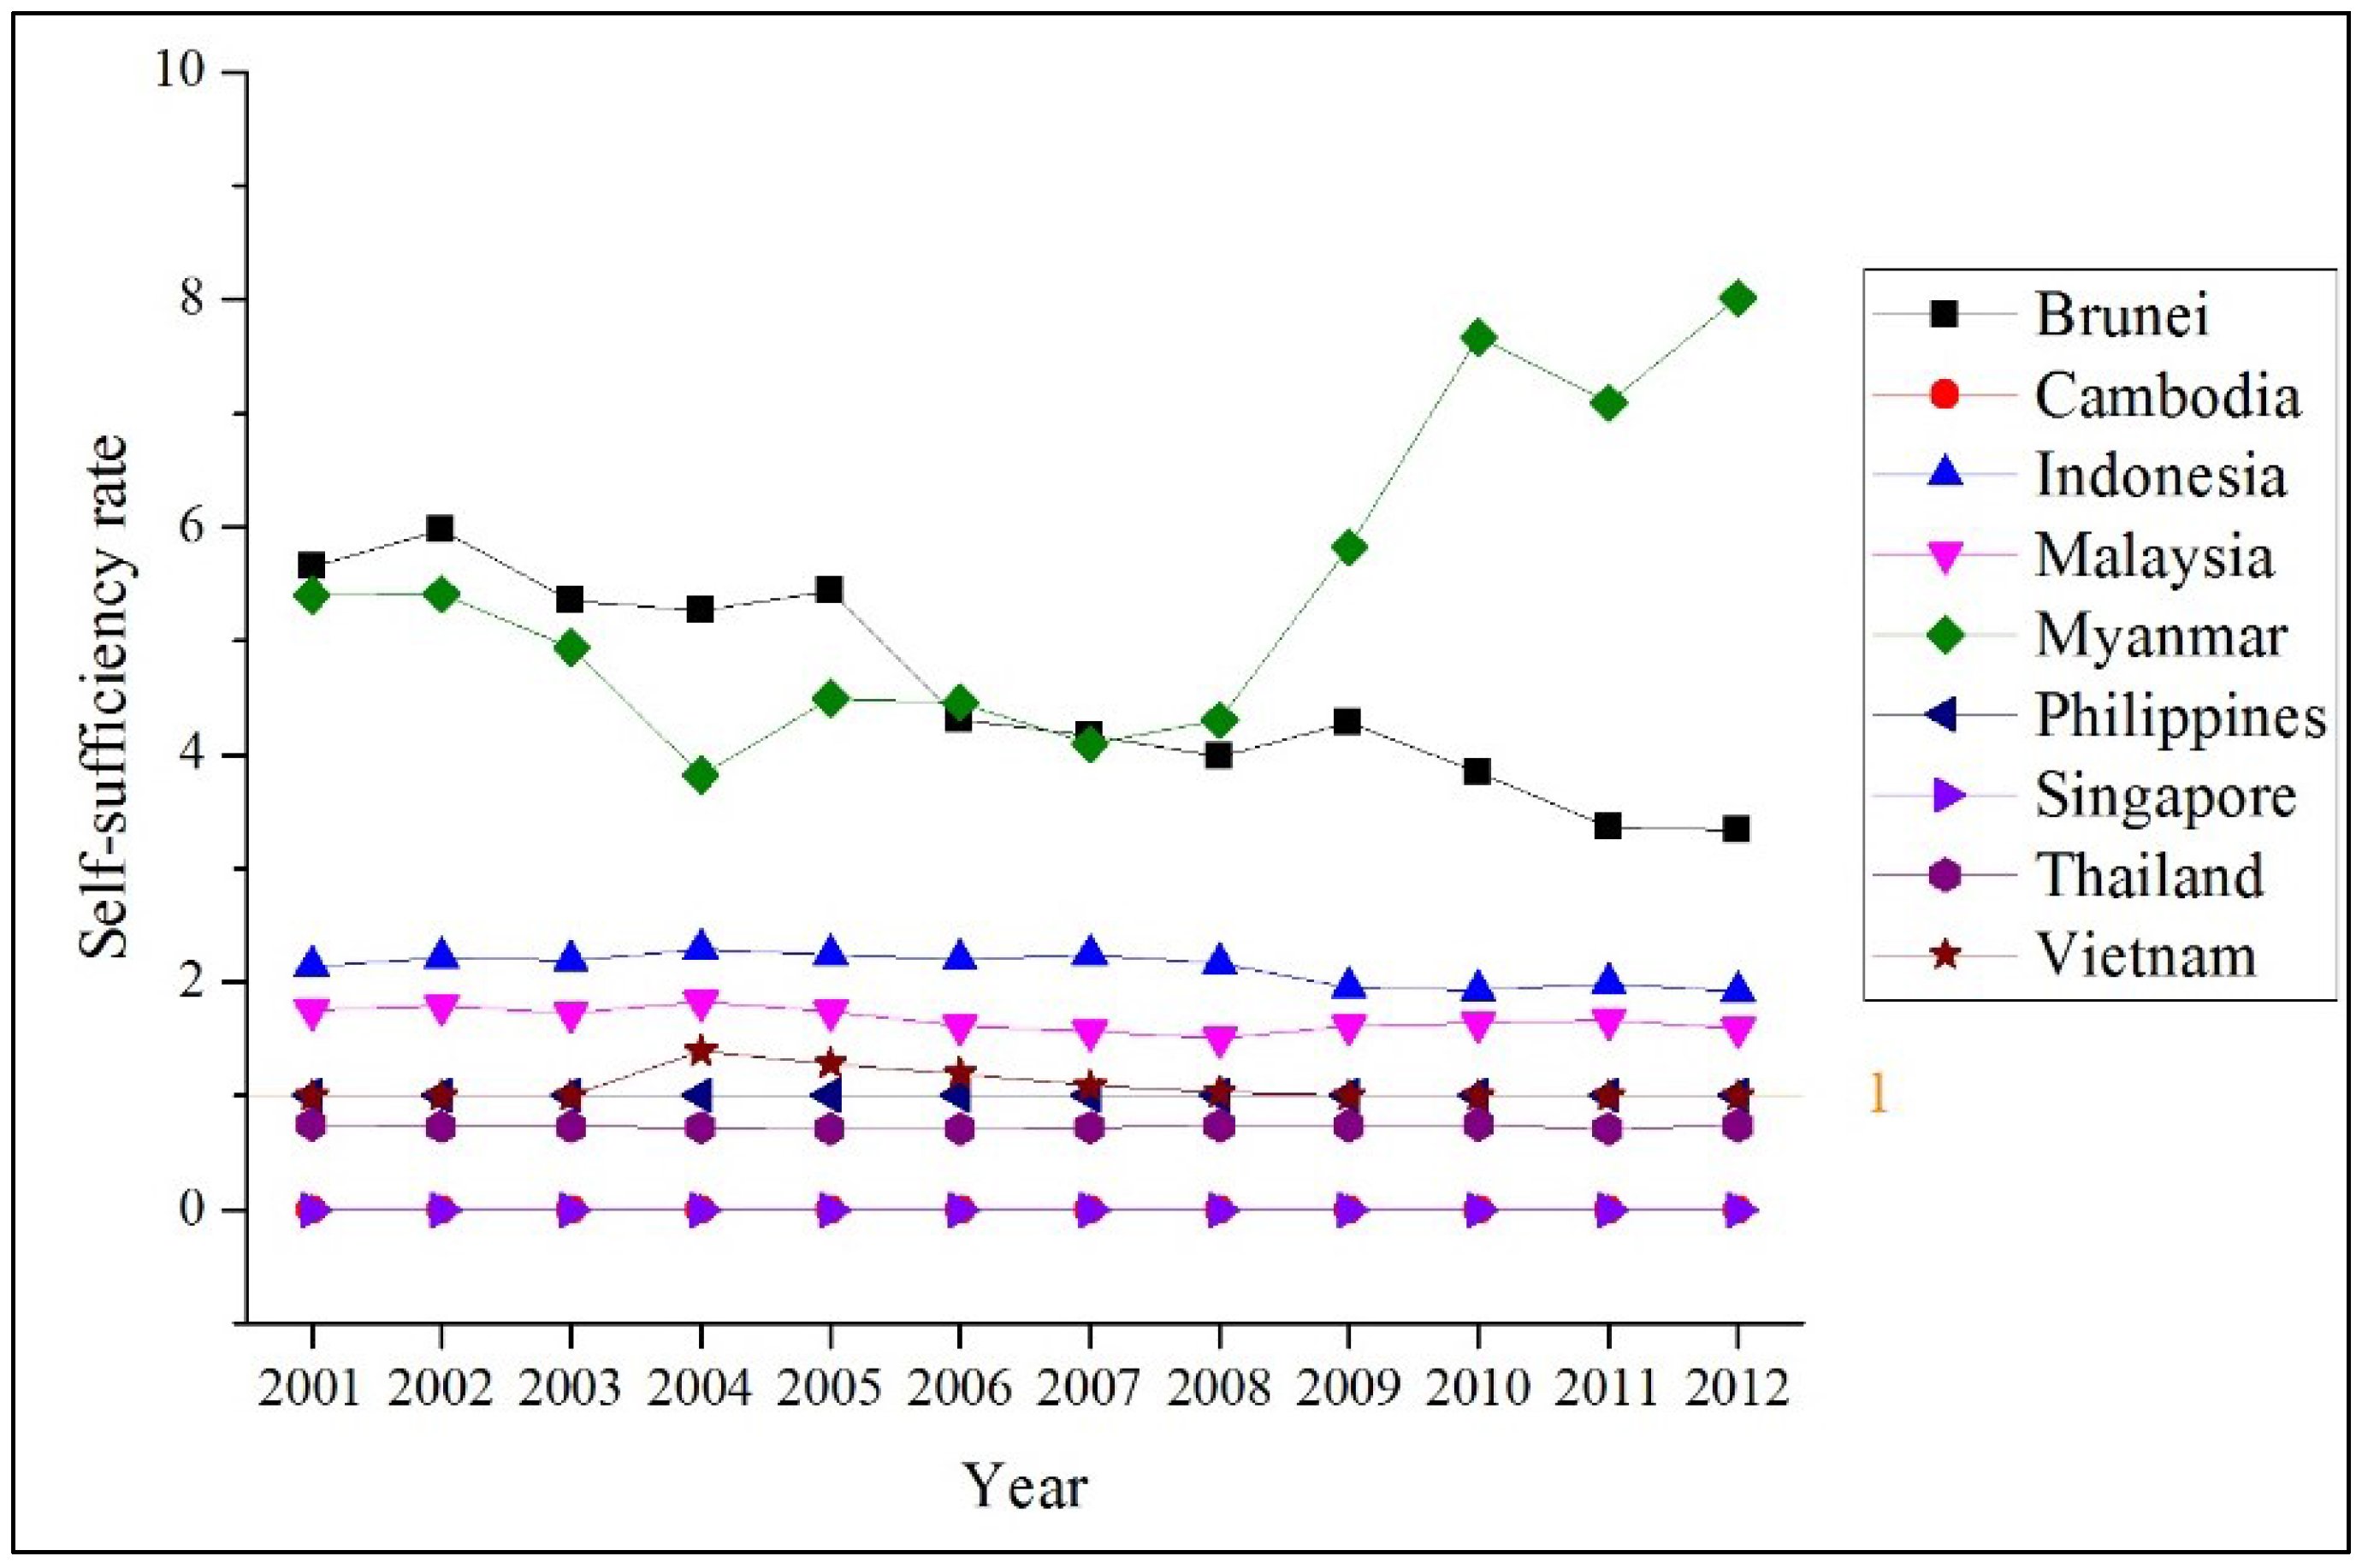
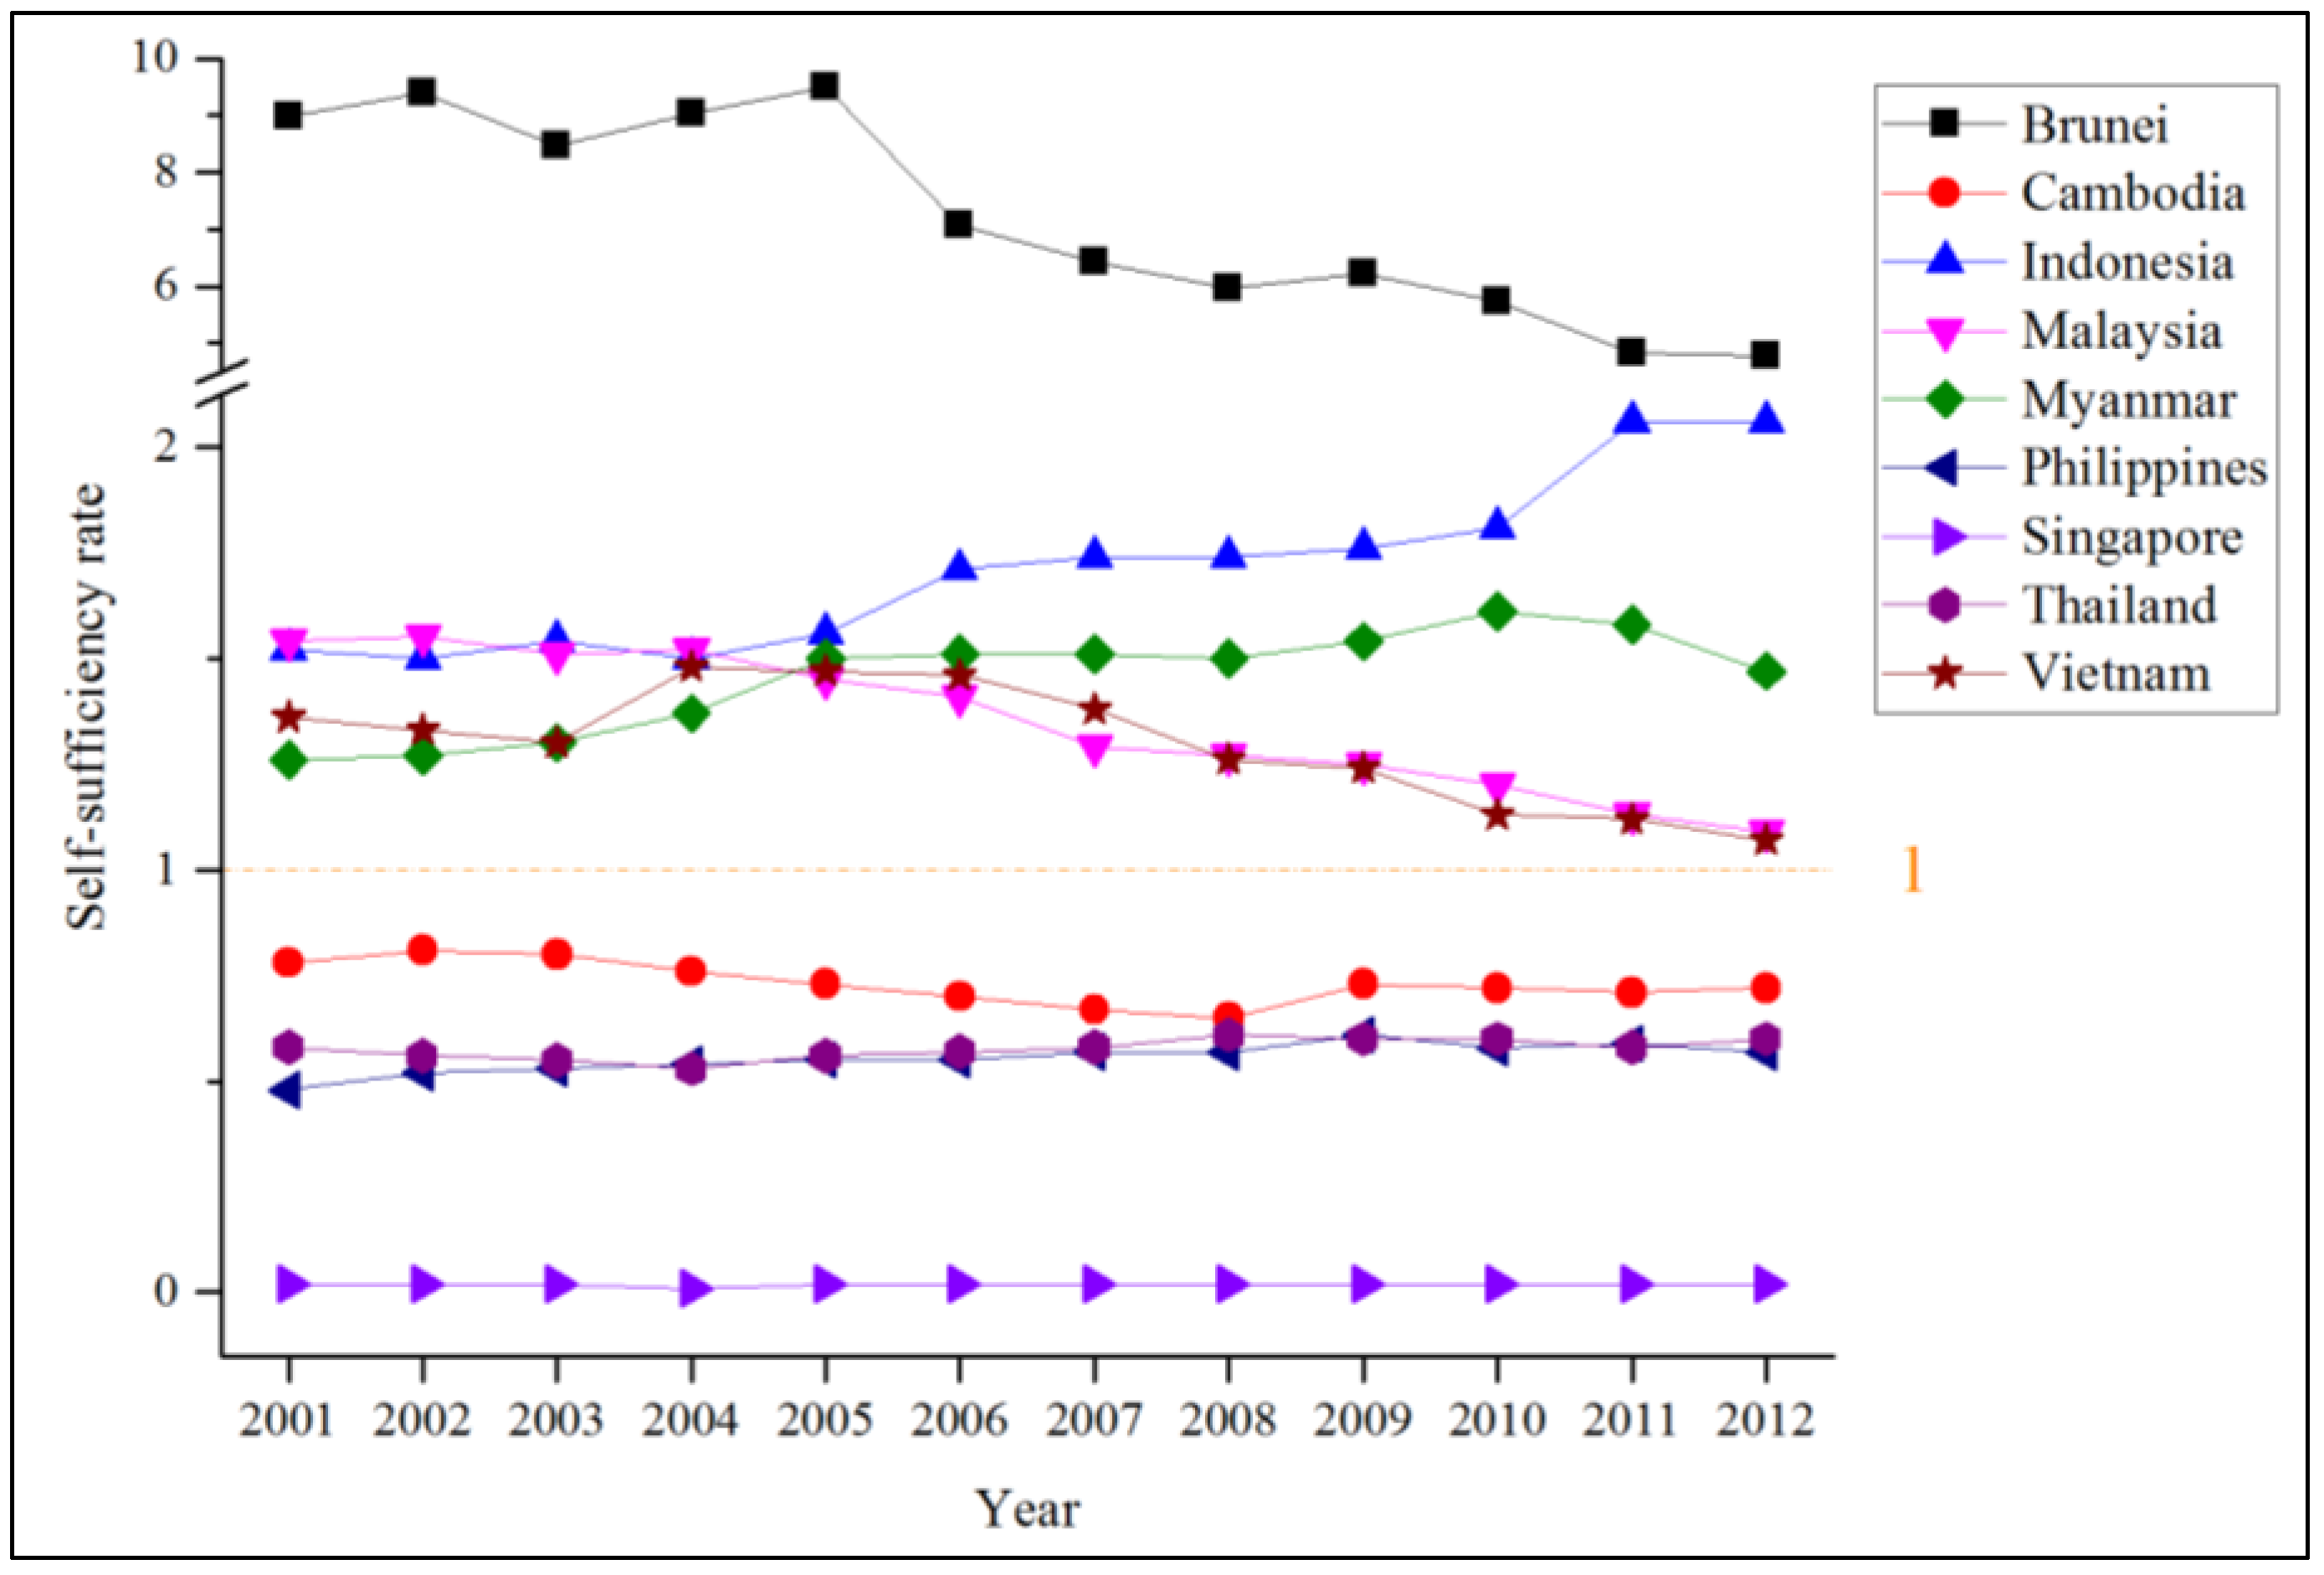
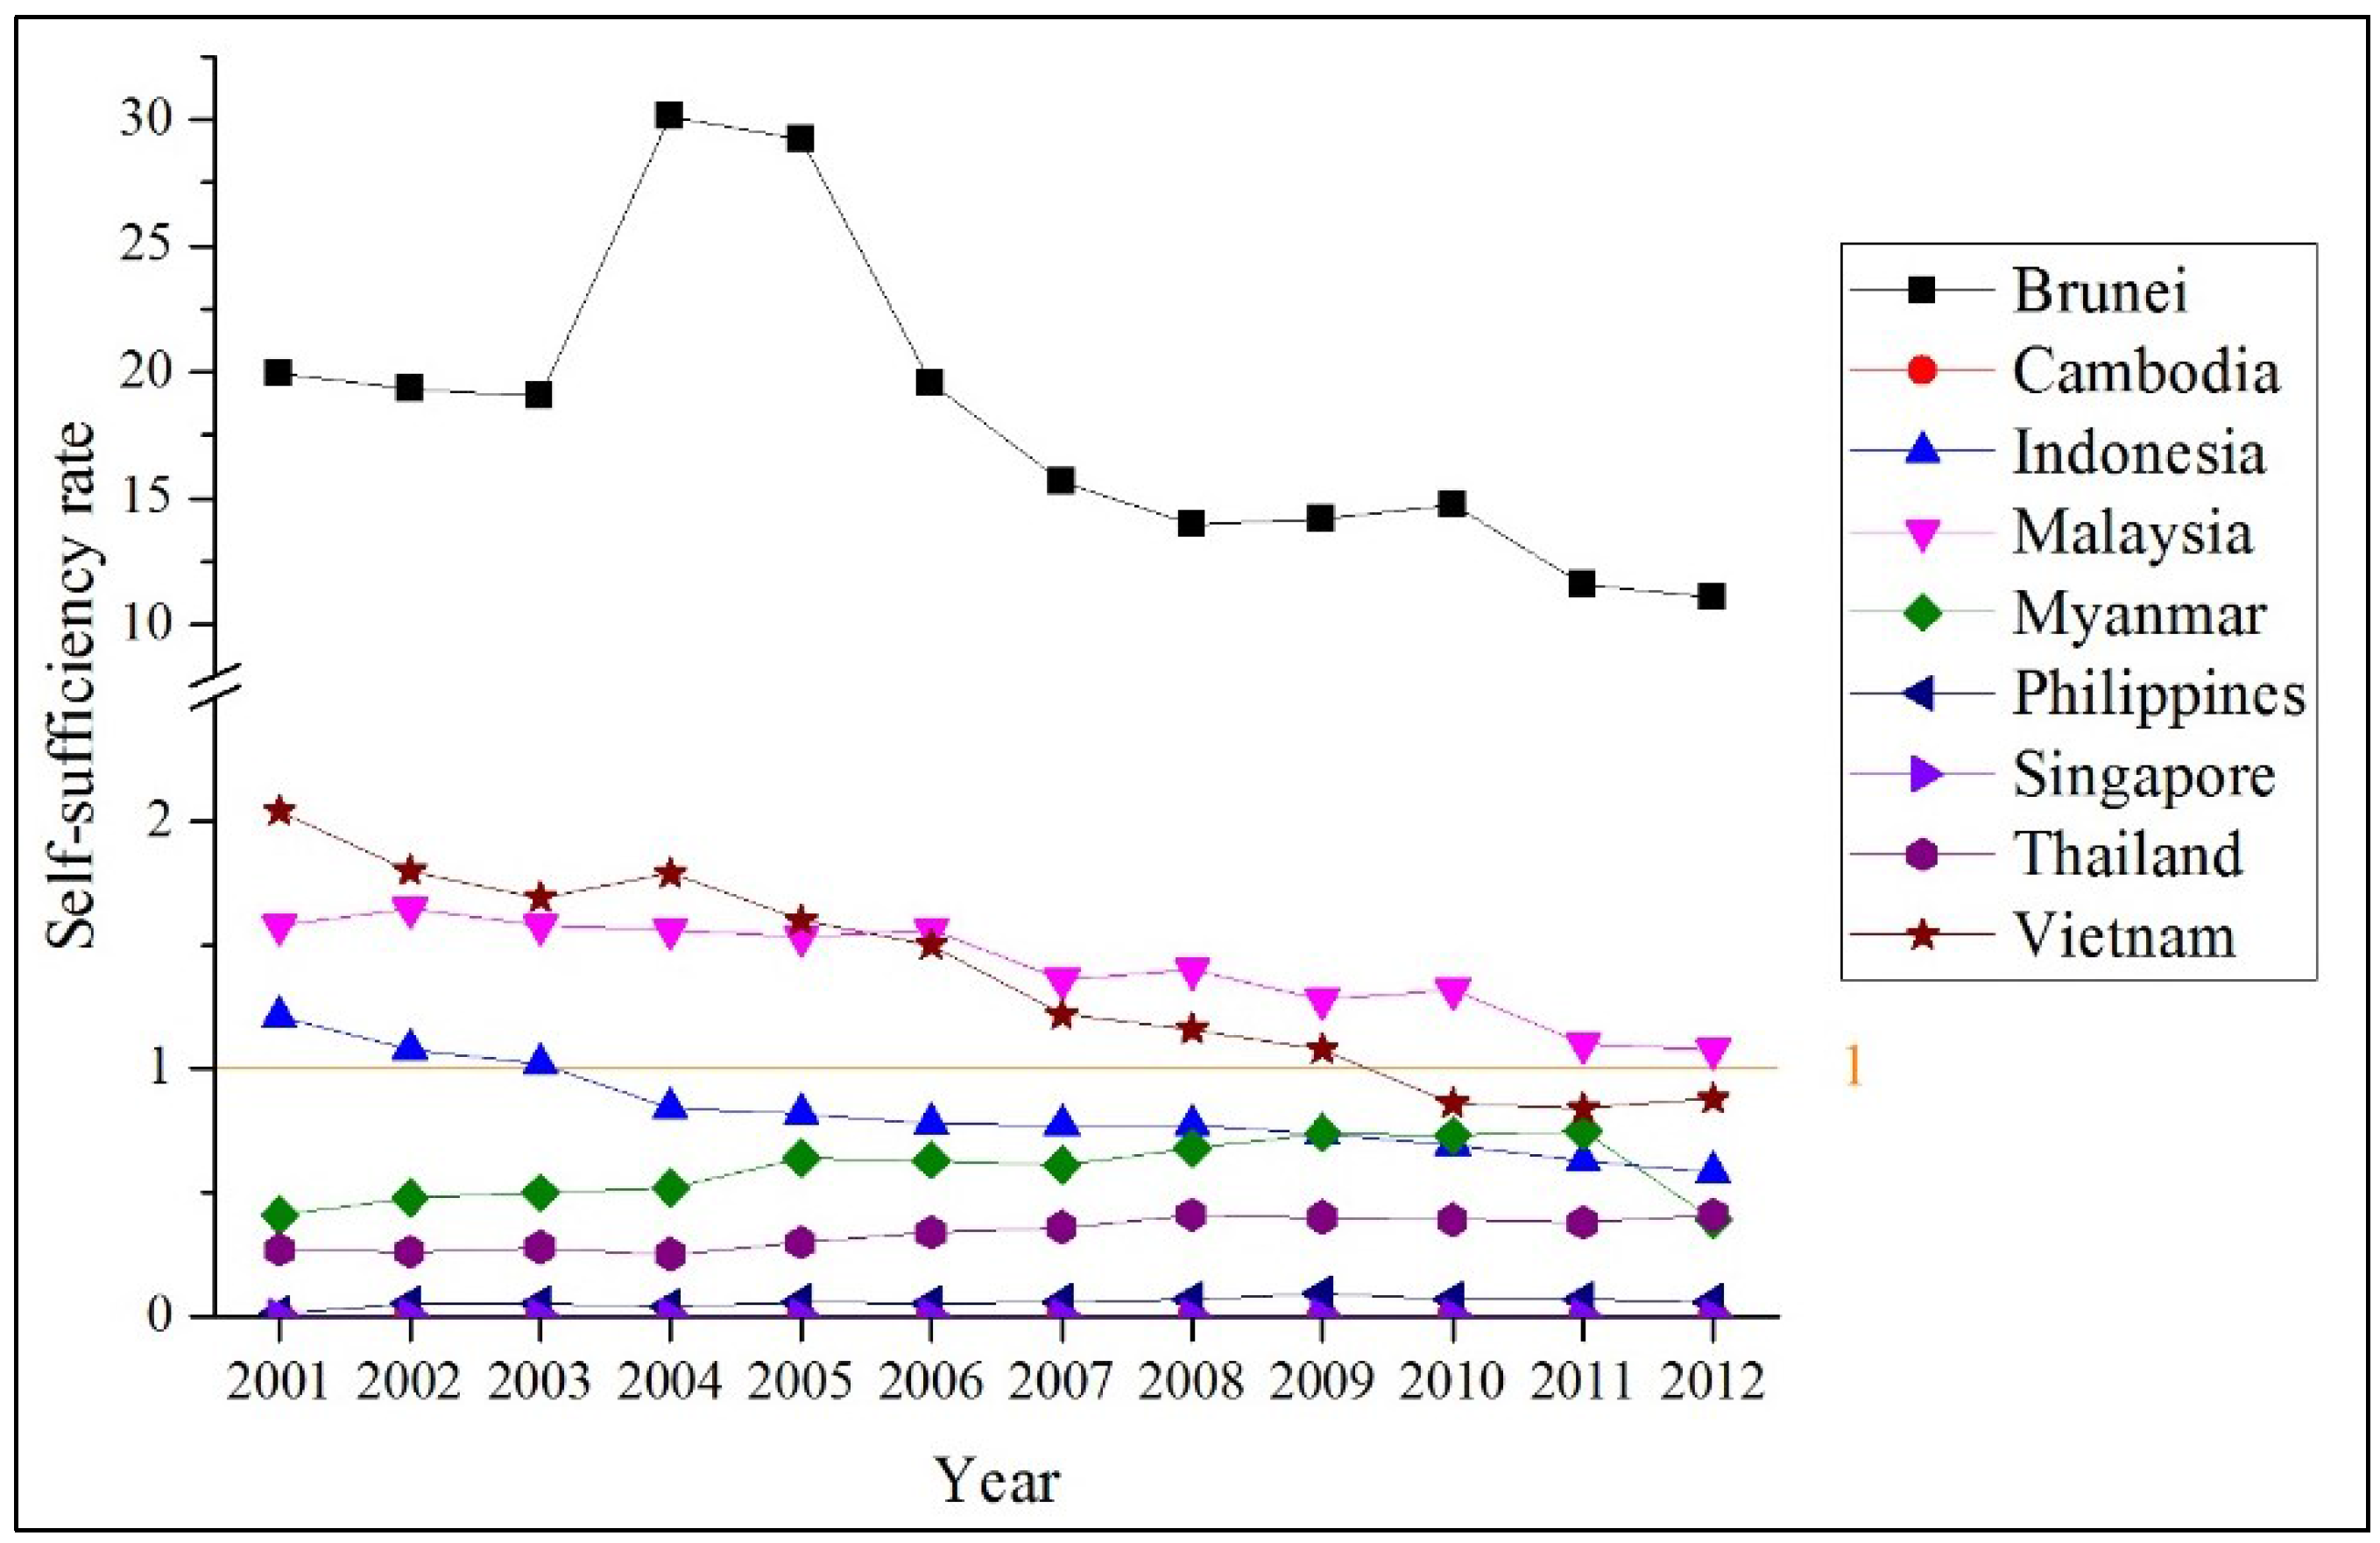
As the third component focuses on domestic energy resources, selected individual indicators include self-sufficiency, reserves-to-production ratio, and refining capacity. It should be noted that the focus of assessing domestic energy resources is to reflect domestic resource availability (to meet energy demand), not resource sustainability. The “self-sufficiency” indicator was used to assess the share of indigenous energy production in the total supply of energy. Besides the energy self-sufficiency rate, the indicator includes explicit sources, namely coal, crude oil, and natural gas. Renewable energy was not included because of its indigenousness. The formula is the ratio of the domestic energy production to the total primary energy supply (TPES) for each energy product. The self-sufficiency rate shows the capacity of the country to cover its energy demand using domestic resources. The self-sufficiency rate ranges from 0 to 1. The higher value indicates more self-sufficiency (in other words, the less the country has to rely on external energy resources) while a value over 1 implies export capability.
The “reserves-to-production” ratio (R/P ratio) was chosen to represent the availability of (proven) hydrocarbon energy resources of the country through the number of years resources have been available, presuming the production is consistent. Energy sources included in this indicator are coal, crude oil, and natural gas. As a result of the ASEAN reputed refining industry, “refining capacity” was also included, but assessed only countries with refined oil exports (Indonesia, Singapore, and Thailand).
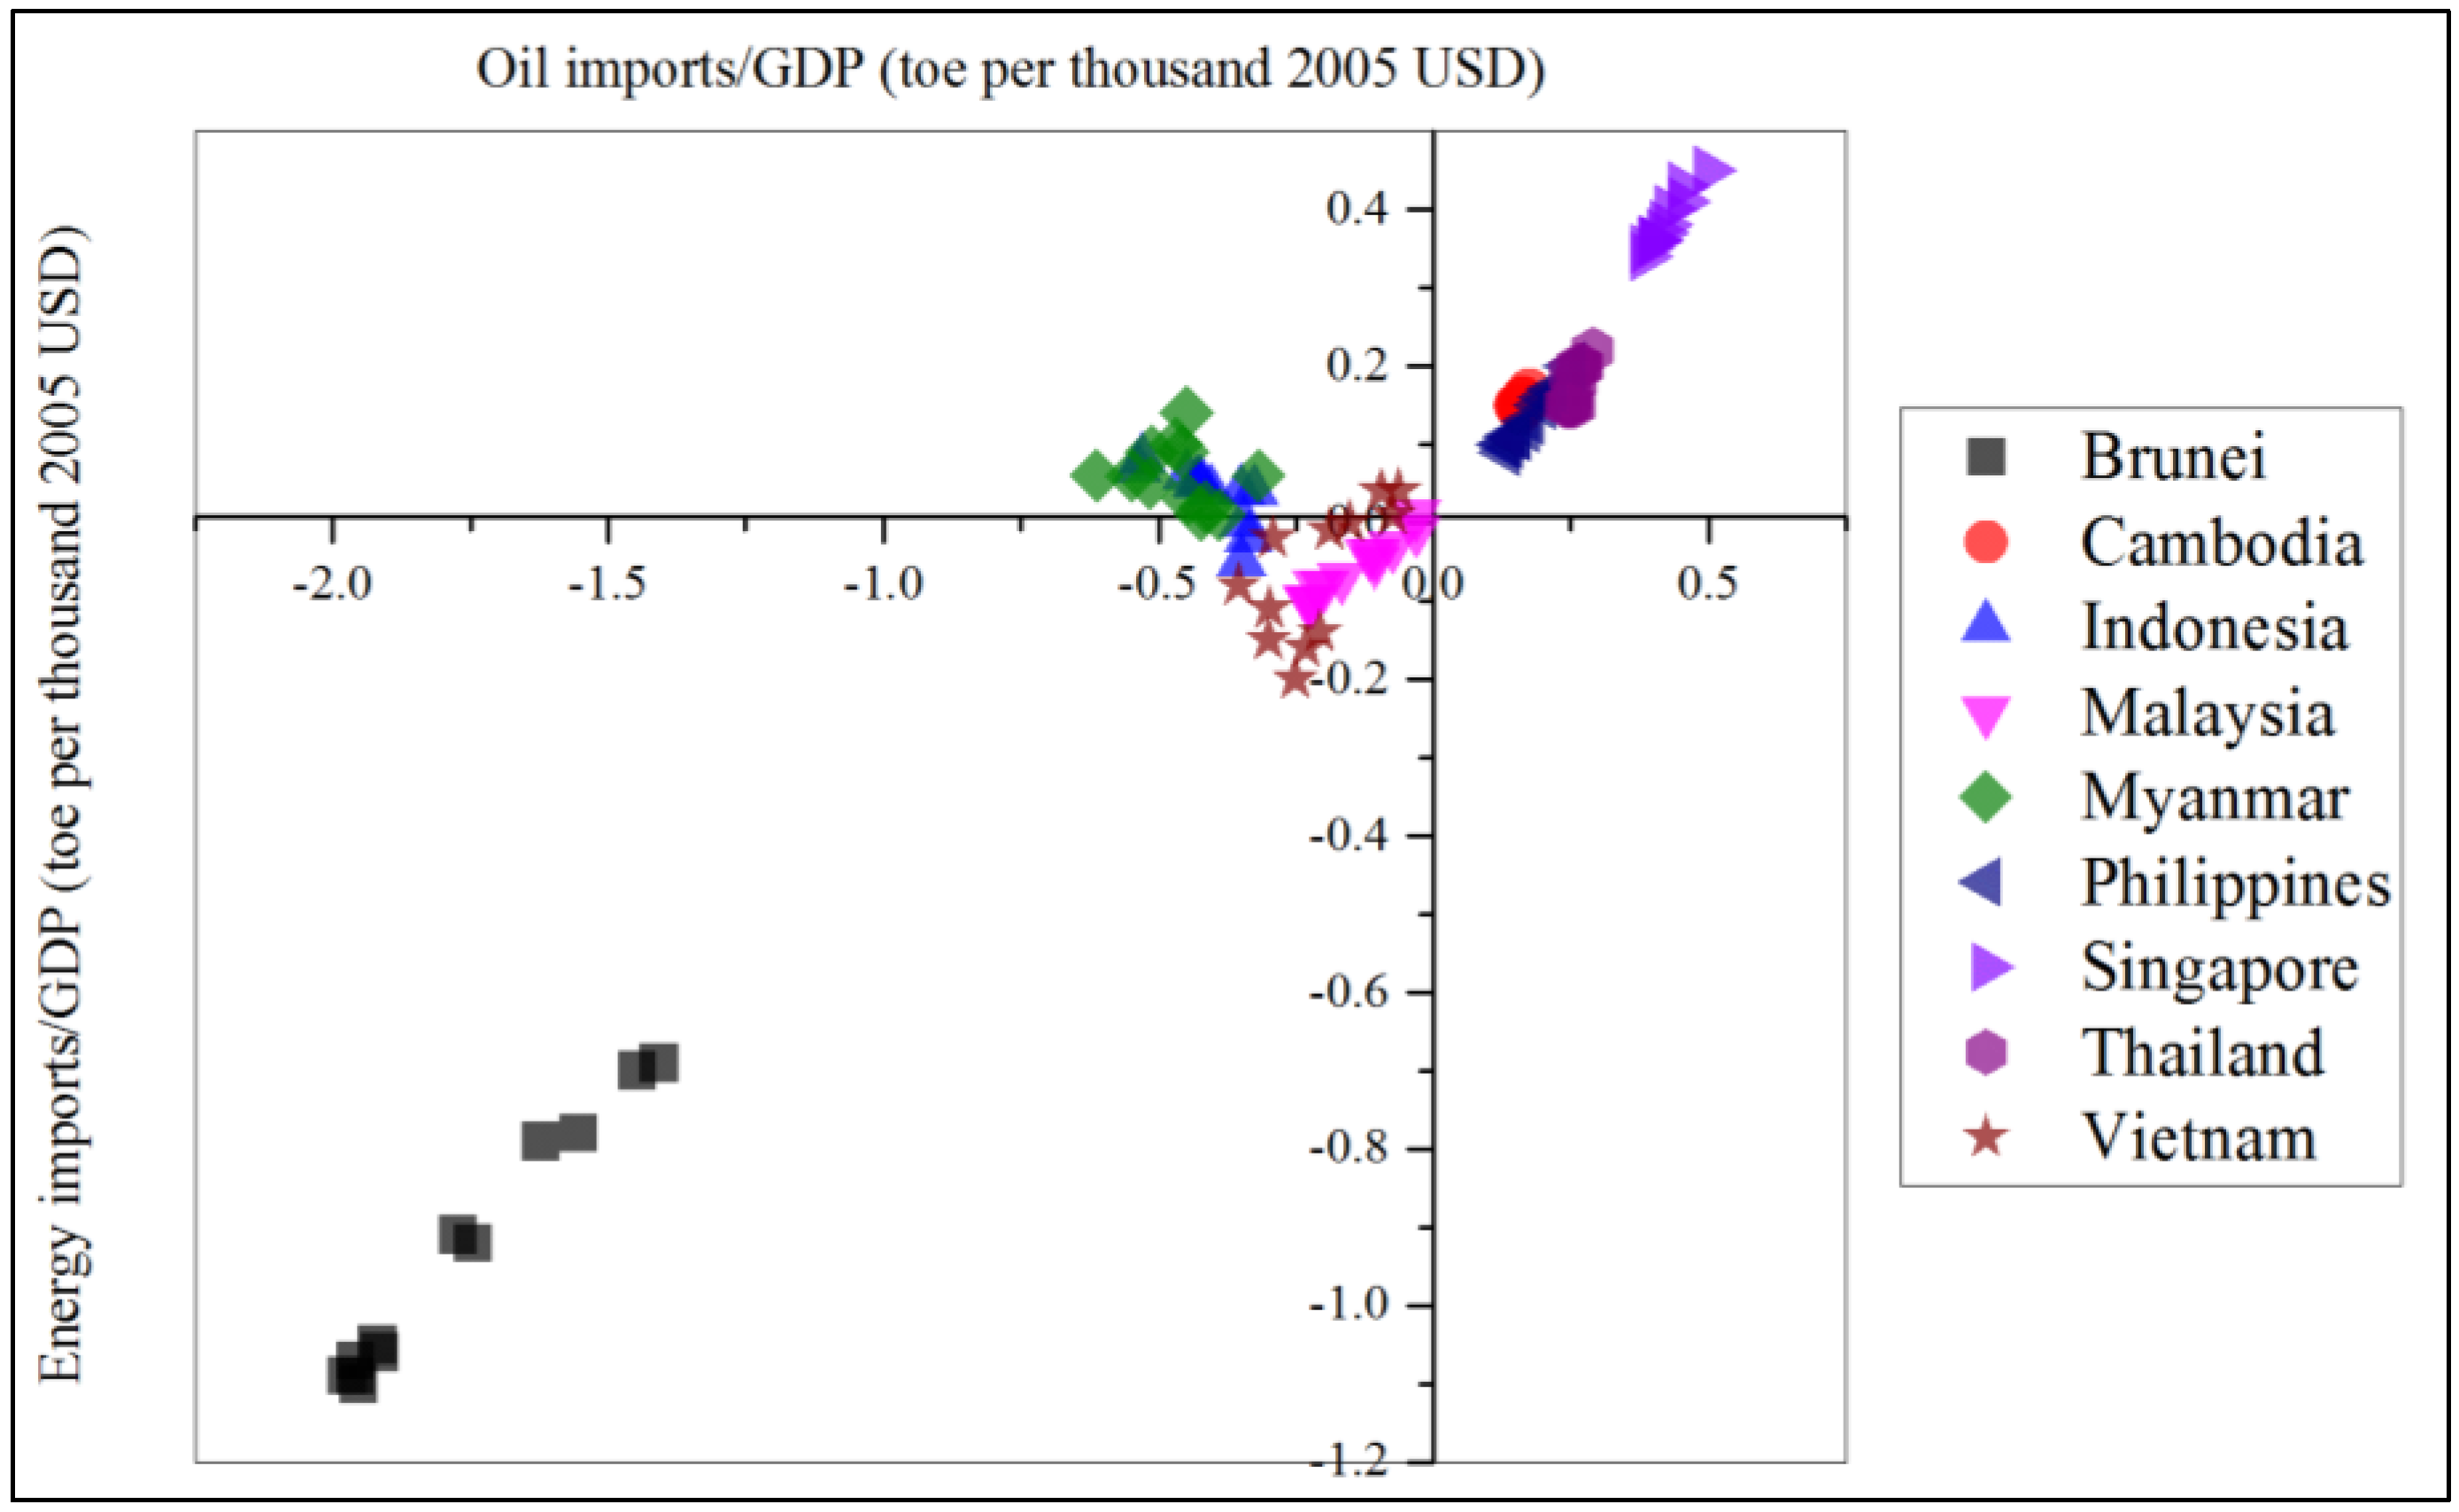
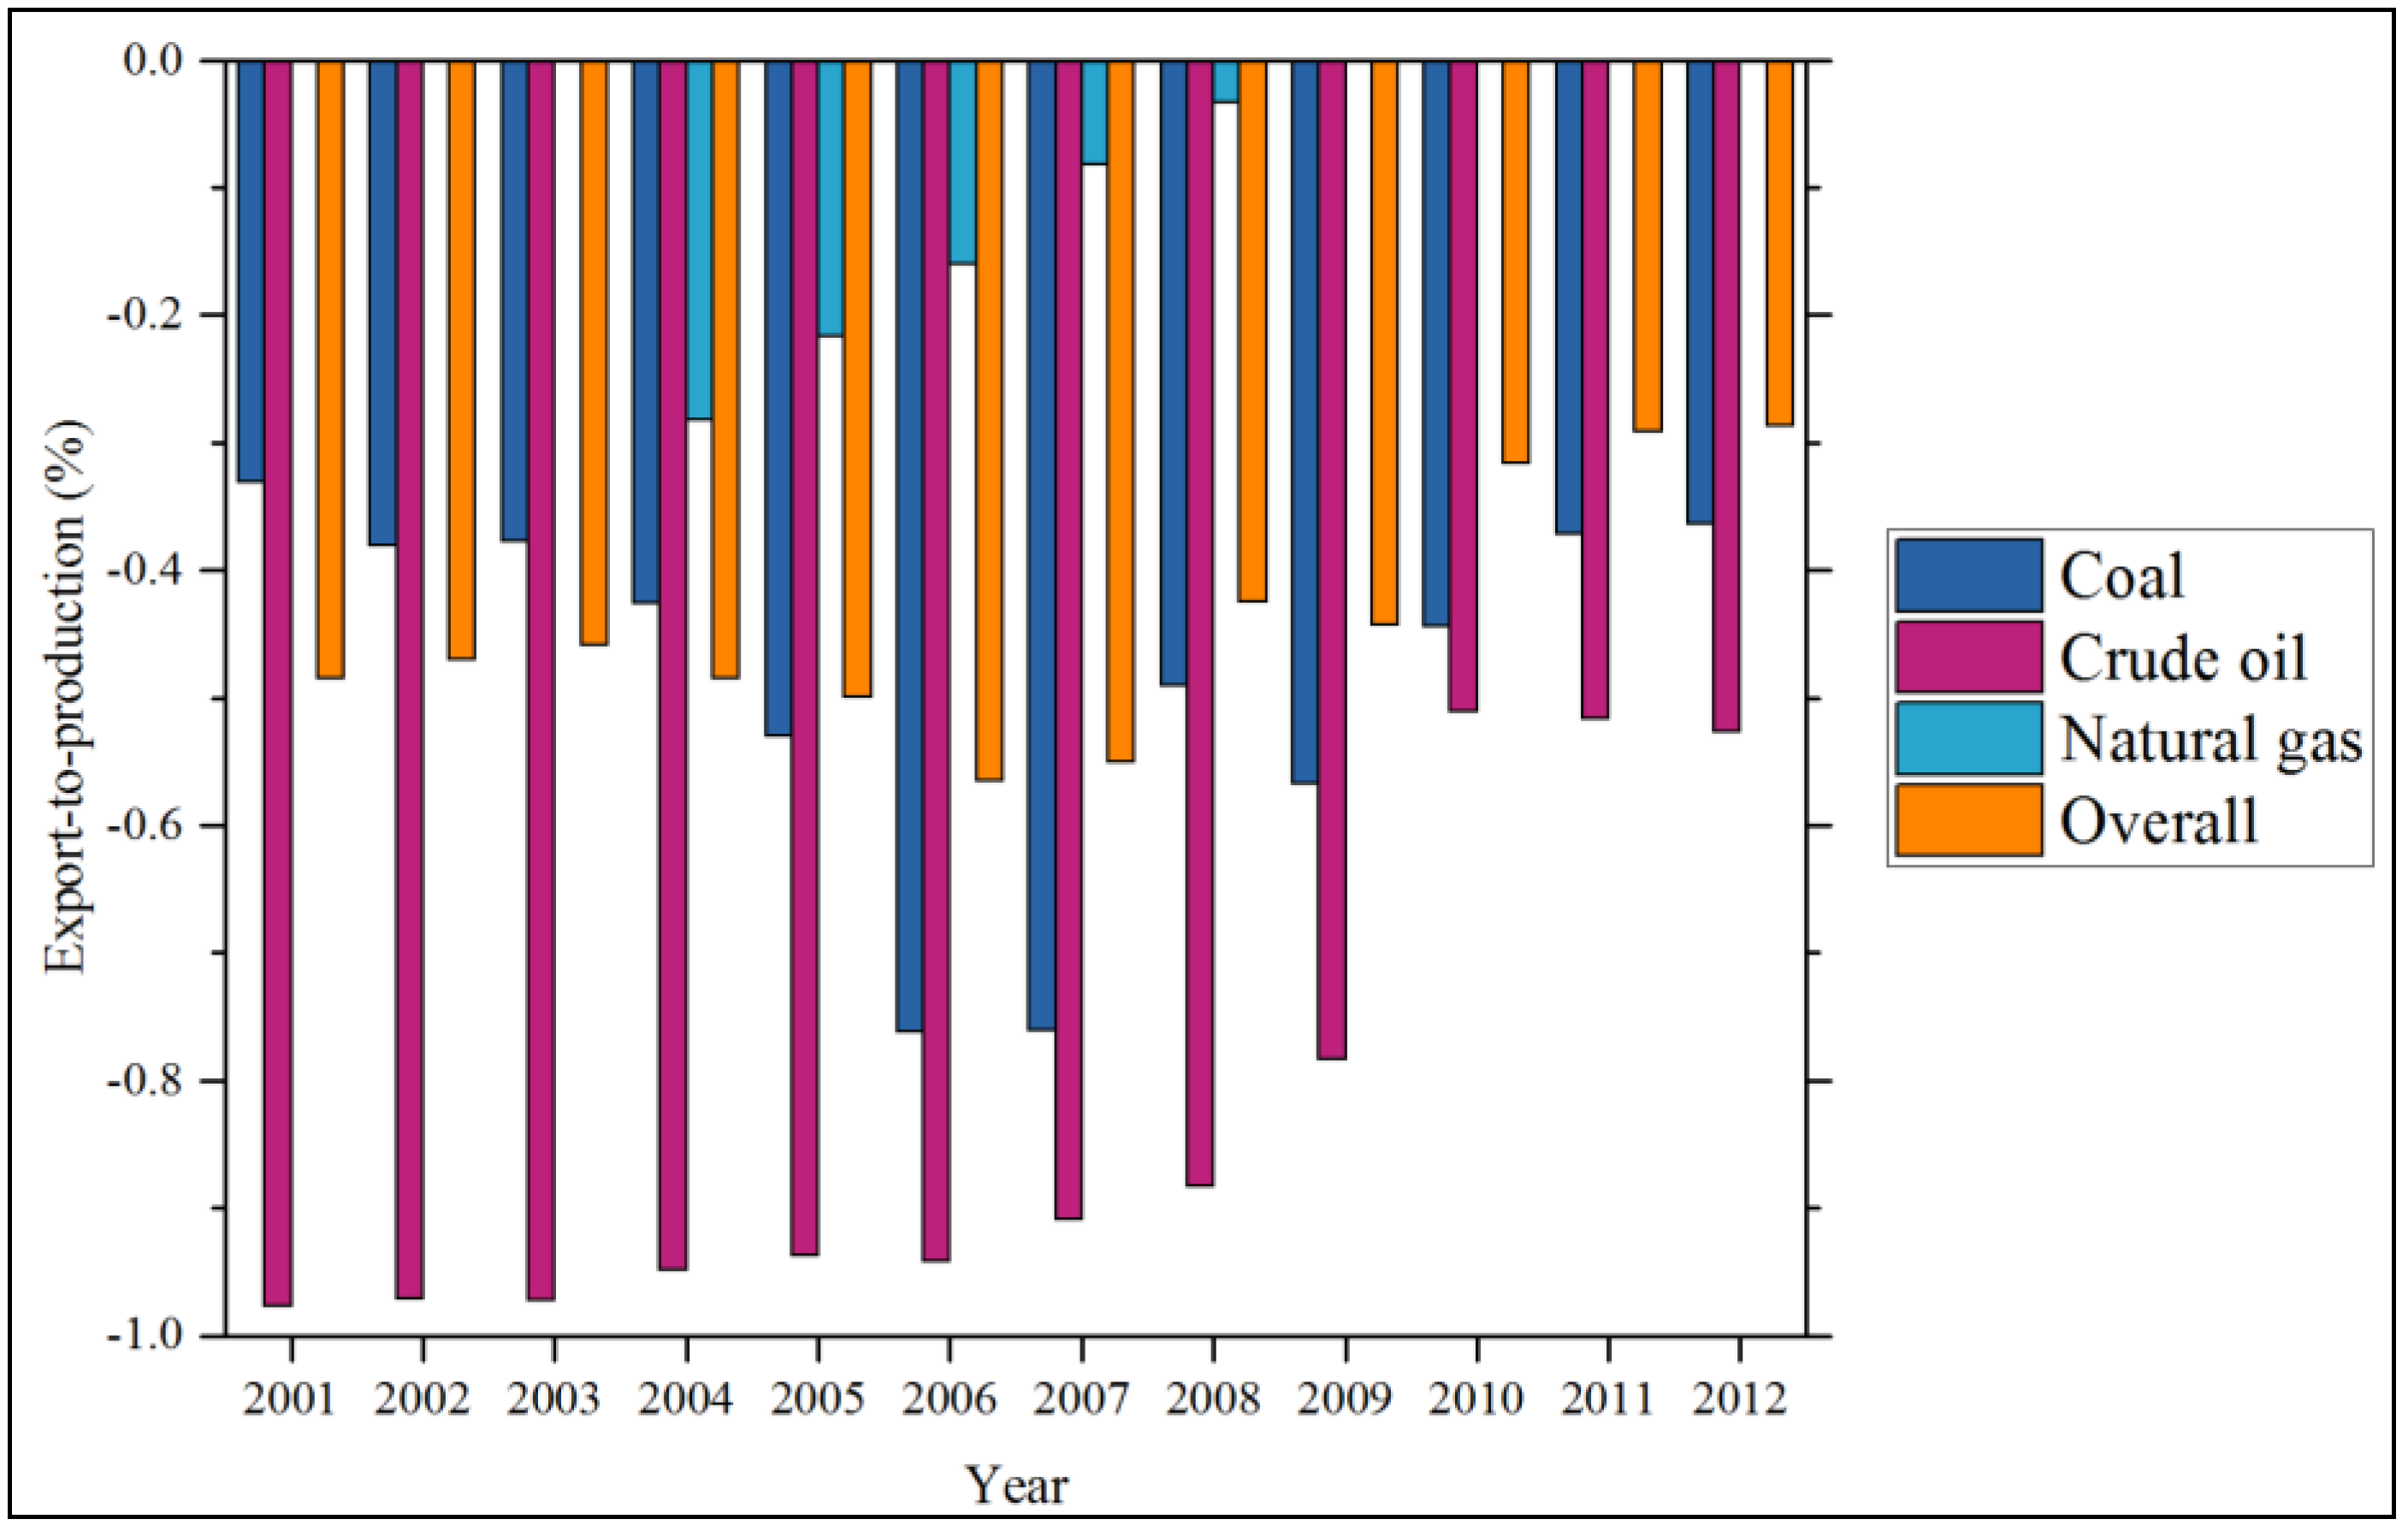
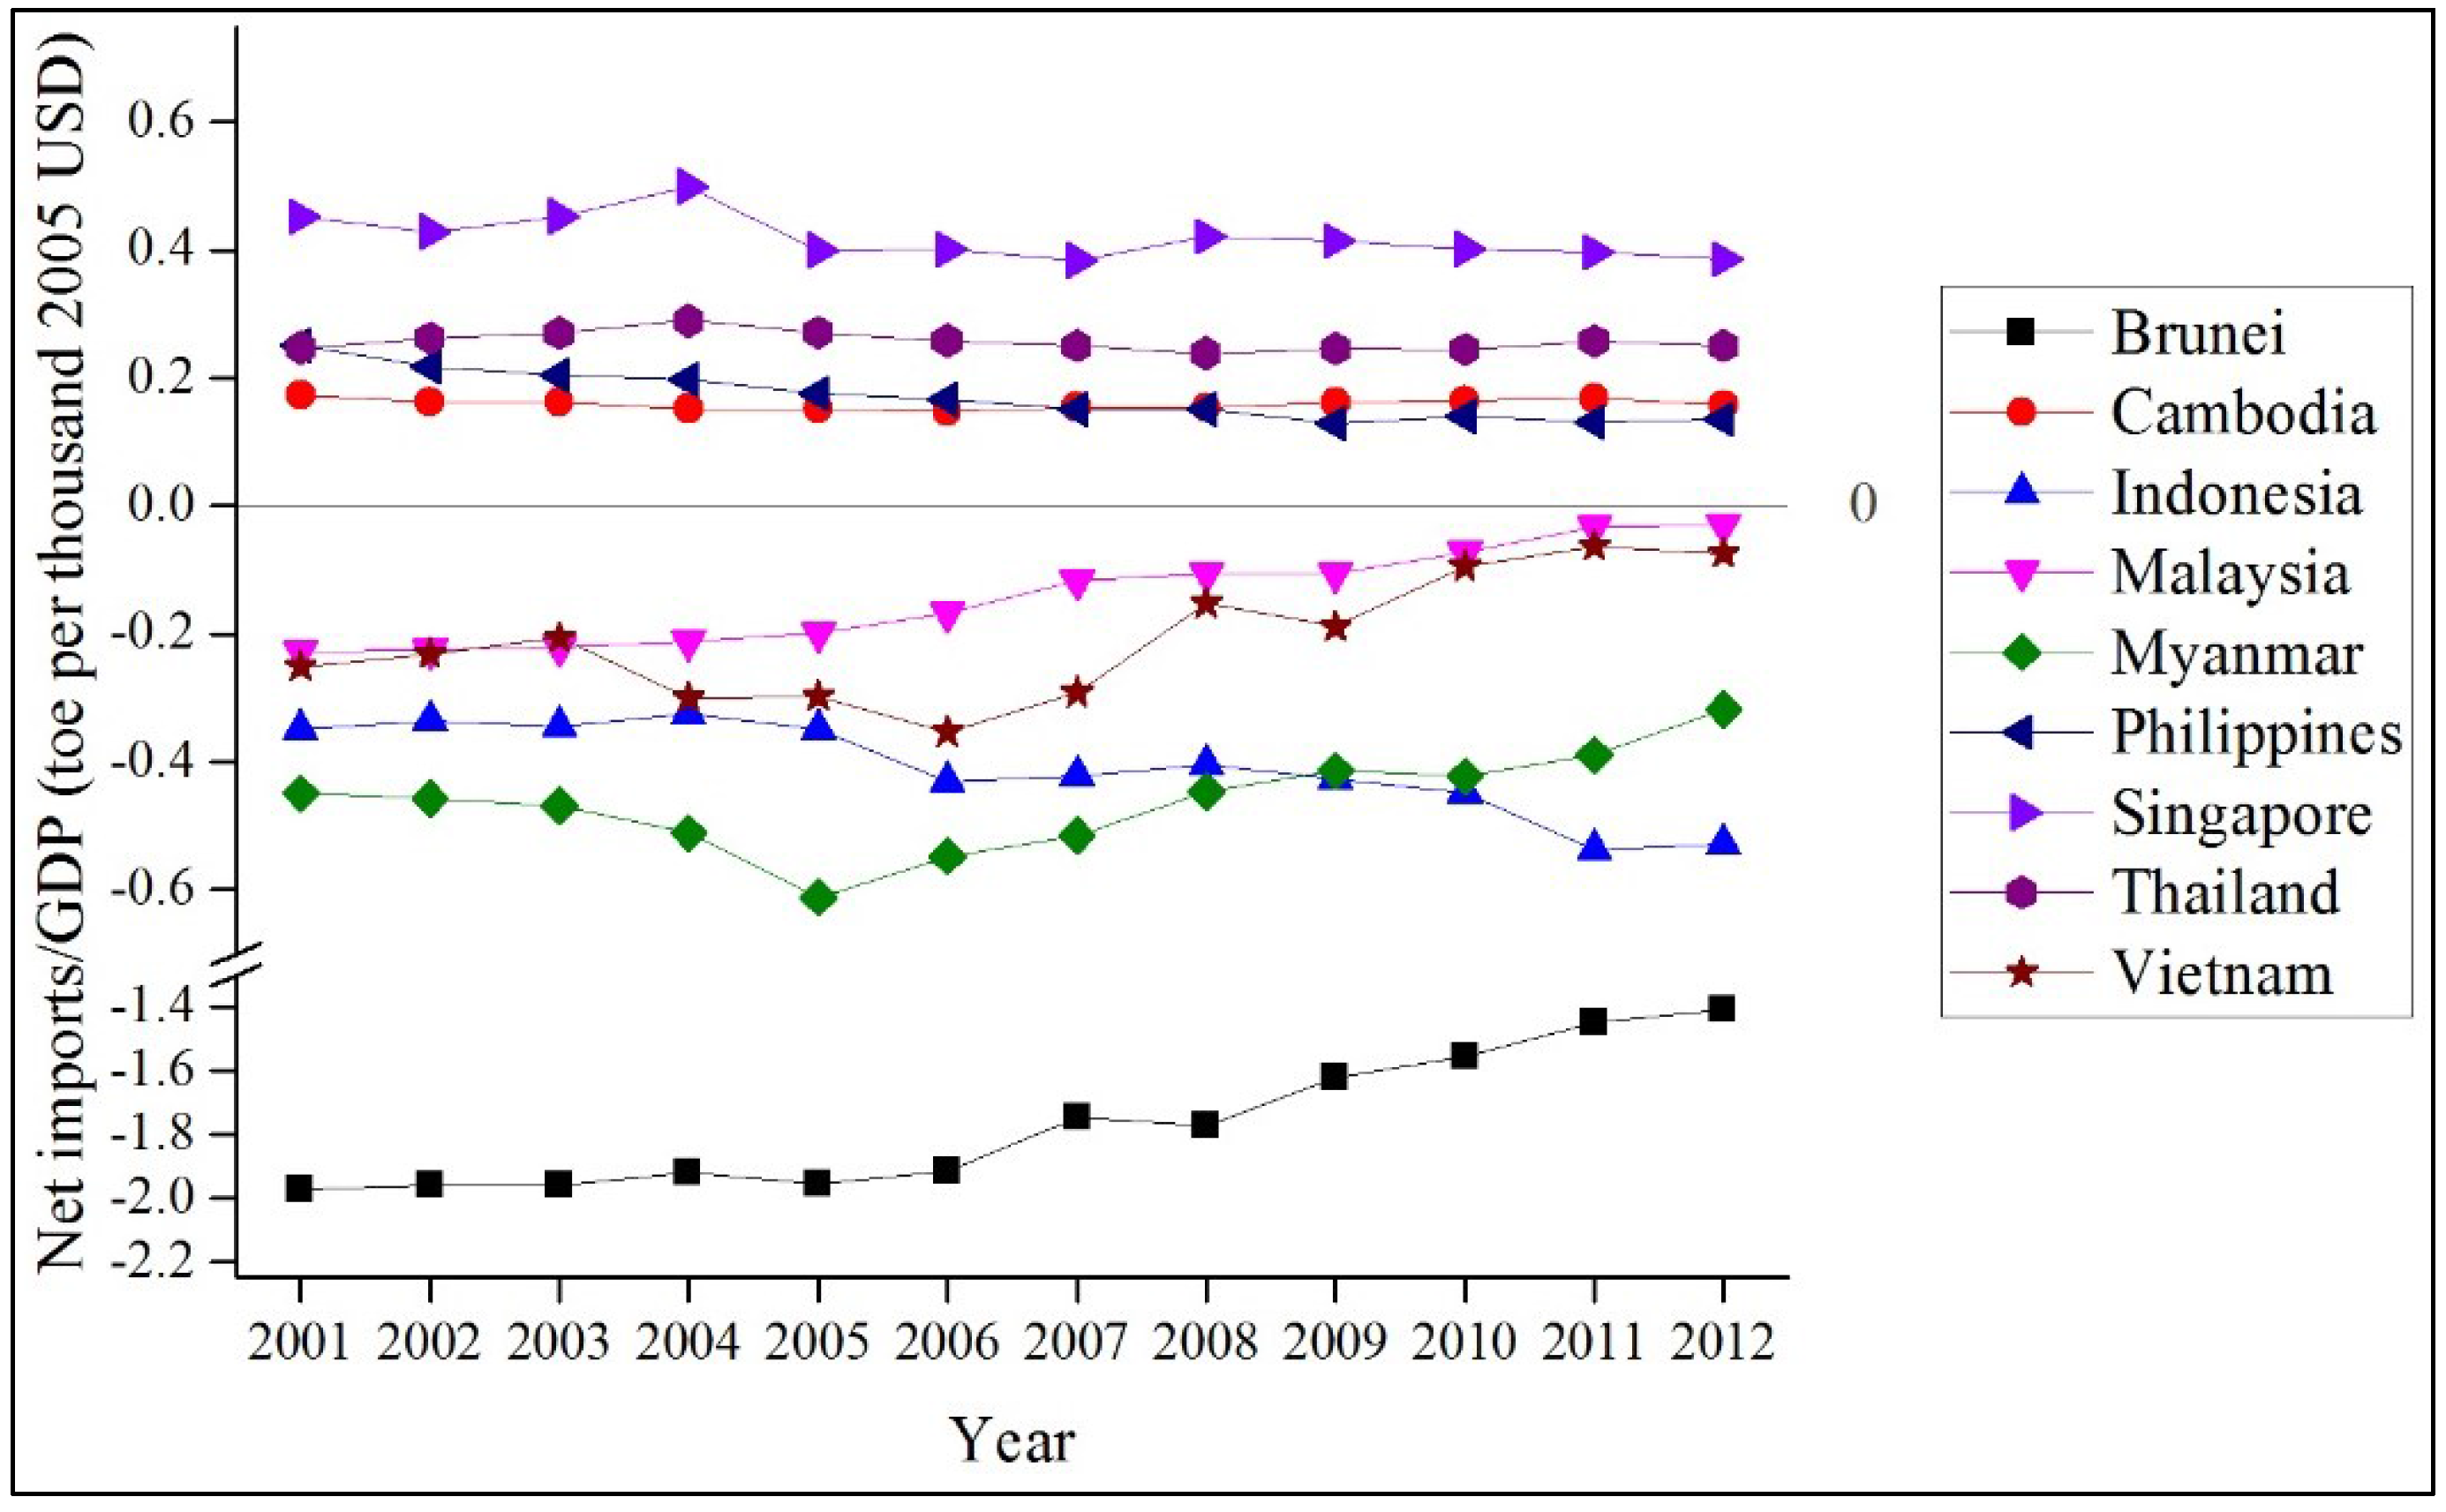
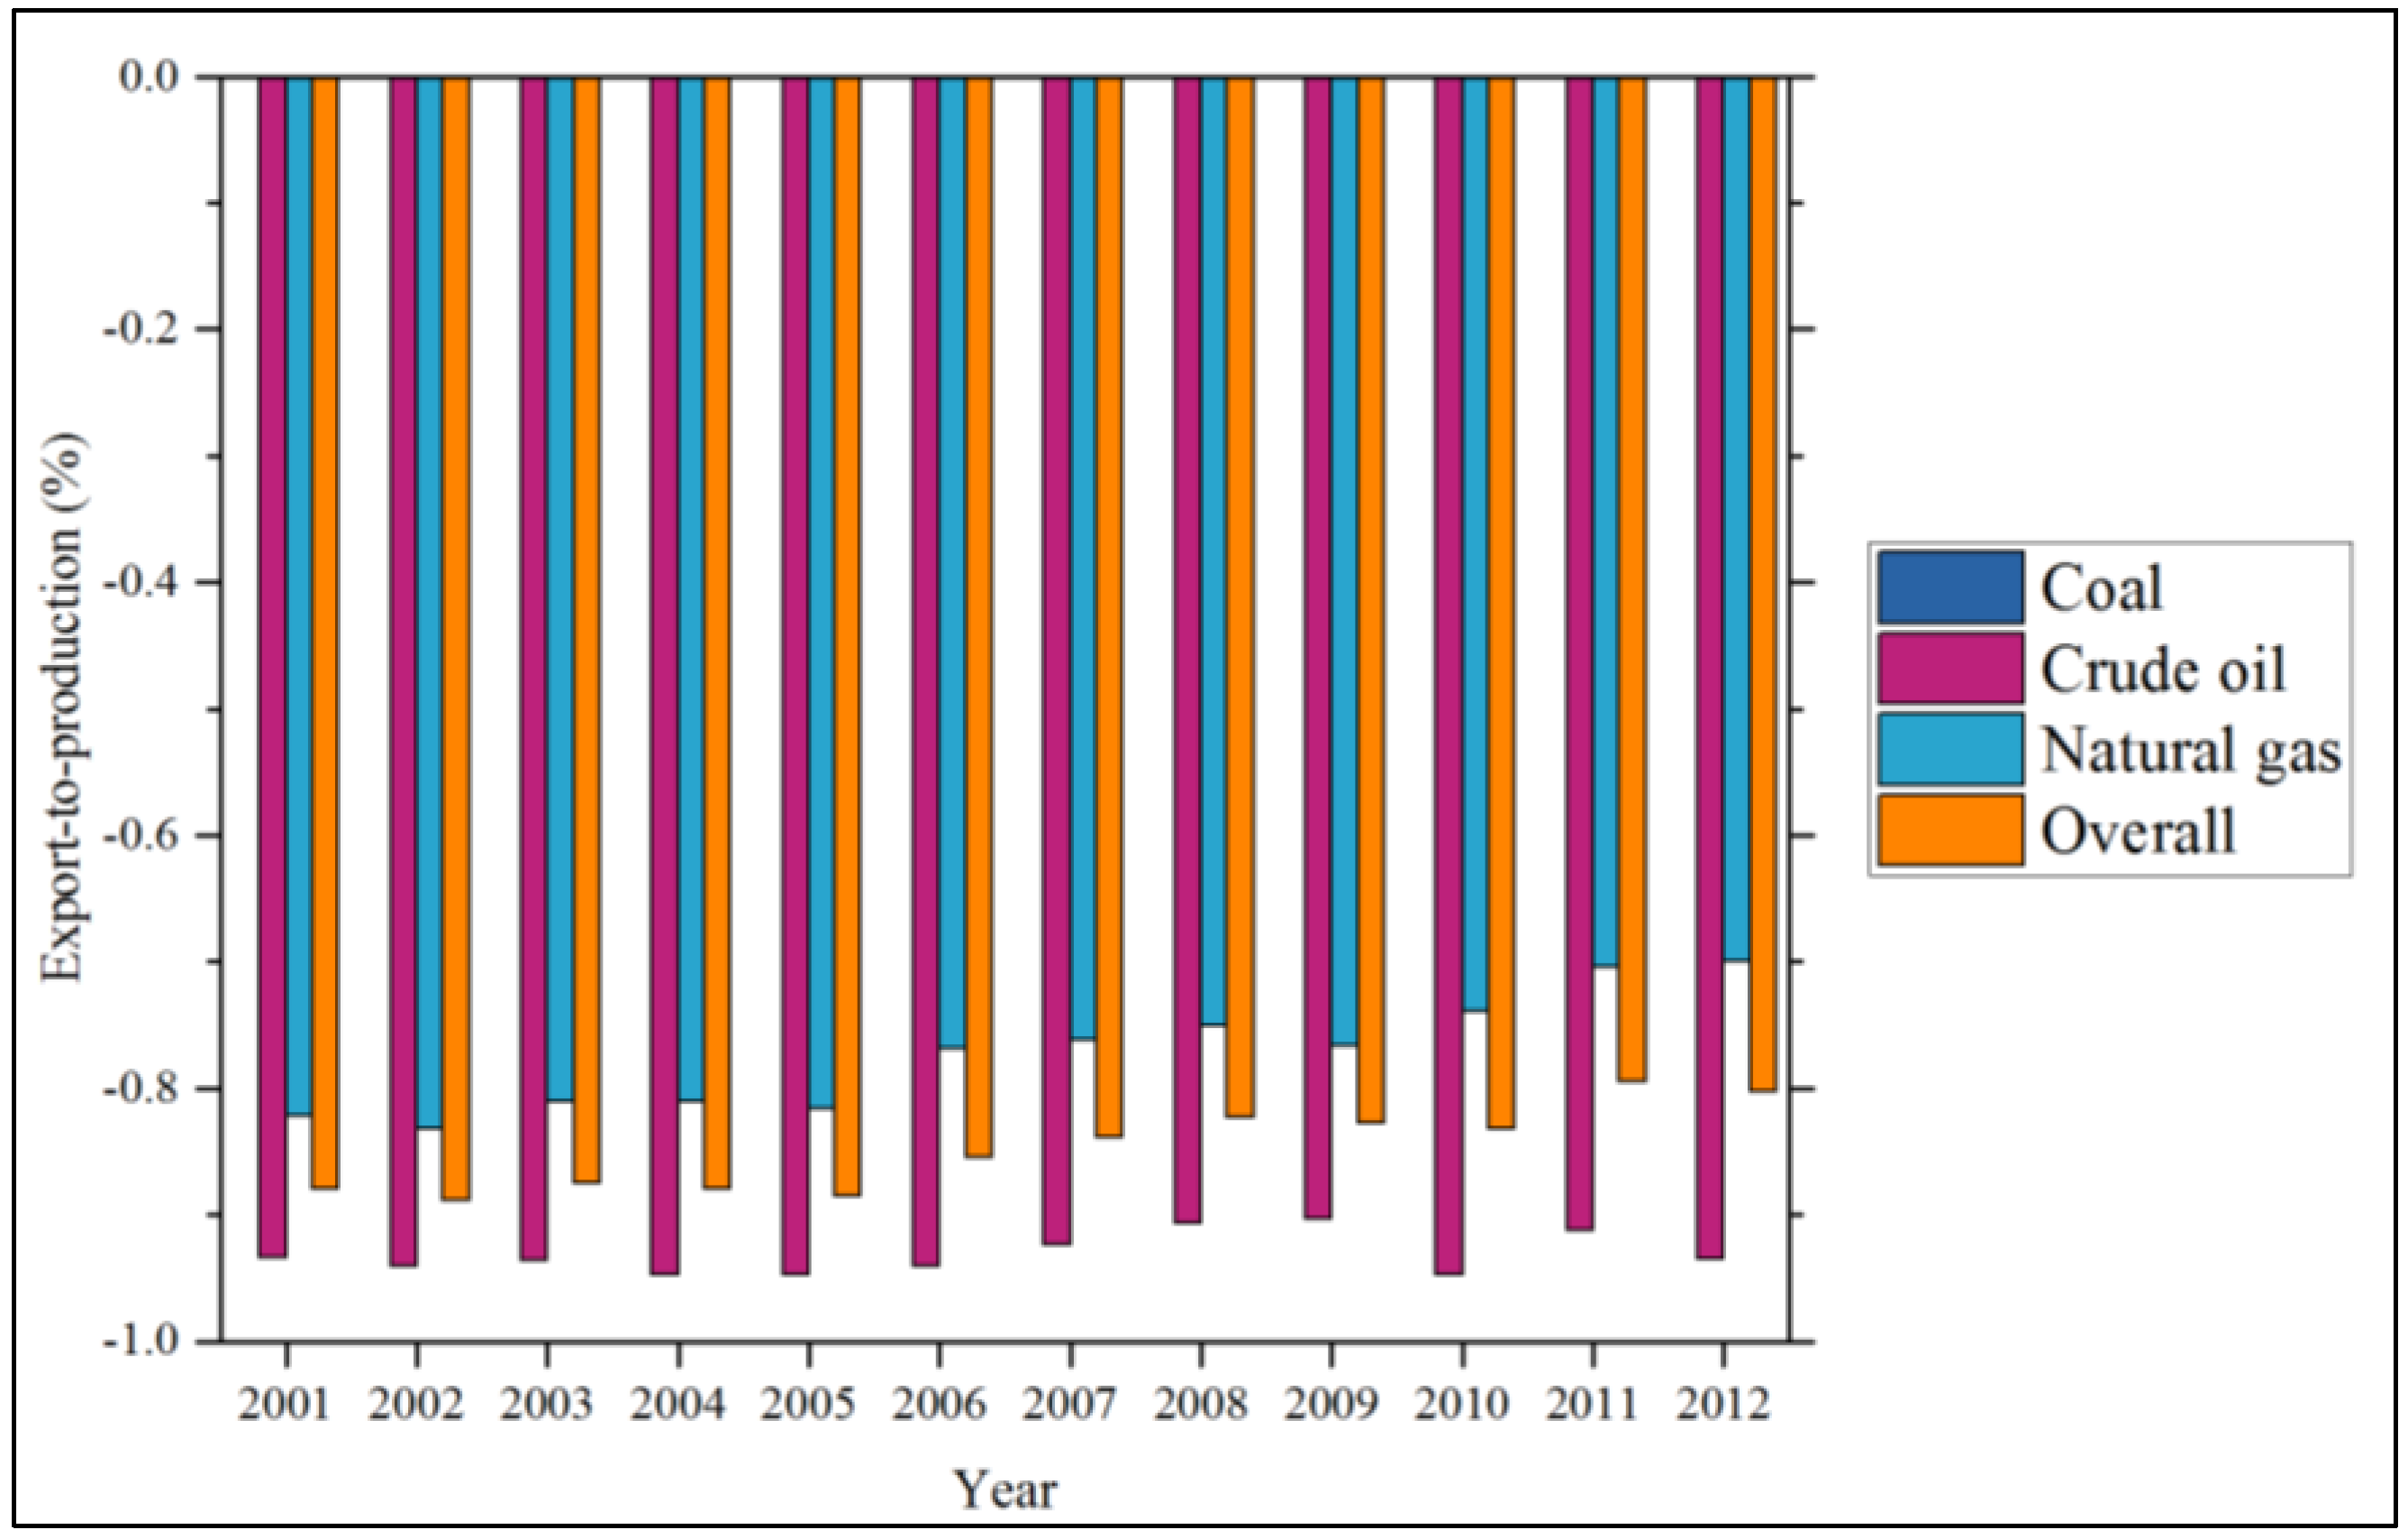
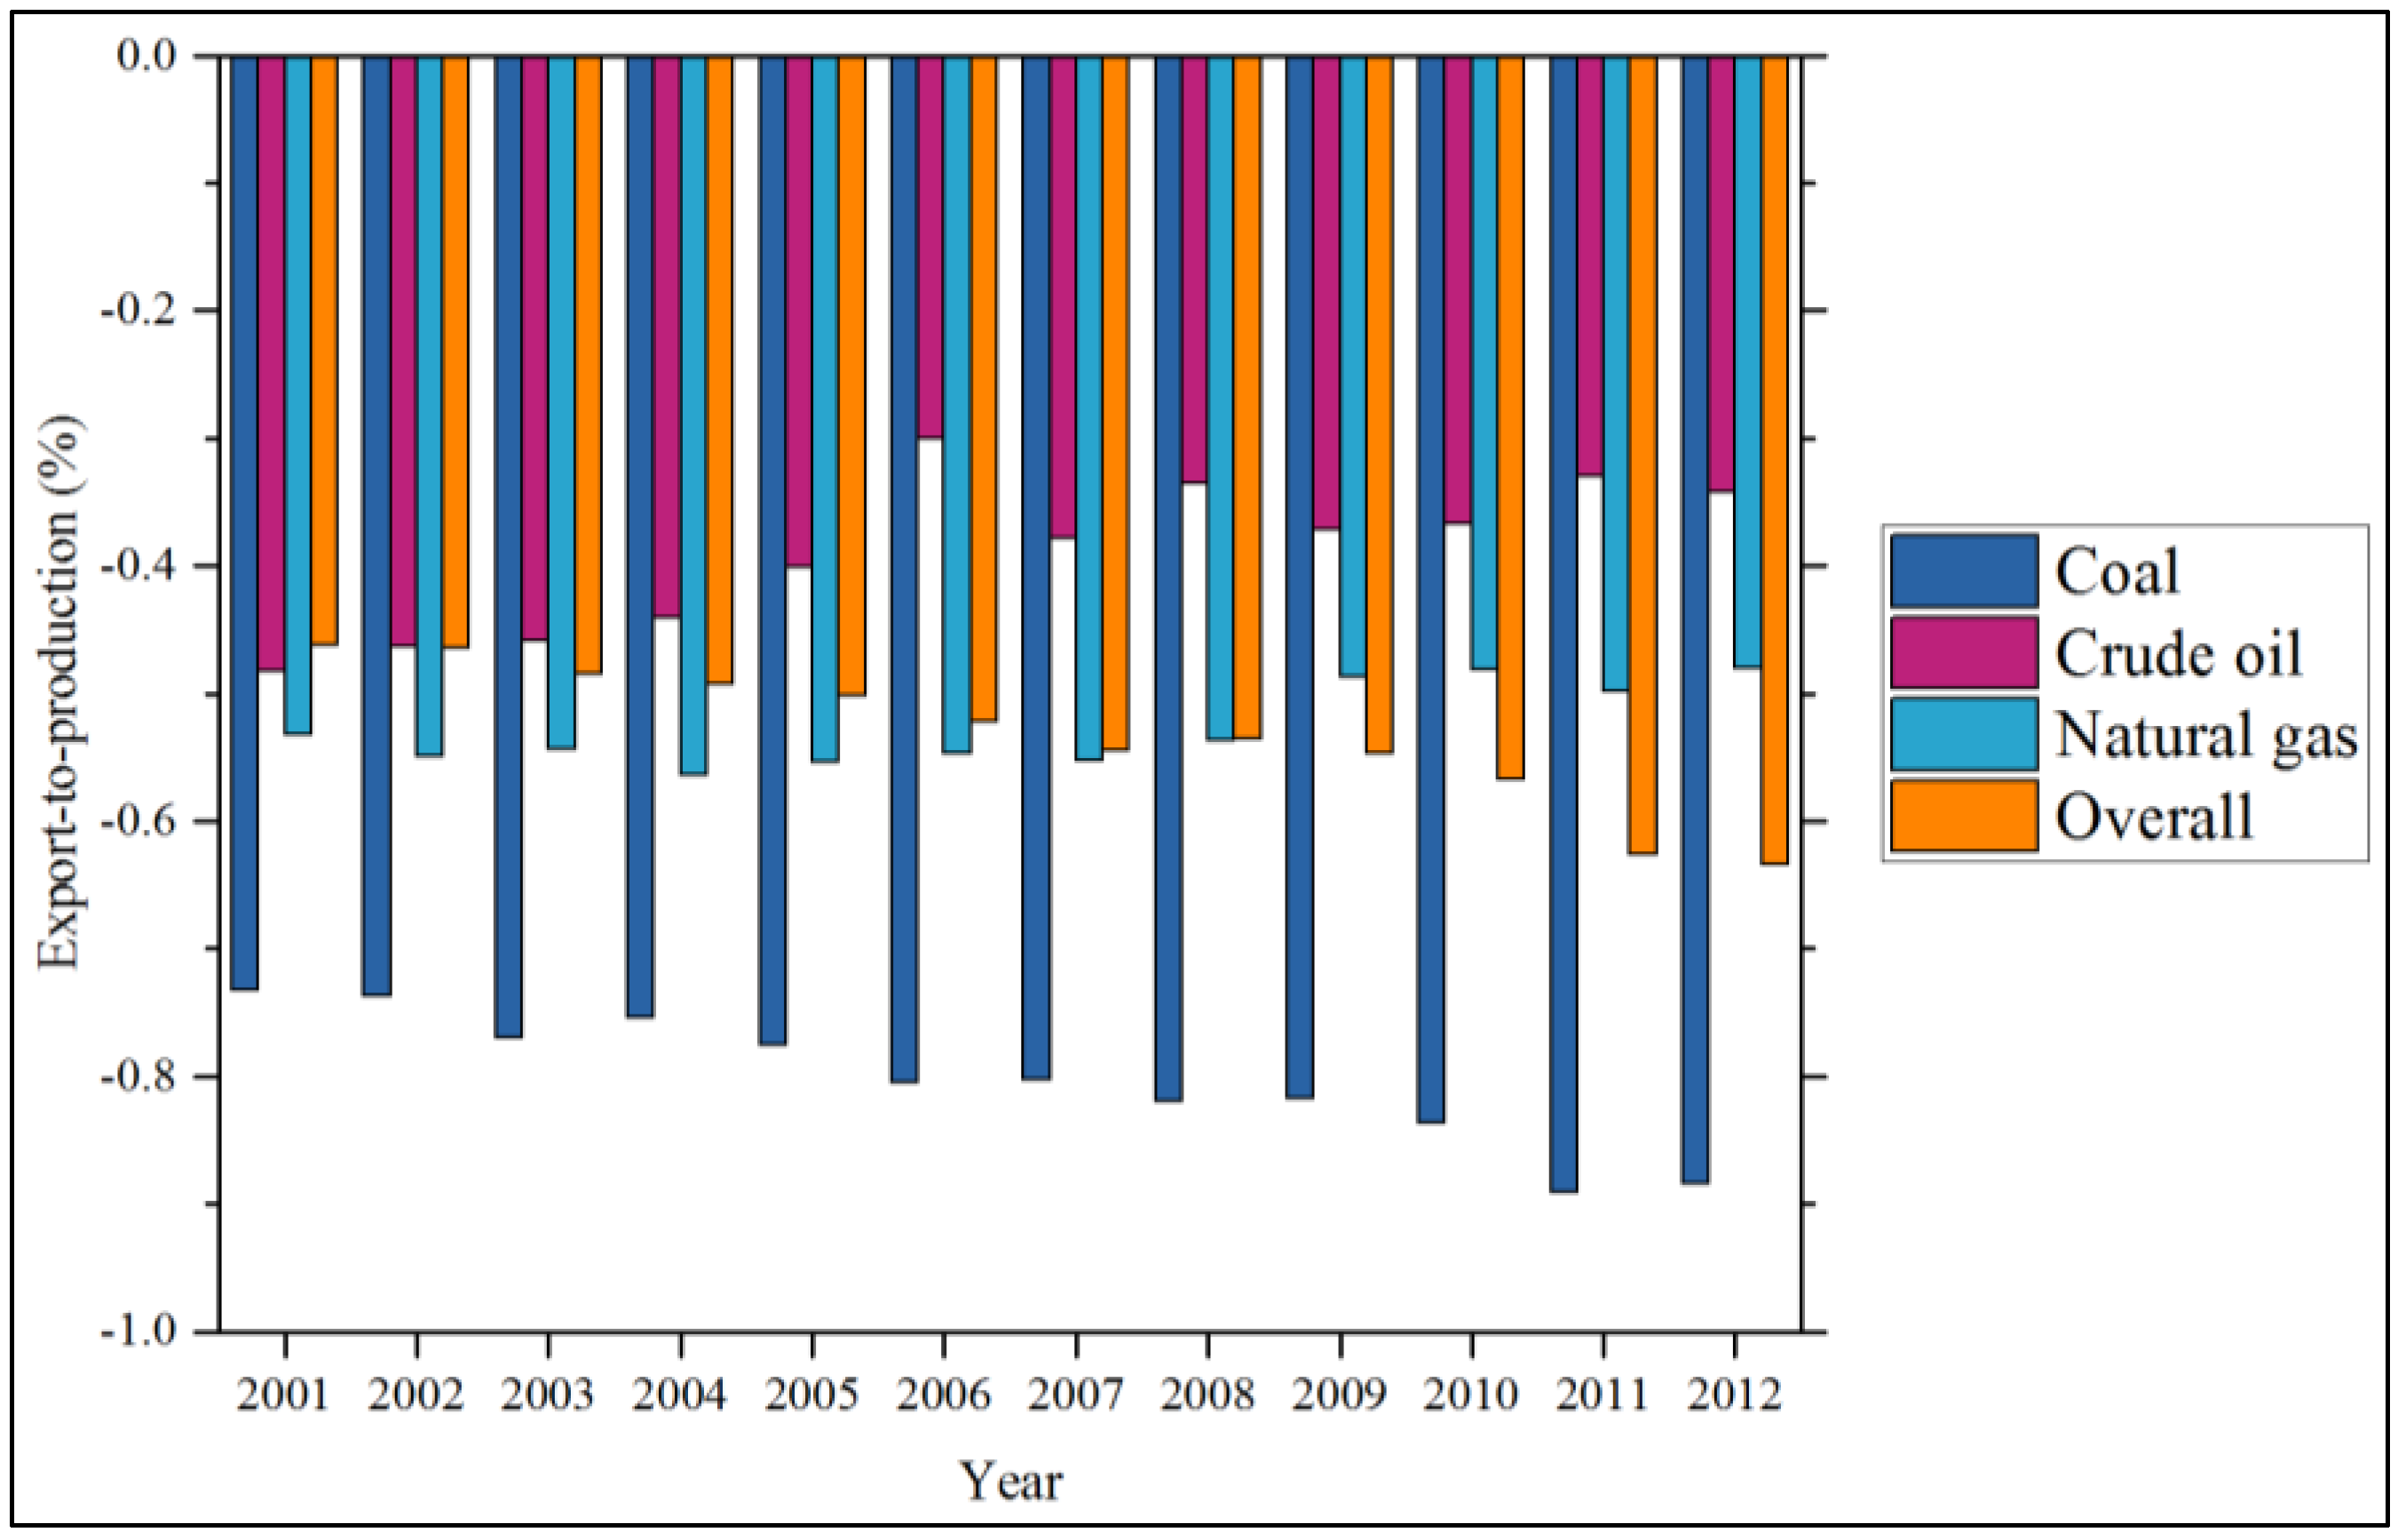
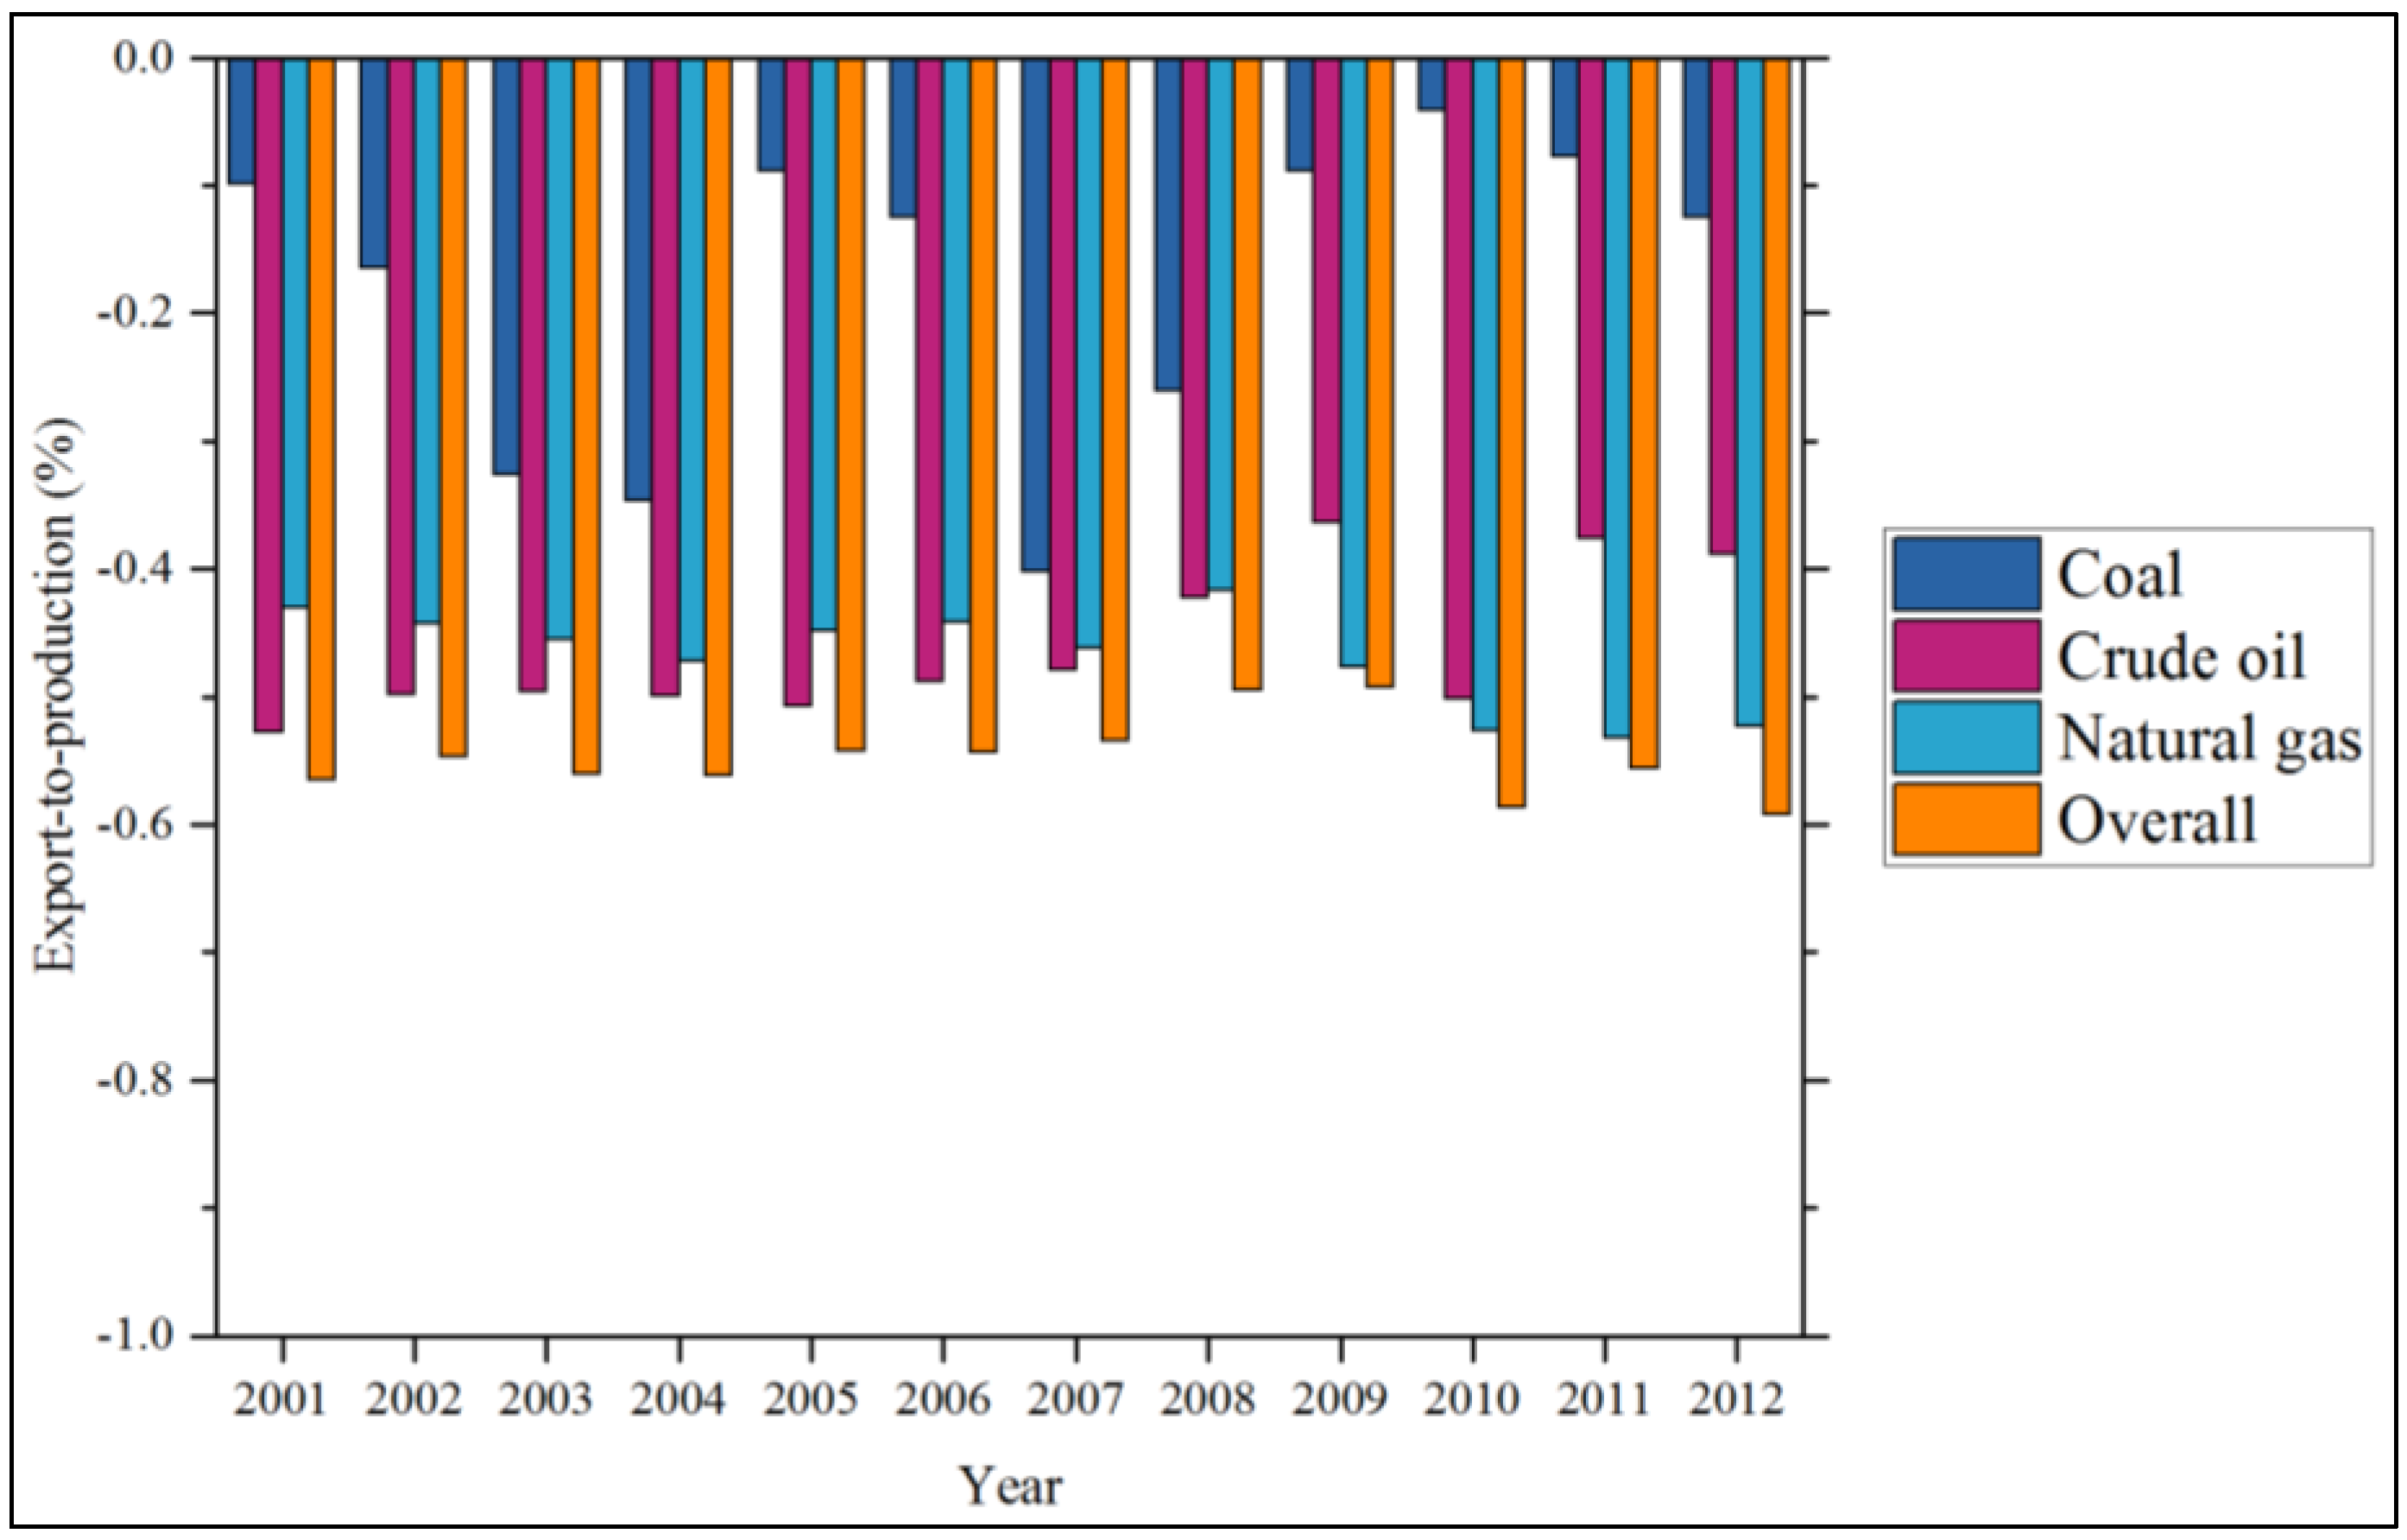
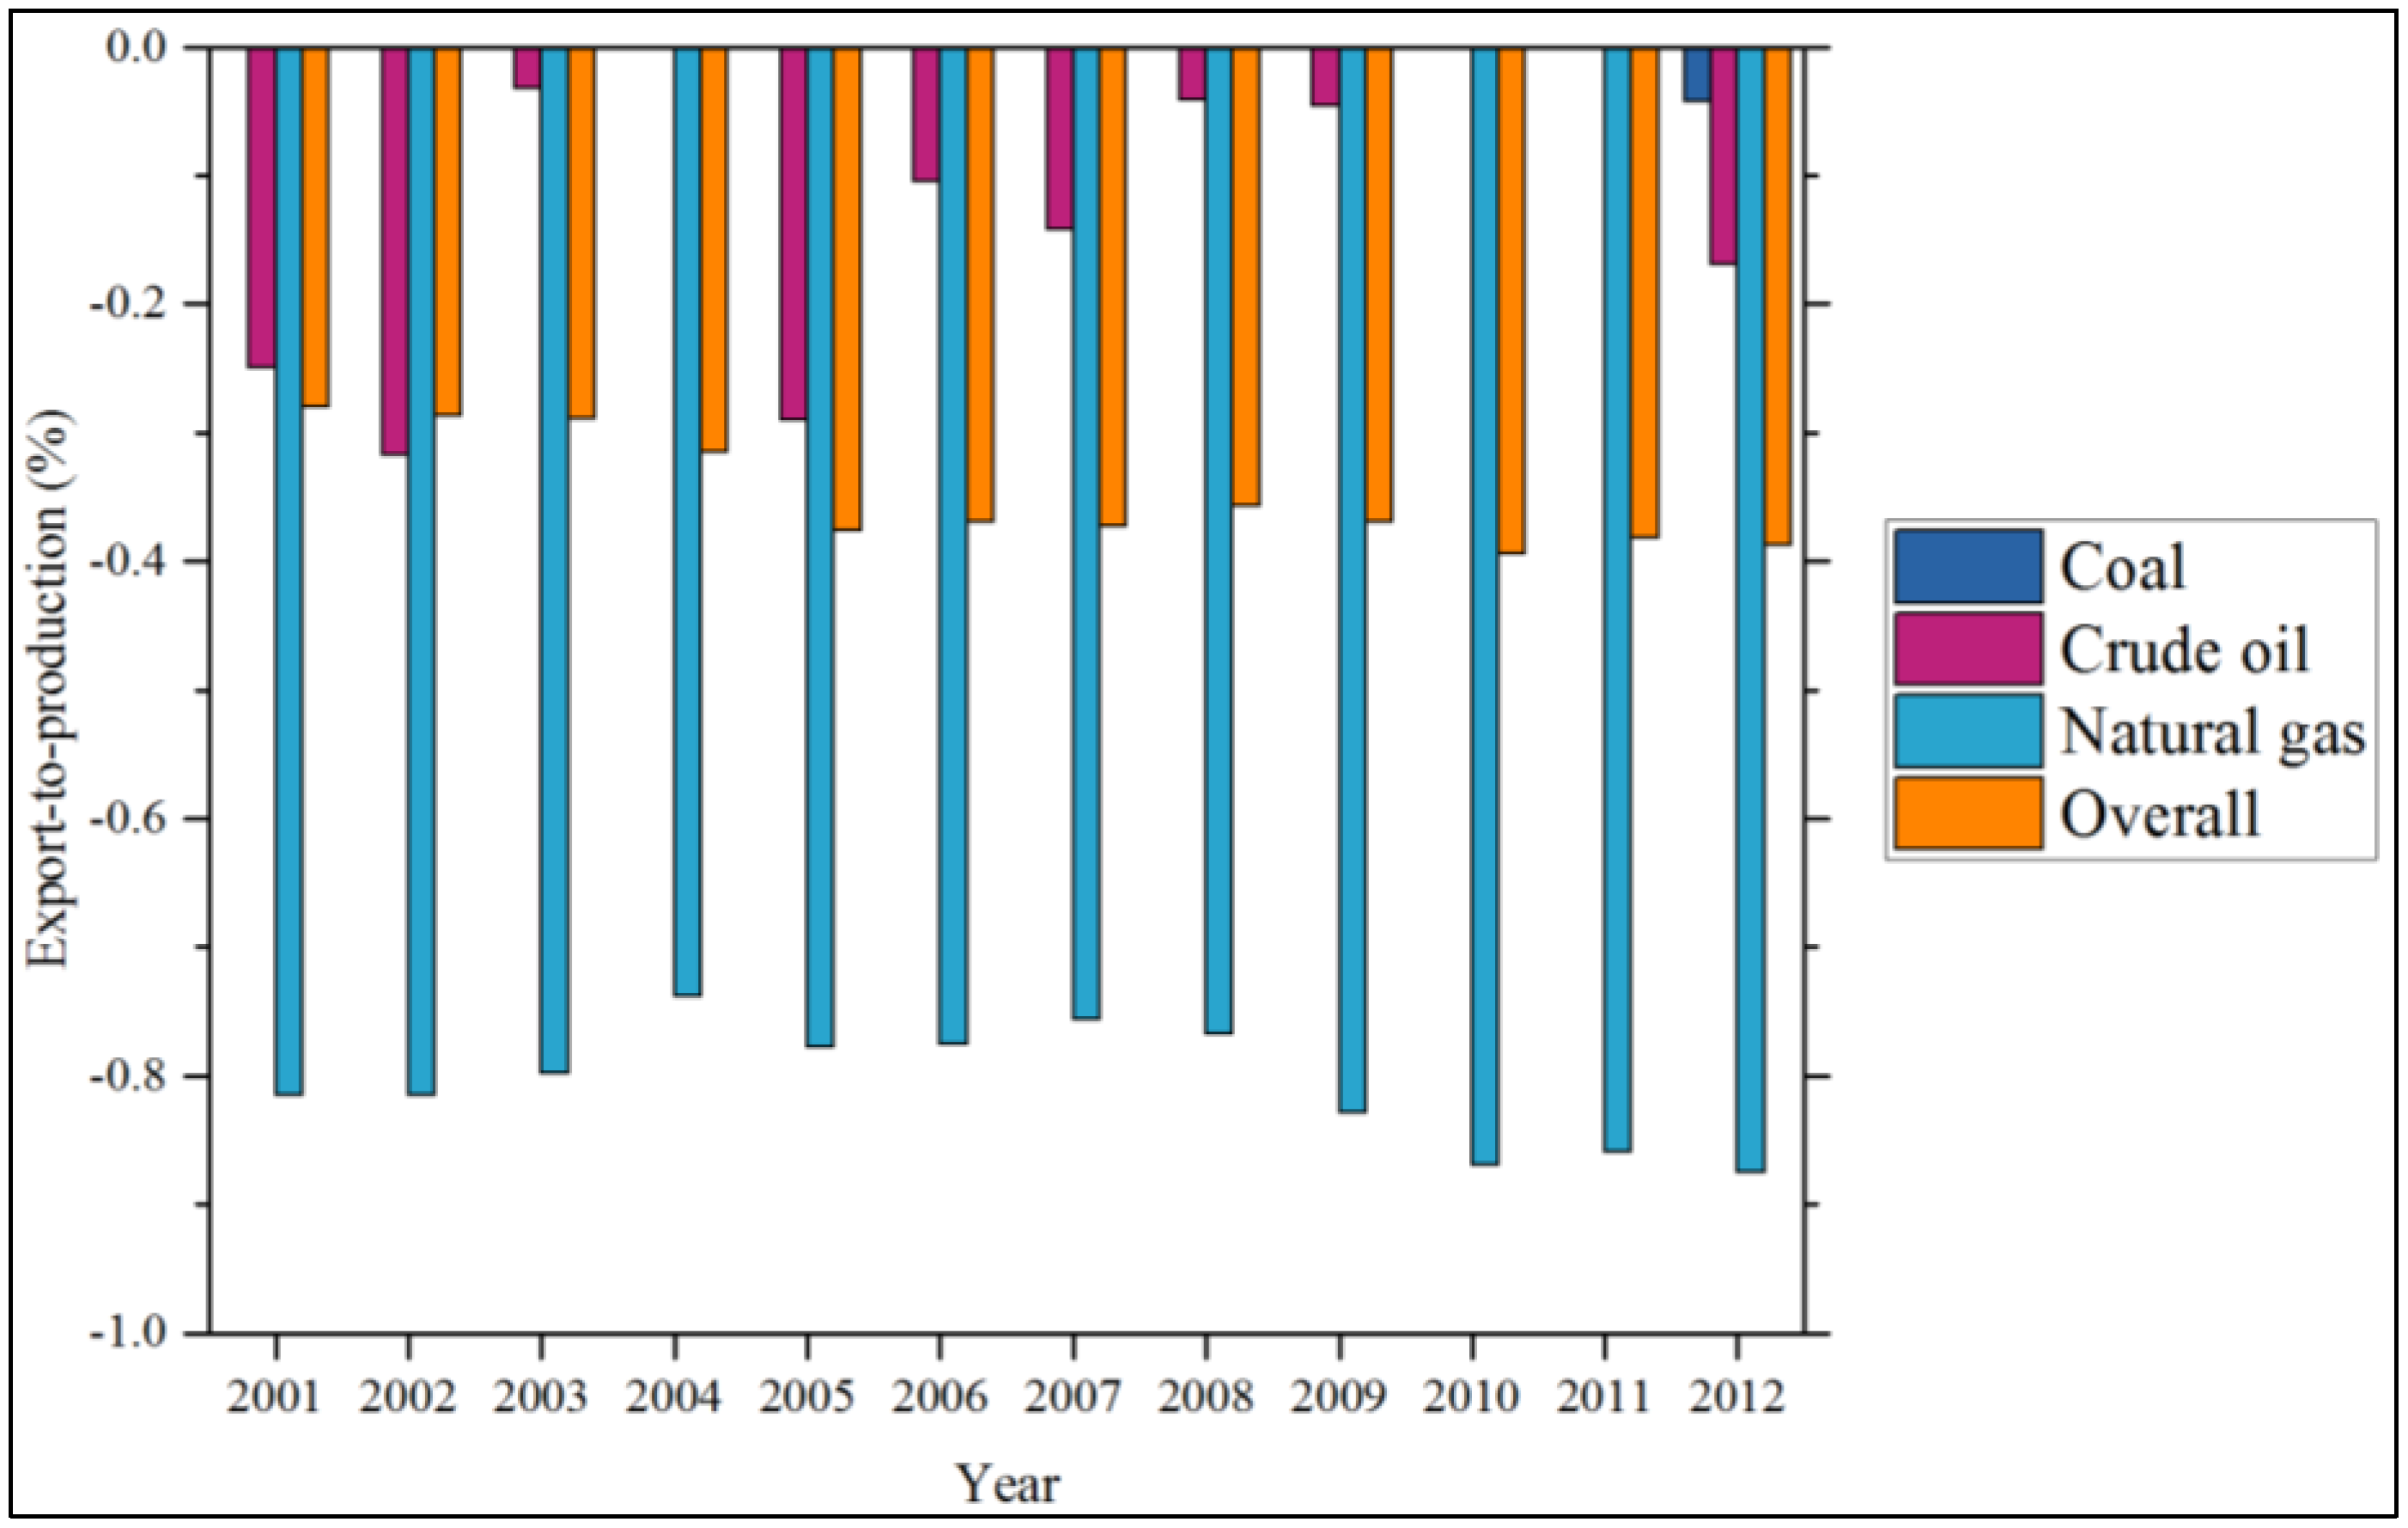
For the fourth component, the reliance on overseas energy resources and/or external energy demand is a major concern. Since ASEAN members are a mixture of both energy-importing and energy-exporting countries, reliance on external factors is thus divided into overseas resources and overseas demands. The indicator of “energy trade per GDP” draws an overall image of how much the economy is open to international energy trade, the extent to which energy exports contribute to economic growth, and how much the country spends on energy imports. For exporting countries, the indicator regarding the export-to-production ratio was developed to reflect the extent to which the domestic production of a particular energy product is bonded to external demands. The assessment was used to measure three primary energy sources: coal, crude oil, and natural gas.
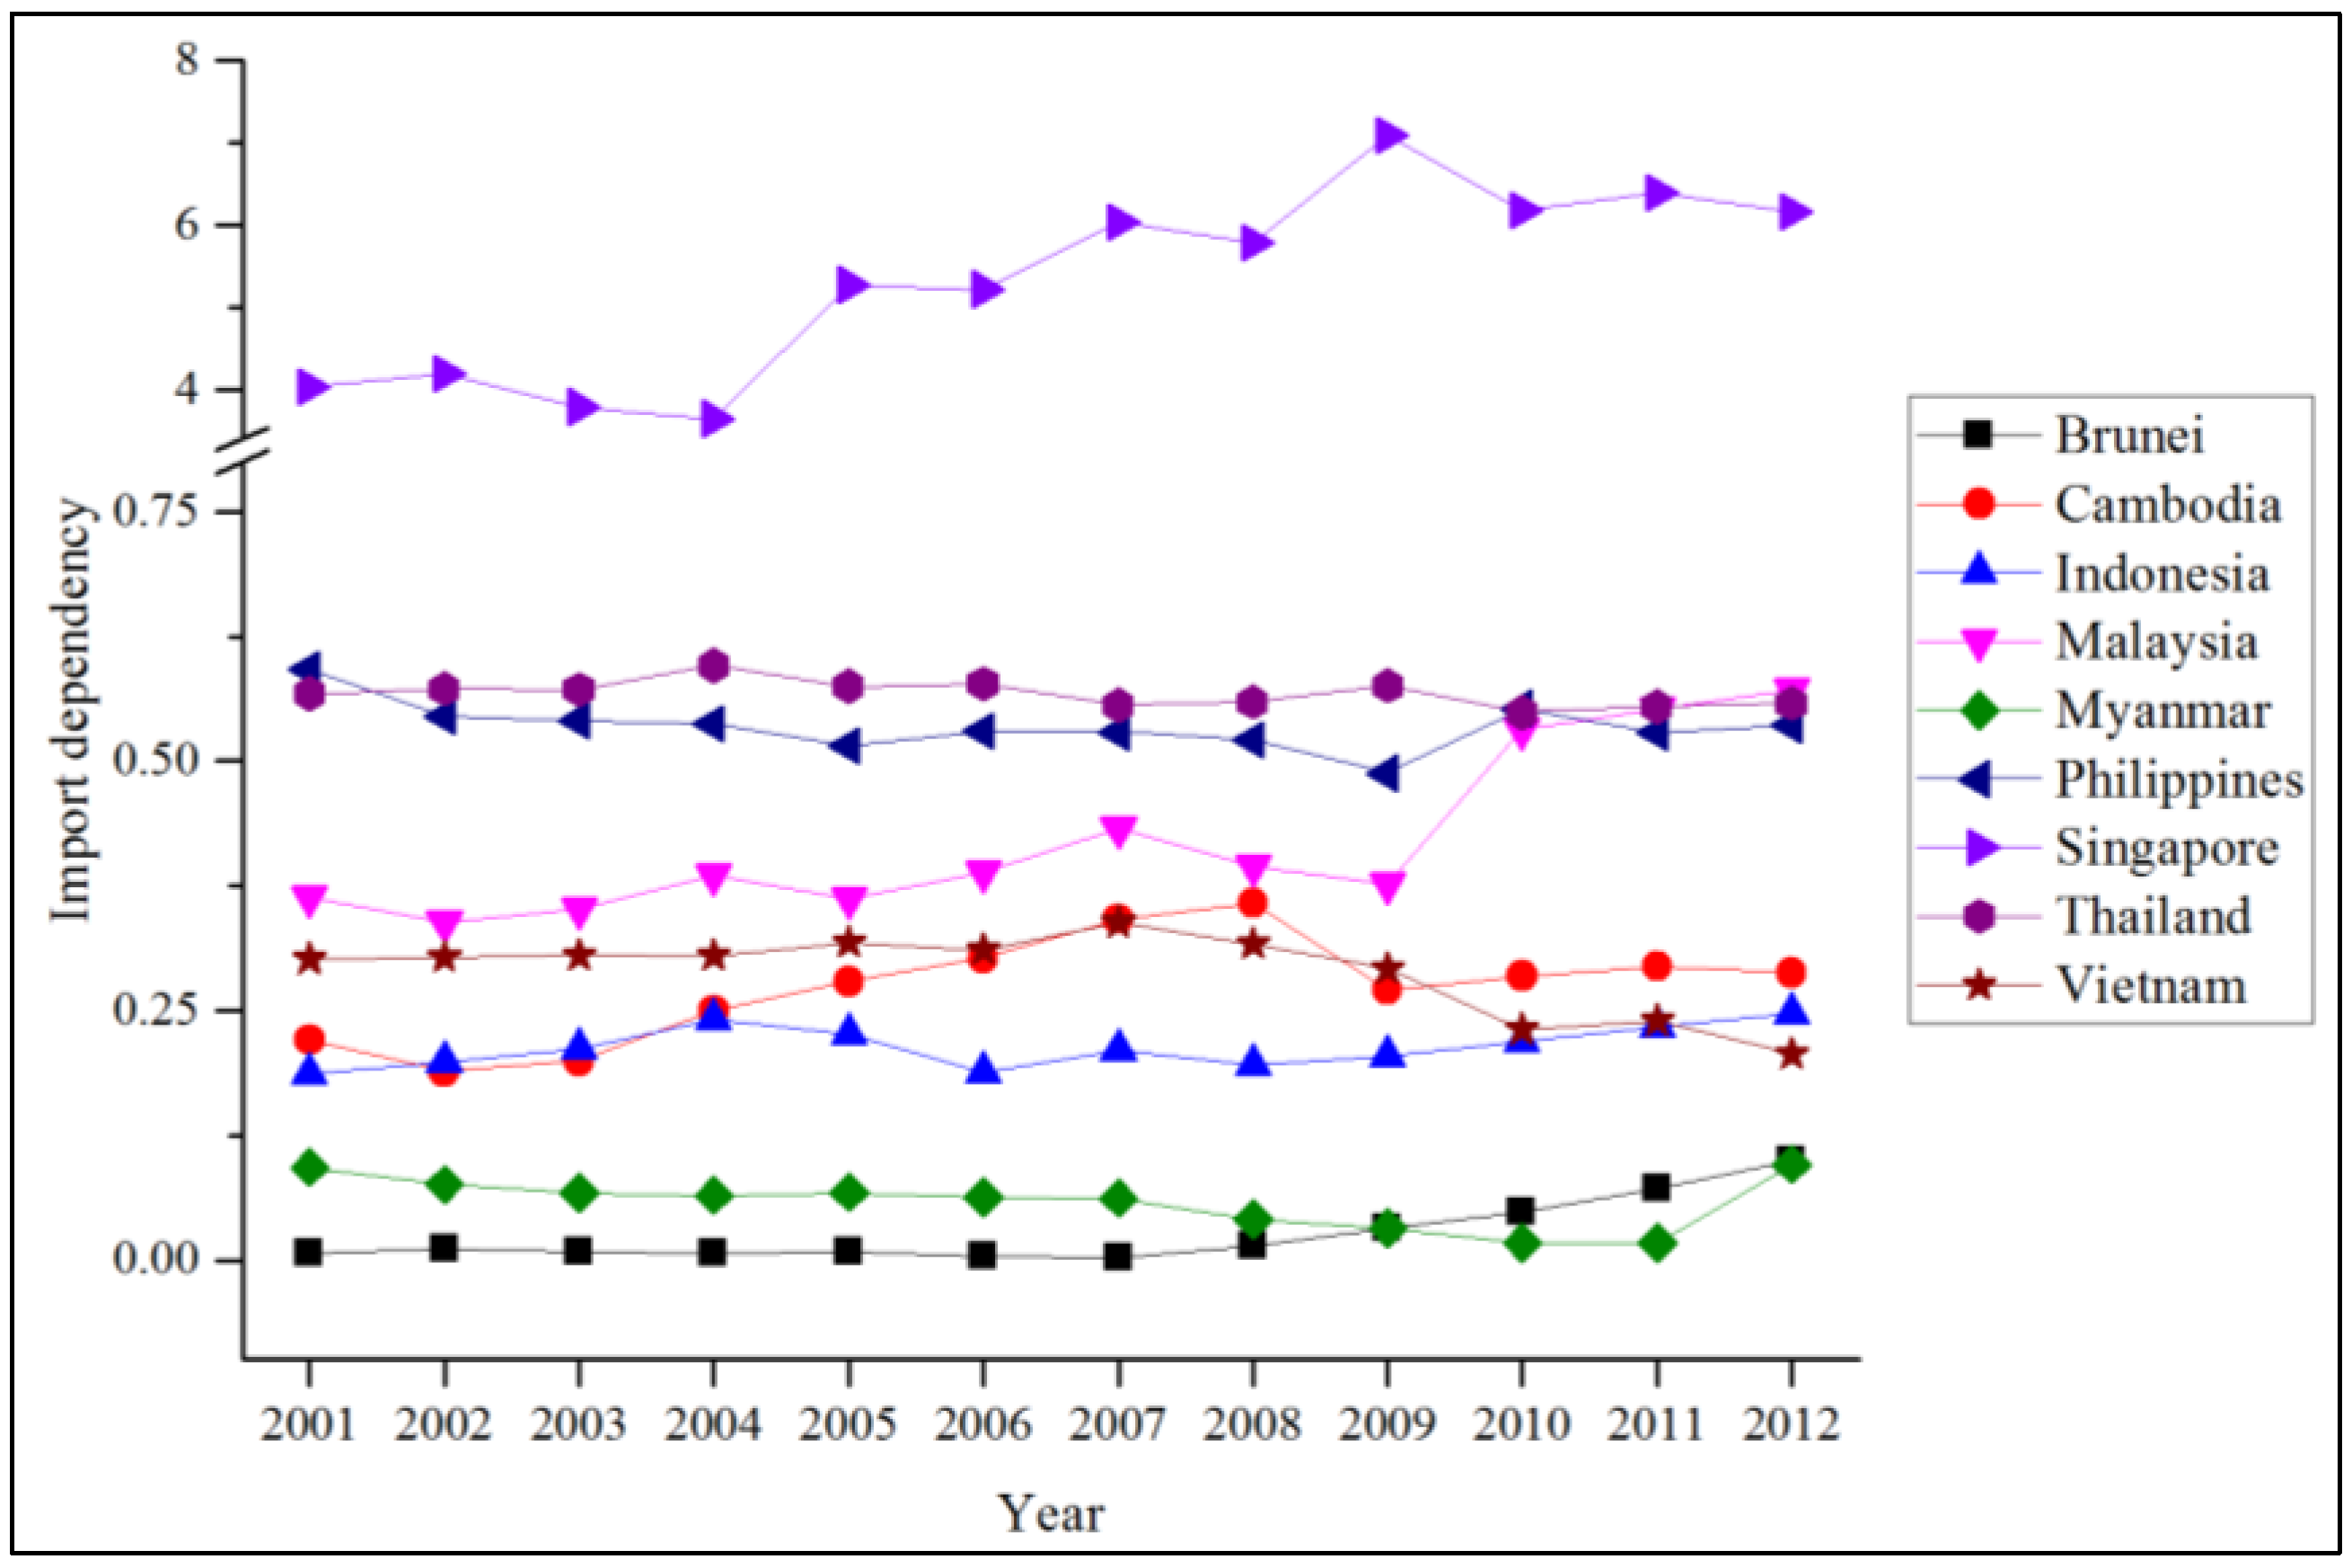
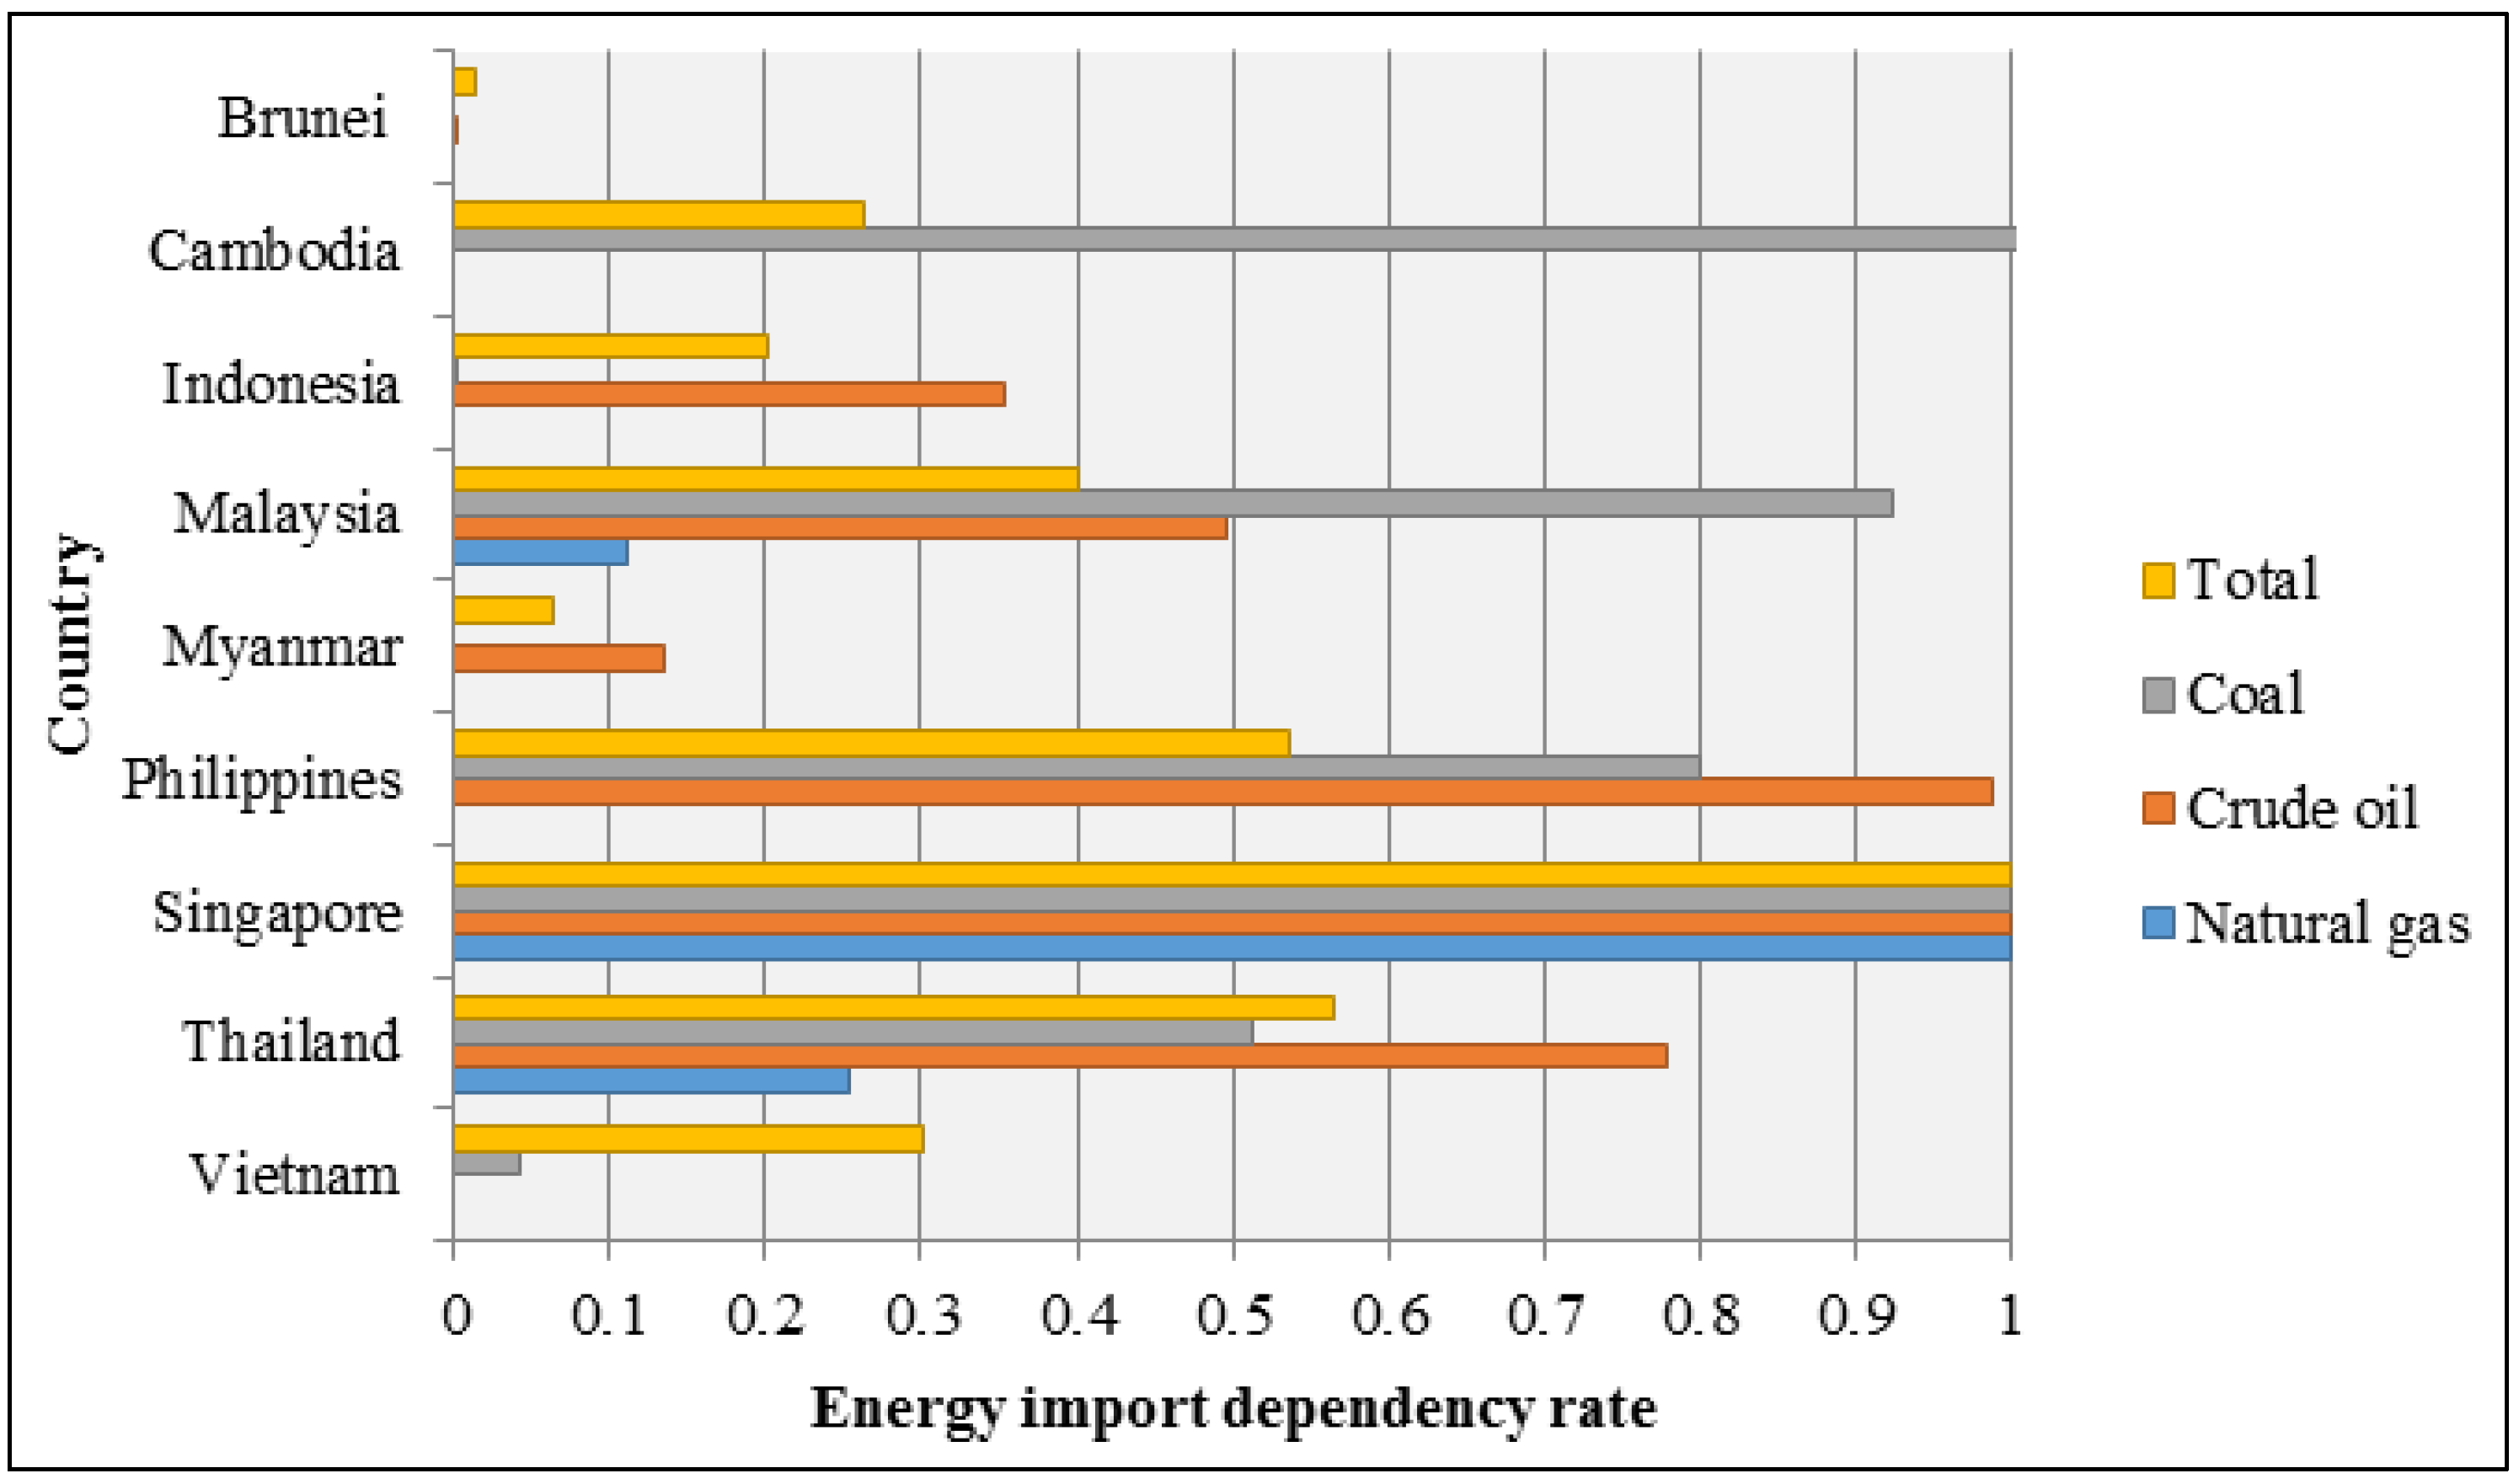
Focusing on the imports, “energy import dependency” shows the extent to which a country relies on imported fuels in order to meet the demands. In this indicator, energy products include coal, crude oil, natural gas, and the total of all energy products (including renewables). The import dependency rate is calculated based on the ratio of imported energy products to the total primary energy supply. The import dependency rate reflects the reliance of the country on imported overseas resources. The rate usually ranges from 0 to 1. A higher value implies a higher dependence, which infers more exposure to energy vulnerability.
To reflect the geographical vulnerability of the overseas supply, “reliance on Middle East imports” and “intra-regional energy imports” indicators were selected. The indicators show the share of the imports from the Middle East (calculated for crude oil, natural gas, and refined oil) and from intra-ASEAN countries (calculated for coal, crude oil, natural gas, and refined oil) in total world imports. The reason for focusing on the Middle East and intra-ASEAN countries is to show energy (inter)dependence within the region and otherwise. Equivalent to the import dependency rate, the two area-specific reliance indicators also range from 0 to 1. A higher value signifies a greater dependence on the import source.
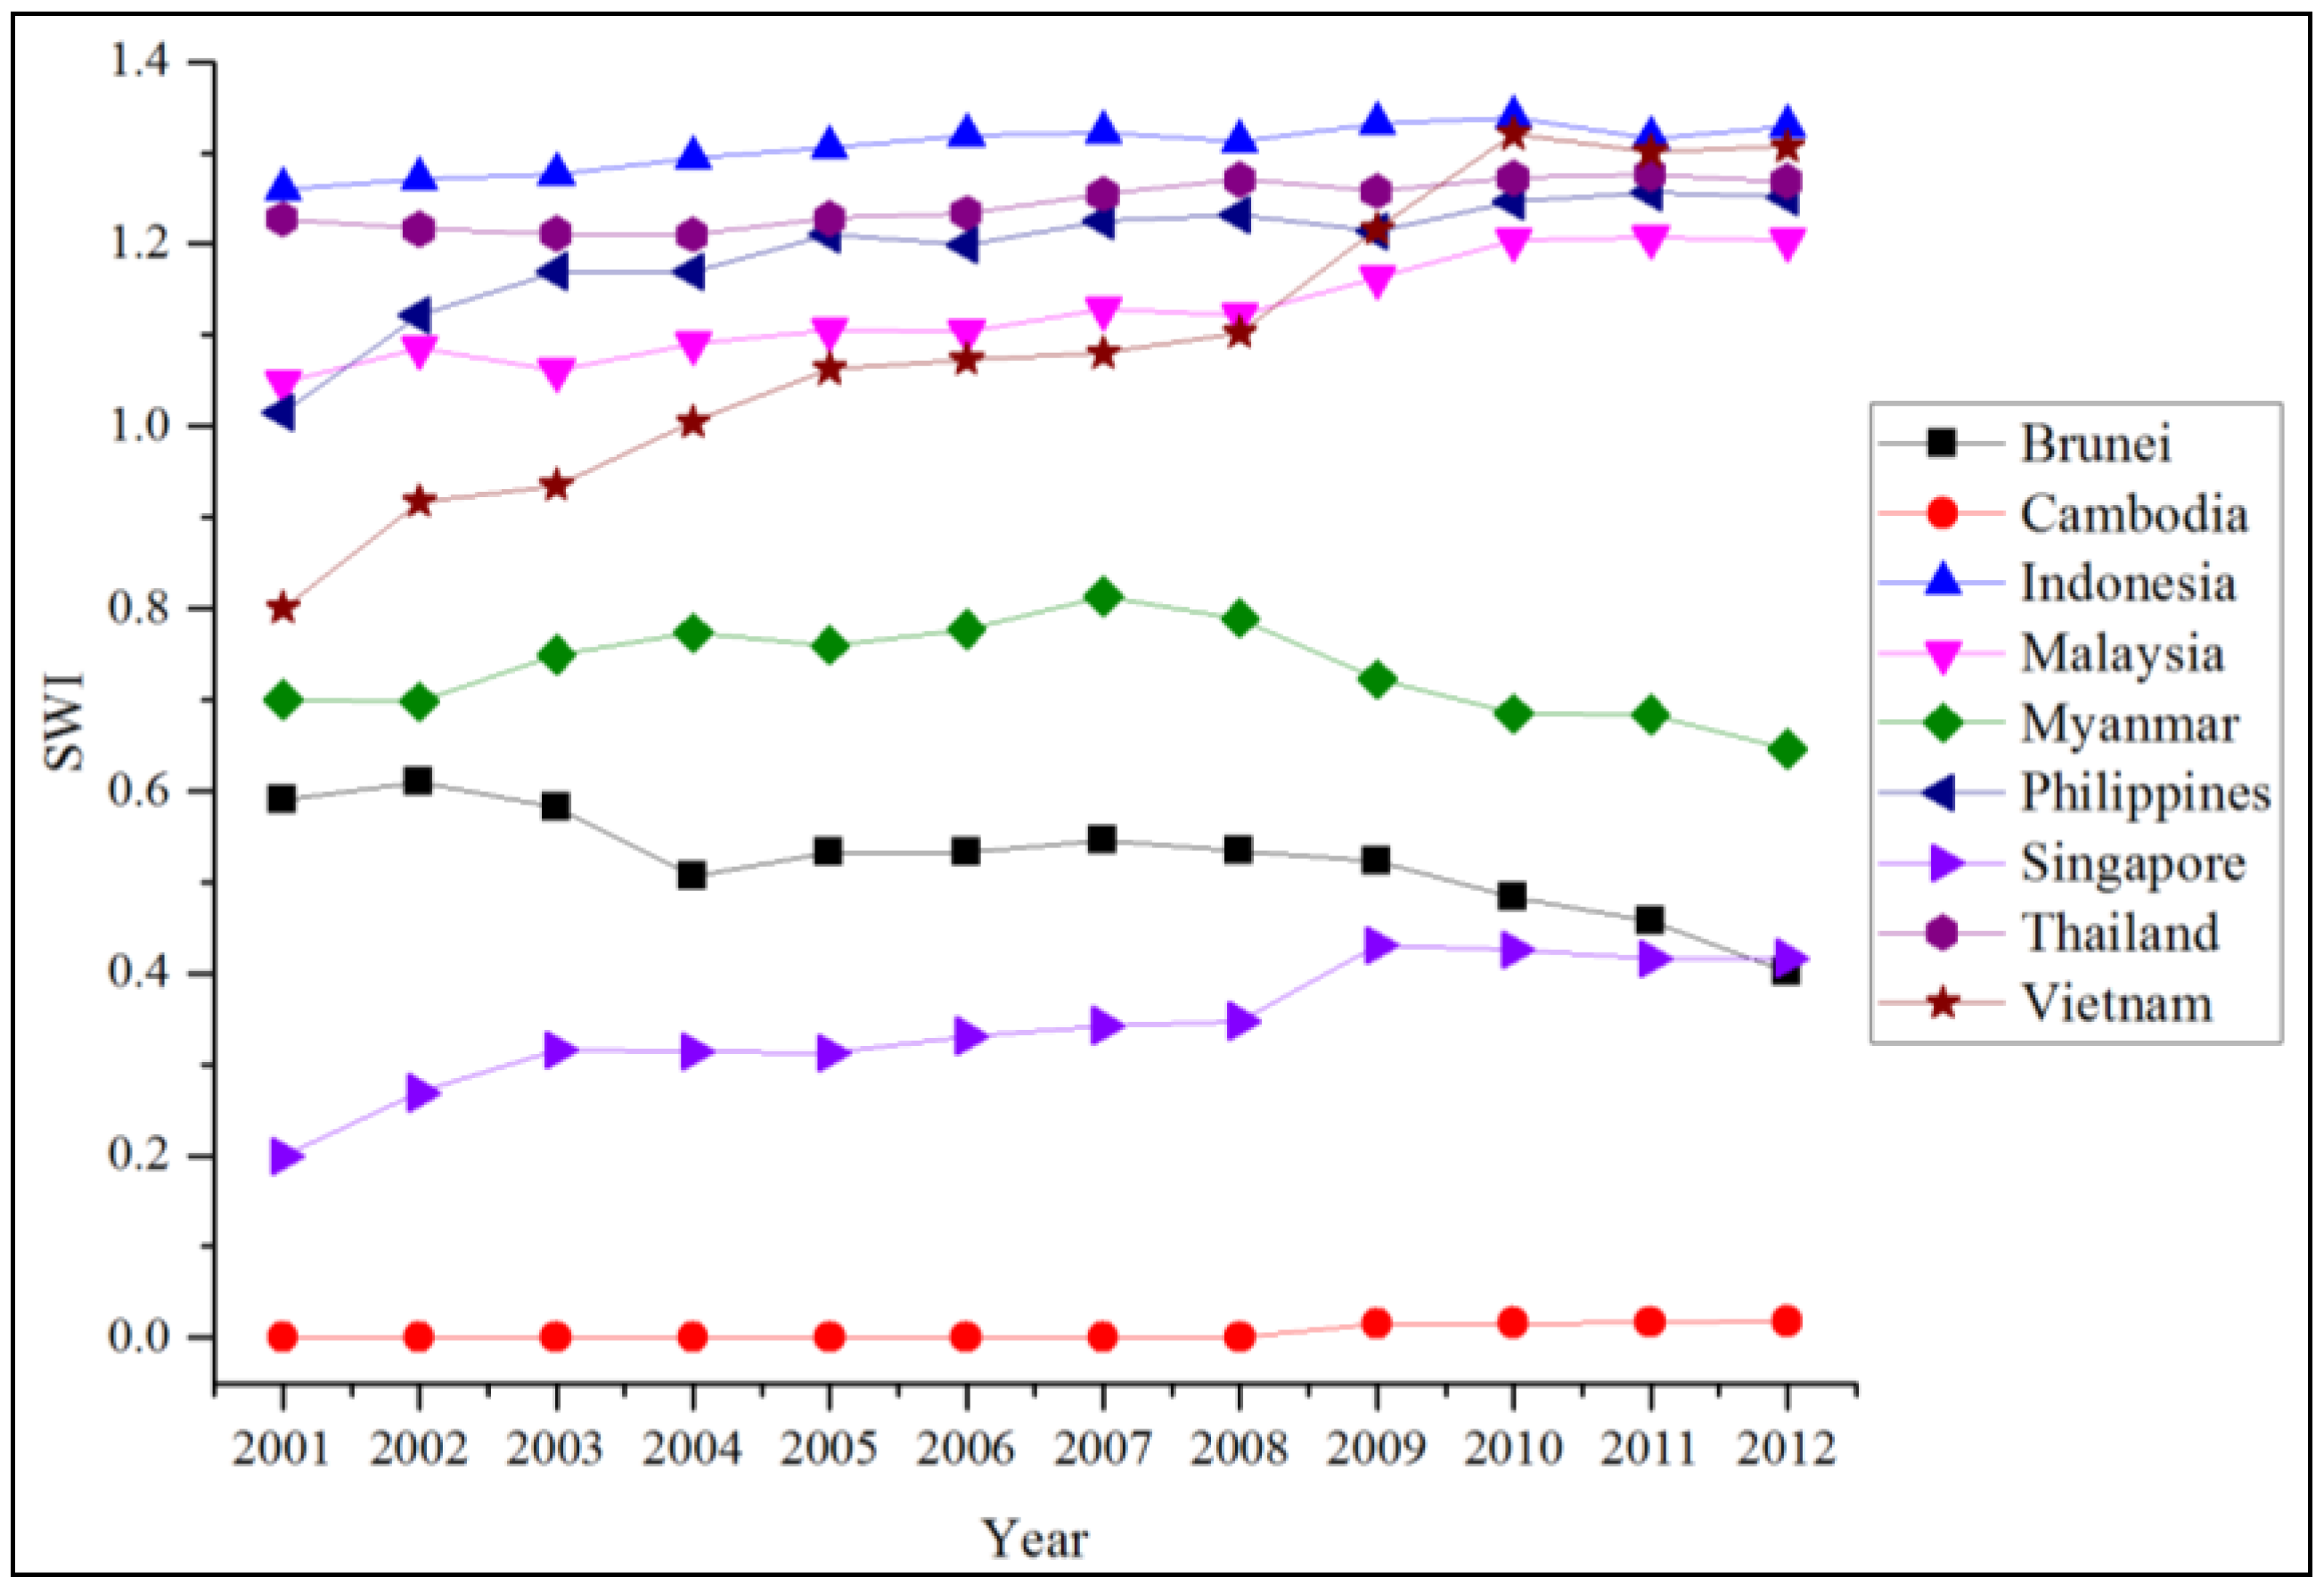
Diversification is the key to enhance energy security. The fifth component focuses on supply diversification and supplier (or market) diversification. The Shannon-Wiener Index (SWI) was chosen to measure the degree of primary energy supply diversity. SWI is often used to measure the diversity and evenness of the products or, in this case, energy sources. The formula is where
N represents the total number of energy sources and
pi represents the share of energy supply from each source in a total primary energy supply. The index ranges from 0 to 2. A higher value of SWI refers to more diversified energy sources, which implies a more resilient energy supply, while a lower value represents low diversification of energy sources and, thus, poorer energy security. However, SWI does not reflect the disparity dimension of diversification [
35].
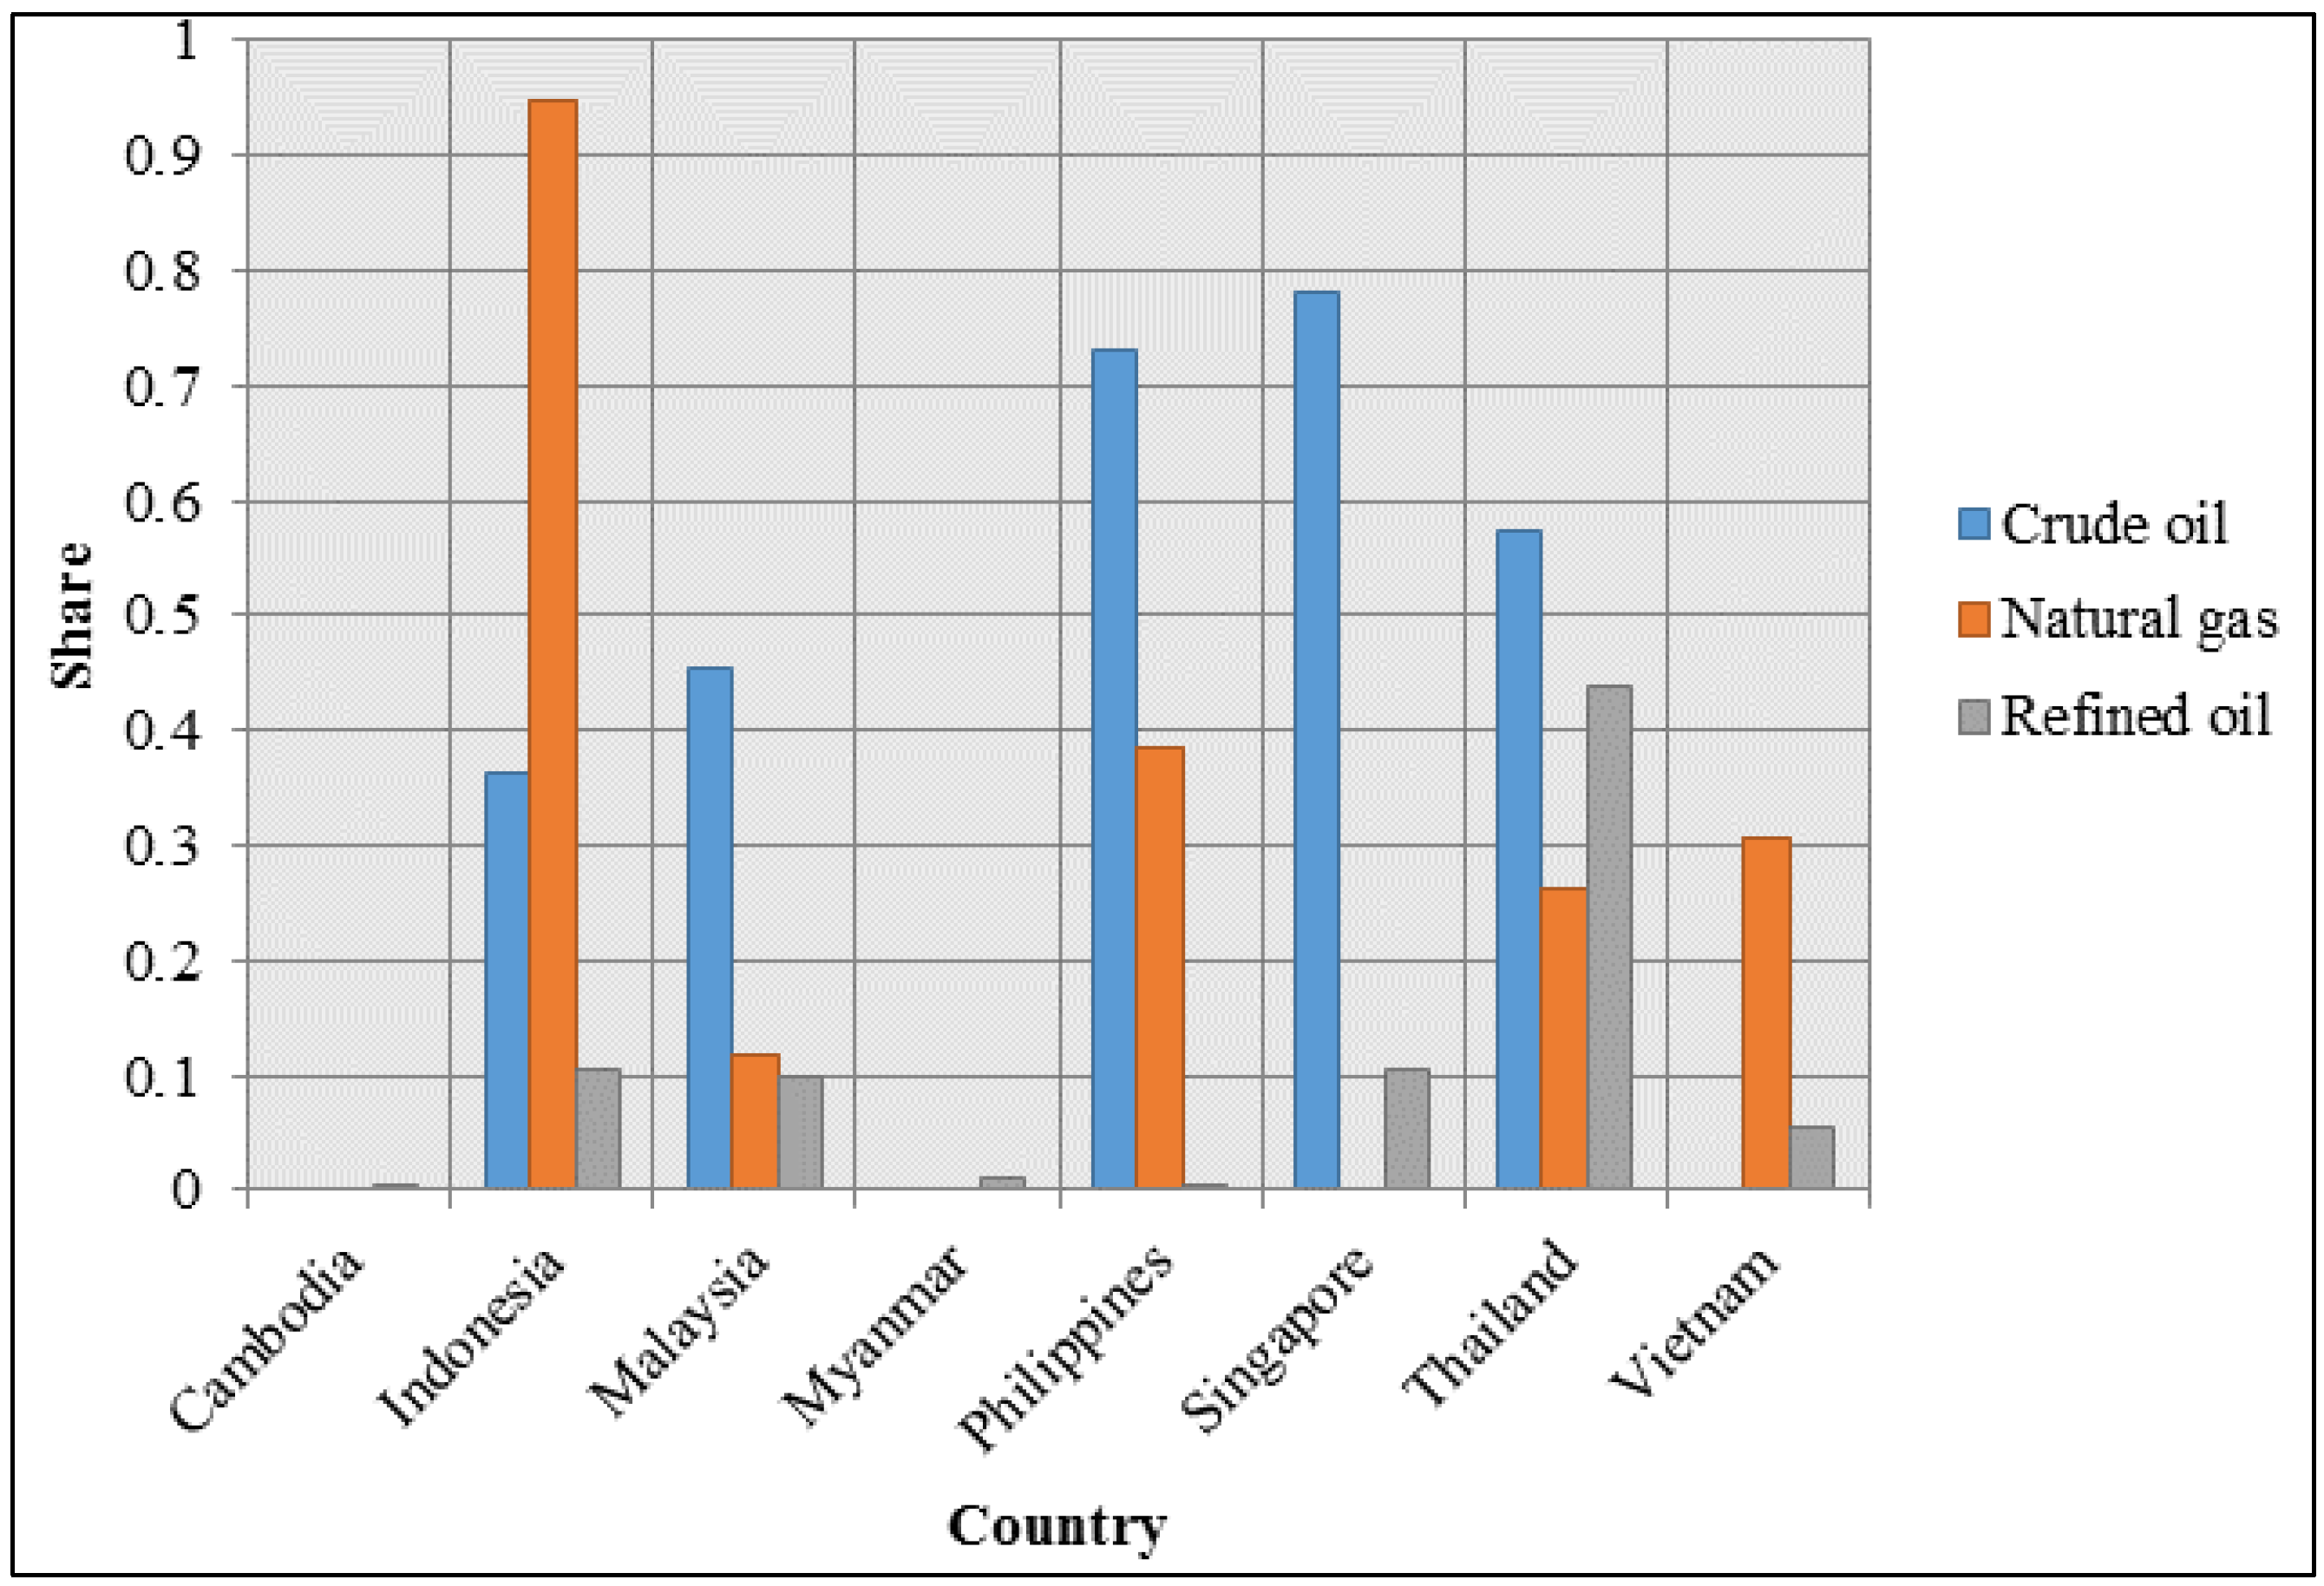
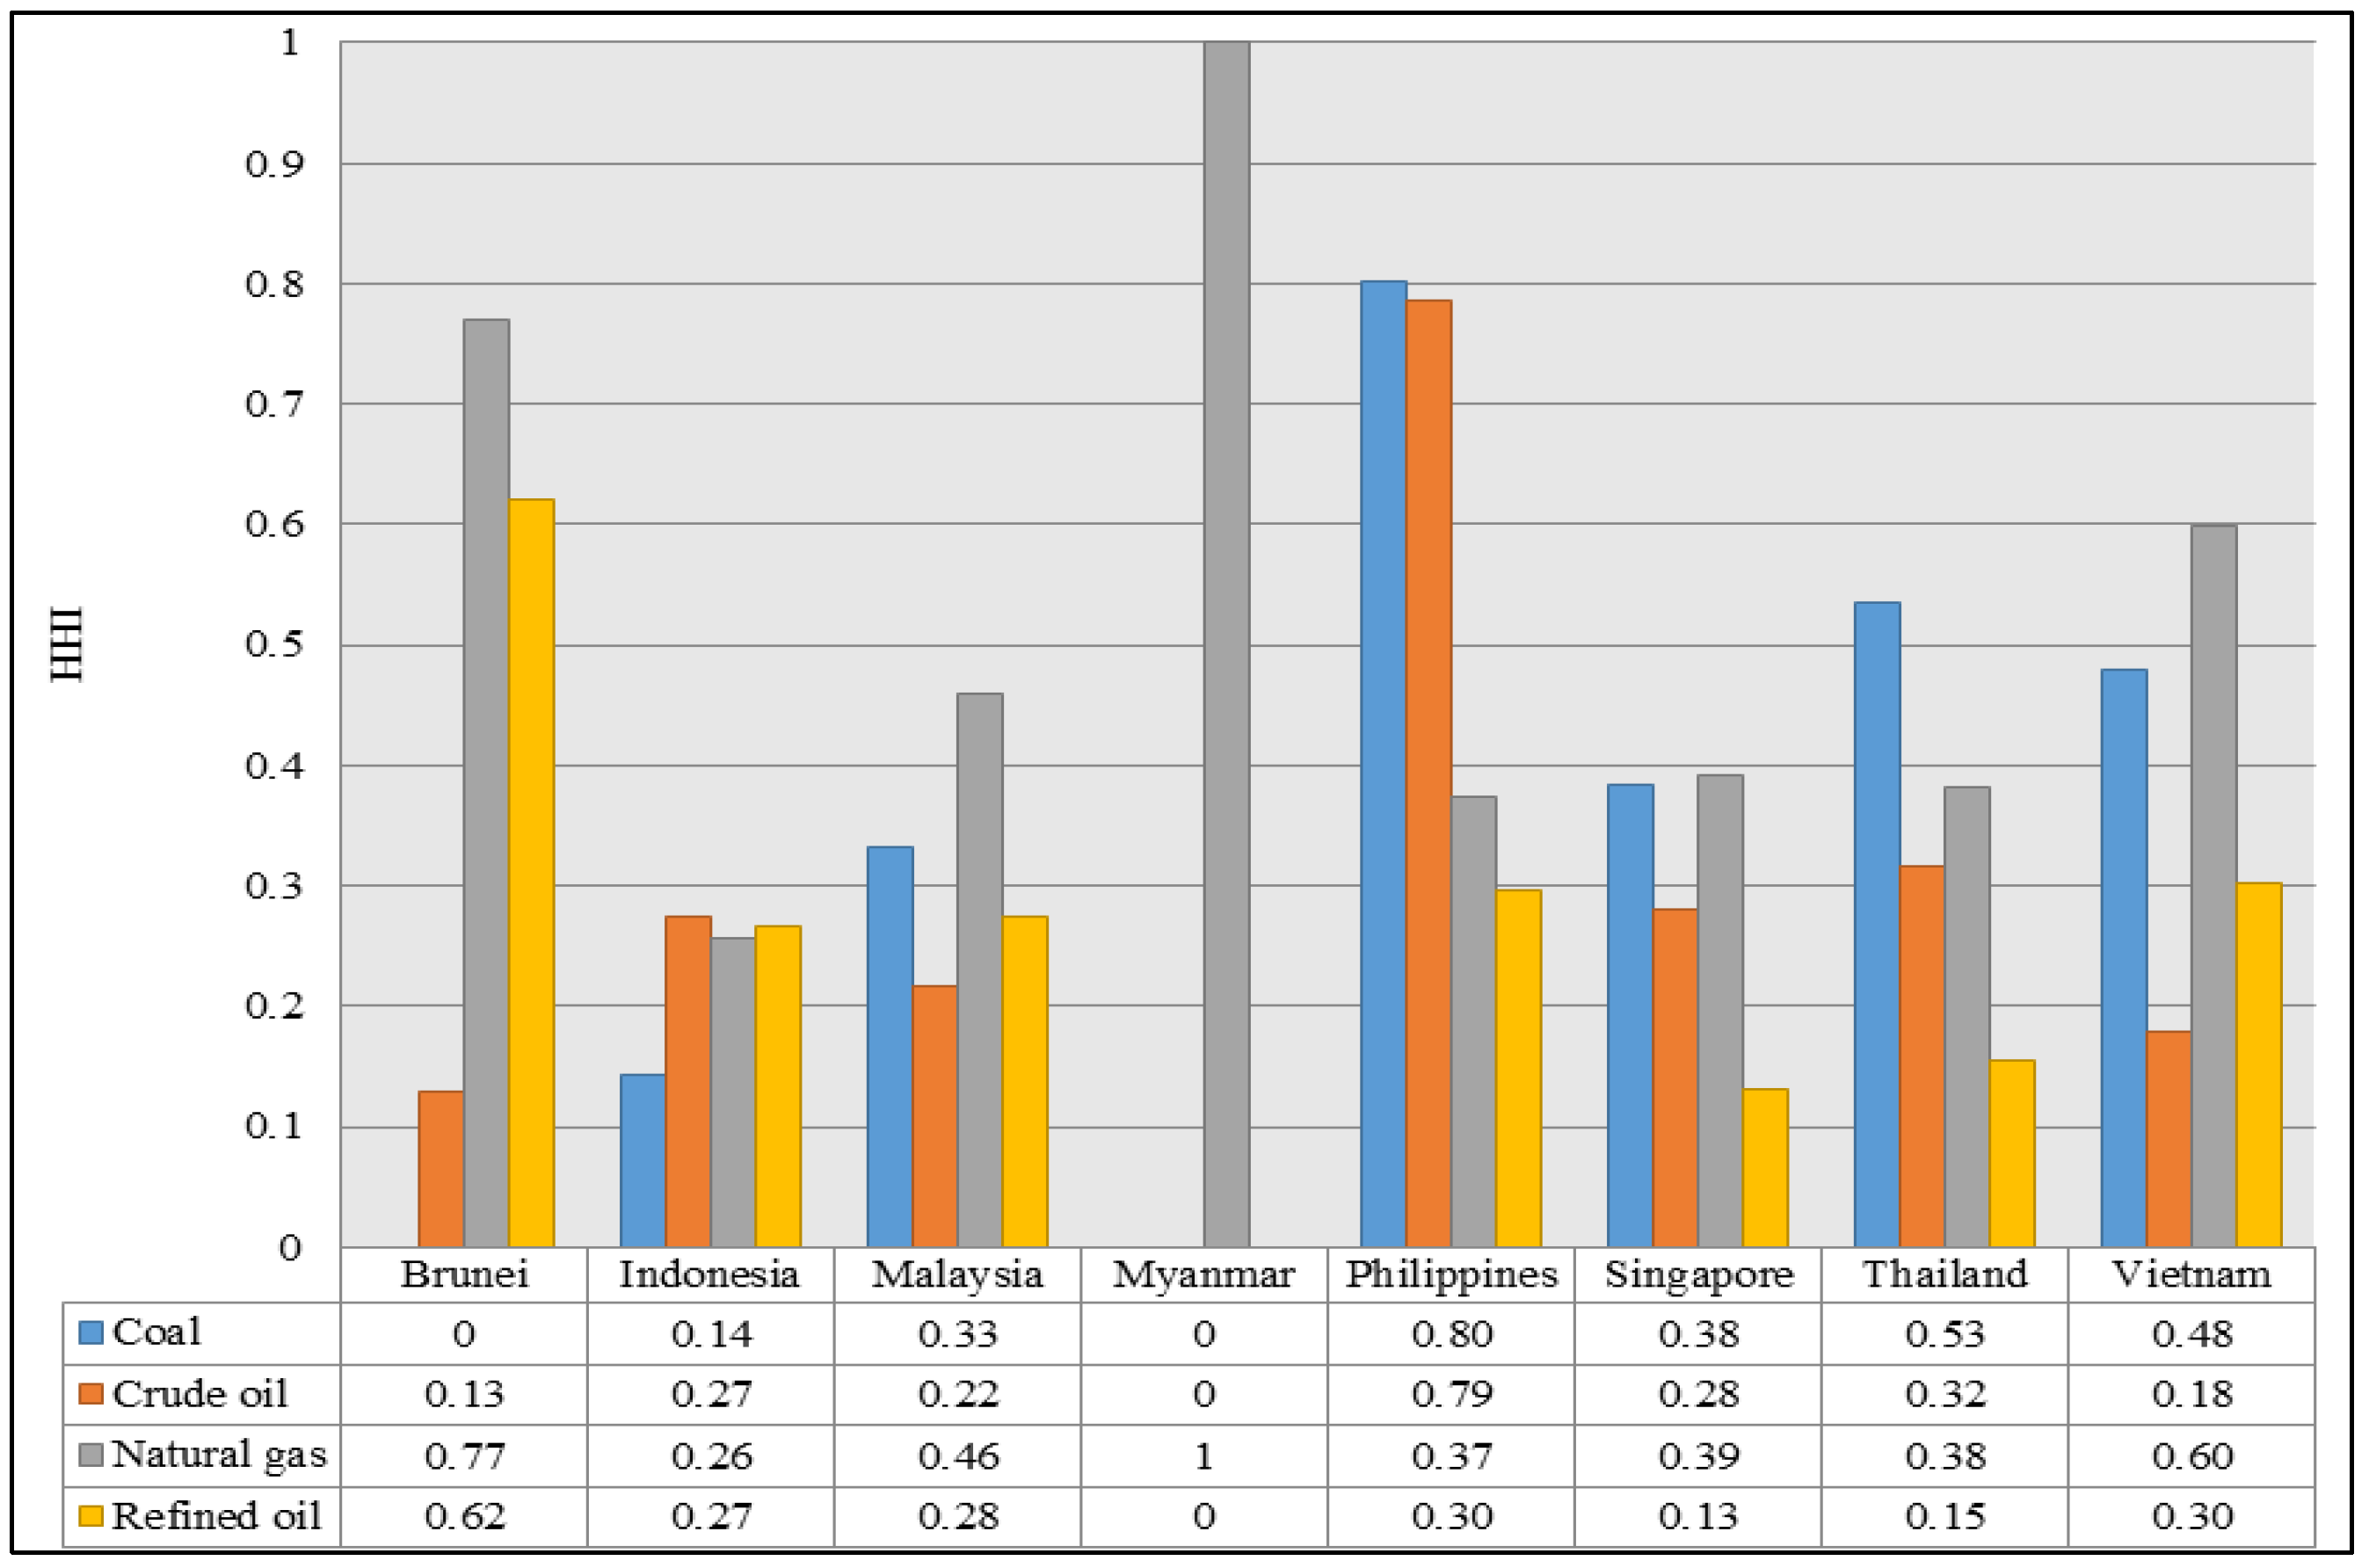
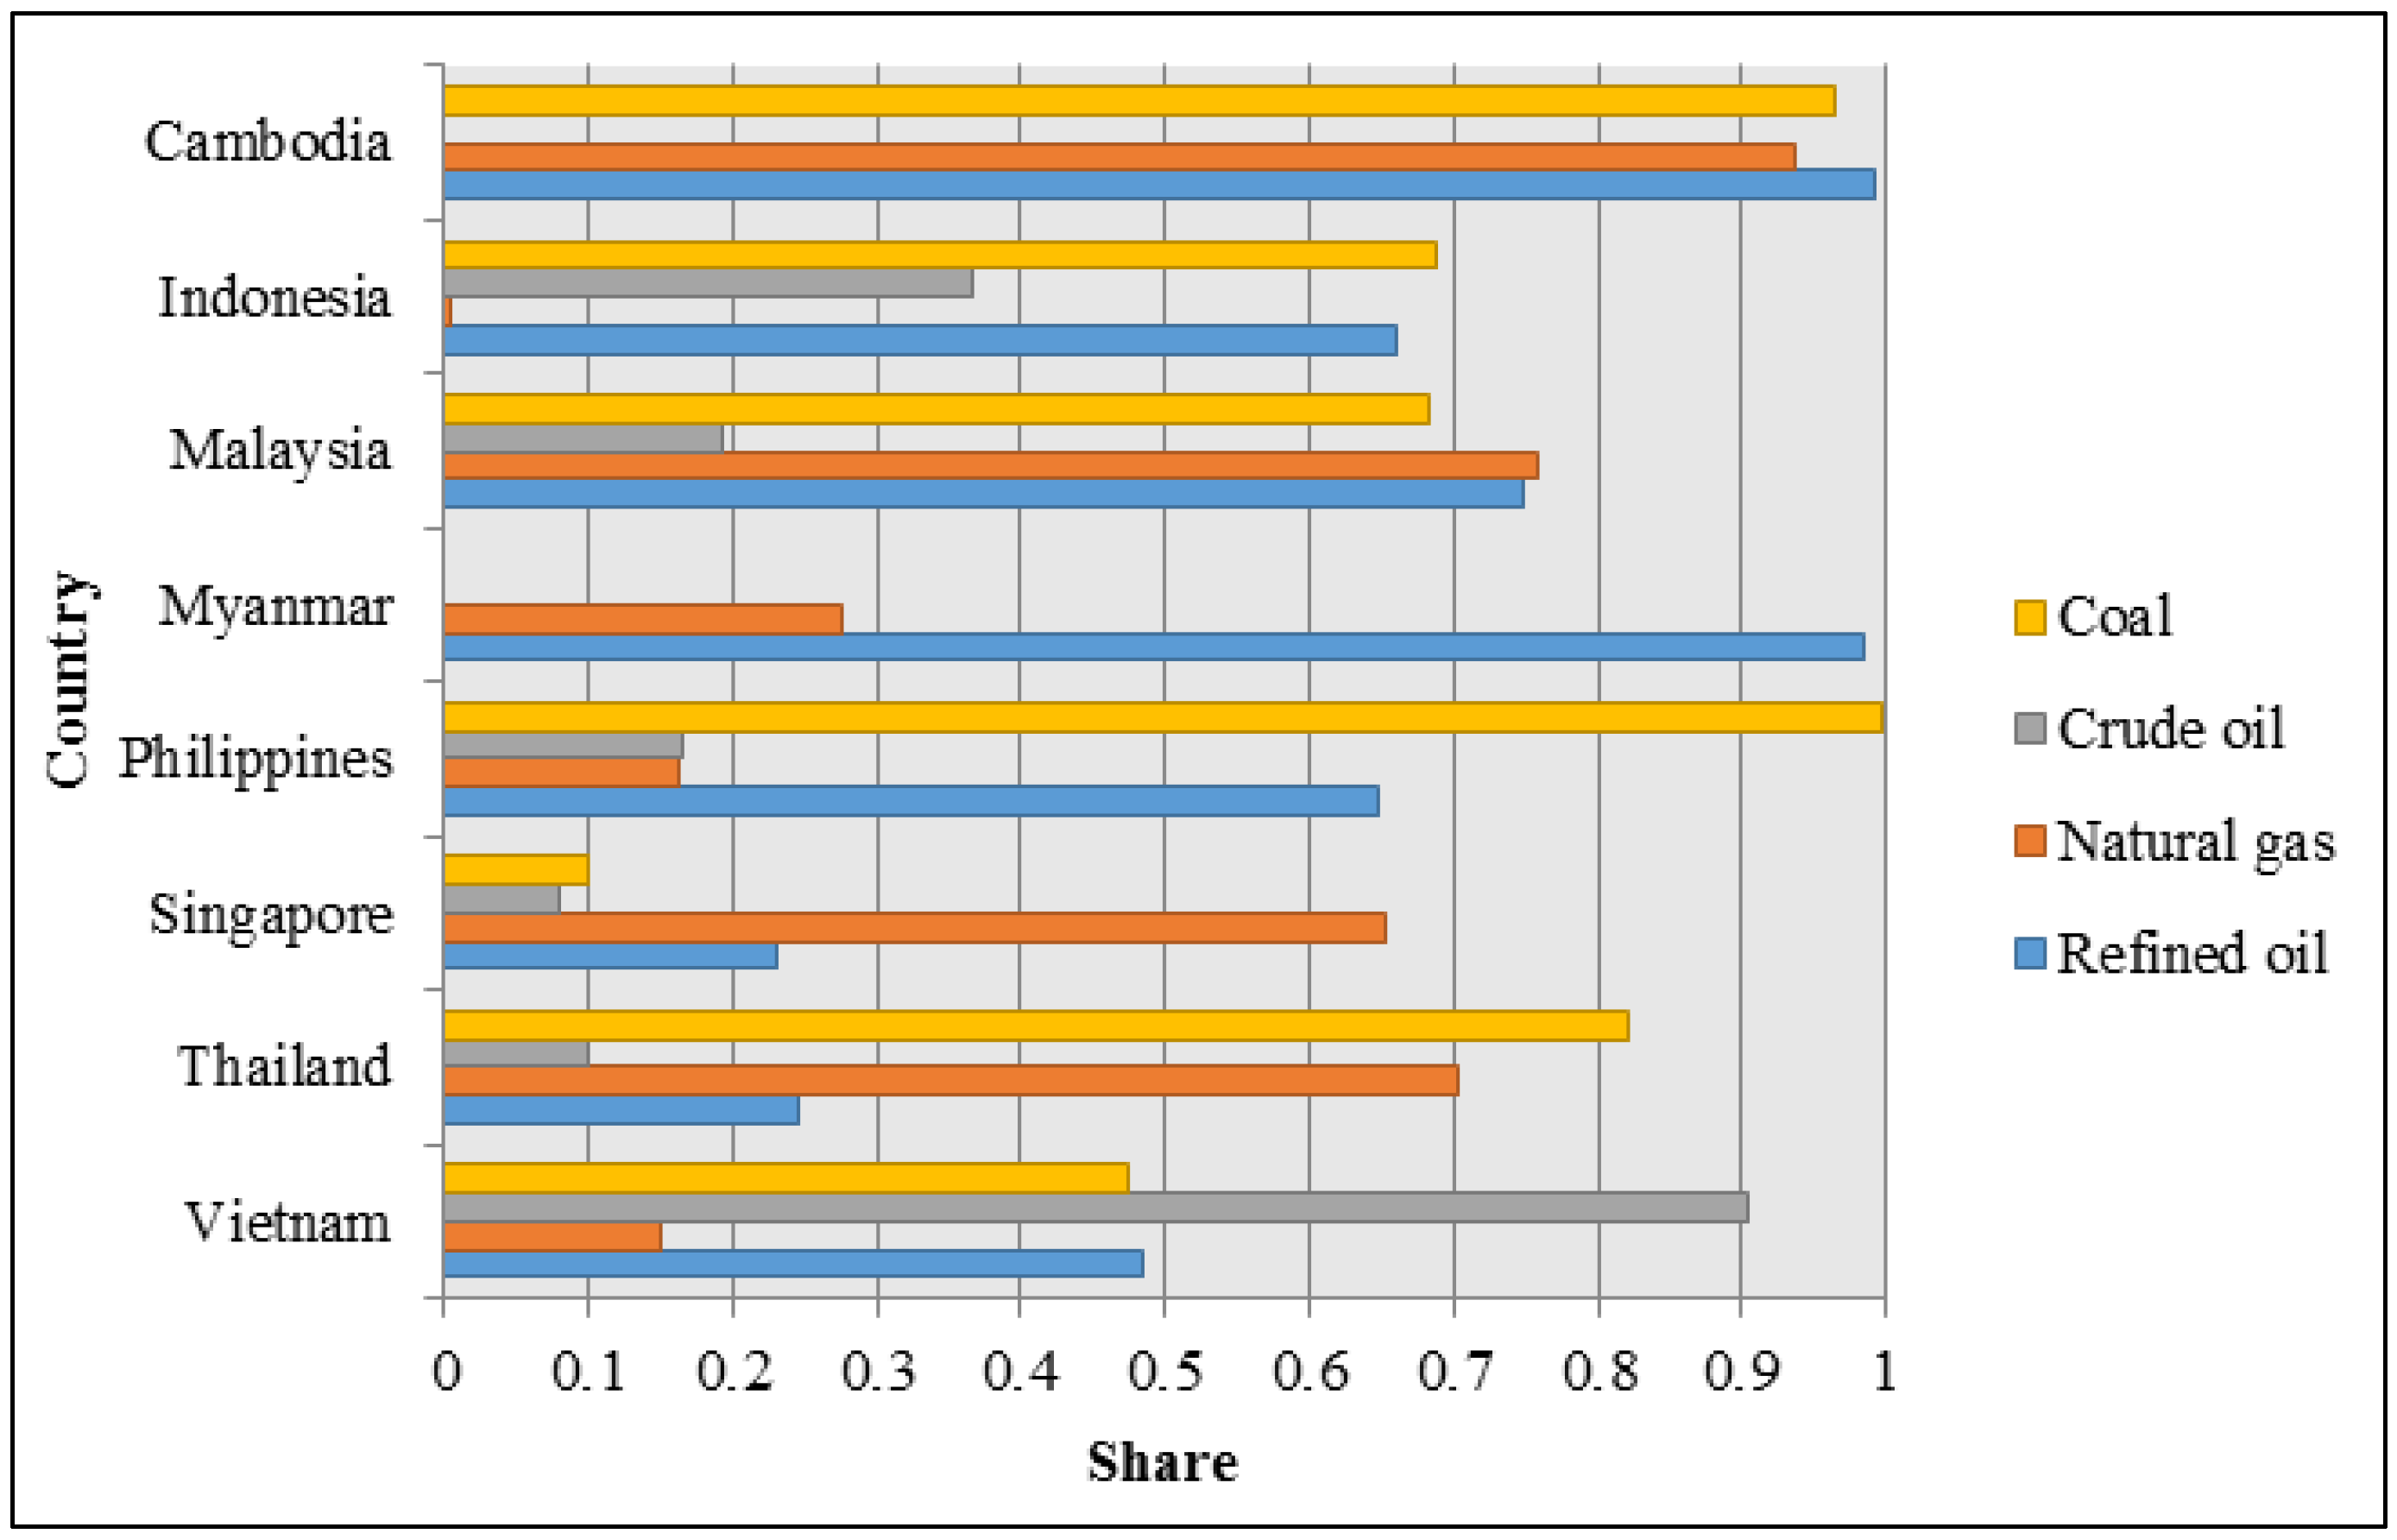
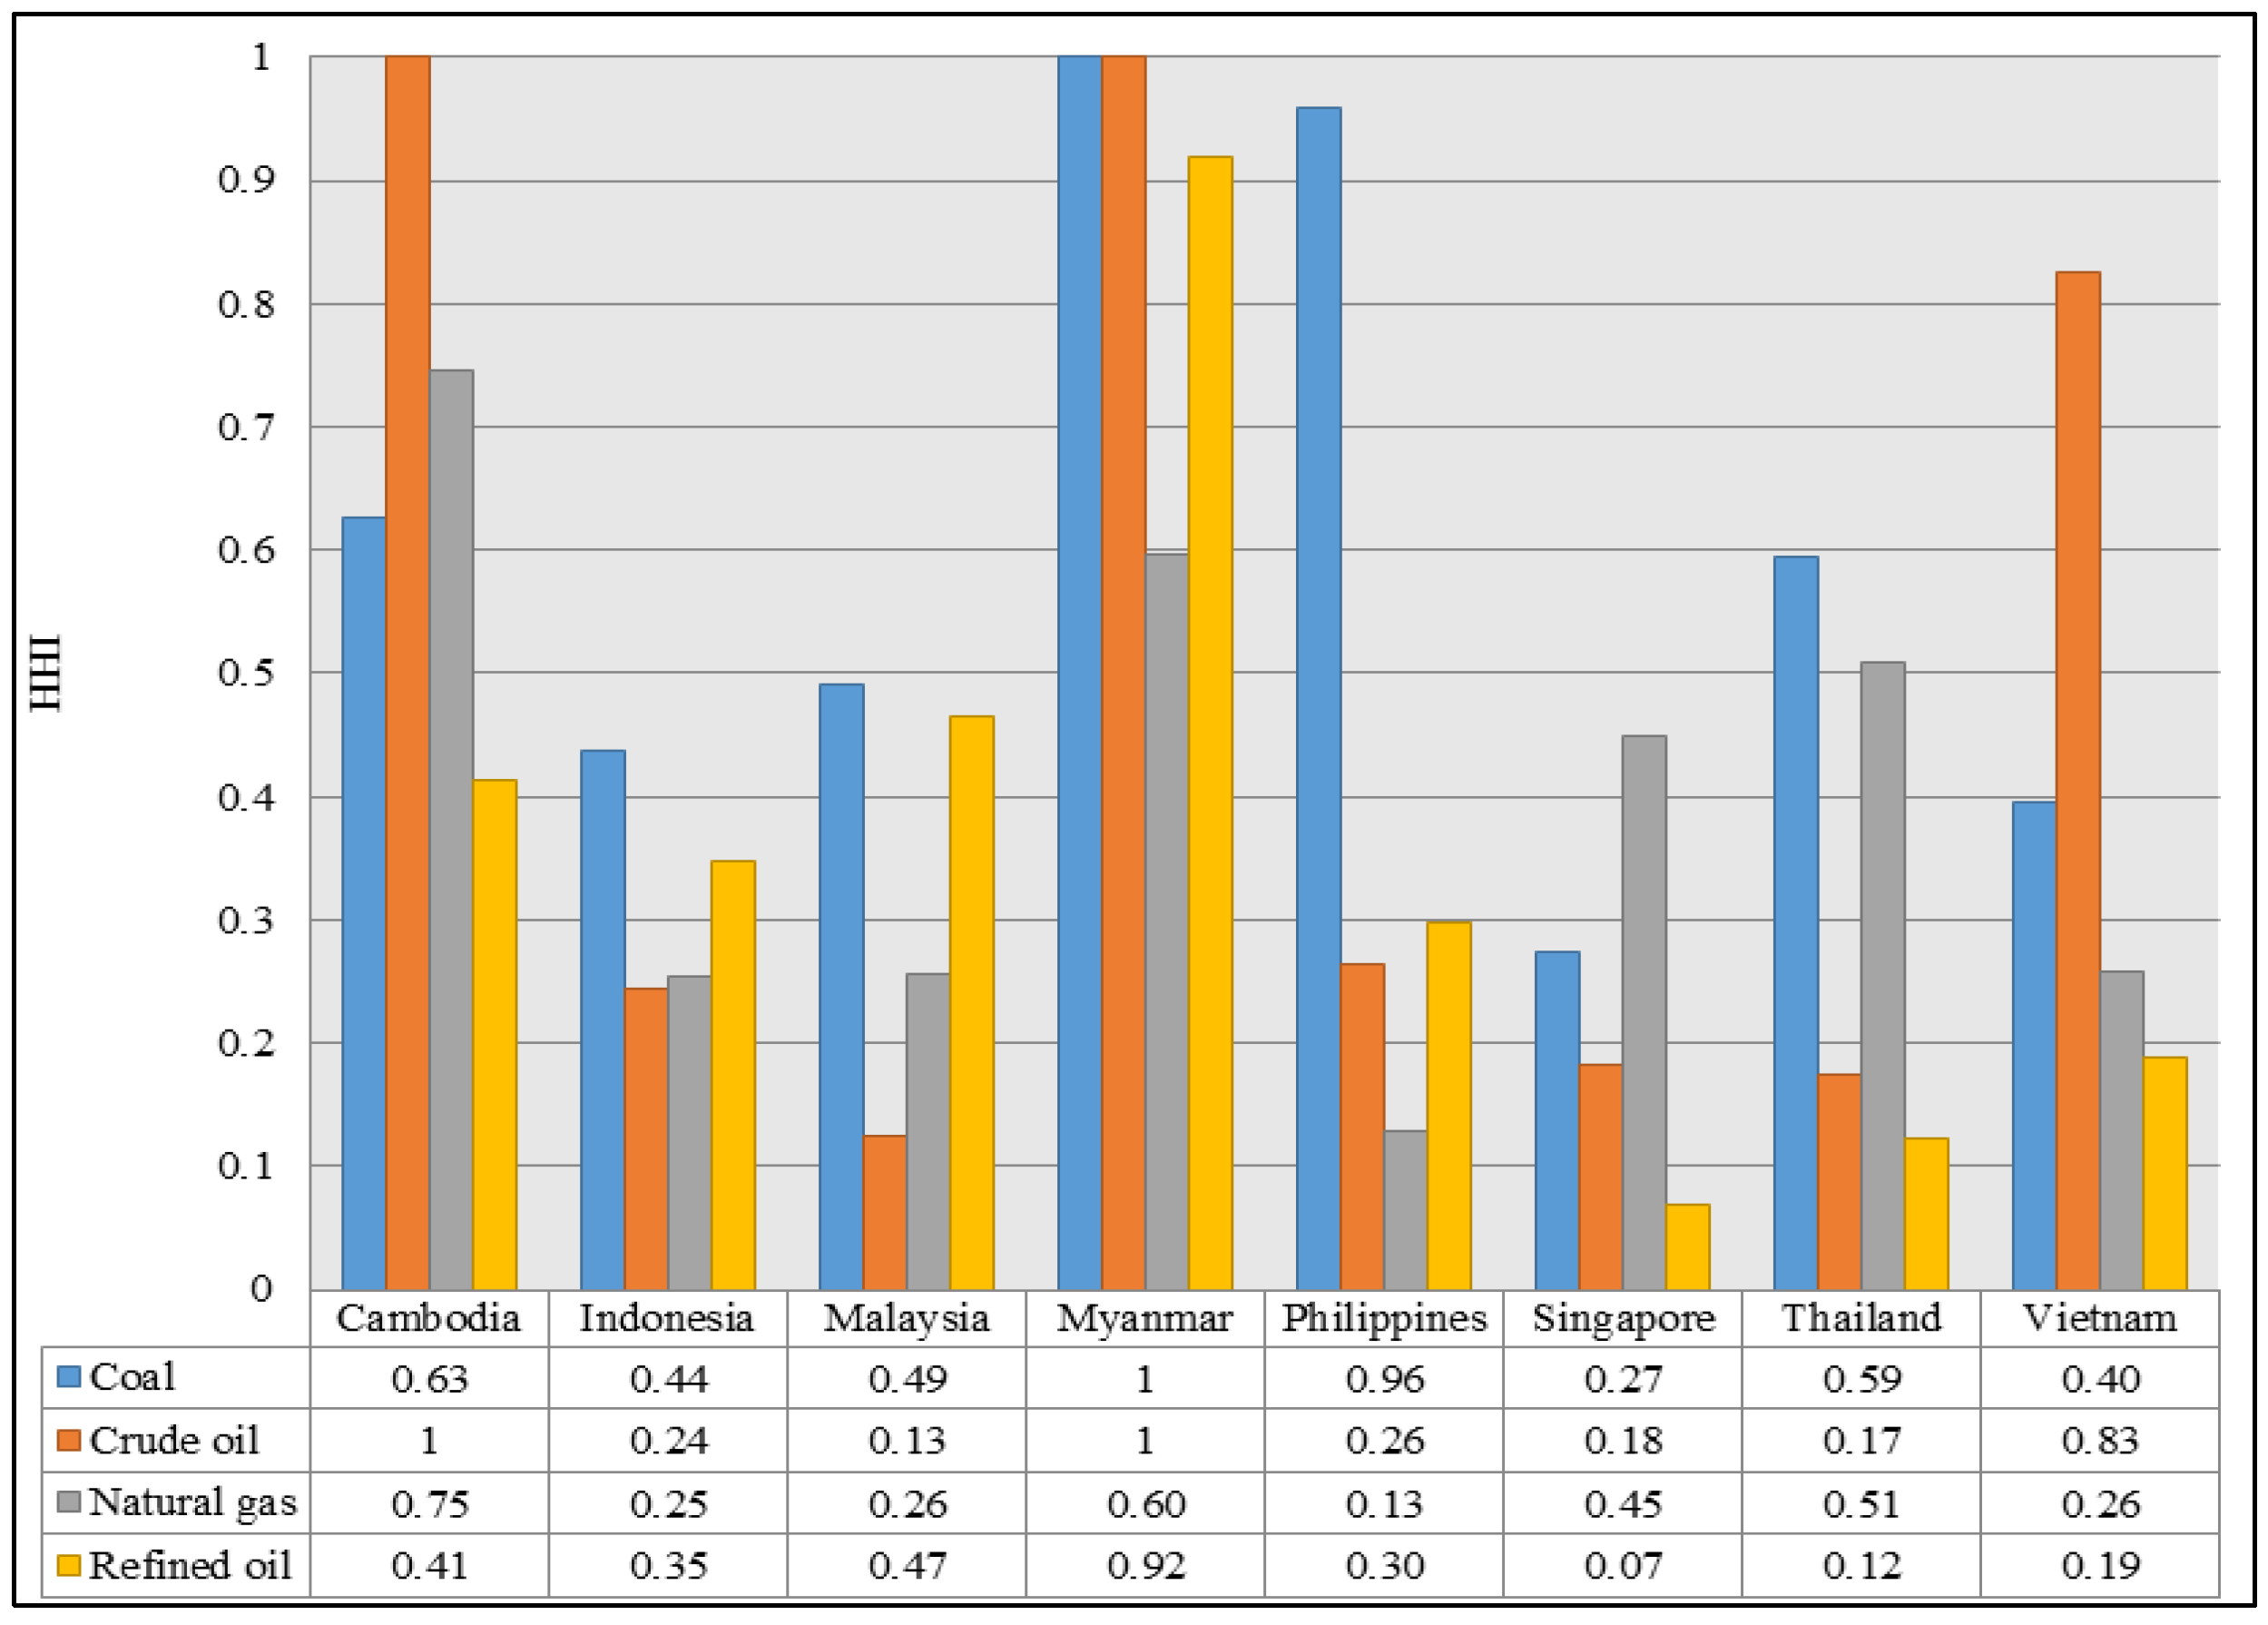
Another diversity indicator selected to analyze market concentration was the Herfindahl-Hirschman index (HHI). On the one hand, the method was also used to measure the degree of concentration of the specific export destination. In this aspect, energy products in the HHI diversity assessment include coal, crude oil, natural gas, and oil products. On the other hand, the indicator reflects the degree of concentration of import sources (partner country) in relation to total imports of an energy product. The inclusion of the assessment on energy-exporting countries is not commonly found in existing studies on energy security assessment, since most of them primarily focused on importing countries [
16,
33,
36,
37,
38,
39]. Energy interdependence implies mutual costs to both importer and exporter. If the market for energy exports is too concentrated, this may induce economic dependence of the energy exporter on a particular trade partner.
The formula is where p refers to the import or export share per energy source, i is the source country or export destination, j equals the energy product, and N is the total number of source countries or export destinations. HHI value ranges from 0 to 1. In contrast to the SWI, an HHI below 0.15 reflects an unconcentrated market condition while a value over 0.25 indicates high market concentration. In particular cases, the value of 1 suggests the absolute market concentration where there is only one supplier contributing to the total imports or one export destination for all exports.
2.2. Data
The criteria for data acquisition include credibility, accessibility, transparency, and comparability. Furthermore, due to the difference in units of currency and measurement among the nine countries, data on monetary and energy statistics from reputed international organizations were preferred over national data.
Primary energy statistics were retrieved from the International Energy Agency [
40] while macroeconomic statistics were collected from the World Bank [
41] and the International Monetary Fund [
42]. Some of the crude oil and oil-related statistics were gathered from the Organization of the Petroleum Exporting Countries (OPEC) annual statistical bulletin [
43] and the British Petroleum (BP) statistical review of world energy [
44]. Commodity trade statistics were collected from the statistical database of the United Nations Commodity Trade Statistics Database (UN Comtrade) [
45]. Other statistics were obtained from ministry of energy.
The analysis was conducted based on the data for the years 2001 to 2012 except in the assessment regarding the energy commodity trade, import source, and export destination because of the lack of accessible data, which was based on the latest data available (2012) and 2010 for Myanmar statistics. For GDP statistics, the data were in constant 2005 U.S. dollar (USD), in which the GDP was converted from domestic currencies to USD using the 2005 official exchange rates [
41].
The results for certain indicators were presented using a two-digit country code [
46]: Brunei (BN), Cambodia (KH), Indonesia (ID), Malaysia (MY), Myanmar (MM), the Philippines (PH), Thailand (TH), Singapore (SG), and Vietnam (VN).
4. Energy Security Contexts of ASEAN Member Countries
This part summarizes major findings from the previous section, identifies primary energy security issues of concern for each country as reflected through the assessment, and discusses relevant policy implications. According to considerable differences in individual performances among the nine ASEAN countries and their diverse energy contexts, these affect how the findings in certain indicators should be interpreted. Once the issues are identified, we discuss what the policy implications are and how policy-makers can address the problems.
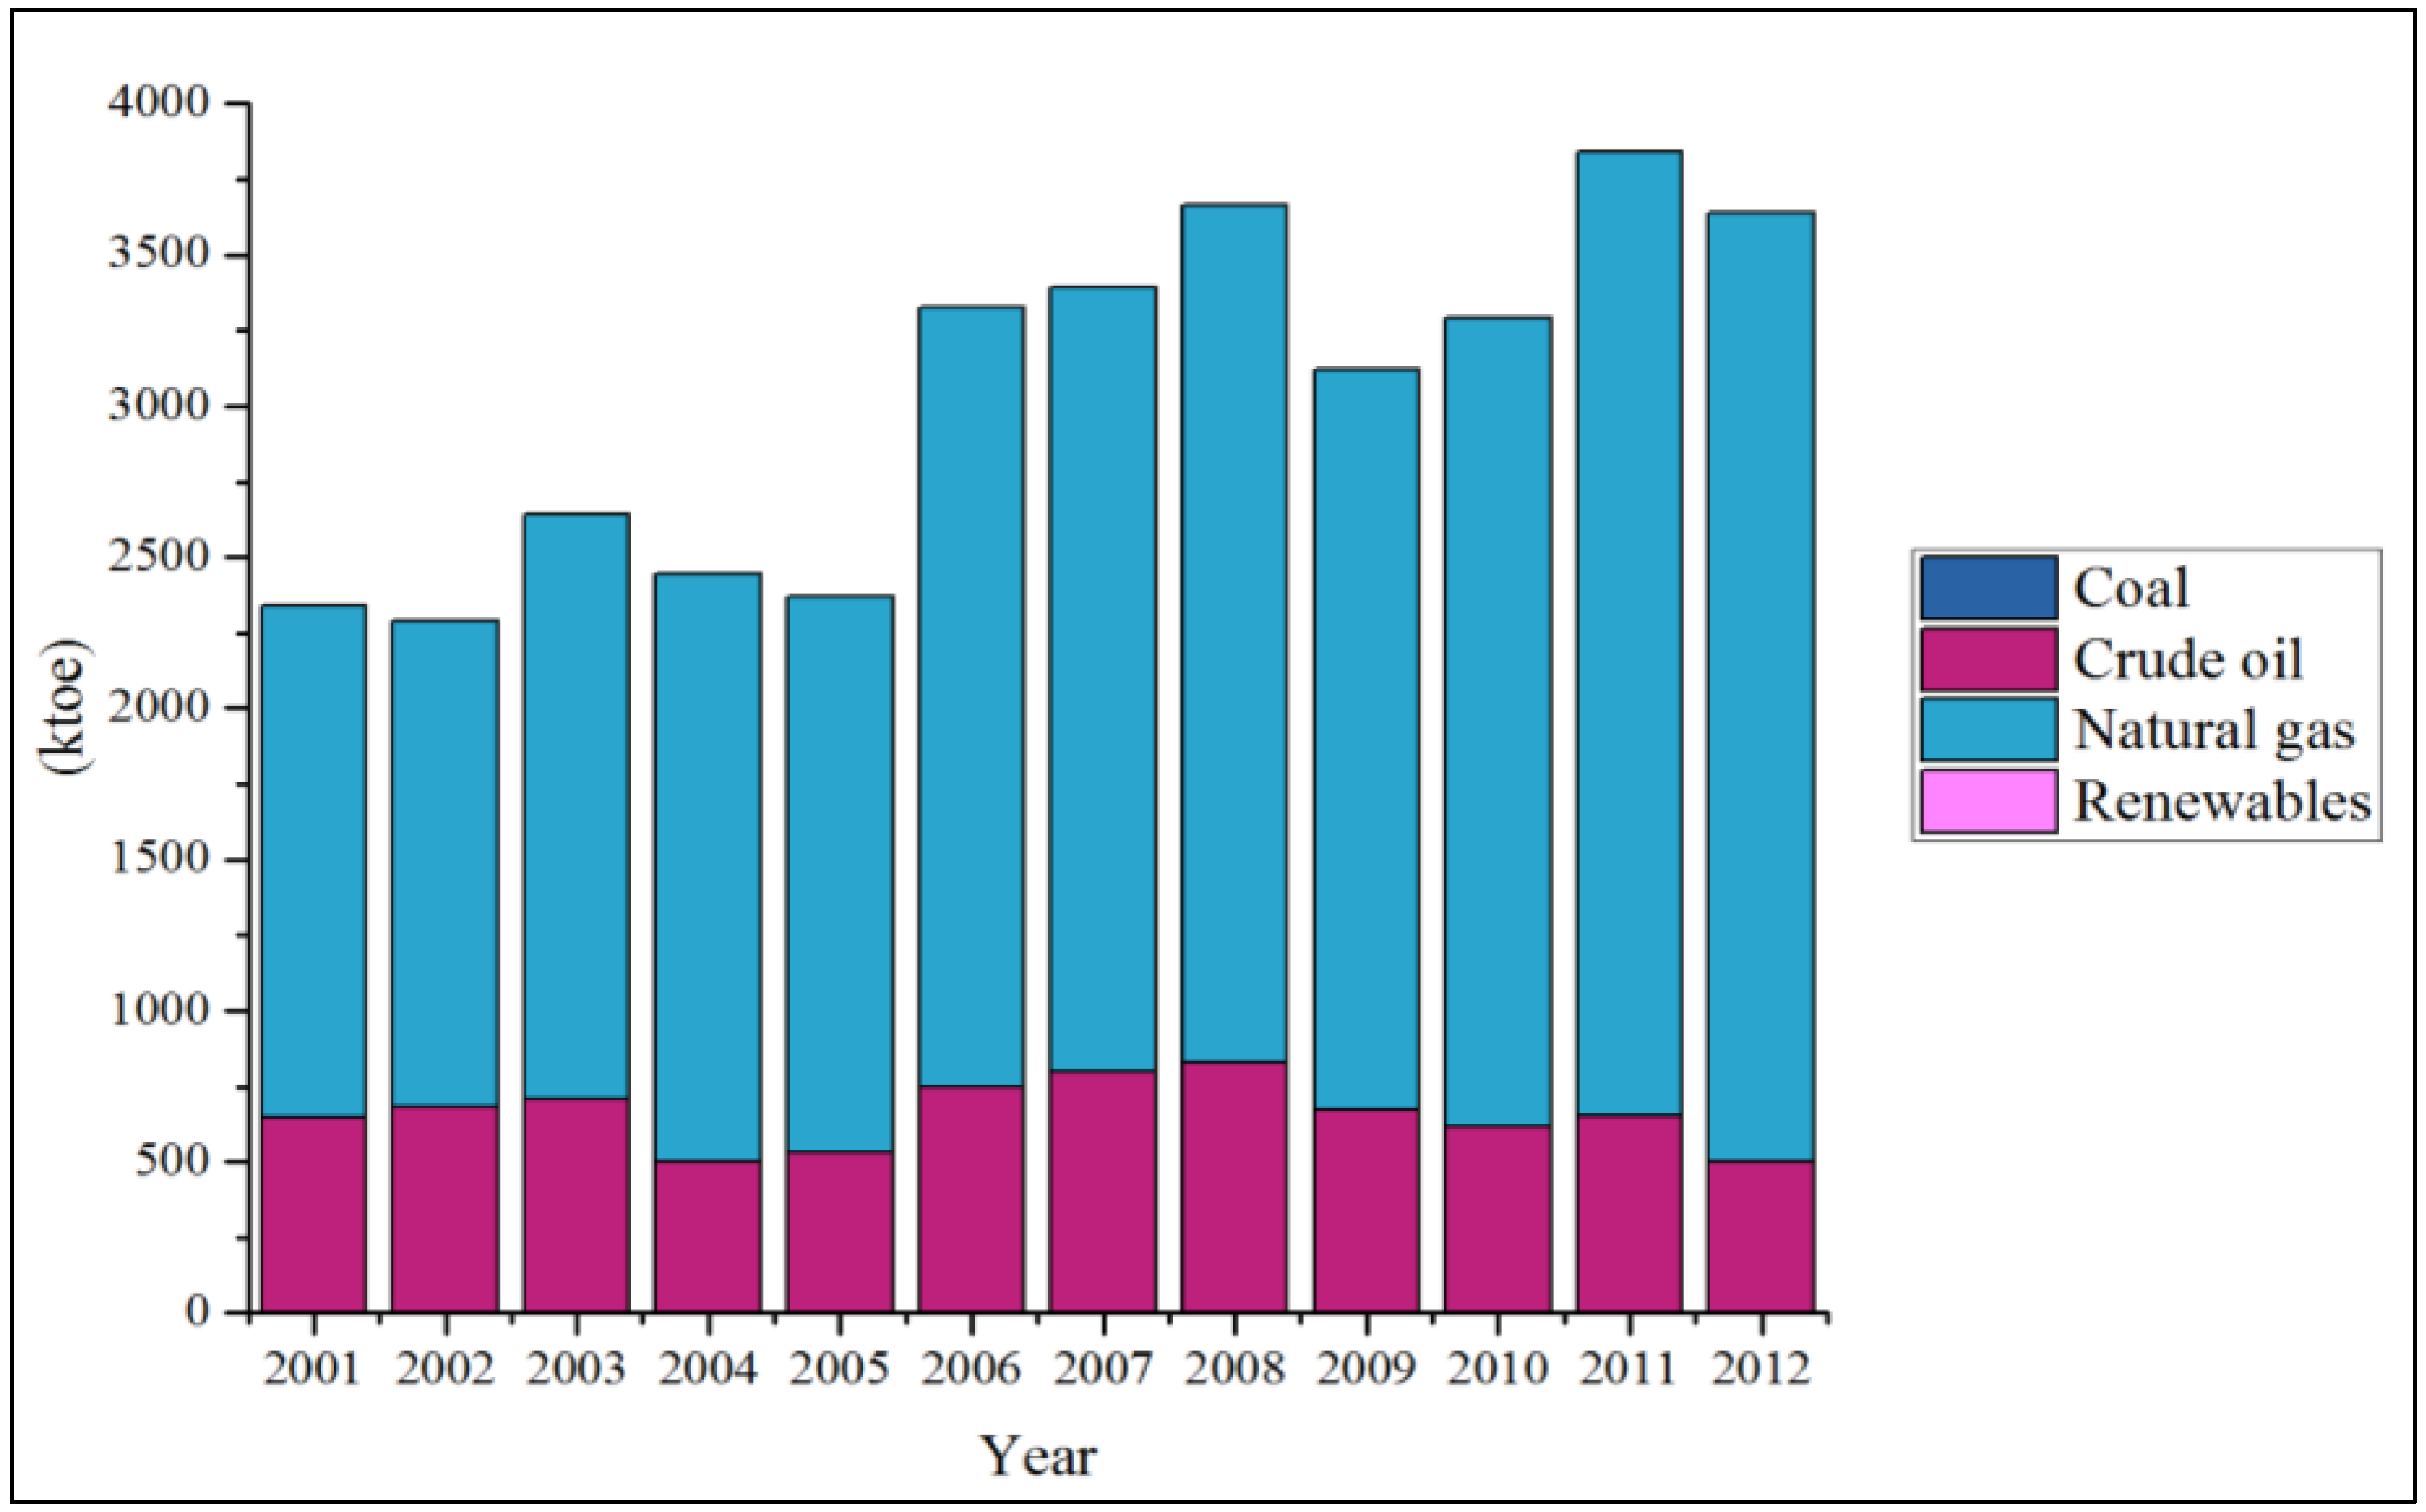
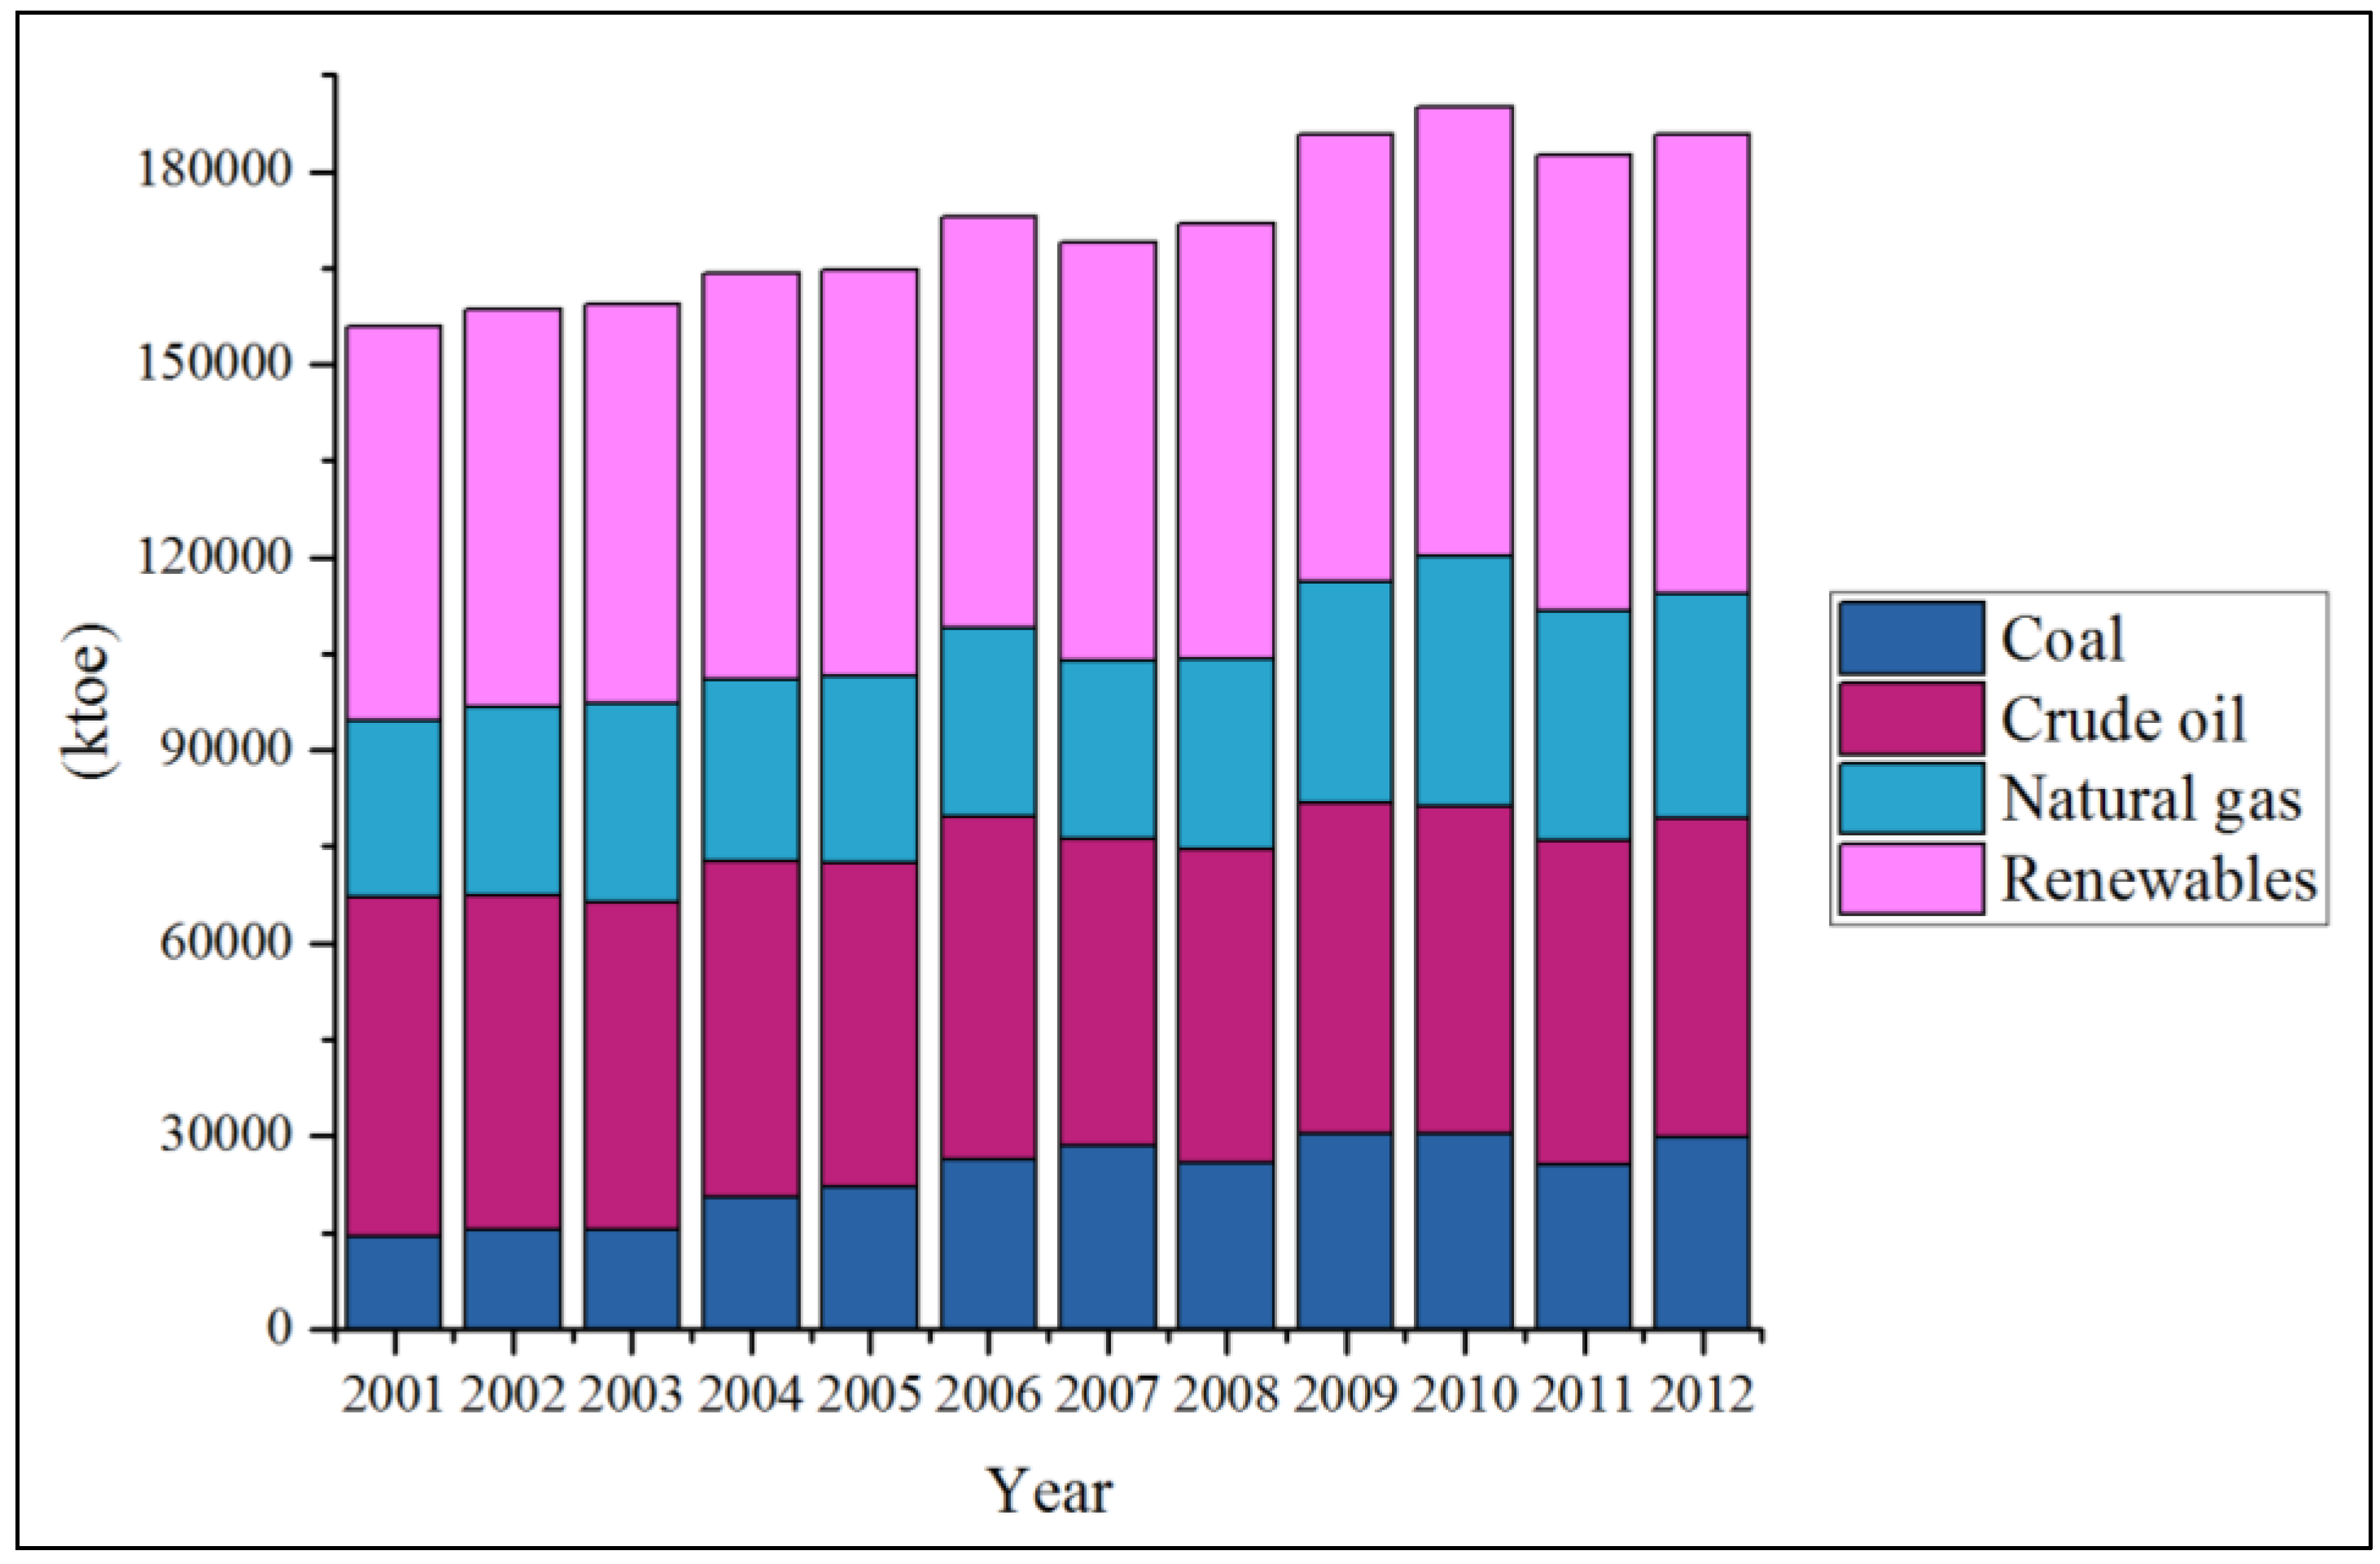
In the first component, overall energy balance presents the mixes of primary energy supply, electricity generation, and sectoral final energy consumption. The findings reflect not only country-specific contexts regarding energy resources and demands, but also the gap of economic development between developing and developed countries in terms of energy infrastructure development. In fact, the nine countries are divided into countries that are heavily dominated by fossil fuels (Brunei and Singapore), countries suffering from energy poverty that are heavily dominated by traditional biomass utilization (Cambodia and Myanmar), and countries with moderate energy resources that have rather diversified mixes (Indonesia, Malaysia, the Philippines, Thailand, and Vietnam). Final energy consumption by sector also differs among the countries. However, due to the excessive share of residential energy consumption in the least developed countries, the sectors that consume the most energy of ASEAN include the residential, industry, and transport sectors. The non-energy sector, however, takes up the most energy consumption in the cases of Brunei, Singapore, Thailand, and Malaysia. The difference in sectoral energy consumption reflects the difference in the country-specific energy security context. For instance, the energy insecurity of Cambodia would mainly impact its residential sector while the energy insecurity of Vietnam would mostly affect the industry sector.
The utilization of fossil fuels and traditional biomass is another primary issue of concern for ASEAN countries regarding the primary energy supply. Hydrocarbon-based energy mixes of ASEAN countries have led to controversy over the development dilemma and the inevitable link between energy and the environment [
61]. To reiterate, the development of energy infrastructure based on fossil fuels as a primary energy source is far more economically practical and accessible than advanced energy technology that is costly and requires technological readiness. Each country has to ponder which should be a priority: cheaper fossil fuels that could be harmful to the environment; conventional renewable energy utilization that does not emit carbon dioxide, but requires large land areas; more expensive and challenging advanced energy technology (e.g., fourth-generation nuclear power plant, cutting-edge modern renewables, or hydrogen and fuel cells) that is environmentally friendly; or a hybrid energy system that is the combination of multiple choices. Nevertheless, focusing on energy security, each country requires specific policy measures that correspond to its energy context and sensitivity. These overall indicators alone are not sufficient.
Development gaps and different energy contexts among ASEAN countries are further emphasized in the second component, the socio-economic aspect. While Myanmar, Cambodia, the Philippines, and Indonesia have been struggling to provide modern energy services nationwide, the electrification rate among the rest of the ASEAN countries is almost 100%. For per capita indicators, Brunei and Singapore have the highest and most distinct primary energy supply per capita and final energy consumption per capita, whereas Cambodia, Myanmar, and the Philippines have significantly low energy supply and consumption per capita. The rest of the ASEAN countries are concentrated somewhere in the middle. However, based on primary energy intensity and the intensity of final energy consumption, Singapore is the only country with remarkably decreasing values, which implies successful energy policy measures to improve energy efficiency [
56]. In addition, by comparison, even though Cambodia, Myanmar, Indonesia, and the Philippines all have low electricity use per capita, the different energy development status (as shown through the nationwide electrification rate) has left the question of why the Philippines’ electrification rate and per capita indicator are rather low—whether it is because of the successful energy efficiency measures like in Singapore or it is because the Philippines is comprised of numerous distributed smaller islands that make a challenge for grid development like in Indonesia.
Different from the per GDP indicator, which reflects the use of a certain amount of energy/electricity to produce GDP, the per capita indicator shows domestic consumption. Due to the differences in country-specific energy contexts, the indicators can be interpreted differently. For countries with more mature energy development, a decrease in per capita and intensity indicators could be interpreted as positive change with improved efficiency [
62]. On the other hand, for countries that have not yet reached countrywide energy accessibility, a decrease in those indicators could be interpreted as negative change where energy accessibility could not keep up with the increasing population (per capita indicator) or the country had to use more units of GDP to produce energy (intensity indicator). Since the concerns are different, the interpretation of these indicators must consider relevant country-specific contexts.
Thus, in the long run, countries that hit a plateau in providing the citizens’ access to modern energy services, which, in this study, include Brunei, Malaysia, Singapore, Thailand, and Vietnam, should aim to reduce energy demand and consumption per capita by improving the efficient use of energy and electricity (e.g., technological changes, conversion to more efficient power generation systems, mandatory regulations for energy-efficient industry and buildings, fuel-efficient vehicles, etc.). For countries that are still in pursuit of energy infrastructure development, such as Cambodia, Indonesia, Myanmar, and the Philippines, the goal is completely opposite to the previous group. Here, designed policy packages should prioritize adequate accessibility to energy services. In the short- to medium-term, policy measures should aim to induce and encourage behavioral changes towards energy and electricity conservation (e.g., a program to raise public awareness towards the significance of energy efficiency, a program to provide incentives for energy conservation, etc.). However, policy-makers should refer to sectoral energy indicators to narrow down which sector they should emphasize.
The third part analyzes domestic energy resources measured by indicators on energy self-sufficiency, the reserves-to-production ratio, and refining capacity. ASEAN countries are clearly divided into energy resource-rich and resource-poor countries. The physical availability of energy resources and reserves is not only more than adequate to meet domestic demands, but enough to also cover external demands (for exports). For instance, Indonesian coal self-sufficiency is quintuple to domestic consumption, while Brunei’s crude oil production is more than 15 times greater than what the country consumes. Similarly, Myanmar’s natural gas self-sufficiency is extensive. However, countries with lesser resource prosperity, which include Cambodia, the Philippines, Thailand, and Singapore, are more exposed to supply disruptions from both domestic inadequacy and interruption of the imports. As a result, to provide an adequate and stable amount of energy supply to match the demand is the primary energy security issue for these countries.
Considering the security of the energy supply, there is no doubt that domestic resource availability plays an important part in enhancing the energy security situation of a country. Still, as seen from diverse energy contexts, the daunting question that follows is, by comparison, whether the energy security of countries with energy resources is better (or more secured) than those without. However, in terms of policy implications, countries with abundant energy resources should be aware of the possible clash between domestic and external energy demands. On one hand, exporting countries should not exploit fruitful resources and over-export. On the other hand, efficient domestic energy use should be taken into account. Sustainable consumption and the acquisition of energy resources are key policies. On contrary, for countries with limited amounts of resource availability, one possible option is to seek domestic energy production potentials, e.g., energy conversion from municipal wastes, nuclear power generation, or alternative and renewable energy (solar PV, wind power, tidal power, geothermal power, hydroelectricity, piezo electricity, energy crop plantations and biofuels,
etc.). However, it should be noted that, in most cases, renewable energy is not entirely indigenous; system parts and devices still need to be imported. The issue of rare earth elements should also be considered [
63].
The fourth part measures the extent to which each country is vulnerable to overseas resources and external demands. The assessment first focuses on the openness to international energy trade, which is separated into two standpoints: exporting countries and importing countries. While the energy trade per GDP of Brunei, Indonesia, Malaysia, Myanmar, and Vietnam shows how much the energy sector contributes to their economic growths, the results from the same indicator indicate how much the economies of Cambodia, the Philippines, Singapore, and Thailand are monetarily inclined due to energy imports. Indicators on energy trade also reveal the mixture of energy producers and exporters, e.g., Brunei Darussalam (crude oil and natural gas), Indonesia (coal, crude oil, natural gas, and refined oil), Malaysia (crude oil and natural gas), Myanmar (natural gas), Singapore (refined oil), and Vietnam (coal and crude oil), and energy importers, e.g., Cambodia (coal, oil products, and electricity), the Philippines (coal, crude oil, and refined oil), Singapore (coal, crude oil, natural gas, oil products, and natural gas), and Thailand (coal, crude oil, natural gas, oil products, and electricity), of ASEAN.
The assessment on the reliance over external demands and foreign resources is highly context-dependent and differs from country to country. For example, Singapore is a net importer of coal, crude oil, and natural gas, whereas more than one-third of the Brunei economy is based on the international energy trade. The implication of the assessment infers that, while Singapore is considered vulnerable to the disruption of energy supply, Brunei’s vulnerability is on the country’s income. The comparison of the assessment results within the region should embrace this difference in contexts as well.
Starting with importing countries, although the idea of being completely energy-independent is merely a myth [
64,
65,
66], particularly when domestic energy resources are an issue, designed policies, for medium- to long-term goals, should aim to reduce import reliance by improving energy efficiency and controlling demand. Energy reform to terminate fossil fuel and electricity subsidies (especially those that need to be imported) is highly recommended. Among ASEAN countries, Singapore and the Philippines are the only two countries that do not subsidize energy prices. Energy and fuel subsidization could hinder the efficient and sustainable use of energy, although it increases investments in exploration and production. In addition to demand control, energy-importing countries should adopt policies to reduce supply risks. For short- to medium-term goals, the establishment of emergency stockpiling and fuel buffer stock is one of the most effective ways to reduce the impacts of supply disruptions. For the longer run, the diversification of the energy supply by increasing alternative and renewable energy that is domestically produced is another way to reduce reliance.
For energy producers and exporters, the best policy measure for resource sustainability is to improve energy efficiency. One policy option is to trigger more investments in exploration and production activities that maximize advanced and enhanced recovery techniques. Apart from upstream activities, downstream energy production should also be considered to replace unnecessary fuel imports. Using information and technology, energy-producing countries should invest in overseas energy production through joint investments in countries that have energy resources but lack the investment and technology to acquire those resources. Nevertheless, the encouragement of efficient energy use is highly recommended. Balancing between the domestic and external energy demand is significant. Similar to energy-importing countries, the abolition of fuel subsidies is an effective way to manage domestic demand in long term. Energy producers may find more difficulties in implementing the measure since the people could be more comfortable with state-controlled low energy and fuel prices. As a result, public awareness of energy efficiency and the definite availability of energy resources is a priority. For external demand, policy-makers can control and manage it via production output. Still, the diversification of export industries could lessen possible impacts from overreliance on the exportation that leaves the country exposed to market risks.
The last component assesses two common practices to reduce vulnerability: the diversification of the energy supply and the geographical diversification of trade partners. Brunei and Singapore have the least diversity of primary energy, followed by Myanmar, Malaysia, the Philippines, Thailand, and Vietnam, whereas Indonesia has the highest PES diversity. Even though the diversification of the energy supply should get a priority in order to obtain a more balanced energy mix, it is not quite an option, particularly when domestic energy production is not available either due to depleting resources or cost-inefficiency. As a result, the diversification of energy import sources is a more practical alternative. Geographical diversification of export destinations may not appear to have such significant impacts towards the enhancement of energy security compared to importing countries, but it contributes to a more secure market engagement for energy producers and exporters.
While the diversification of the energy supply could minimize the impacts of disruption risks, the diversification of trade partners leverages market risks. Over-reliance on specific energy supplies and trade partners could lead to vulnerability from energy supply shocks caused by energy politics [
67]. The usual policy strategy is to choose trade partners with stable domestic political conditions and good export credits. This seemingly simple measure is, however, crucial in ensuring the security of the energy supply. From the findings, for example, one may question the comparative performance between a net-energy importer like Singapore, which relies on 100% of its energy imports, and Thailand, which has some domestic production and relies on one-third of its natural gas imports. Looking closer at trade partners, it is more likely that Singapore has a more secure importation of energy resources due to the portfolio of import source countries while Thailand imports from countries with higher political instability. The point is that, once the import is inevitable, policy-makers should seek to reduce market risks that would lead to supply interruption.
For energy producers and exporters, the diversification of the energy supply is quite different from the importing perspective. Having other countries reliant on our exports of energy supply could be considered a positive dependence, which means the exporting countries have some sort of superior power over the reliant countries. However, to a certain extent, the exporter also economically relies on the importers, although it should be noted that the significance of the reliance is relative to the size of the export to the country’s income. Thus, to ensure a stable and predictable flow of external demand, policy-makers should pay appropriate attention to the improvement of its export credits and portfolio. In the growing competitiveness of international energy markets, importers have a variety of trade partners to choose from. Having a reliable portfolio would attract new trade counterparts and ensure that current trade partners would not switch to other supplies. Apart from strengthening export credits, another measure is to join an investment with major multinational energy enterprises.


