
Awareness of Humanities, Arts and Social Science (HASS) Research Is Related to Patterns of Citizens’ Community and Cultural Engagement

Abstract
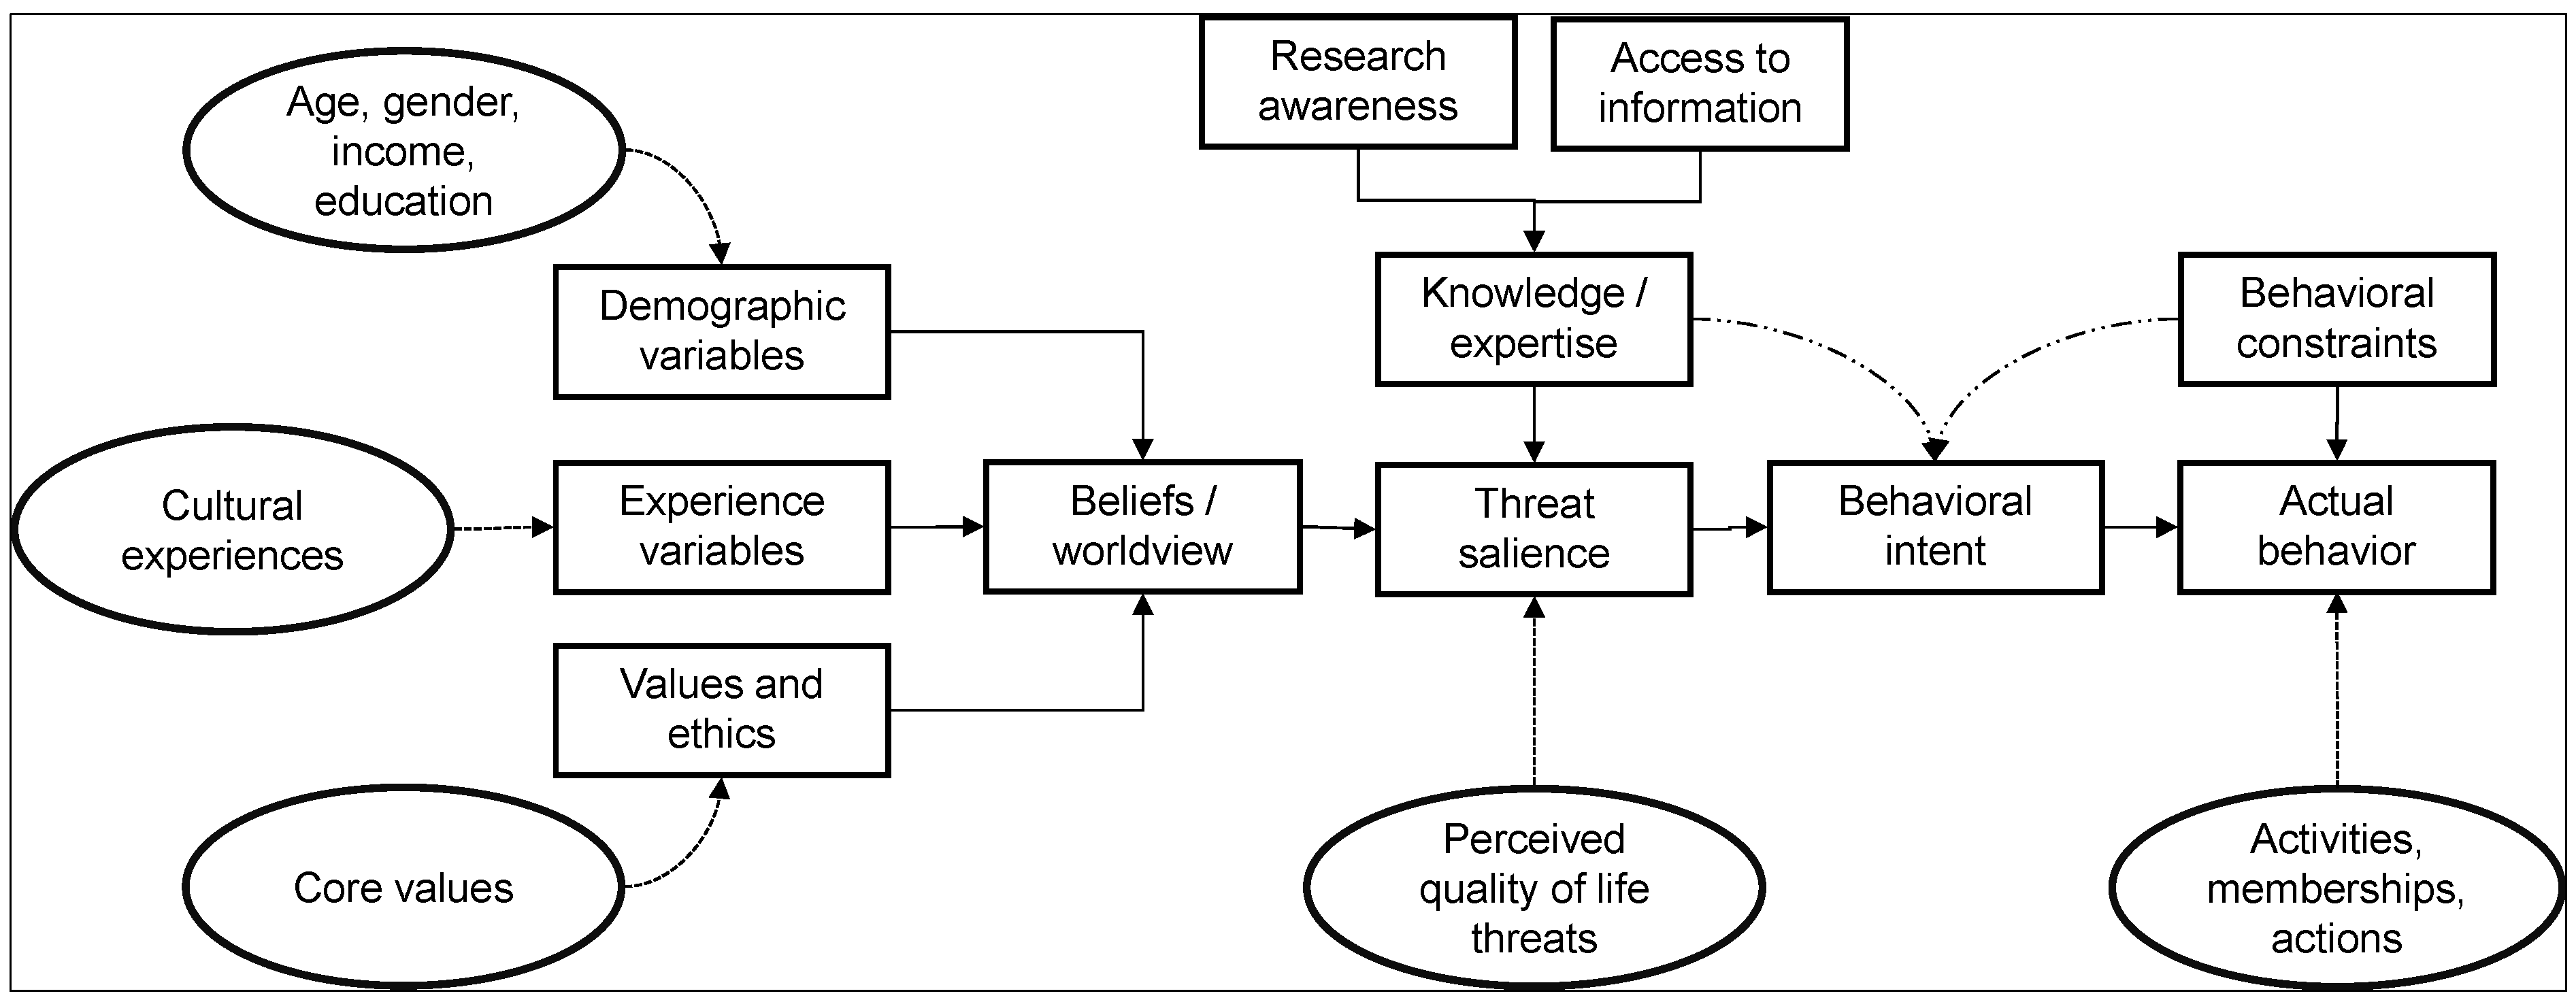
:1. Introduction
2. Data Generation and Analysis
2.1. Survey Design and Delivery

2.2. Data Analysis
3. Results and Discussion
3.1. Respondent Demographics
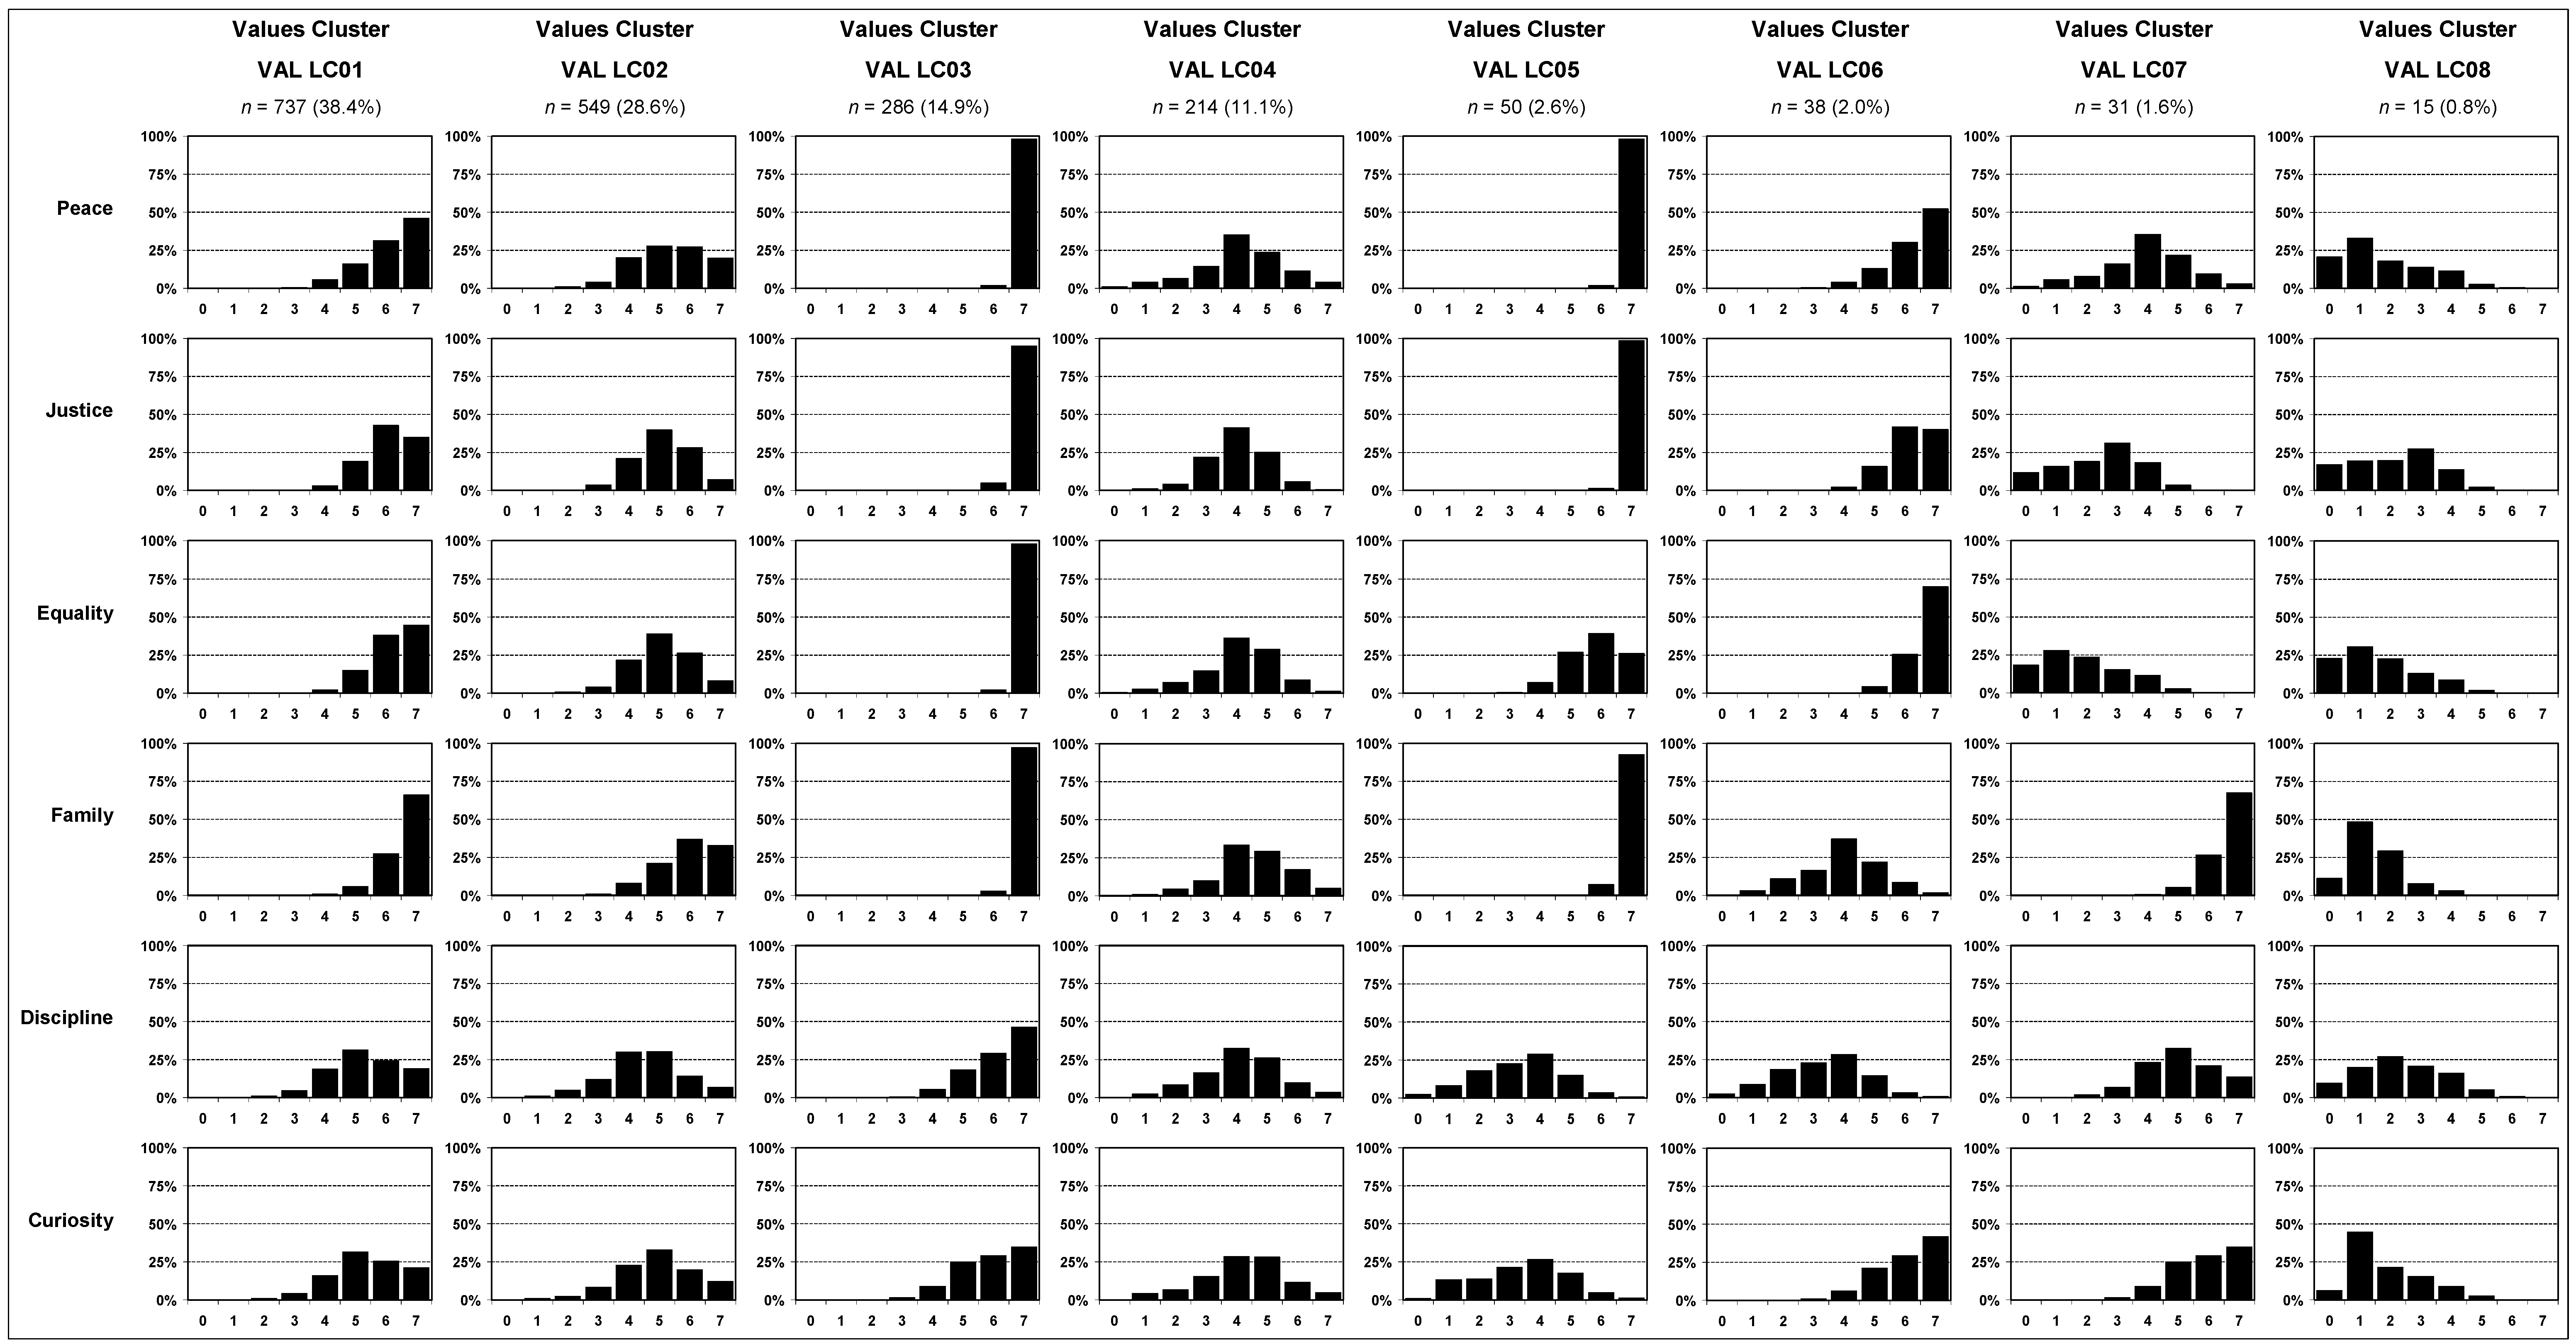
3.2. Cultural Values

| Perceived Importance a of Factors as Guiding Principles | ||||||||
|---|---|---|---|---|---|---|---|---|
| Threat | 0 | 1 | 2 | 3 | 4 | 5 | 6 | 7 |
| Family security b | 3 | 12 | 22 | 38 | 145 | 243 | 468 | 989 |
| Peace b | 7 | 19 | 26 | 78 | 259 | 365 | 427 | 739 |
| Equality b | 15 | 20 | 35 | 68 | 239 | 414 | 468 | 661 |
| Respect | 3 | 21 | 33 | 69 | 235 | 373 | 535 | 651 |
| Justice b | 9 | 14 | 24 | 93 | 262 | 448 | 503 | 567 |
| Harmony | 15 | 36 | 65 | 109 | 348 | 491 | 460 | 396 |
| Curiosity b | 2 | 24 | 45 | 128 | 356 | 567 | 428 | 370 |
| Self-discipline b | 6 | 25 | 68 | 177 | 443 | 531 | 370 | 300 |
| Stimulation | 3 | 29 | 43 | 121 | 384 | 567 | 478 | 295 |
| Culture | 9 | 75 | 111 | 211 | 469 | 479 | 322 | 244 |
| Variety | 2 | 36 | 51 | 157 | 438 | 570 | 427 | 239 |
| Arts | 10 | 91 | 143 | 285 | 512 | 469 | 234 | 176 |
| Influence | 9 | 44 | 91 | 214 | 556 | 526 | 316 | 164 |
| Wealth | 22 | 64 | 145 | 260 | 483 | 502 | 283 | 161 |
| Authority | 19 | 85 | 140 | 313 | 564 | 450 | 210 | 139 |
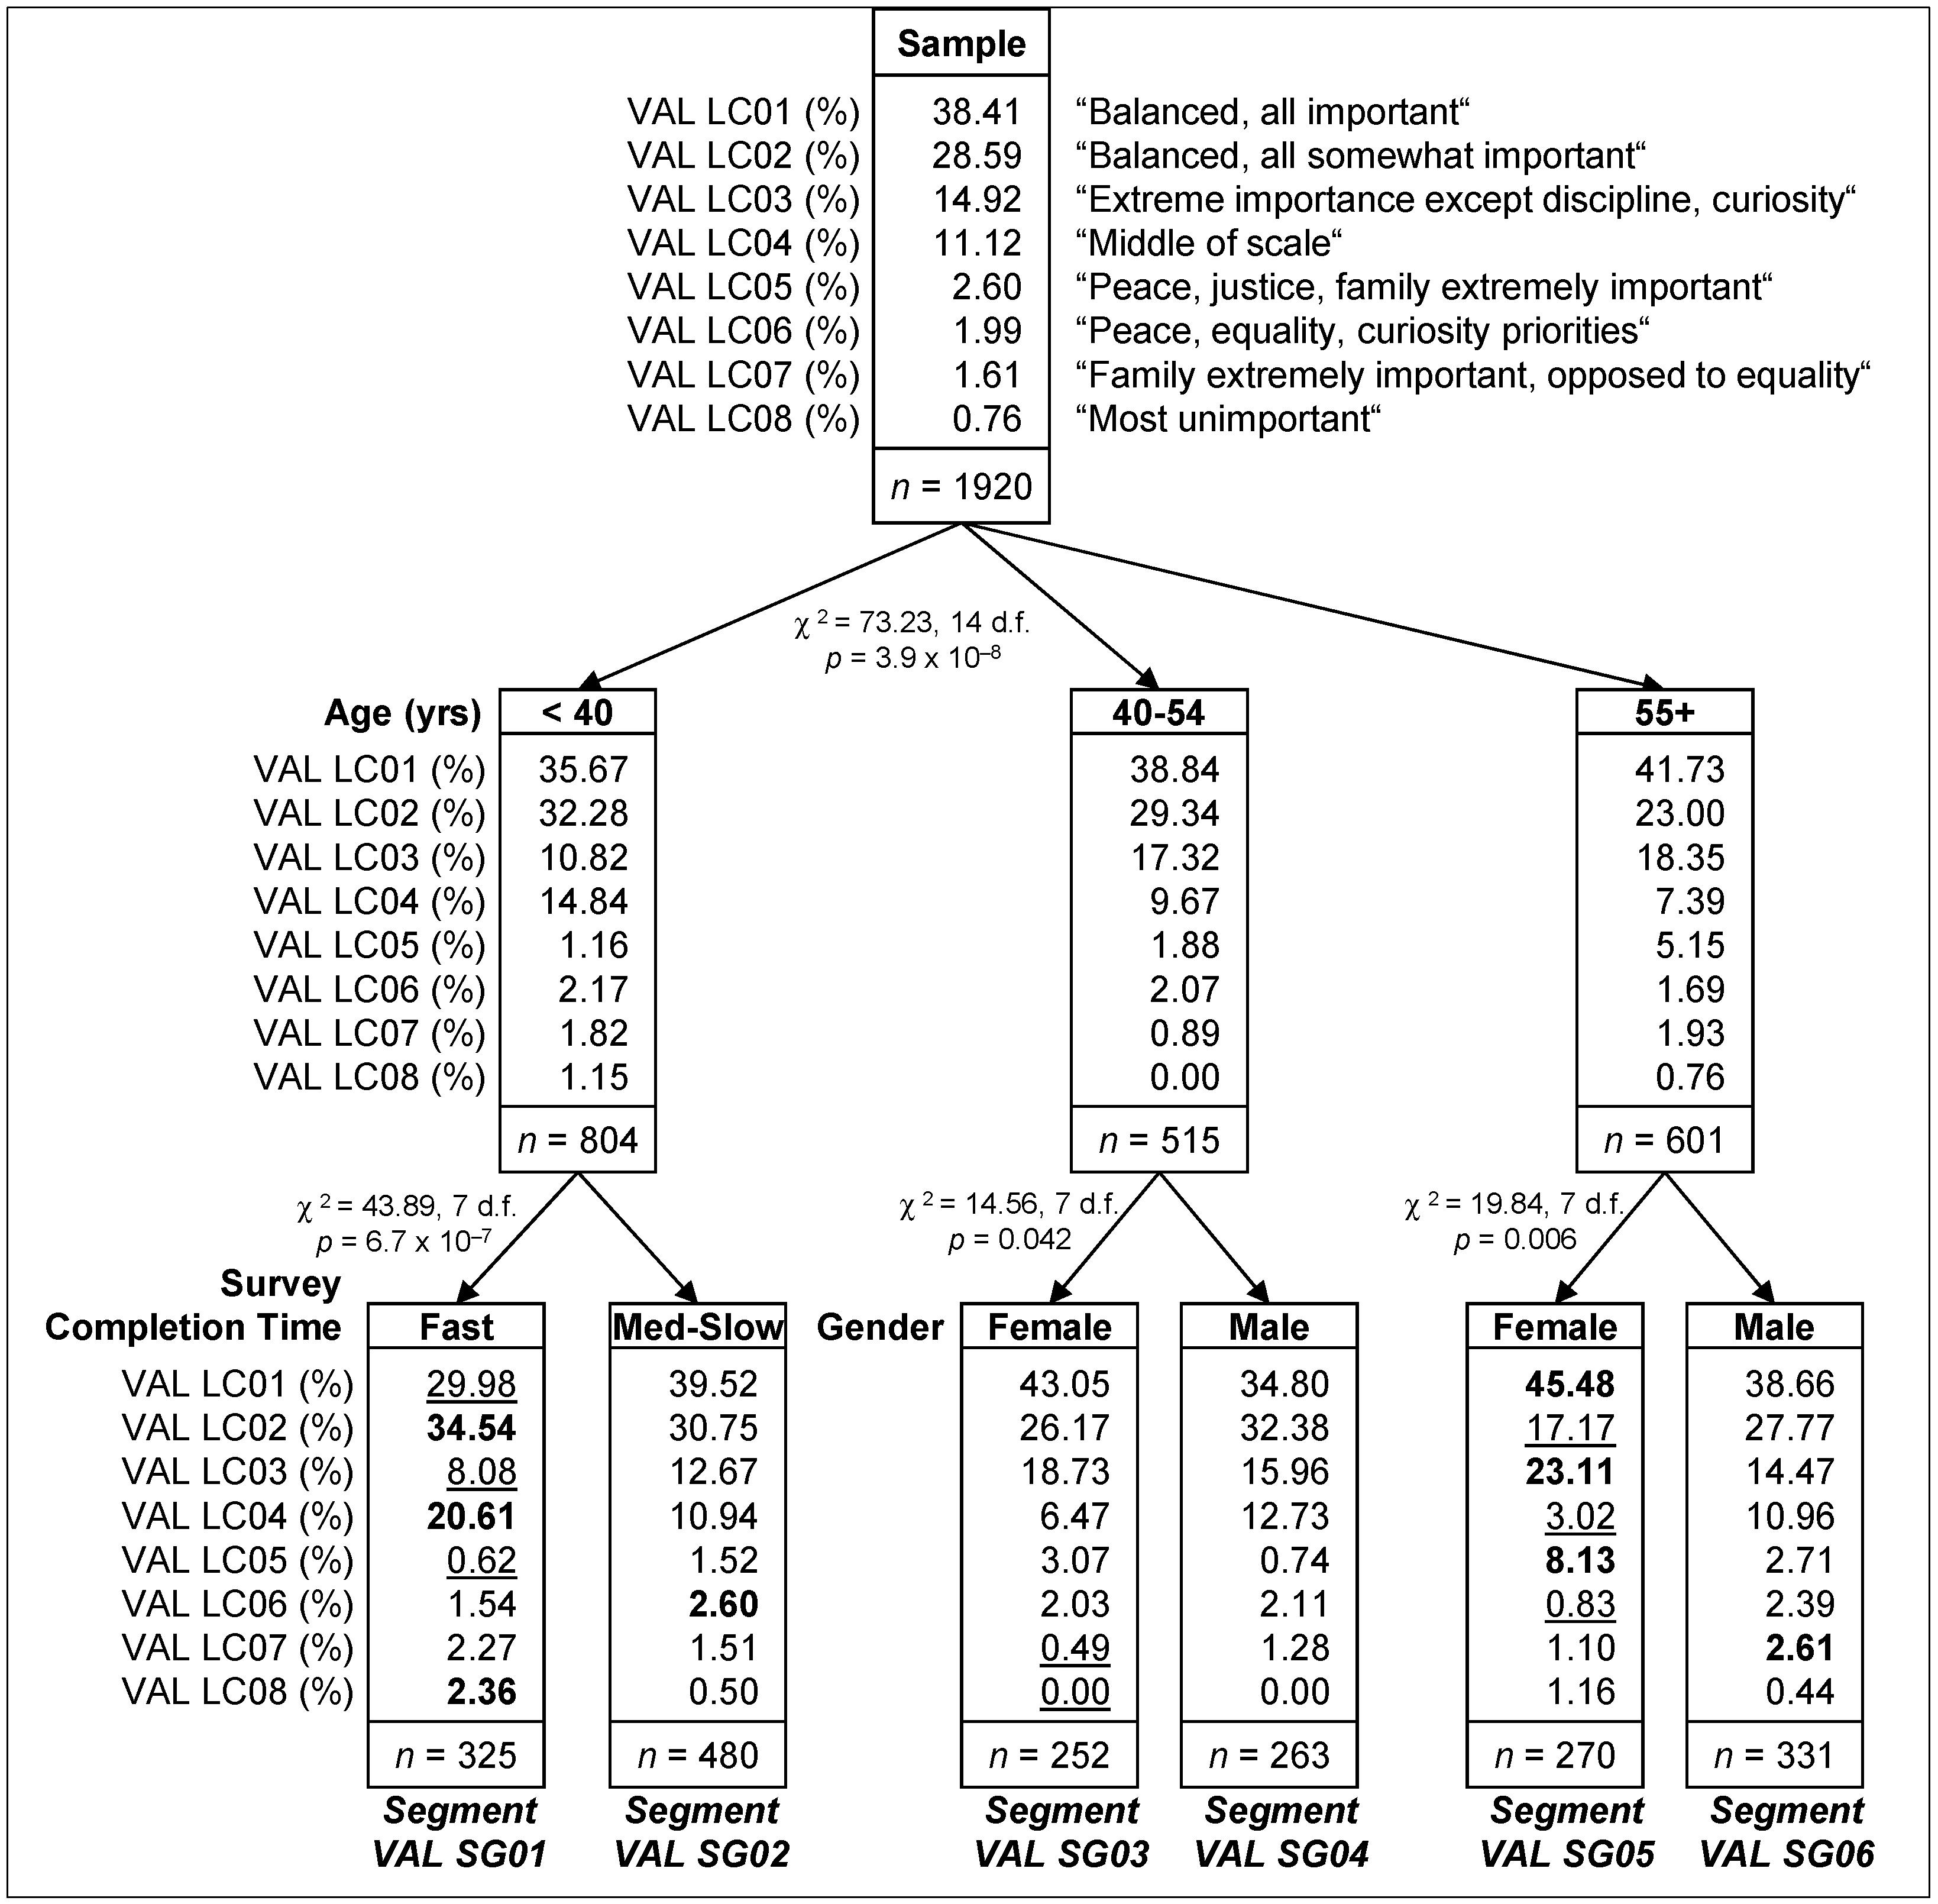
| VAL SEG 01 | VAL SEG 02 | VAL SEG 03 | VAL SEG 04 | VAL SEG 05 | VAL SEG 06 | |
|---|---|---|---|---|---|---|
| Segment size (n) | 325 | 480 | 252 | 263 | 270 | 331 |
| Proportion of sample (%) | 16.9 | 25.0 | 13.1 | 13.7 | 14.0 | 17.2 |
| Segment characteristics | ||||||
| Age (yrs) | <40 | <40 | 40–54 | 40–54 | 55+ | 55+ |
| Gender | - | - | Female | Male | Female | Male |
| Survey completion time a | 1 | 2–3 | - | - | - | - |
| Latent class membership (%) | ||||||
| Balanced, all important | 29.98 | 39.52 | 43.05 | 34.80 | 45.48 | 38.66 |
| Index | 78 | 103 | 112 | 91 | 118 | 101 |
| Rank | 6 | 3 | 2 | 5 | 1 | 4 |
| Balanced, all somewhat important | 34.54 | 30.75 | 26.17 | 32.38 | 17.17 | 27.77 |
| Index | 121 | 108 | 92 | 113 | 60 | 97 |
| Rank | 1 | 3 | 5 | 2 | 6 | 4 |
| Extremely important except discipline, curiosity | 8.08 | 12.67 | 18.73 | 15.96 | 23.11 | 14.47 |
| Index | 54 | 85 | 126 | 107 | 155 | 97 |
| Rank | 6 | 5 | 2 | 3 | 1 | 4 |
| Middle of scale | 20.61 | 10.94 | 6.47 | 12.73 | 3.02 | 10.96 |
| Index | 185 | 98 | 58 | 114 | 27 | 99 |
| Rank | 1 | 4 | 5 | 2 | 6 | 3 |
| Peace, justice, family extremely important | 0.62 | 1.52 | 3.07 | 0.74 | 8.13 | 2.71 |
| Index | 24 | 58 | 118 | 29 | 313 | 104 |
| Rank | 6 | 4 | 2 | 5 | 1 | 3 |
| Peace, equality, curiosity important | 1.54 | 2.60 | 2.03 | 2.11 | 0.83 | 2.39 |
| Index | 77 | 130 | 102 | 106 | 42 | 120 |
| Rank | 5 | 1 | 4 | 3 | 6 | 2 |
| Family extremely important, opposed to equality | 2.27 | 1.51 | 0.49 | 1.28 | 1.10 | 2.61 |
| Index | 141 | 94 | 30 | 79 | 69 | 163 |
| Rank | 2 | 3 | 6 | 4 | 5 | 1 |
| Most unimportant | 2.36 | 0.50 | 0.00 | 0.00 | 1.16 | 0.44 |
| Index | 309 | 65 | 0 | 1 | 152 | 57 |
| Rank | 1 | 3 | 6 | 5 | 2 | 4 |
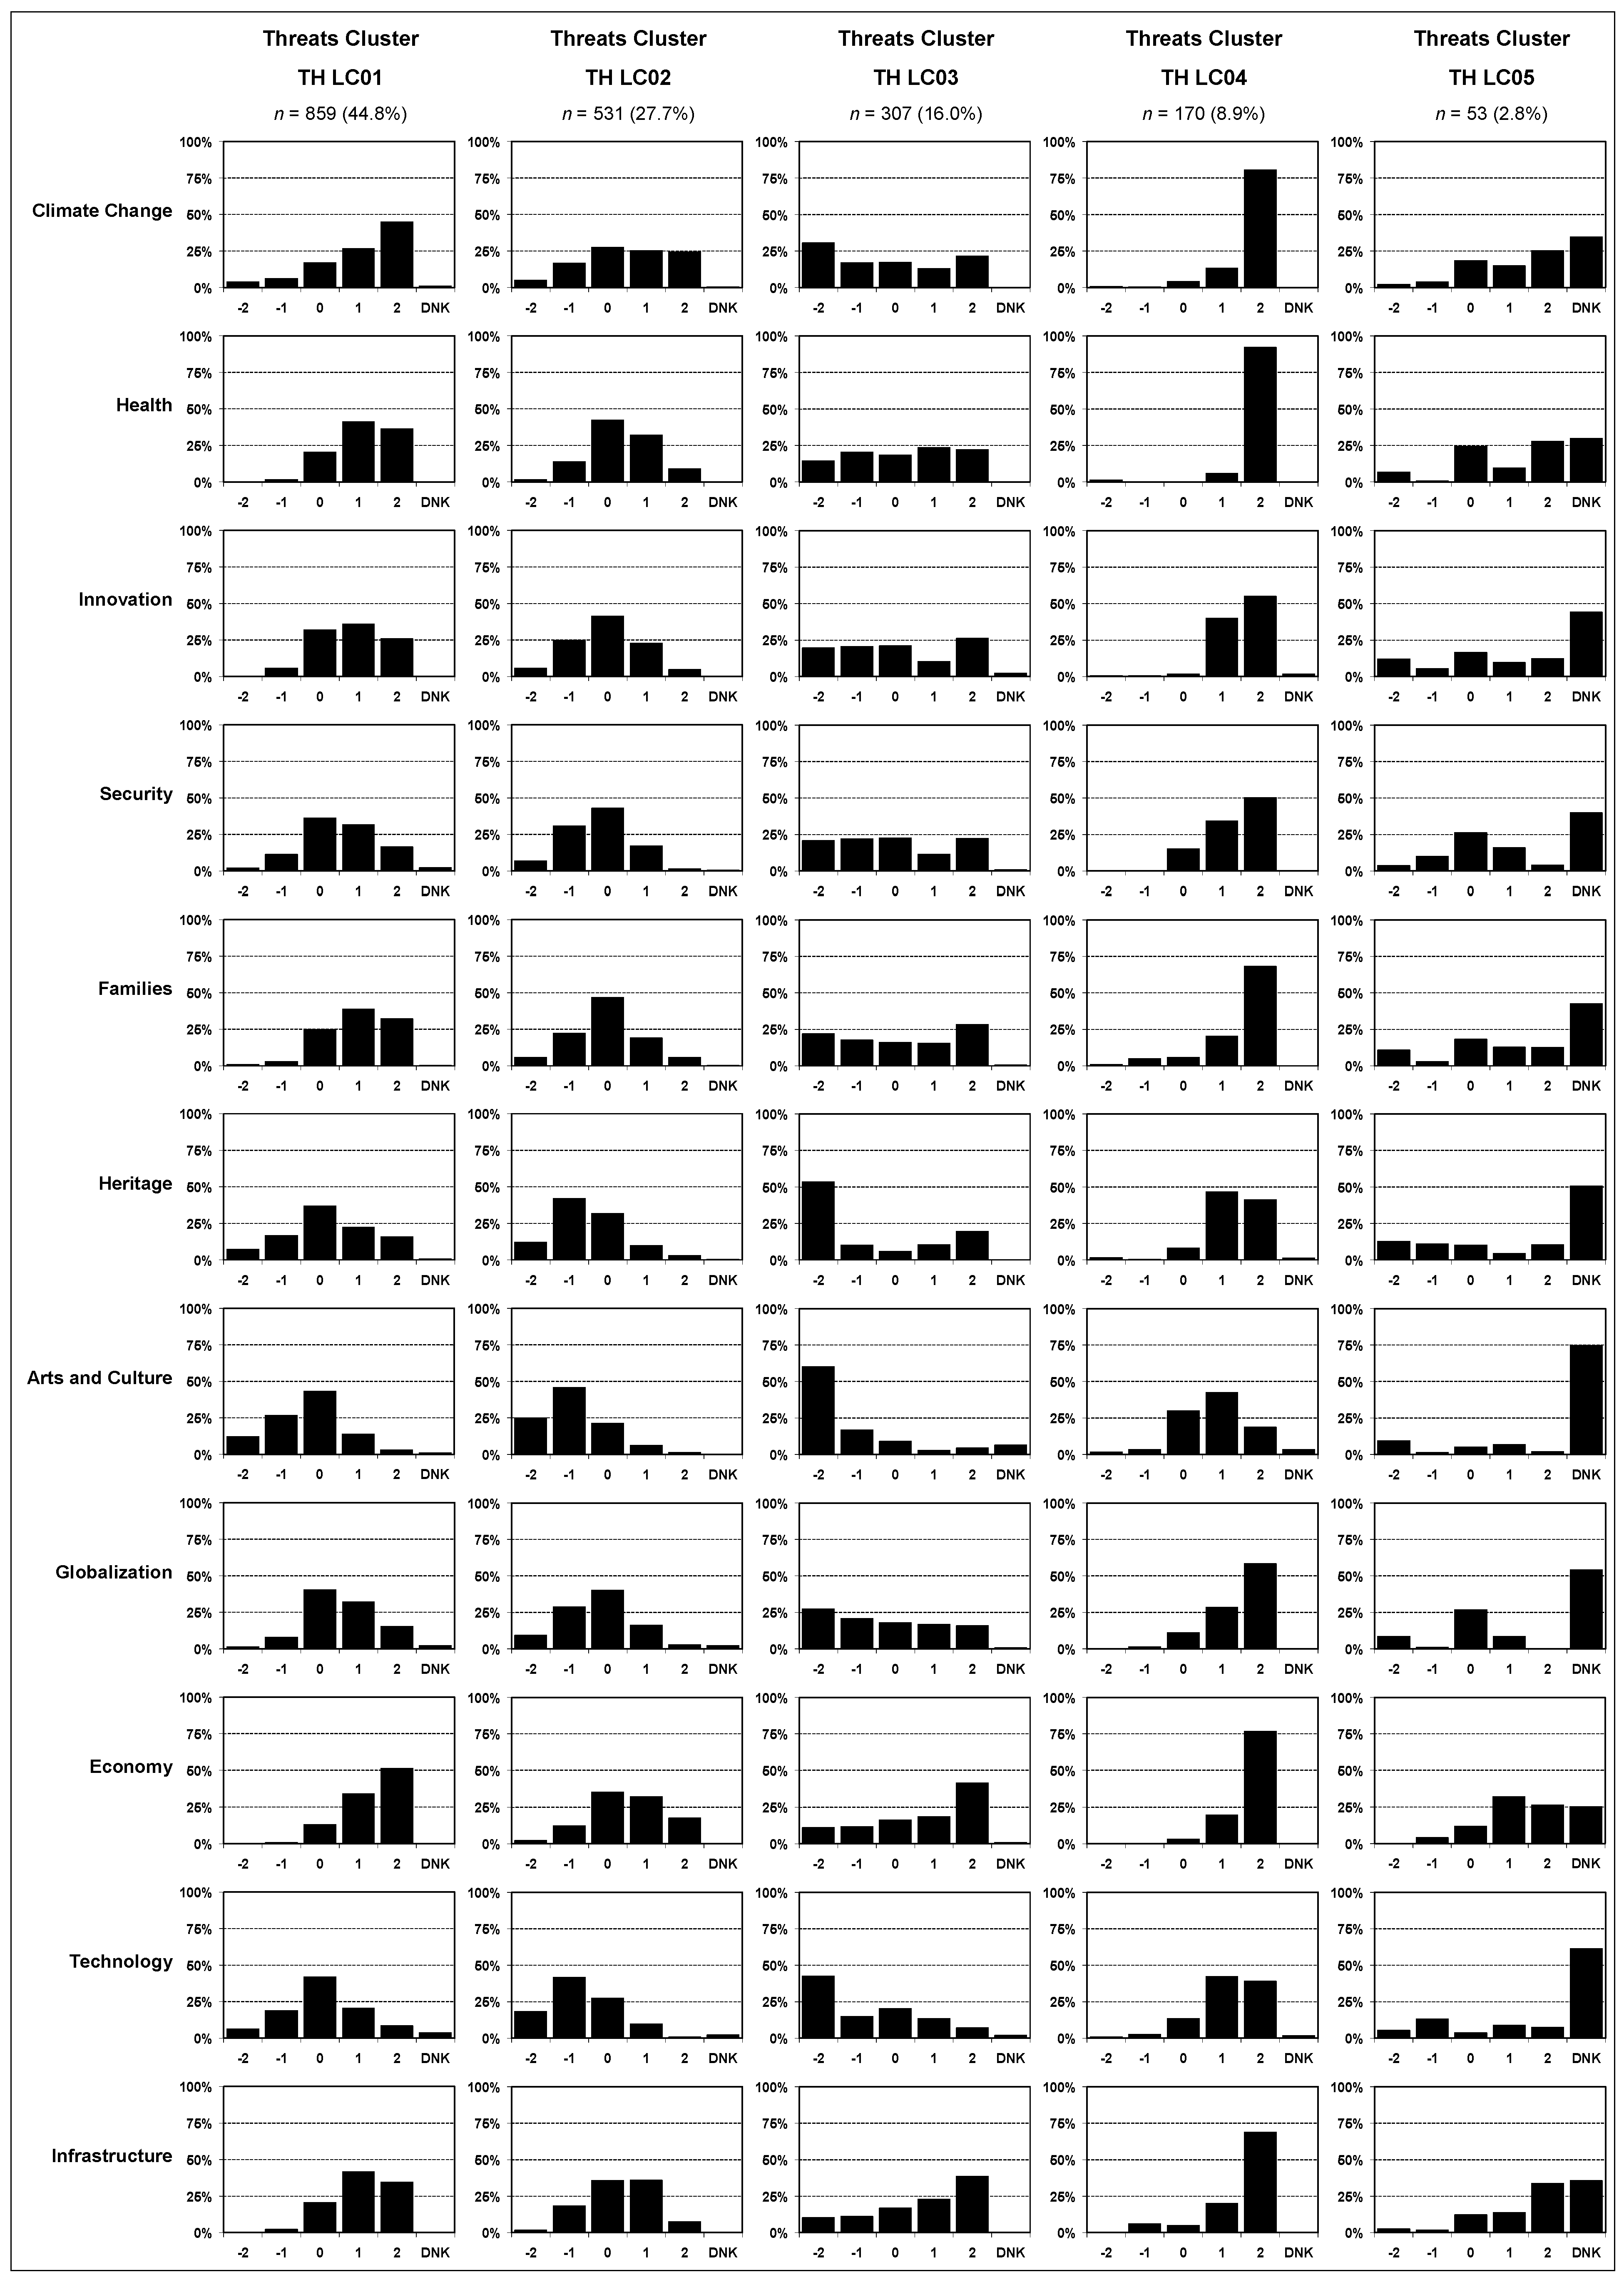
3.3. Threat Perceptions
| Perceived Importance of Potential Threats to Quality of Life in Canada | ||||||
|---|---|---|---|---|---|---|
| Threat | Very Low | Low | Moderate | High | Very High | No Opinion |
| Water | 49 | 136 | 350 | 547 | 804 | 34 |
| Economy a | 45 | 125 | 384 | 552 | 790 | 24 |
| Climate a | 148 | 202 | 383 | 418 | 733 | 36 |
| Health a | 60 | 159 | 480 | 591 | 609 | 21 |
| Infrastructure a | 60 | 187 | 467 | 638 | 537 | 31 |
| Families a | 112 | 235 | 521 | 516 | 502 | 34 |
| Innovation a | 100 | 259 | 570 | 519 | 429 | 43 |
| Security a | 126 | 344 | 636 | 465 | 301 | 48 |
| Globalization a | 167 | 306 | 661 | 446 | 259 | 81 |
| Heritage a | 304 | 436 | 528 | 354 | 251 | 47 |
| Technology a | 303 | 469 | 588 | 320 | 149 | 91 |
| Culture a | 420 | 543 | 566 | 232 | 86 | 73 |

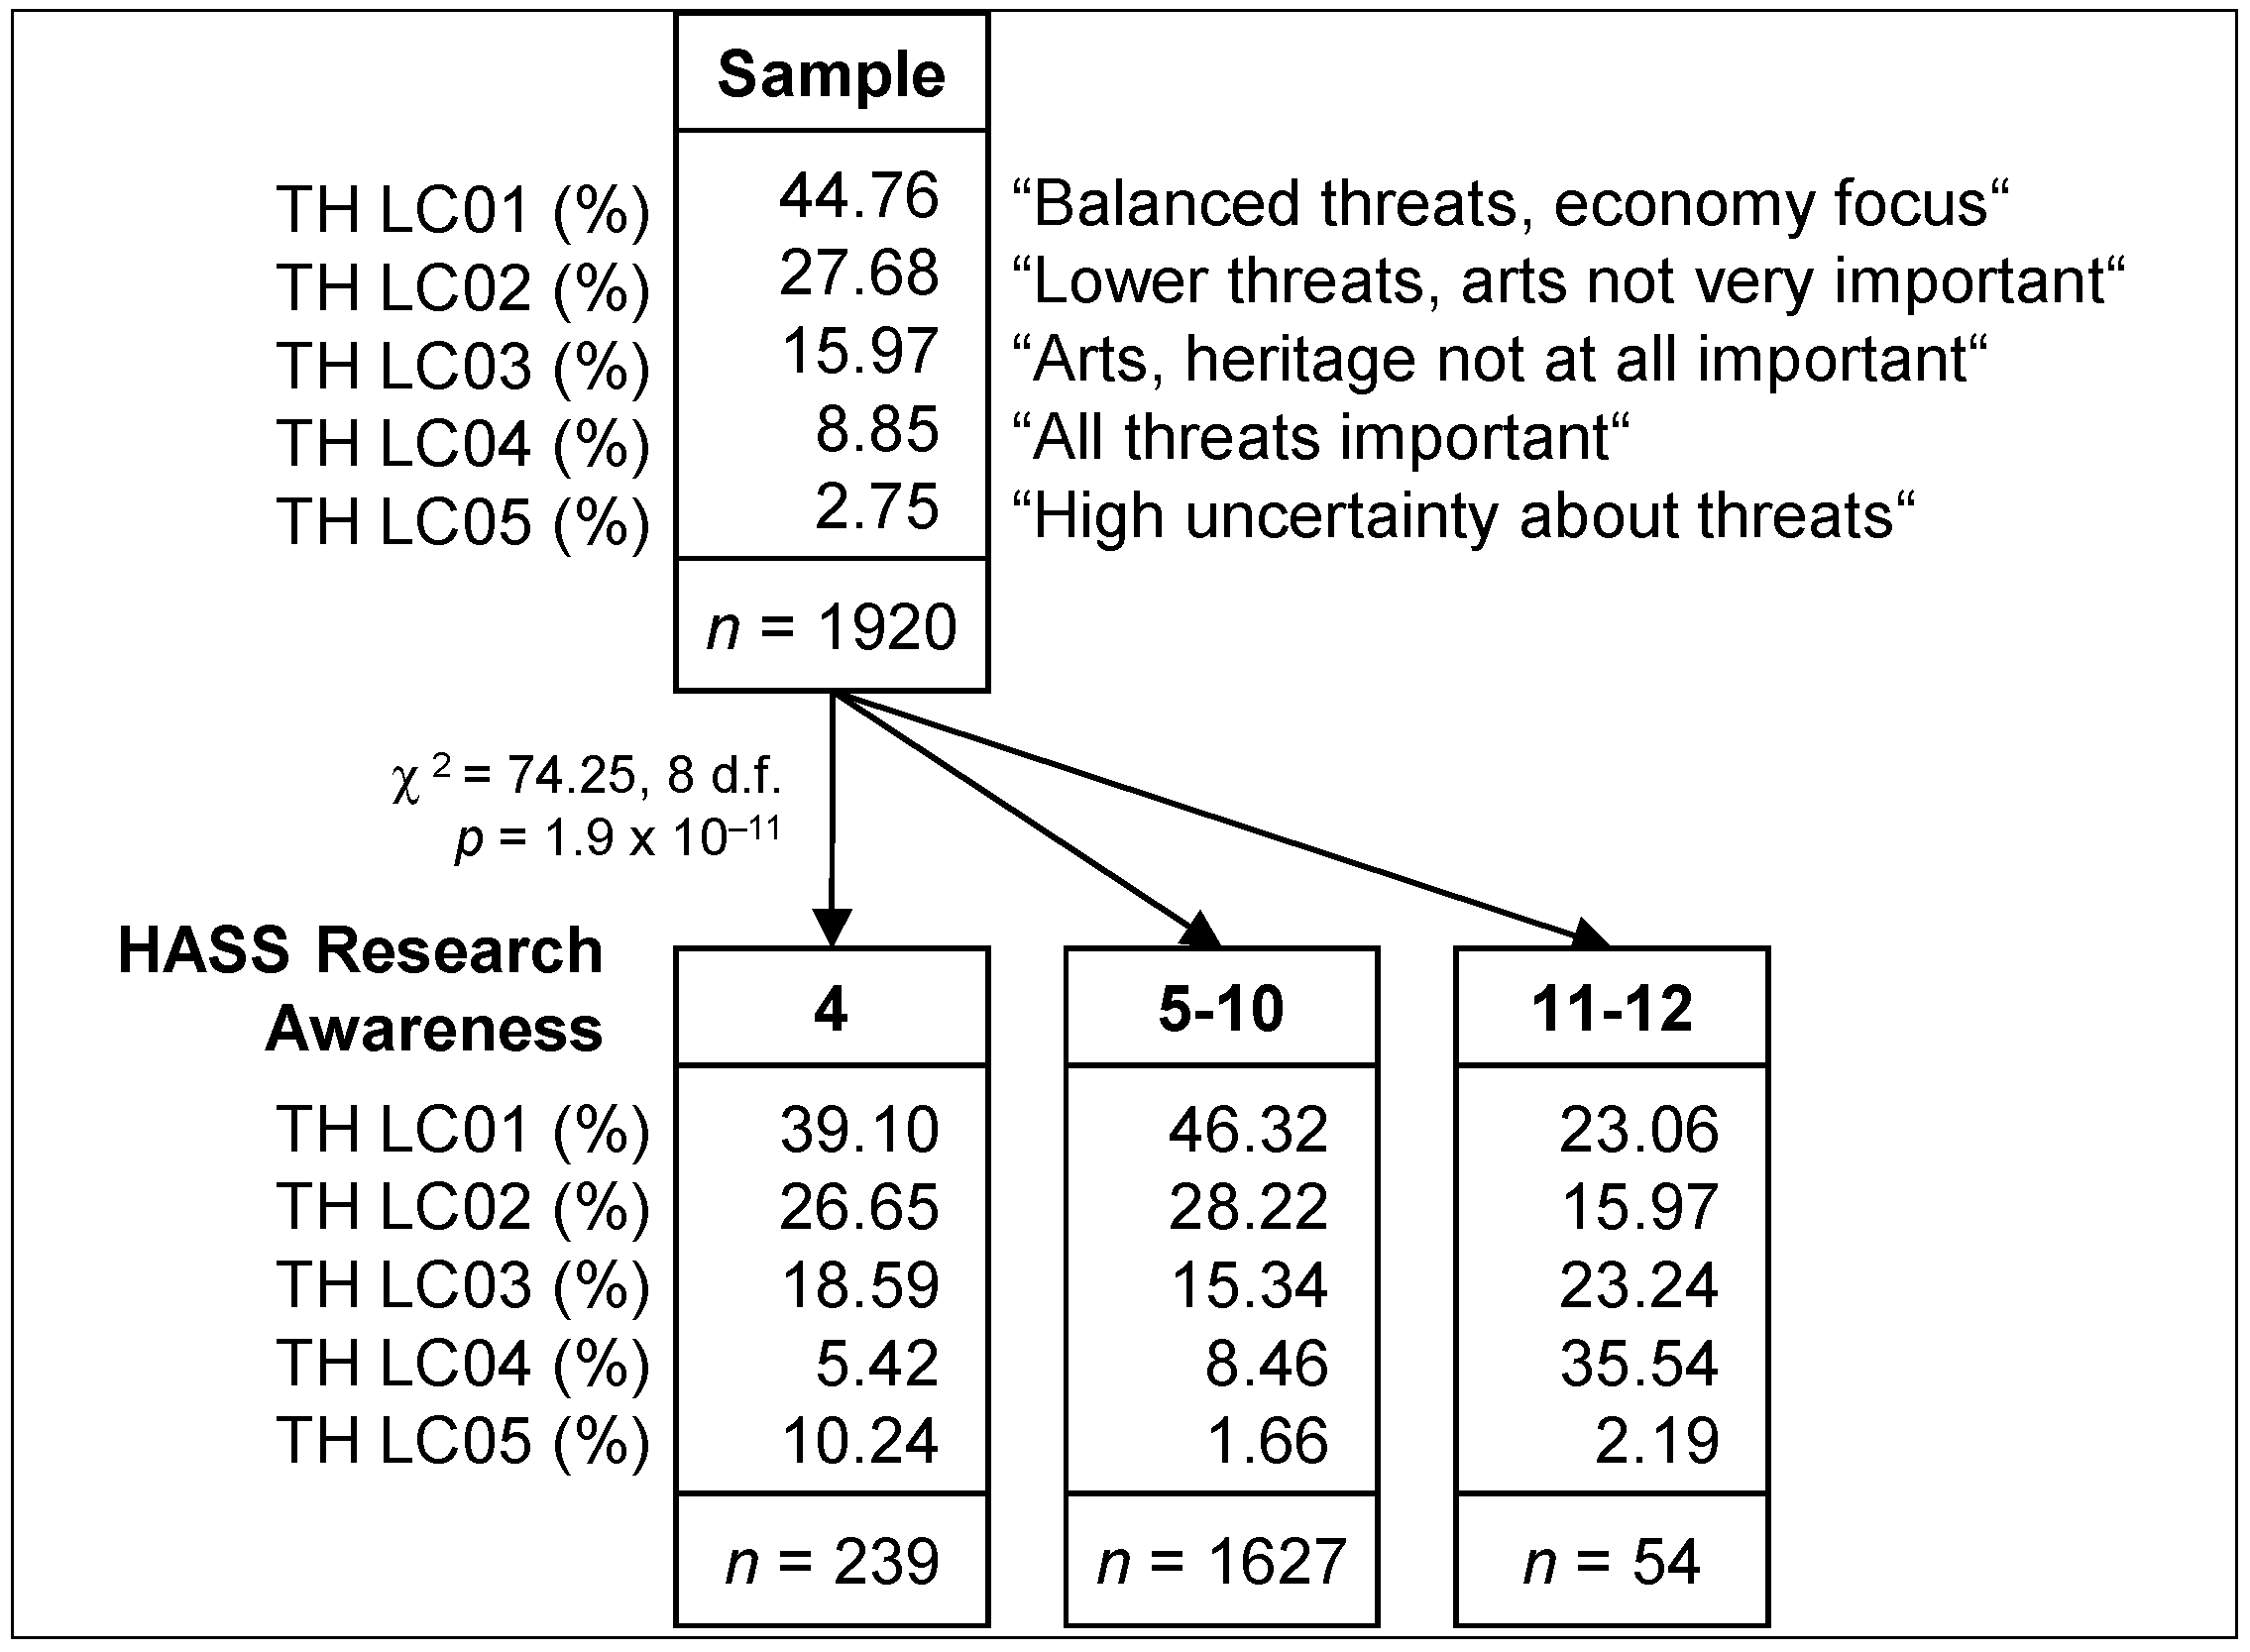
| CHAID Perceived Threats Segment | |||||||||||||
|---|---|---|---|---|---|---|---|---|---|---|---|---|---|
| TH SG01 | TH SG02 | TH SG03 | TH SG04 | TH SG05 | TH SG06 | TH SG07 | TH SG08 | TH SG09 | TH SG10 | TH SG11 | TH SG12 | TH SG13 | |
| Segment Size (n) | 90 | 72 | 77 | 215 | 40 | 185 | 23 | 158 | 400 | 493 | 114 | 18 | 36 |
| Proportion of sample (%) | 4.7 | 3.8 | 4.0 | 11.2 | 2.1 | 9.6 | 1.2 | 8.0 | 20.8 | 25.7 | 5.9 | 0.9 | 1.9 |
| Segment characteristics | |||||||||||||
| HASS research awareness a | 4 | 4 | 4 | 5–10 | 5–10 | 5–10 | 5–10 | 5–10 | 5–10 | 5–10 | 5–10 | 11–12 | 11–12 |
| Educational attainment b | 1 | 2–4 | 2–4 | - | 1 | 2–4 | 2–4 | 1 | 2–4 | - | - | - | - |
| Survey completion time c | - | - | - | 1 | 1 | 1 | 1 | 2–3 | 2–3 | 2–3 | 2–3 | 1 | 2–3 |
| Region d | - | 1–2 | 3–5 | - | - | - | - | - | - | - | - | - | - |
| Gender | - | - | - | F | M | M | M | F | F | M | M | - | - |
| Citizenship e | - | - | - | - | - | - | - | - | - | 1 | 2 | - | - |
| Protest f | - | - | - | - | - | 1 | 2 | - | - | - | - | - | - |
| Latent class membership (%) | |||||||||||||
| Balanced threats, economy focus | 47.2 | 42.0 | 26.8 | 45.6 | 35.2 | 35.2 | 28.4 | 52.3 | 58.8 | 45.7 | 36.5 | 31.6 | 18.8 |
| Index | 106 | 94 | 60 | 102 | 79 | 79 | 63 | 117 | 131 | 102 | 81 | 71 | 42 |
| Rank | 3 | 6 | 12 | 5 | 9 | 8 | 11 | 2 | 1 | 4 | 7 | 10 | 13 |
| Lower threats, arts not important | 18.6 | 34.8 | 28.6 | 31.8 | 14.8 | 39.9 | 20.5 | 19.6 | 26.2 | 31.0 | 28.8 | 21.7 | 13.1 |
| Index | 67 | 126 | 103 | 115 | 53 | 144 | 74 | 71 | 95 | 112 | 104 | 78 | 47 |
| Rank | 11 | 2 | 6 | 3 | 12 | 1 | 9 | 10 | 7 | 4 | 5 | 8 | 13 |
| Arts, heritage not at all important | 12.1 | 8.1 | 36.0 | 14.2 | 35.5 | 19.9 | 51.1 | 10.7 | 7.4 | 16.9 | 17.1 | 30.2 | 19.8 |
| Index | 76 | 51 | 225 | 89 | 222 | 124 | 320 | 67 | 47 | 106 | 107 | 189 | 124 |
| Rank | 10 | 12 | 2 | 9 | 3 | 5 | 1 | 11 | 13 | 8 | 7 | 4 | 6 |
| All threats important | 2.3 | 12.6 | 2.4 | 5.0 | 12.1 | 2.5 | 0.0 | 14.5 | 7.5 | 6.3 | 15.6 | 10.1 | 48.2 |
| Index | 26 | 142 | 27 | 57 | 137 | 29 | 0 | 164 | 857 | 71 | 177 | 114 | 544 |
| Rank | 12 | 4 | 11 | 9 | 5 | 10 | 13 | 3 | 7 | 8 | 2 | 6 | 1 |
| High uncertainty about threats | 19.8 | 2.5 | 6.2 | 3.3 | 2.4 | 2.5 | 0.1 | 2.9 | 0.0 | 0.2 | 1.9 | 6.4 | 0.1 |
| Index | 720 | 92 | 227 | 121 | 87 | 91 | 2 | 105 | 2 | 8 | 71 | 233 | 4 |
| Rank | 1 | 6 | 3 | 4 | 8 | 7 | 12 | 5 | 13 | 10 | 9 | 2 | 11 |
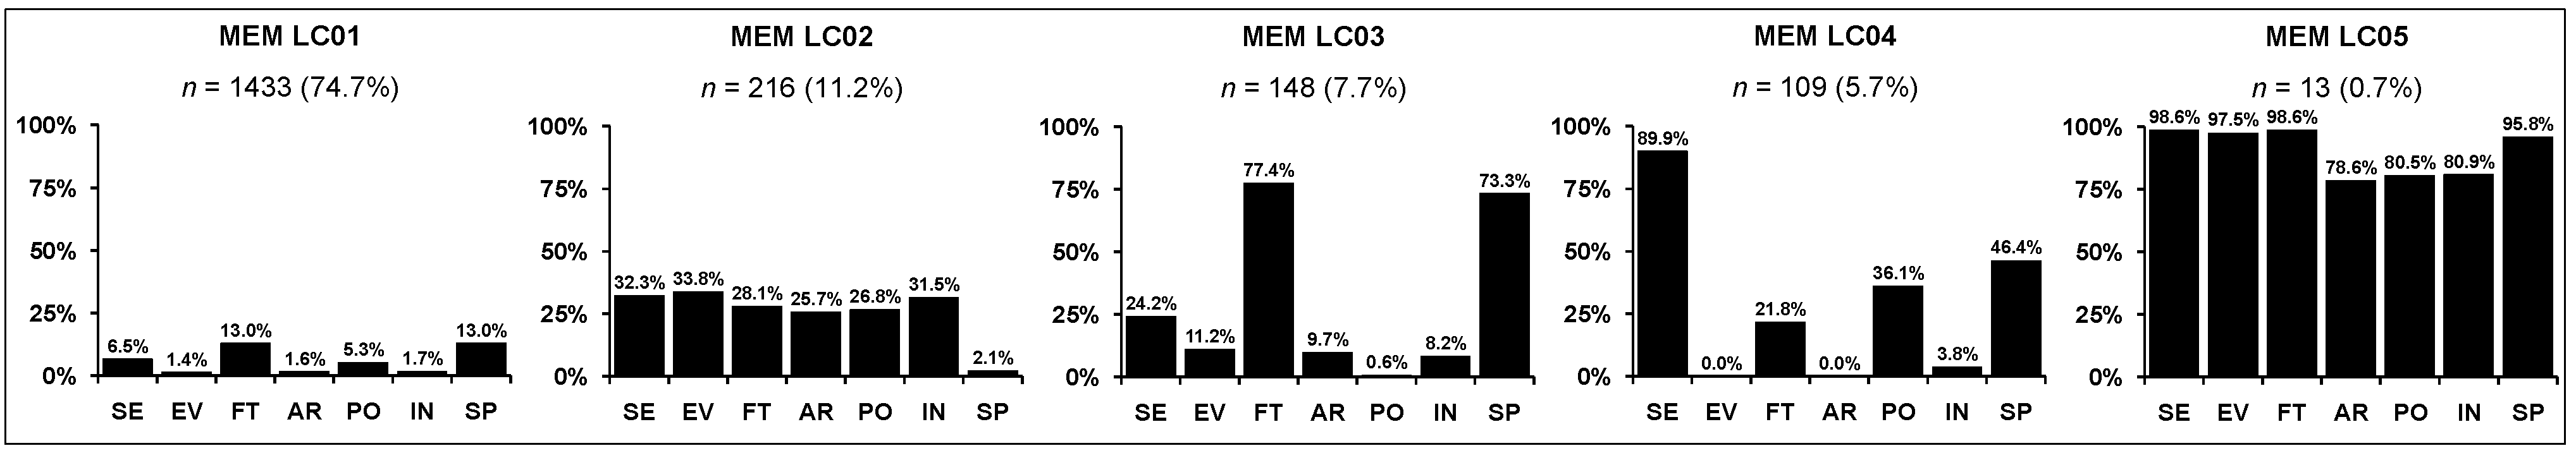
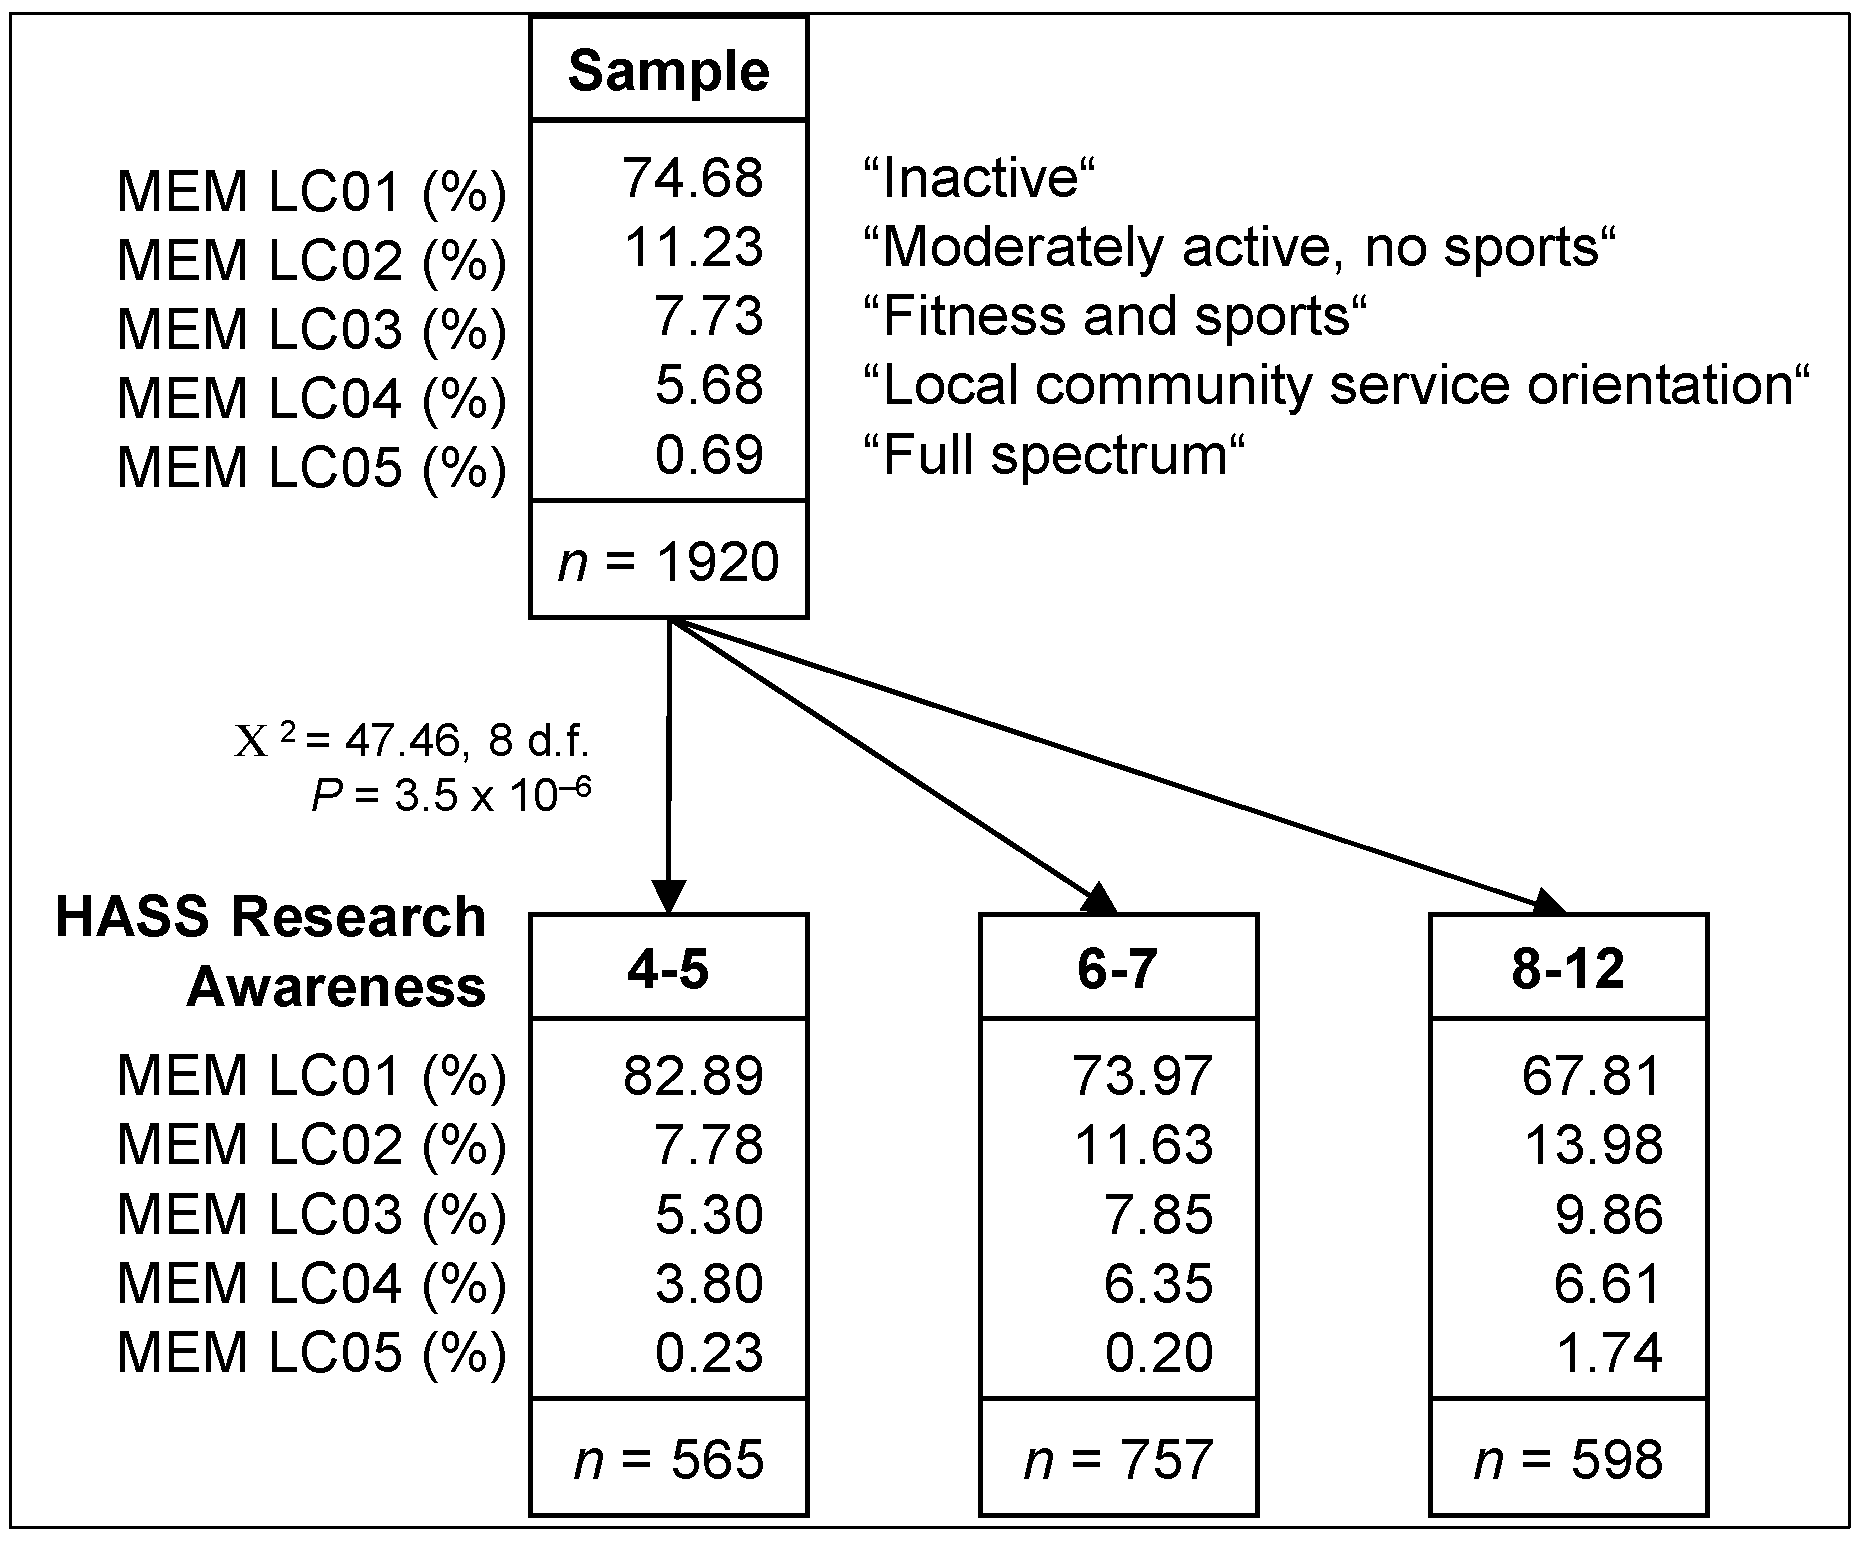
3.4. Memberships


| CHAID Membership Segment | ||||||
|---|---|---|---|---|---|---|
| MEM SG01 | MEM SG02 | MEM SG03 | MEM SG04 | MEM SG05 | MEM SG06 | |
| Segment Size | ||||||
| n | 565 | 316 | 441 | 384 | 163 | 51 |
| % of total sample | 29.43 | 16.46 | 22.97 | 20.00 | 8.49 | 2.66 |
| Segment characteristics | ||||||
| HASS research awareness a | 4–5 | 6–7 | 6–7 | 8–12 | 8–12 | 8–12 |
| Marital status b | - | 1,3 | 2 | - | - | - |
| Educational attainment c | - | - | - | 1–2 | 3–4 | 3–4 |
| Citizenship status d | - | - | - | - | 1 | 2 |
| Latent class membership (%) | ||||||
| Inactive | 82.89 | 73.37 | 74.40 | 70.53 | 63.05 | 62.50 |
| Index | 111 | 98 | 100 | 94 | 84 | 84 |
| Rank | 1 | 3 | 2 | 4 | 5 | 6 |
| Moderately active, no sports | 7.78 | 15.67 | 8.73 | 14.28 | 13.51 | 13.29 |
| Index | 69 | 140 | 78 | 127 | 120 | 118 |
| Rank | 6 | 1 | 5 | 2 | 3 | 4 |
| Fitness and sports | 5.30 | 6.73 | 8.66 | 8.58 | 11.83 | 13.26 |
| Index | 69 | 87 | 112 | 111 | 153 | 172 |
| Rank | 6 | 5 | 3 | 4 | 2 | 1 |
| Local community service orientation | 3.80 | 3.89 | 8.12 | 6.01 | 9.47 | 2.00 |
| Index | 67 | 69 | 143 | 106 | 167 | 35 |
| Rank | 5 | 4 | 2 | 3 | 1 | 6 |
| Full spectrum | 0.23 | 0.35 | 0.09 | 0.61 | 2.14 | 8.95 |
| Index | 34 | 30 | 13 | 89 | 311 | 1300 |
| Rank | 5 | 4 | 6 | 3 | 2 | 1 |
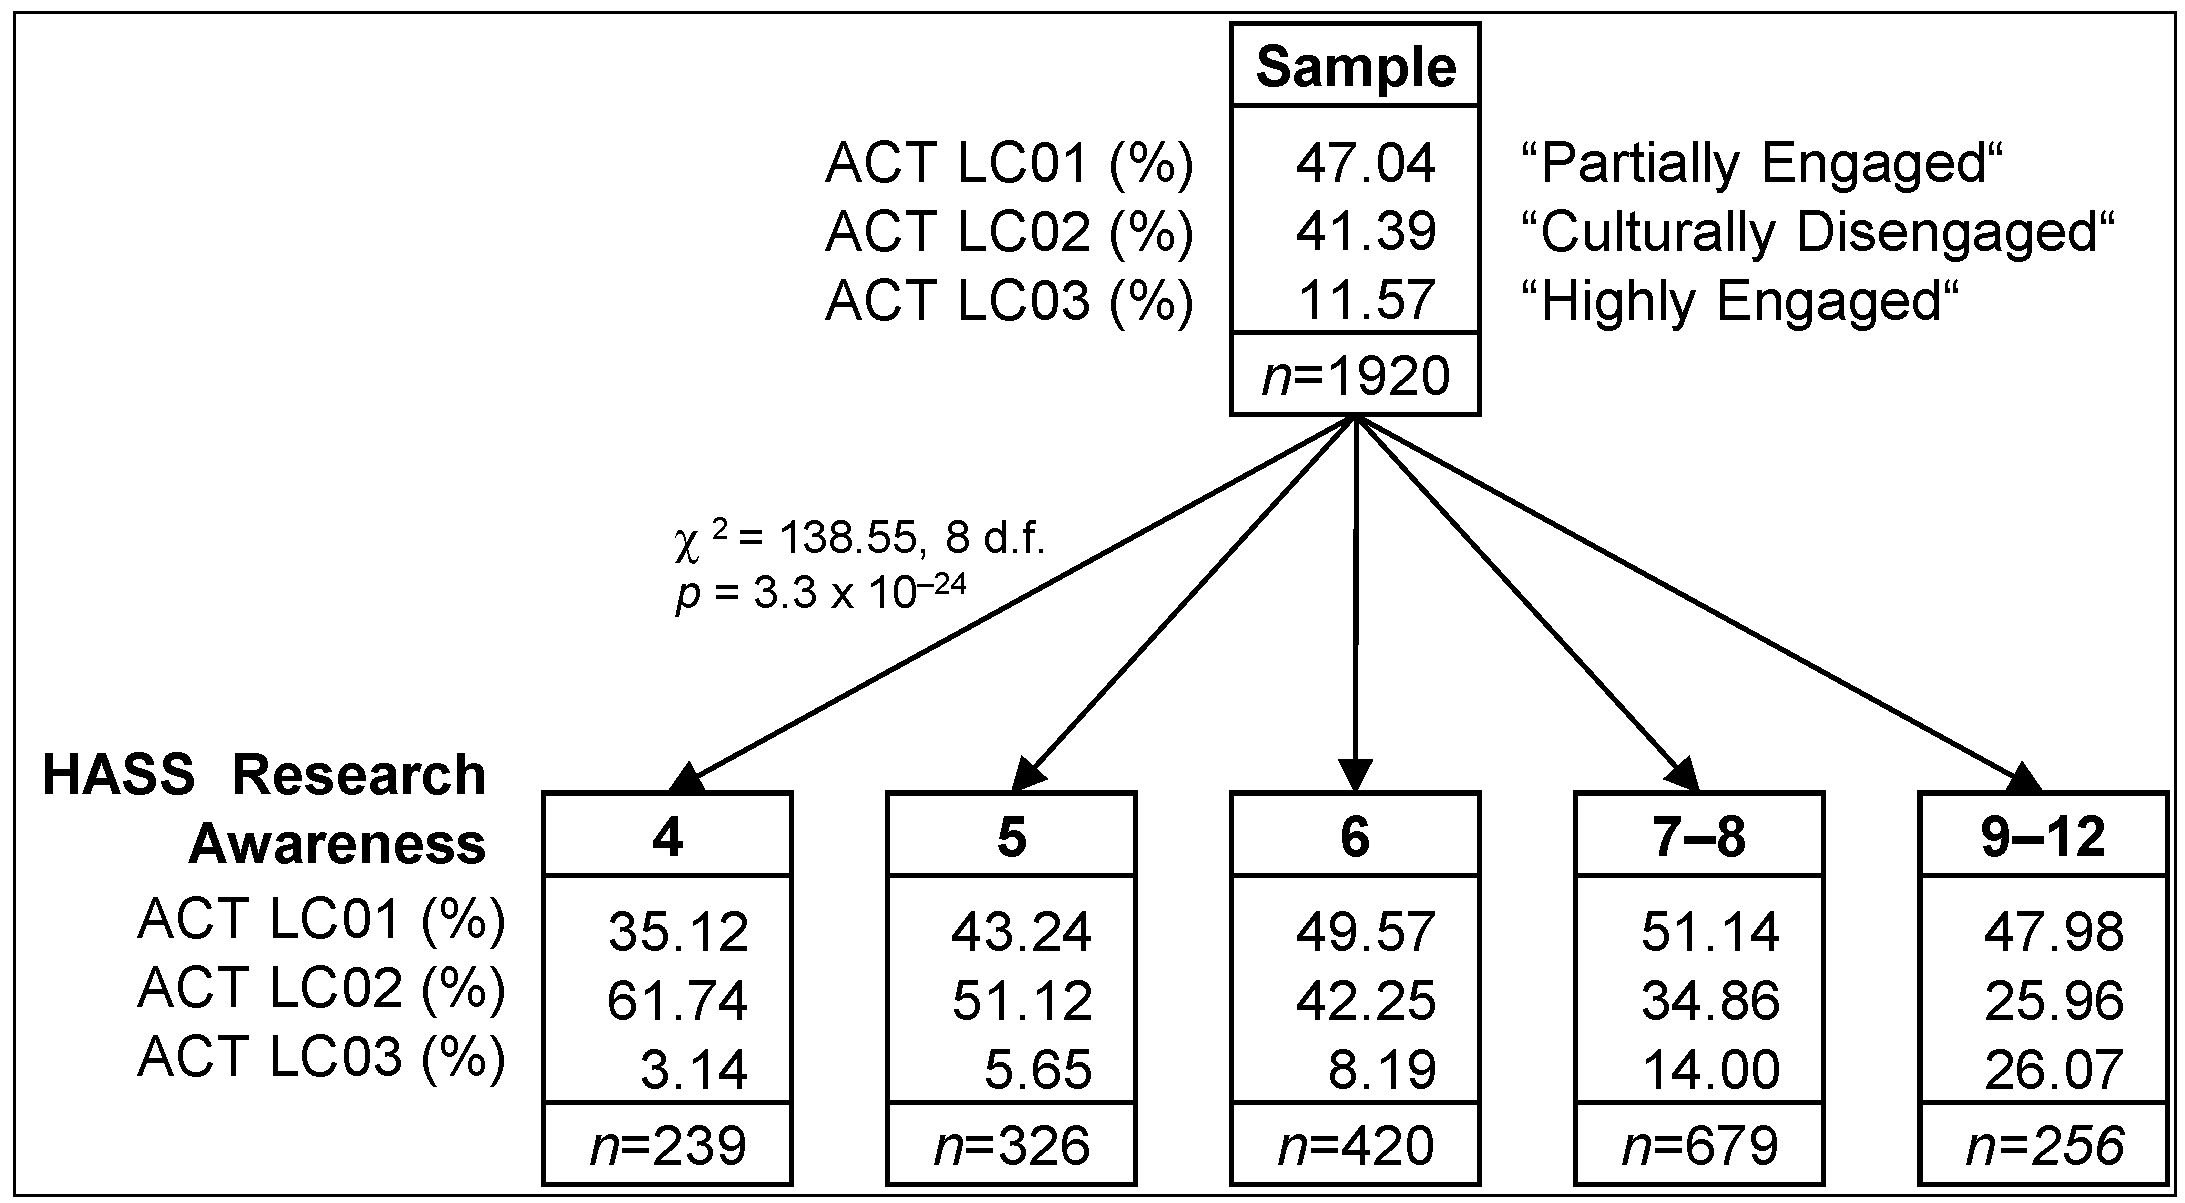
3.5. Cultural Activities
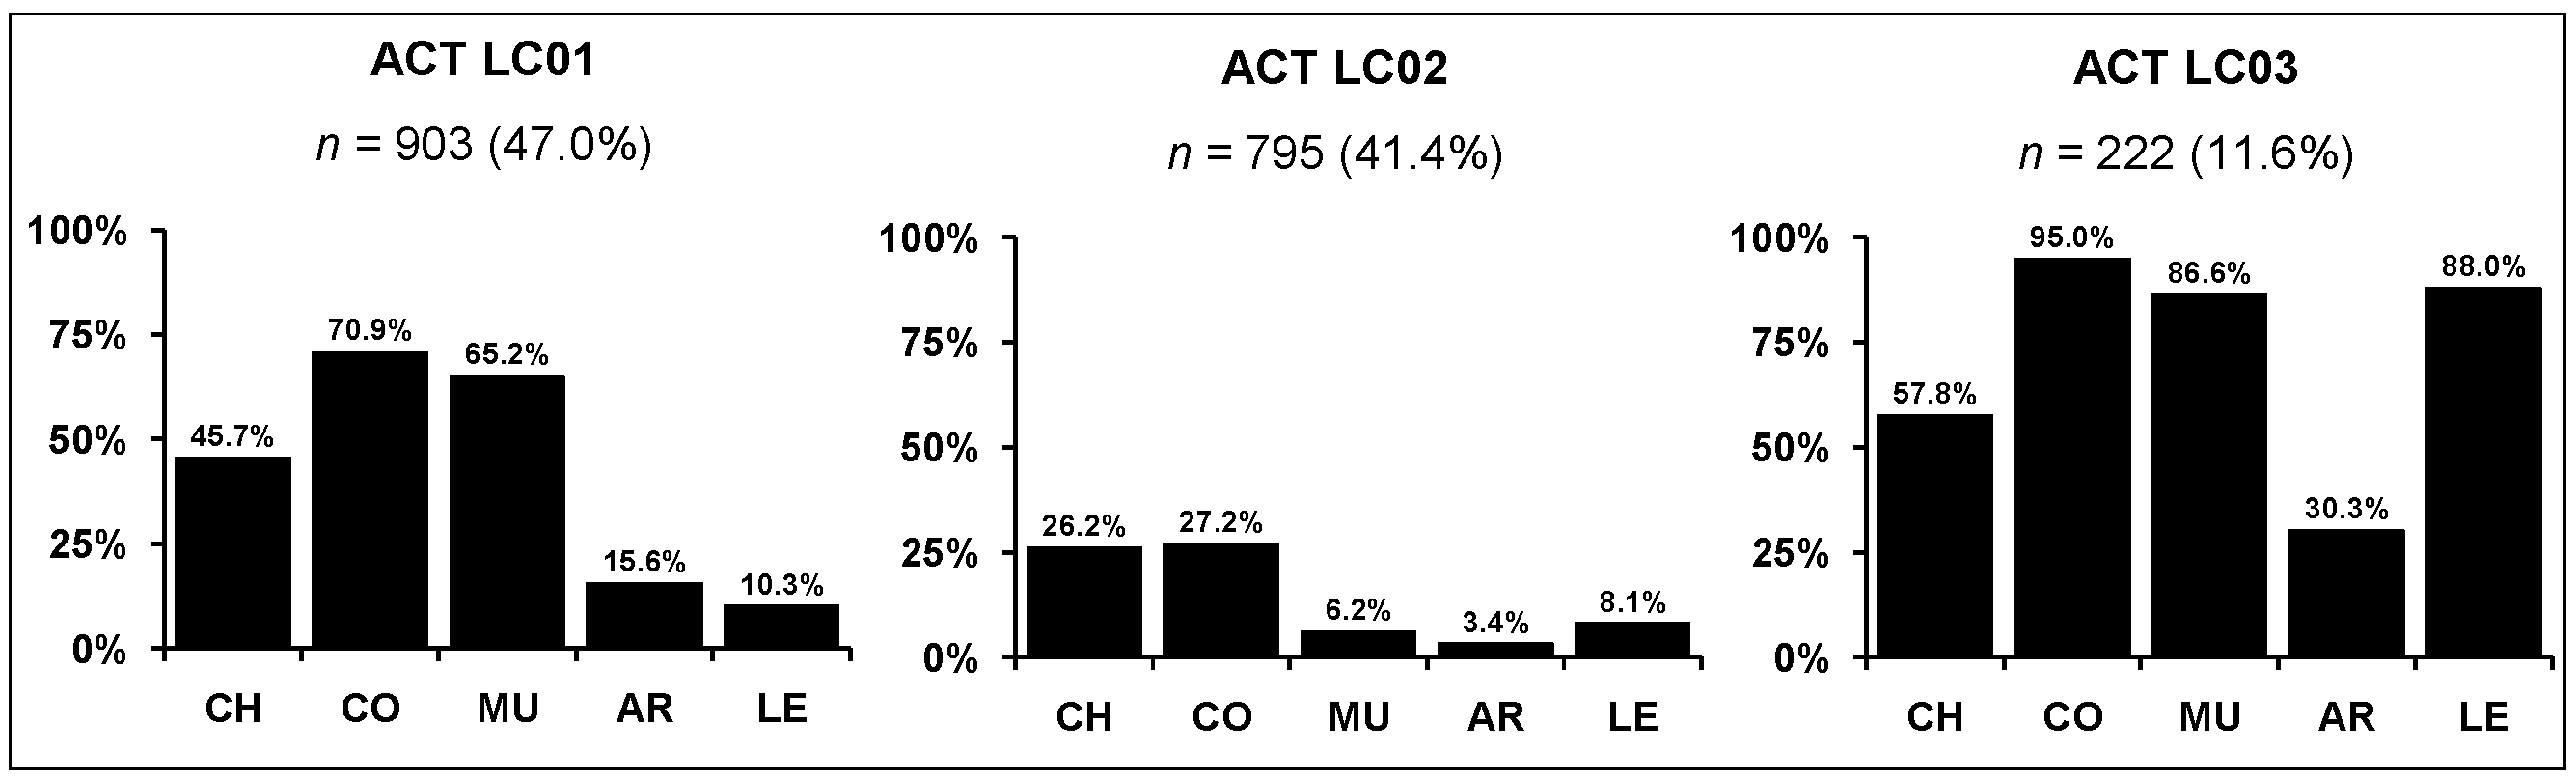
| CHAID Cultural Activities Segment | |||||||||||
|---|---|---|---|---|---|---|---|---|---|---|---|
| ACT SG01 | ACT SG02 | ACT SG03 | ACT SG04 | ACT SG05 | ACT SG06 | ACT SG07 | ACT SG08 | ACT SG09 | ACT SG10 | ACT SG11 | |
| Segment Size (n) | 239 | 326 | 171 | 165 | 84 | 146 | 337 | 197 | 85 | 61 | 110 |
| Proportion of sample (%) | 12.4 | 17.0 | 8.9 | 8.6 | 4.4 | 7.6 | 17.5 | 10.3 | 4.4 | 3.2 | 5.7 |
| Segment characteristics | |||||||||||
| HASS research awareness a | 4 | 5 | 6 | 6 | 6 | 7–8 | 7–8 | 7–8 | 9–12 | 9–12 | 9–12 |
| Educational attainment b | - | - | 1–2 | 1–2 | 3–4 | 1 | 2 | 3–4 | 1–2 | 1–2 | 3–4 |
| Gender | - | - | F | M | - | - | - | - | - | - | - |
| Survey completion time c | - | - | - | - | - | - | - | - | 1–2 | 3 | - |
| Latent class membership (%) | |||||||||||
| Partially engaged | 35.1 | 43.2 | 47.9 | 48.8 | 54.5 | 43.9 | 55.0 | 50.5 | 49.2 | 51.5 | 45.1 |
| Index | 75 | 92 | 102 | 104 | 116 | 93 | 117 | 106 | 105 | 109 | 96 |
| Rank | 11 | 10 | 7 | 6 | 2 | 9 | 1 | 4 | 5 | 3 | 8 |
| Culturally disengaged | 61.7 | 51.1 | 42.6 | 48.0 | 30.2 | 51.7 | 32.2 | 26.9 | 39.1 | 21.6 | 18.2 |
| Index | 149 | 123 | 103 | 116 | 73 | 125 | 78 | 65 | 94 | 52 | 44 |
| Rank | 1 | 3 | 5 | 4 | 8 | 2 | 7 | 9 | 6 | 10 | 11 |
| Highly engaged | 3.1 | 5.6 | 9.5 | 3.1 | 15.3 | 4.5 | 12.8 | 23.2 | 11.7 | 26.9 | 36.7 |
| Index | 27 | 49 | 82 | 27 | 132 | 39 | 110 | 200 | 101 | 232 | 317 |
| Rank | 11 | 8 | 7 | 10 | 4 | 9 | 5 | 3 | 6 | 2 | 1 |
3.6. Correlations between Latent Classes
3.7. Segmentation Summary
4. Conclusions
Acknowledgments
Abbreviations
| CBA | cost-benefit analysis |
| HASS | humanities, arts, and social sciences |
| LC | latent class |
| STEM | science, technology, engineering and medical |
| VBN | Value-Belief-Norm theory |
Conflicts of Interest
References
- Ruth Levitt, Claire Celia, Stephanie Diepeveen, Stephanie N. Chonaill, Lila Rabinovic, and Jan Tiessen. Assessing the Impact of Arts and Humanities Research at the University of Cambridge. Cambridge: RAND Europe, 2010. [Google Scholar]
- Jordi Molas-Gallart, and Puay Tang. “Tracing ‘productive interactions’ to identify social impacts: An example from the social sciences.” Research Evaluation 20 (2011): 219–26. [Google Scholar]
- Paul Benneworth. “Tracing how arts and humanities research translates, circulates and consolidates in society: How have scholars been reacting to diverse impact and public value agendas? ” Arts and Humanities in Higher Education 14 (2015): 45–60. [Google Scholar]
- Helen Small. The Value of the Humanities. Oxford: Oxford University Press, 2013. [Google Scholar]
- Dave O’Brien. “Cultural value, measurement and policy making.” Arts and Humanities in Higher Education 14 (2015): 79–94. [Google Scholar]
- Robert Costanza, Brendan Fisher, Saleem Ali, Caroline Beer, Lynne Bond, Roelof Boumans, Nicolas L. Danigelis, Jennifer Dickinson, Carolyn Elliott, Joshua Farley, and et al. “Quality of life: An approach integrating opportunities, human needs, and subjective well-being.” Ecological Economics 61 (2007): 267–76. [Google Scholar]
- Heide Hackmann, Susanne C. Moser, and Asuncion Lera St. Clair. “The social heart of global environmental change.” Nature Climate Change 4 (2014): 653–55. [Google Scholar]
- Joanne Kauffman. “Promoting integration and cooperation for sustainability views from the symposium held at UNESCO headquarters September 19, 2013.” Sustainability Science 9 (2014): 419–30. [Google Scholar]
- Gisli Palsson, Bronislaw Szerszynski, Sverker Sörlin, John Marks, Bernard Avril, Carole Crumley, Heide Hackmann, Poul Holm, John Ingram, Alan Kirman, and et al. “Reconceptualizing the ‘Anthropos’ in the Anthropocene: Integrating the social sciences and humanities in global environmental change research.” Environmental Science & Policy 28 (2013): 3–13. [Google Scholar]
- Murray A. Rudd. “How research-prioritization exercises affect conservation policy.” Conservation Biology 25 (2011): 860–66. [Google Scholar] [PubMed]
- David Victor. “Climate change: Embed the social sciences in climate policy.” Nature 520 (2015): 27–29. [Google Scholar] [PubMed]
- Eleonora Belfiore. “‘Impact’, ‘value’ and ‘bad economics’: Making sense of the problem of value in the arts and humanities.” Arts and Humanities in Higher Education 14 (2015): 95–110. [Google Scholar]
- Alan Brinkley. “Landscape of Humanities Research and Funding.” 2009. Available online: http://archive201406.humanitiesindicators.org/essays/brinkley.pdf (accessed on 27 April 2015).
- Claire A. Donovan. “Government Policy and the Direction of Social Science Research.” Ph.D. Dissertation, University of Sussex, Sussex, UK, November 2001. [Google Scholar]
- Bruce Gardner, and William Lesser. “International agricultural research as a global public good.” American Journal of Agricultural Economics 85 (2003): 692–97. [Google Scholar]
- Jonathan Grant, Philipp-Bastian Brutscher, Susan E. Kirk, Linda Butler, and Steven Wooding. Capturing Research Impacts: A Review of International Practice. Cambridge: RAND Europe, 2010. [Google Scholar]
- Shyama Kuruvilla, Nicholas Mays, Andrew Pleasant, and Gill Walt. “Describing the impact of health research: A research impact framework.” BMC Health Services Research 6 (2006): 134. [Google Scholar] [PubMed]
- Council of Canadian Academies. The State of Science and Technology in Canada. Ottawa: Council of Canadian Academies, 2006. [Google Scholar]
- Council for the Humanities, Arts and Social Sciences (CHASS). Measures of Quality and Impact of Publicly Funded Research in the Humanities, Arts and Social Sciences. Canberra: CHASS, 2005. [Google Scholar]
- Einar Bowitz, and Karin Ibenholt. “Economic impacts of cultural heritage—Research and perspectives.” Journal of Cultural Heritage 10 (2009): 1–8. [Google Scholar] [CrossRef]
- Michelle Reeves. Measuring the Economic and Social Impact of the Arts: A Review. London: Arts Council of England, 2002. [Google Scholar]
- Ståle Navrud, and Richard C. Ready. Valuing Cultural Heritage: Applying Environmental Valuation Techniques to Historic Buildings, Monuments and Artefacts. Cheltenham: Edward Elgar, 2002. [Google Scholar]
- Douglas S. Noonan. “Contingent valuation and cultural resources: A meta-analytic review of the literature.” Journal of Cultural Economics 27 (2003): 159–76. [Google Scholar] [CrossRef]
- Murray A. Rudd. “An exploratory analysis of societal preferences for research-driven quality of life improvements in Canada.” Social Indicators Research 101 (2011): 127–53. [Google Scholar] [CrossRef]
- Tran H. Tuan, and Ståle Navrud. “Capturing the benefits of preserving cultural heritage.” Journal of Cultural Heritage 9 (2008): 326–37. [Google Scholar] [CrossRef]
- Wiktor L. Adamowicz. “What’s it worth? An examination of historical trends and future directions in environmental valuation.” The Australian Journal of Agricultural and Resource Economics 48 (2004): 419–43. [Google Scholar] [CrossRef]
- Mark Sagoff. “Should preferences count? ” Land Economics 70 (1994): 127–44. [Google Scholar] [CrossRef]
- John Dewey. Logic: The Theory of Inquiry. New York: Holt, 1938. [Google Scholar]
- Mark Sagoff. “The quantification and valuation of ecosystem services.” Ecological Economics 70 (2011): 497–502. [Google Scholar] [CrossRef]
- Ricky N. Lawton, and Murray A. Rudd. “Strange bedfellows: Ecosystem services, conservation science, and central government in the United Kingdom.” Resources 2 (2013): 114–27. [Google Scholar] [CrossRef]
- John Spoehr, Kate Barnett, Simon Molloy, Sanjugta V. Dev, and Ann-Louise Hordacre. Connecting Ideas: Collaborative Innovation for a Complex World. Adelaide: Australian Institute for Social Research, University of Adelaide, 2010. [Google Scholar]
- Mark Banks, and Justin O’Connor. “After the creative industries.” International Journal of Cultural Policy 15 (2009): 365–73. [Google Scholar] [CrossRef]
- Joseph L. Koerner, and Lisbet Rausing. “Value.” In Critical Terms for Art History, 2nd ed. Edited by Robert S. Nelson and Richard Shiff. Chicago: University of Chicago Press, 1996, pp. 419–34. [Google Scholar]
- Jonathan Bate. The Public Value of the Humanities. London: Bloomsbury Academic, 2011. [Google Scholar]
- Arts Council England (ACE). Cultural Capital: A Manifesto for the Future. London: ACE, 2010. [Google Scholar]
- Alan S. Brown, Jennifer L. Novak, and Amy Kitchener. “Cultural Engagement in California’s Inland Regions.” 2008. Available online: http://www.giarts.org/sites/default/files/Cultural-Engagement-in-Californias-Inland-Regions.pdf (accessed on 27 April 2015).
- Kate Clark, and Gareth Maeer. “The cultural value of heritage: Evidence from the Heritage Lottery Fund.” Cultural Trends 17 (2008): 23–56. [Google Scholar] [CrossRef]
- Seoyong Kim, and Hyesun Kim. “Does cultural capital matter? Cultural divide and quality of life.” Social Indicators Research 93 (2009): 295–313. [Google Scholar] [CrossRef]
- Jane Macnaughton, Mike White, and Rosie Stacy. “Researching the benefits of arts in health.” Health Education 105 (2005): 332–39. [Google Scholar] [CrossRef]
- Jude Ortiz, and Gayle Broad Culture. Culture, Creativity, and the Arts: Achieving Community Resilience and Sustainability through the Arts in Sault Ste. Marie. Saskatoon: Centre for the Study of Co-Operatives, University of Saskatchewan, 2009. [Google Scholar]
- Susan Galloway. “Cultural participation and individual quality of life: A review of research findings.” Applied Research in Quality of Life 1 (2006): 323–42. [Google Scholar] [CrossRef]
- David Throsby. “Determining the value of cultural goods: How much (or how little) does contingent valuation tell us? ” Journal of Cultural Economics 27 (2003): 275–85. [Google Scholar] [CrossRef]
- Andy Choi, Franco Papandrea, and Jeff Bennett. “Assessing cultural values: Developing an attitudinal scale.” Journal of Cultural Economics 31 (2007): 311–35. [Google Scholar] [CrossRef]
- Paul C. Stern. “Toward a coherent theory of environmentally significant behavior.” Journal of Social Issues 56 (2000): 407–24. [Google Scholar] [CrossRef]
- Riley E. Dunlap, Kent D. van Liere, Angela G. Mertig, and Robert E. Jones. “Measuring endorsement of the New Ecological Paradigm: A revised NEP scale.” Journal of Social Issues 56 (2000): 425–42. [Google Scholar] [CrossRef]
- Paul C. Stern, Thomas Dietz, and Gregory A. Guagnano. “A brief inventory of values.” Educational and Psychological Measurement 58 (1998): 984–1001. [Google Scholar] [CrossRef]
- Shalom H. Schwartz. “Are there universal aspects in the structure and contents of human values? ” Journal of Social Issues 50 (1994): 19–45. [Google Scholar] [CrossRef]
- Shalom H. Schwartz. “An overview of the Schwartz theory of basic values.” Online Readings in Psychology and Culture, 2012. [Google Scholar] [CrossRef]
- Sao-Wen Cheng. “Cultural goods creation, cultural capital formation, provision of cultural services and cultural atmosphere accumulation.” Journal of Cultural Economics 30 (2006): 263–86. [Google Scholar] [CrossRef]
- Claire A. Donovan. “The Australian Research Quality Framework: A live experiment in capturing the social, economic, environmental, and cultural returns of publicly funded research.” New Directions for Evaluation 2008 (2008): 47–60. [Google Scholar] [CrossRef]
- Jay Magidson, and Jeroen K. Vermunt. “Latent class models.” In The Sage Handbook of Quantitative Methodology for the Social Sciences. Edited by David Kaplan. Thousand Oaks: Sage Publications, 2004, pp. 175–98. [Google Scholar]
- Jeroen K. Vermunt, and Jay Magidson. “Latent class cluster analysis.” In Applied Latent Class Analysis. Edited by Jacques A. Hagenaars and Allan L. McCutcheon. Cambridge: Cambridge University Press, 2002, pp. 89–106. [Google Scholar]
- Jacques A. Hagenaars, and Allan L. McCutcheon. Applied Latent Class Analysis. Cambridge: Cambridge University Press, 2002. [Google Scholar]
- Juan Pulido-Fernández, and Marcelino Sánchez-Rivero. “Attitudes of the cultural tourist: A latent segmentation approach.” Journal of Cultural Economics 34 (2010): 111–29. [Google Scholar] [CrossRef]
- Jeroen K. Vermunt, and Jay Magidson. Technical Guide for Latent GOLD 4.0: Basic and Advanced. Belmont: Statistical Innovations Inc., 2005. [Google Scholar]
- Nissan Levin, and Jacob Zahavi. “Predictive modeling using segmentation.” Journal of Interactive Marketing 15 (2001): 2–22. [Google Scholar] [CrossRef]
- Gordon V. Kass. “An exploratory technique for investigating large quantities of categorical data.” Applied Statistics 29 (1980): 119–27. [Google Scholar] [CrossRef]
- Jay Magidson, and Jeroen K. Vermunt. “An extension of the CHAID tree-based segmentation algorithm to multiple dependent variables.” In Classification: The Ubiquitous Challenge. Edited by Claus Weihs and Wolfgang Gaul. Heidelberg: Springer Heidelberg, 2005, pp. 176–83. [Google Scholar]
- Cathy H. C. Hsu, and Soo K. Kang. “CHAID-based segmentation: International visitors’ trip characteristics and perceptions.” Journal of Travel Research 46 (2007): 207–16. [Google Scholar] [CrossRef]
- Jay Magidson. SI-CHAID 4.0 User’s Guide. Belmont: Statistical Innovations Inc., 2005. [Google Scholar]
- Shalom H. Schwartz. “Rethinking the concept and measurement of societal culture in light of empirical findings.” Journal of Cross-Cultural Psychology 45 (2014): 5–13. [Google Scholar] [CrossRef]
- Elinor Ostrom. Understanding Institutional Diversity. Princeton: Princeton University Press, 2005. [Google Scholar]
- Richard Louv. Last Child in the Woods: Saving Our Children from Nature-Deficit Disorder. Chapel Hill: Algonquin, 2005. [Google Scholar]
- Roger Walsh. “Lifestyle and mental health.” American Psychologist 66 (2011): 579–92. [Google Scholar] [CrossRef] [PubMed]
- Nancy M. Wells, and Kristi S. Lekies. “Nature and the life course: Pathways from childhood nature experiences to adult environmentalism.” Children, Youth and Environments 16 (2006): 1–24. [Google Scholar]
© 2015 by the author; licensee MDPI, Basel, Switzerland. This article is an open access article distributed under the terms and conditions of the Creative Commons Attribution license (http://creativecommons.org/licenses/by/4.0/).
Share and Cite
Rudd, M.A. Awareness of Humanities, Arts and Social Science (HASS) Research Is Related to Patterns of Citizens’ Community and Cultural Engagement. Soc. Sci. 2015, 4, 313-338. https://doi.org/10.3390/socsci4020313
Rudd MA. Awareness of Humanities, Arts and Social Science (HASS) Research Is Related to Patterns of Citizens’ Community and Cultural Engagement. Social Sciences. 2015; 4(2):313-338. https://doi.org/10.3390/socsci4020313
Chicago/Turabian StyleRudd, Murray A. 2015. "Awareness of Humanities, Arts and Social Science (HASS) Research Is Related to Patterns of Citizens’ Community and Cultural Engagement" Social Sciences 4, no. 2: 313-338. https://doi.org/10.3390/socsci4020313
APA StyleRudd, M. A. (2015). Awareness of Humanities, Arts and Social Science (HASS) Research Is Related to Patterns of Citizens’ Community and Cultural Engagement. Social Sciences, 4(2), 313-338. https://doi.org/10.3390/socsci4020313