


Economic Development and Marriage Stability: Evidence for a Concave Relationship Between per Capita Income and Divorce Rate


Abstract
1. Introduction
The Current Literature
2. Materials and Methods
2.1. Data Sources
2.2. Data Analysis
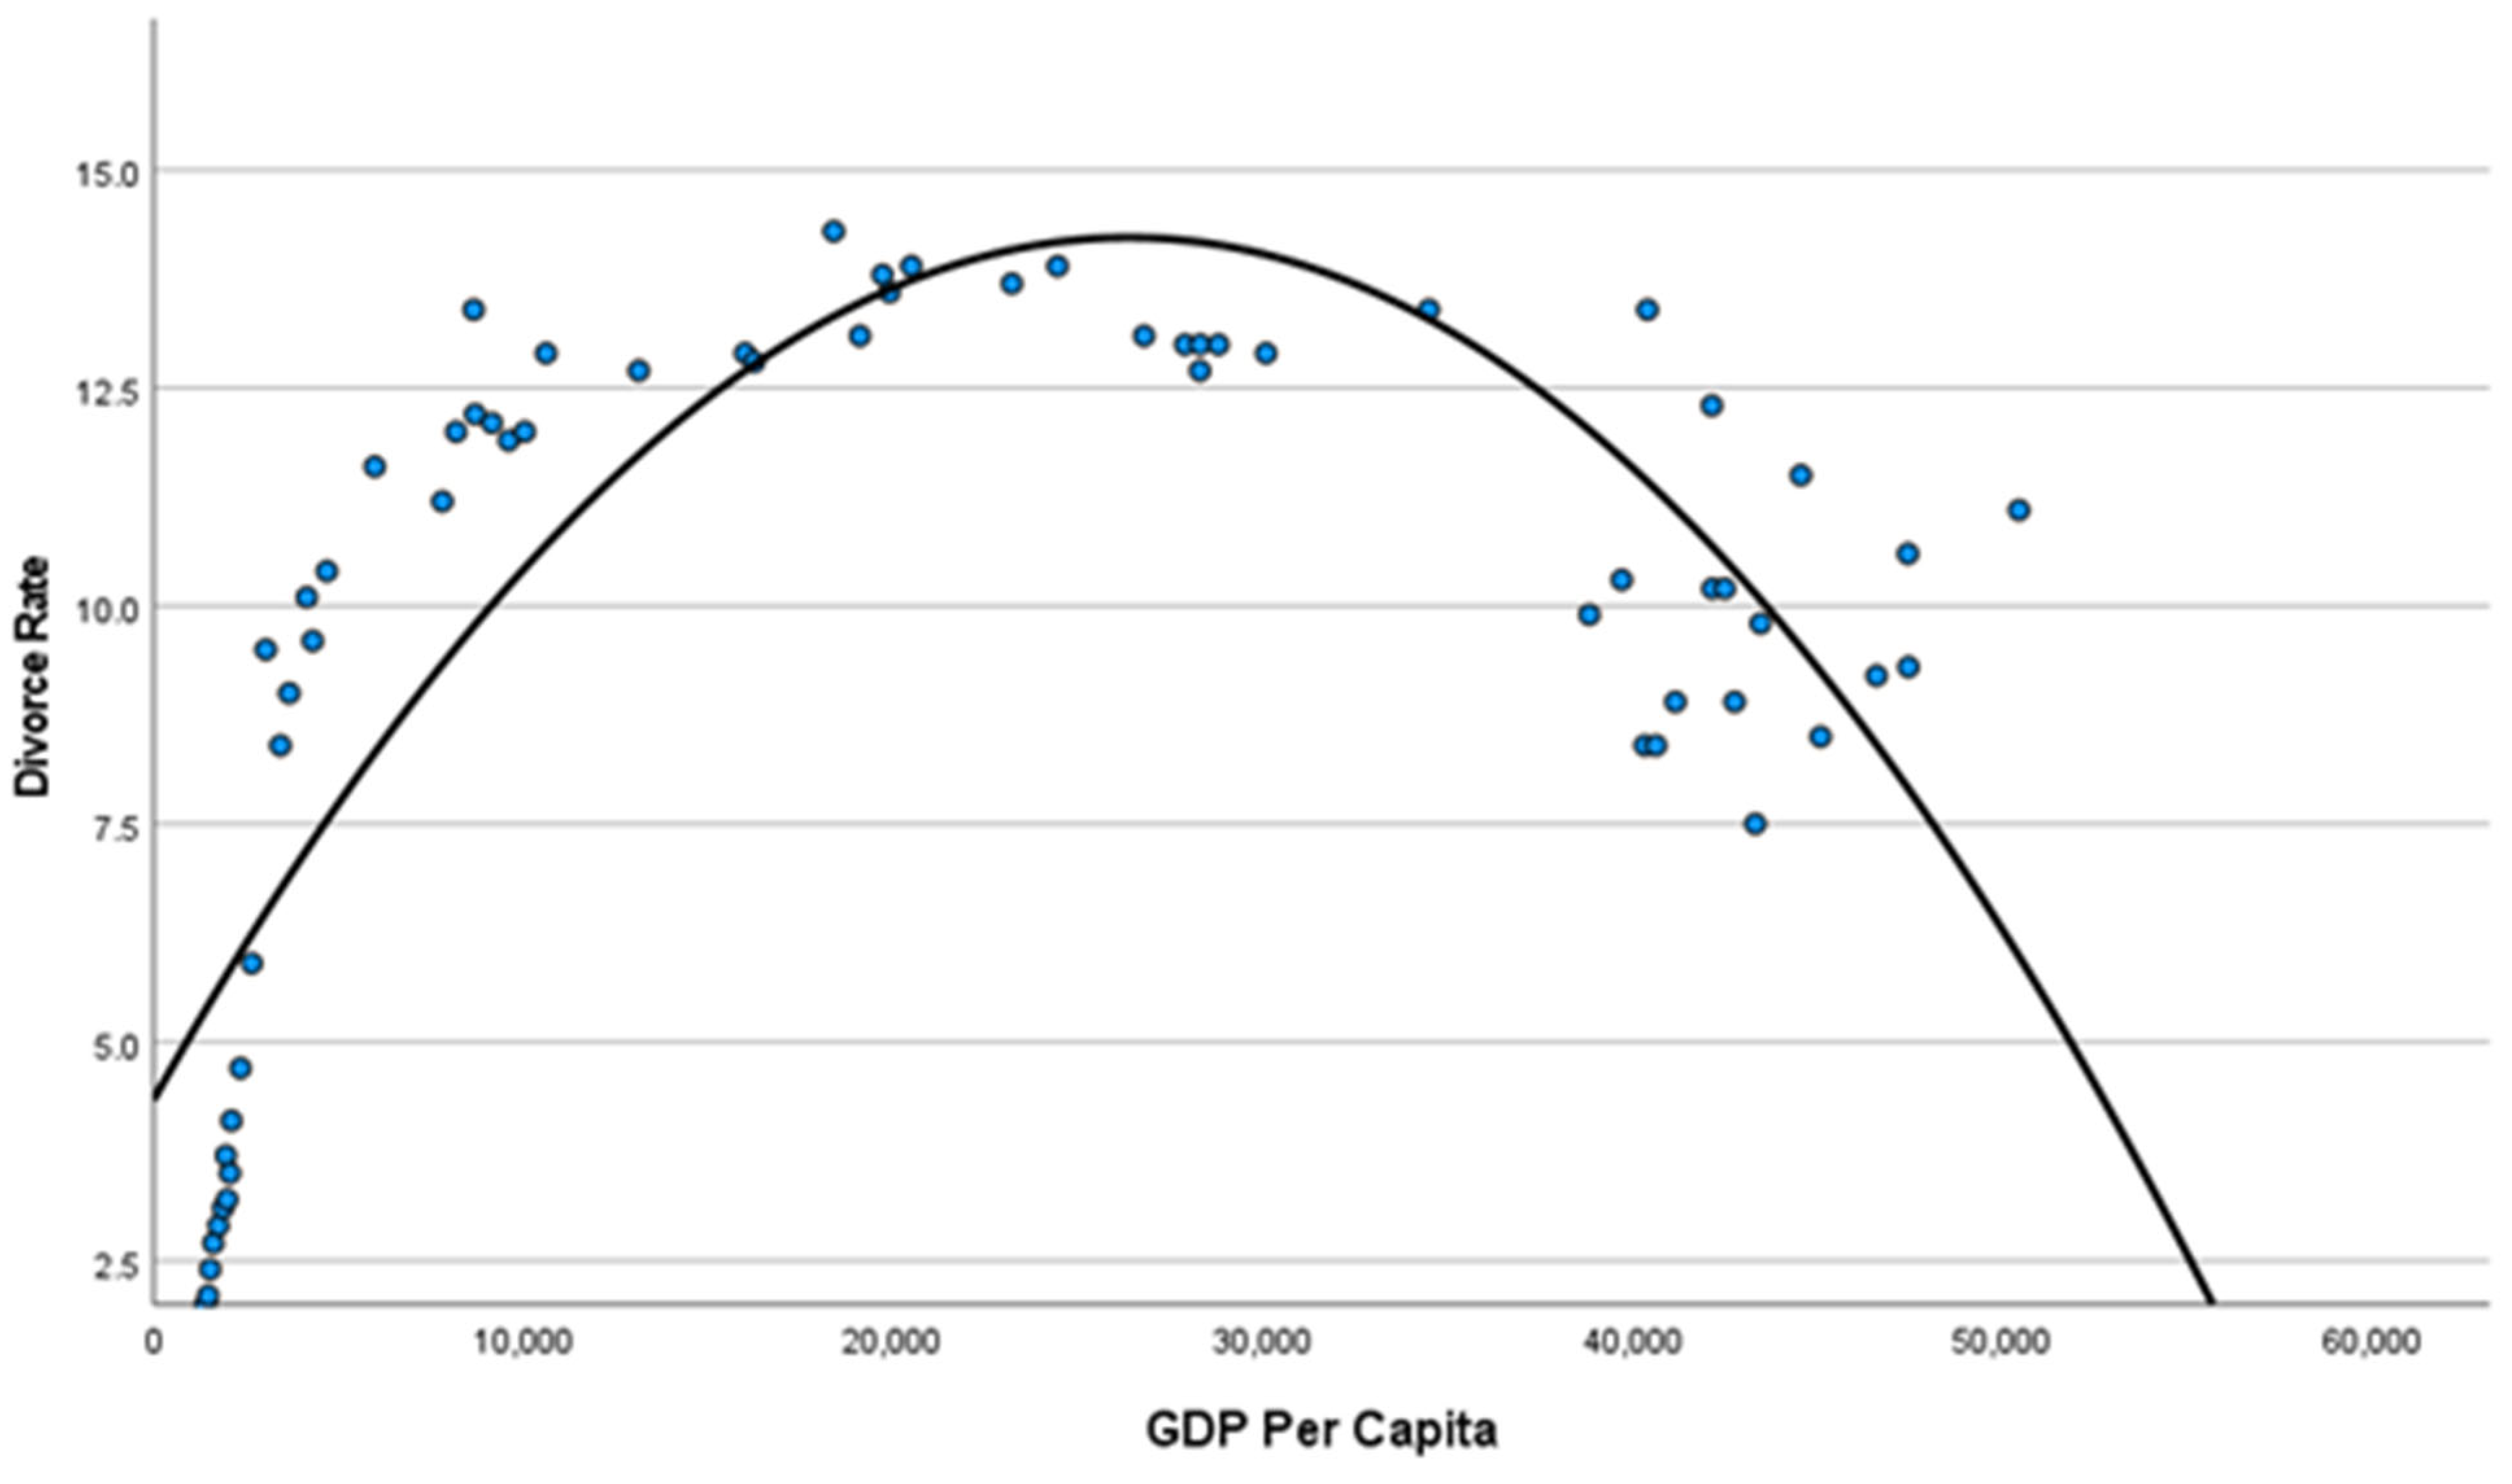
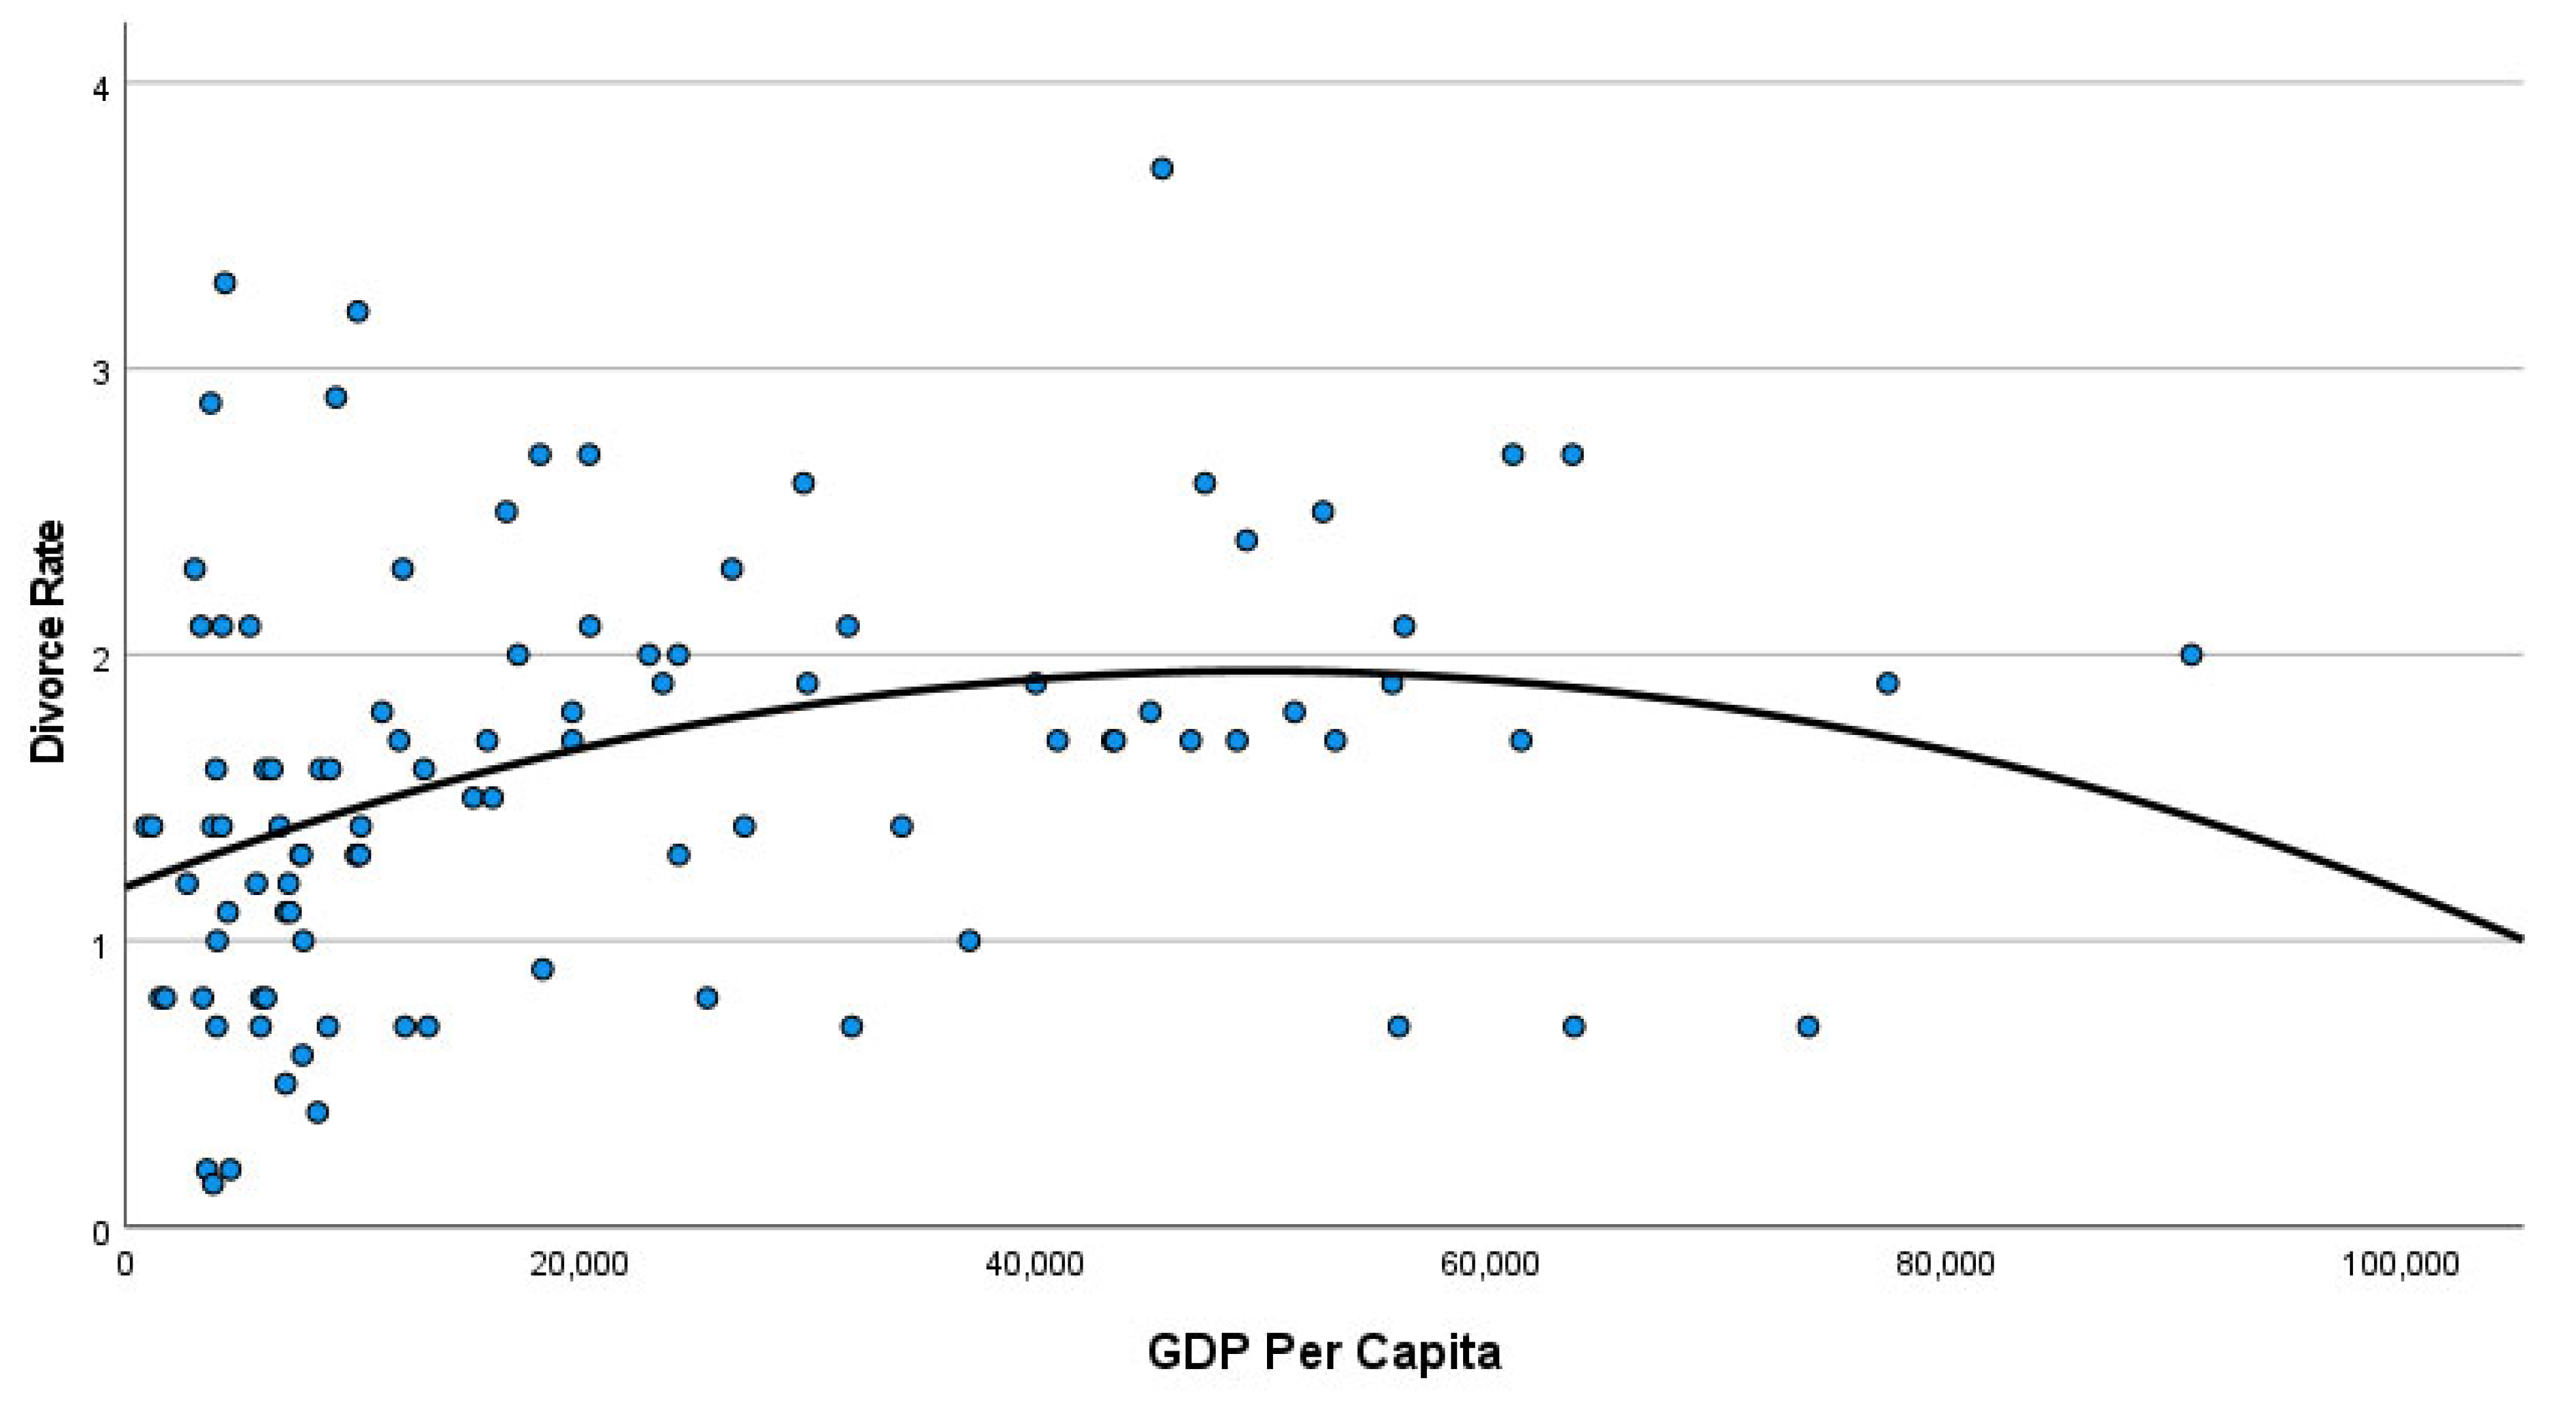
3. Results
4. Discussion
Limitations
5. Conclusions
Funding
Institutional Review Board Statement
Informed Consent Statement
Data Availability Statement
Conflicts of Interest
Appendix A
| UK | USA | ||||
| Years | Divorce Rate | GDP per Capita ($) | Number of Divorces | Number of Marriages | GDP per Capita ($) |
| 1960 | 2.00 | 1397.59 | 393,000 | 1,523,000 | 3007.12 |
| 1961 | 2.10 | 1472.39 | 414,000 | 1,548,000 | 3066.56 |
| 1962 | 2.40 | 1525.78 | 413,000 | 1,577,000 | 3243.84 |
| 1963 | 2.70 | 1613.46 | 428,000 | 1,654,000 | 3374.52 |
| 1964 | 2.90 | 1748.29 | 450,000 | 1,725,000 | 3573.94 |
| 1965 | 3.10 | 1873.57 | 479,000 | 1,800,000 | 3827.53 |
| 1966 | 3.20 | 1986.75 | 499,000 | 1,857,000 | 4146.32 |
| 1967 | 3.50 | 2058.78 | 523,000 | 1,927,000 | 4336.43 |
| 1968 | 3.70 | 1951.76 | 584,000 | 2,069,000 | 4695.92 |
| 1969 | 4.10 | 2100.67 | 639,000 | 2,145,000 | 5032.14 |
| 1970 | 4.70 | 2347.73 | 708,000 | 2,158,802 | 5234.30 |
| 1971 | 5.90 | 2649.67 | 773,000 | 2,190,481 | 5609.38 |
| 1972 | 9.50 | 3030.50 | 845,000 | 2,282,154 | 6094.02 |
| 1973 | 8.40 | 3426.52 | 915,000 | 2,284,108 | 6726.36 |
| 1974 | 9.00 | 3666.24 | 977,000 | 2,229,667 | 7225.69 |
| 1975 | 9.60 | 4299.35 | 1,036,000 | 2,152,662 | 7801.46 |
| 1976 | 10.10 | 4138.09 | 1,083,000 | 2,164,807 | 8592.25 |
| 1977 | 10.40 | 4681.67 | 1,090,000 | 2,178,367 | 9452.58 |
| 1978 | 11.60 | 5976.89 | 1,130,000 | 2,282,272 | 10,564.95 |
| 1979 | 11.20 | 7805.07 | 1,170,000 | 2,359,000 | 11,674.18 |
| 1980 | 12.00 | 10,032.18 | 1,182,000 | 2,413,000 | 12,574.79 |
| 1981 | 11.90 | 9598.51 | 1,219,000 | 2,438,000 | 13,976.11 |
| 1982 | 12.10 | 9145.33 | 1,180,000 | 2,495,000 | 14,433.79 |
| 1983 | 12.20 | 8691.19 | 1,179,000 | 2,444,000 | 15,543.89 |
| 1984 | 12.00 | 8179.12 | 1,155,000 | 2,487,000 | 17,121.23 |
| 1985 | 13.40 | 8651.71 | 1,187,000 | 2,425,000 | 18,236.83 |
| 1986 | 12.90 | 10,611.15 | 1,159,000 | 2,400,000 | 19,071.23 |
| 1987 | 12.70 | 13,118.02 | 1,157,000 | 2,421,000 | 20,038.94 |
| 1988 | 12.90 | 15,988.02 | 1,183,000 | 2,389,000 | 21,417.01 |
| 1989 | 12.80 | 16,240.01 | 1,163,000 | 2,404,000 | 22,857.15 |
| 1990 | 13.10 | 19,096.24 | 1,175,000 | 2,448,000 | 23,888.60 |
| 1991 | 13.60 | 19,900.19 | 1,187,000 | 2,371,000 | 24,342.26 |
| 1992 | 13.90 | 20,488.10 | 1,215,000 | 2,362,000 | 25,418.99 |
| 1993 | 14.30 | 18,390.22 | 1,199,000 | 2,351,000 | 26,387.29 |
| 1994 | 13.80 | 19,708.44 | 1,191,000 | 2,362,000 | 27,694.85 |
| 1995 | 13.70 | 23,203.63 | 1,169,000 | 2,336,000 | 28,690.88 |
| 1996 | 13.90 | 24,441.92 | 1,163,000 | 2,344,000 | 29,967.71 |
| 1997 | 13.10 | 26,779.78 | 1,150,000 | 2,384,000 | 31,459.14 |
| 1998 | 13.00 | 28,296.76 | 1,175,362 | 2,244,000 | 32,853.68 |
| 1999 | 13.00 | 28,788.97 | 1,145,245 | 2,358,000 | 34,515.39 |
| 2000 | 12.70 | 28,289.65 | 944,000 | 2,315,000 | 36,329.96 |
| 2001 | 13.00 | 27,888.61 | 940,000 | 2,326,000 | 37,133.62 |
| 2002 | 12.90 | 30,078.61 | 955,000 | 2,290,000 | 37,997.76 |
| 2003 | 13.40 | 34,480.94 | 927,000 | 2,245,000 | 39,490.27 |
| 2004 | 13.40 | 40,392.26 | 879,000 | 2,279,000 | 41,724.63 |
| 2005 | 12.30 | 42,131.83 | 847,000 | 2,249,000 | 44,123.41 |
| 2006 | 11.50 | 44,537.71 | 872,000 | 2,193,000 | 46,302.00 |
| 2007 | 11.10 | 50,438.23 | 856,000 | 2,197,000 | 48,050.22 |
| 2008 | 10.60 | 47,432.88 | 844,000 | 2,157,000 | 48,570.05 |
| 2009 | 9.90 | 38,820.01 | 840,000 | 2,080,000 | 47,194.94 |
| 2010 | 10.30 | 39,693.19 | 872,000 | 2,096,000 | 48,650.64 |
| 2011 | 10.20 | 42,150.70 | 877,000 | 2,118,000 | 50,065.97 |
| 2012 | 10.20 | 42,485.59 | 851,000 | 2,131,000 | 51,784.42 |
| 2013 | 9.80 | 43,449.09 | 832,157 | 2,081,301 | 53,291.13 |
| 2014 | 9.30 | 47,447.59 | 813,862 | 2,140,272 | 55,123.85 |
| 2015 | 8.50 | 45,071.07 | 800,909 | 2,221,579 | 56,762.73 |
| 2016 | 8.90 | 41,146.08 | 776,288 | 2,251,411 | 57,866.74 |
| 2017 | 8.40 | 40,622.69 | 787,251 | 2,236,496 | 59,907.75 |
| 2018 | 7.50 | 43,306.31 | 782,038 | 2,132,853 | 62,823.31 |
| 2019 | 8.90 | 42,747.08 | 746,971 | 2,015,603 | 65,120.39 |
| 2020 | 8.40 | 40,318.42 | 630,505 | 1,676,911 | 63,528.63 |
| 2021 | 9.20 | 46,585.90 | 689,308 | 1,985,072 | 70,219.47 |
Appendix B
| Countries | Year | Divorce Rate | GDP per Capita ($) |
| Albania | 2019 | 2.10 | 5463 |
| Algeria | 2013 | 1.60 | 6132 |
| Armenia | 2020 | 1.10 | 4505 |
| Australia | 2019 | 1.90 | 55,617 |
| Austria | 2020 | 1.70 | 48,809 |
| Azerbaijan | 2020 | 1.40 | 4229 |
| Bahamas | 2007 | 1.00 | 37,055 |
| Belarus | 2020 | 3.70 | 6542 |
| Belgium | 2020 | 3.70 | 45,517 |
| Bermuda | 2019 | 1.90 | 117,597 |
| Bosnia and Herzegovina | 2019 | 0.80 | 6169 |
| Brazil | 2009 | 1.40 | 10,339 |
| Brunei | 2020 | 1.40 | 27,179 |
| Bulgaria | 2020 | 1.30 | 10,153 |
| Canada | 2008 | 2.10 | 56,151 |
| Chile | 2009 | 0.70 | 12,283 |
| China | 2018 | 3.20 | 10,209 |
| Colombia | 2007 | 0.70 | 5944 |
| Costa Rica | 2020 | 2.30 | 12,179 |
| Croatia | 2019 | 1.50 | 15,272 |
| Cuba | 2019 | 2.90 | 9252 |
| Cyprus | 2019 | 2.60 | 29,779 |
| Czech Republic | 2020 | 2.00 | 22,992 |
| Denmark | 2020 | 2.70 | 60,915 |
| Dominica | 2017 | 1.00 | 7822 |
| Dominican Republic | 2020 | 1.20 | 7167 |
| Ecuador | 2006 | 1.10 | 7240 |
| Egypt | 2019 | 2.30 | 3054 |
| El Salvador | 2006 | 0.80 | 3402 |
| Estonia | 2020 | 1.90 | 23,595 |
| Finland | 2019 | 2.40 | 49,227 |
| France | 2016 | 1.90 | 39,967 |
| Georgia | 2020 | 2.10 | 4255 |
| Germany | 2020 | 1.70 | 46,772 |
| Greece | 2017 | 1.80 | 19,621 |
| Grenada | 2001 | 1.10 | 7045 |
| Guatemala | 2020 | 0.20 | 4609 |
| Hungary | 2020 | 1.50 | 16,125 |
| Iceland | 2010 | 1.80 | 51,326 |
| Iran | 2019 | 2.10 | 3316 |
| Ireland | 2017 | 0.70 | 73,880 |
| Israel | 2019 | 1.80 | 44,999 |
| Italy | 2019 | 1.40 | 34,087 |
| Jamaica | 2018 | 1.20 | 5766 |
| Japan | 2019 | 1.70 | 40,932 |
| Jordan | 2020 | 1.60 | 3987 |
| Kazakhstan | 2021 | 4.60 | 9910 |
| Kuwait | 2020 | 1.30 | 24,297 |
| Kyrgyzstan | 2020 | 1.40 | 1182 |
| Latvia | 2020 | 2.70 | 18,207 |
| Lebanon | 2007 | 1.60 | 6443 |
| Libya | 2008 | 2.50 | 16,734 |
| Liechtenstein | 2020 | 2.60 | 165,284 |
| Lithuania | 2020 | 2.70 | 20,363 |
| Luxembourg | 2020 | 2.30 | 117,370 |
| Malaysia | 2019 | 1.80 | 11,269 |
| Maldives | 2020 | 5.52 | 7282 |
| Malta | 2019 | 0.70 | 31,894 |
| Mauritius | 2020 | 1.60 | 9005 |
| Mexico | 2019 | 1.30 | 10,300 |
| Moldova | 2020 | 3.30 | 4376 |
| Monaco | 2020 | 1.70 | 182,537 |
| Mongolia | 2020 | 1.00 | 4041 |
| Montenegro | 2020 | 1.30 | 7677 |
| Netherlands | 2019 | 1.70 | 53,123 |
| New Zealand | 2019 | 1.70 | 43,323 |
| Nicaragua | 2005 | 0.80 | 1535 |
| North Macedonia | 2020 | 0.80 | 5965 |
| Norway | 2019 | 1.90 | 77,371 |
| Panama | 2020 | 0.70 | 13,293 |
| Peru | 2019 | 0.50 | 7041 |
| Poland | 2019 | 1.70 | 15,894 |
| Portugal | 2018 | 2.00 | 24,279 |
| Qatar | 2019 | 0.70 | 63,600 |
| Romania | 2019 | 1.60 | 13,117 |
| Russia | 2020 | 3.90 | 10,194 |
| Saint Lucia | 2004 | 0.70 | 8897 |
| Saint Vincent and the Grenadines | 2017 | 0.40 | 8443 |
| San Marino | 2017 | 2.60 | 47,394 |
| Saudi Arabia | 2020 | 2.10 | 20,398 |
| Serbia | 2020 | 1.30 | 7733 |
| Seychelles | 2020 | 1.70 | 12,020 |
| Singapore | 2020 | 1.70 | 61,274 |
| Slovakia | 2019 | 1.70 | 19,623 |
| Slovenia | 2020 | 0.80 | 25,545 |
| South Africa | 2009 | 0.60 | 7774 |
| South Korea | 2020 | 2.10 | 31,721 |
| Spain | 2019 | 1.90 | 29,946 |
| Sri Lanka | 2020 | 0.15 | 3852 |
| Suriname | 2019 | 1.40 | 6772 |
| Sweden | 2019 | 2.50 | 52,579 |
| Switzerland | 2016 | 2.00 | 90,704 |
| Syria | 2006 | 1.30 | 10,156 |
| Taiwan | 2018 | 2.30 | 26,631 |
| Tajikistan | 2019 | 1.40 | 900 |
| Thailand | 2005 | 1.40 | 3811 |
| Tonga | 2003 | 1.20 | 2725 |
| Trinidad and Tobago | 2016 | 2.00 | 17,245 |
| Turkey | 2020 | 1.60 | 8561 |
| Ukraine | 2020 | 2.88 | 3751 |
| United Arab Emirates | 2005 | 0.70 | 55,900 |
| United Kingdom | 2017 | 1.70 | 43,446 |
| United States | 2020 | 2.70 | 63,528 |
| Uruguay | 2019 | 0.90 | 18,321 |
| Uzbekistan | 2020 | 0.80 | 1759 |
| Venezuela | 2017 | 0.70 | 4019 |
| Vietnam | 2020 | 0.20 | 3586 |
References
- Alola, Andrew A., Abdulgaffar O. Arikewuyo, Seyi S. Akadiri, and Mary I. Alola. 2020. The role of income and gender unemployment in divorce rate among the OECD countries. Journal of Labor and Society 23: 75–86. [Google Scholar] [CrossRef]
- Apostolou, Menelaos. 2022. Why people keep an intimate relationship: Investigating ultimate and proximate reasons. Human Nature 33: 62–81. [Google Scholar] [CrossRef]
- Apostolou, Menelaos, Despoina Keramari, Antonios Kagialis, and Mark Sullman. 2021. Why people make friends: The nature of friendship. Personal Relationships 28: 4–18. [Google Scholar] [CrossRef]
- Apostolou, Menelaos, Mark Sullman, Béla Birkás, Agata Błachnio, Ekaterina Bushina, Fran Calvo, William Costello, Tanja Dujlovic, Tetiana Hill, Timo Juhani Lajunen, and et al. 2023a. Mating performance and singlehood across 14 nations. Evolutionary Psychology 21: 14747049221150169. [Google Scholar] [CrossRef] [PubMed]
- Apostolou, Menelaos, Mark Sullman, Béla Birkás, Agata Błachnio, Ekaterina Bushina, Fran Calvo, William Costello, Tanja Dujlovic, Tetiana Hill, Timo Juhani Lajunen, and et al. 2023b. What are romantic relationships good for? An explorative analysis of the perceived benefits of being in a relationship. Evolutionary Psychology 21: 14747049231210245. [Google Scholar] [CrossRef] [PubMed]
- Beck, Ulrich, and Elisabeth Beck-Gernsheim. 2002. Individualization: Institutionalized Individualism and Its Social and Political Consequences. New York: SAGE. [Google Scholar]
- Becker, Gary S. 1981. A Treatise on the Family. Cambridge: Cambridge University Press. [Google Scholar]
- Cacioppo, John T., Stephanie Cacioppo, and Dorret I. Boomsma. 2014. Evolutionary mechanisms for loneliness. Cognition & Emotion 28: 3–21. [Google Scholar] [CrossRef]
- Clark, Roger. 1990. Economic dependency and divorce: Implications for the private sphere. International Journal of Sociology of the Family 20: 47–65. [Google Scholar]
- Cohen, Philip N. 2019. The coming divorce decline. Socius 5. [Google Scholar] [CrossRef]
- Cole, Charles L., and Edward A. Powers. 1973. Industrialization and divorce: A cross-cultural analysis. International Journal of Sociology of the Family 3: 42–47. [Google Scholar]
- Cooke, Lynn Prince, Jani Erola, Marie Evertsson, Michael Gähler, Juho Härkönen, Belinda Hewitt, Marika Jalovaara, Man-Yee Kan, Torkild Hovde Lyngstad, Letizia Mencarini, and et al. 2013. Labor and love: Wives’ employment and divorce risk in its socio-political context. Social Politics 20: 482–509. [Google Scholar] [CrossRef]
- Coontz, Stephanie. 2006. Marriage, a History: How Love Conquered Marriage. New York: Penguin. [Google Scholar]
- Elmi, Zahra, and Leyla Mohamadi. 2021. Employment and the nonlinear relationship of household income on divorce in Iran using the quasi-panel data logit model. The International Journal of Humanities 27: 44–57. [Google Scholar]
- Fallesen, Peter. 2021. Decline in rate of divorce and separation filings in denmark in 2020 compared with previous years. Socius 7: 23780231211009991. [Google Scholar] [CrossRef]
- Fisher, Helen. 2017. Anatomy of Love: A Natural History of Mating, Marriage, and Why We Stray. New York: Norton. [Google Scholar]
- González-Val, Rafael, and Miriam Marcén. 2017. Divorce and the business cycle: A cross-country analysis. Review of Economics of the Household 15: 879–904. [Google Scholar] [CrossRef]
- Goode, William. 1993. World Changes in Divorce Patterns. London: Yale University Press. [Google Scholar]
- Greenstein, Theodore N., and Shannon N. Davis. 2006. Cross-national variations in divorce: Effects of women’s power, prestige and dependence. Journal of Comparative Family Studies 37: 253–73. [Google Scholar]
- Hankins, Scott, Mark Hoekstra, and Paige Marta Skiba. 2011. The ticket to easy street? The financial consequences of winning the lottery. The Review of Economics and Statistics 93: 961–69. [Google Scholar] [CrossRef]
- Hill, Twyla J. 2015. Family Caregiving in Aging Populations. Cham: Springer. [Google Scholar]
- Huber, Joan, and Glenna Spitze. 1980. Considering divorce: An expansion of Becker’s theory of marital instability. American Journal of Sociology 86: 75–89. [Google Scholar] [CrossRef]
- Inglehart, Ronald, and Pippa Norris. 2003. Rising Tide: Gender Equality and Cultural Change Around the World. Cambridge: Cambridge University Press. [Google Scholar]
- Jeng, Wei-Shiuan, and Patrick C. McKenry. 1999. A comparative study of divorce in three Chinese societies: Taiwan, Singapore and Hong Kong. International Journal of Sociology of the Family 34: 143–61. [Google Scholar] [CrossRef]
- Killewald, Alexandra, Angela Lee, and Paula England. 2023. Wealth and Divorce. Demography 60: 147–71. [Google Scholar] [CrossRef]
- Klinenberg, Eric. 2012. Going Solo: The Extraordinary Rise and Surprising Appeal of Living Alone. London: Duckworth Overlook. [Google Scholar]
- Lesthaeghe, Ron, and Johan Surkyn. 1988. Cultural dynamics and economic theories of fertility change. Population and Development Review 14: 1–45. Available online: https://www.jstor.org/stable/1972499 (accessed on 22 October 2024). [CrossRef]
- Ortiz-Ospina, Esteban. 2019. The Rise of Living Alone: How One-Person Households Are Becoming Increasingly Common Around the World. Our World in Data. Available online: https://www.supremecourt.gov/opinions/URLs_Cited/OT2020/20-157/20-157-2.pdf (accessed on 22 October 2024).
- Raley, R. Kelly, and Megan M. Sweeney. 2020. Divorce, repartnering, and stepfamilies: A decade in review. Journal of Marriage and Family 82: 81–99. [Google Scholar] [CrossRef]
- Salini, Silvia, Andrea Cerioli, Fabrizio Laurini, and Marco Riani. 2015. Reliable robust regression diagnostics. International Statistical Review 84: 99–127. [Google Scholar] [CrossRef]
- Schneider, Daniel, and Orestes P. Hastings. 2015. Socioeconomic variation in the effect of economic conditions on marriage and non-marital fertility in the United States: Evidence from the great recession. Demography 52: 1893–915. [Google Scholar] [CrossRef]
- Schwartz, Christine R., and Pilar Gonalons-Pons. 2016. Trends in relative earnings and marital dissolution: Are Wives who outearn their husbands still more likely to divorce? The Russell Sage Foundation Journal of the Social Sciences: RSF 2: 218–36. [Google Scholar] [CrossRef]
- Wang, Cheng-Tong Lir, and Evan Schofer. 2018. Coming out of the Penumbras: World culture and cross-national variation in divorce rates. Social Forces 97: 675–704. [Google Scholar] [CrossRef]


| Sample | GDP per Capita | GDP per Capita Squared | |||
|---|---|---|---|---|---|
| Coefficient (Standardized) | p-Value | Coefficient (Standardized) | p-Value | Adjusted R-Squared | |
| UK | 6.99 | <0.001 | −6.53 | <0.001 | 0.92 |
| USA | 6.76 | <0.001 | −6.63 | <0.001 | 0.75 |
| Full sample (extreme values included) | 0.53 | 0.024 | −0.34 | 0.147 | 0.05 |
| Sample of 99 societies | 0.94 | 0.003 | −0.70 | 0.028 | 0.11 |
Disclaimer/Publisher’s Note: The statements, opinions and data contained in all publications are solely those of the individual author(s) and contributor(s) and not of MDPI and/or the editor(s). MDPI and/or the editor(s) disclaim responsibility for any injury to people or property resulting from any ideas, methods, instructions or products referred to in the content. |
© 2025 by the author. Licensee MDPI, Basel, Switzerland. This article is an open access article distributed under the terms and conditions of the Creative Commons Attribution (CC BY) license (https://creativecommons.org/licenses/by/4.0/).
Share and Cite
Apostolou, M. Economic Development and Marriage Stability: Evidence for a Concave Relationship Between per Capita Income and Divorce Rate. Soc. Sci. 2025, 14, 466. https://doi.org/10.3390/socsci14080466
Apostolou M. Economic Development and Marriage Stability: Evidence for a Concave Relationship Between per Capita Income and Divorce Rate. Social Sciences. 2025; 14(8):466. https://doi.org/10.3390/socsci14080466
Chicago/Turabian StyleApostolou, Menelaos. 2025. "Economic Development and Marriage Stability: Evidence for a Concave Relationship Between per Capita Income and Divorce Rate" Social Sciences 14, no. 8: 466. https://doi.org/10.3390/socsci14080466
APA StyleApostolou, M. (2025). Economic Development and Marriage Stability: Evidence for a Concave Relationship Between per Capita Income and Divorce Rate. Social Sciences, 14(8), 466. https://doi.org/10.3390/socsci14080466