1. Introduction
The recognition of transportation’s role in society has grown significantly, extending beyond its economic impact (
Rodrigue 2020) to its ability to enable people’s ability to participate in societal activities (
Tucho 2022). According to
Cepeda et al. (
2018), transport should be regarded as a right for every citizen despite their physical abilities or socio-economic status. Yet, mobility remains a challenge for many different transport users, especially amongst people with disability, as the distribution of transport resources is often characterised by inequality (
Rodrigue 2020;
Stafford and Tye 2023). Transport inequalities are associated with differences in economic opportunities and social interactions (
Rodrigue 2020). The ability of people with disability to access transport services has a significant impact on the individuals’ access to employment, education, and other economic opportunities (
Neven and Ectors 2023). Limited mobility among people with disability also impacts their ability to participate in social activities, engage with their communities, and access other essential services such as health and welfare (
Das Neves et al. 2023). One of the key challenges to this is in providing transport infrastructure and services which are equitable (
Rodrigue 2020;
Stafford and Tye 2023).
In South Africa, approximately 7.7% of the population live with some form of disability (
Statistics South Africa 2021). Although the South African government ratified the UN’s Convention on the Rights of Persons with Disabilities (CRPD) in 2007 (
Vincent and Chiwandire 2017), access to transport is not a recognised human right in South Africa and many other developing countries (
Cepeda et al. 2018;
Kett et al. 2020). While the
Constitution of the Republic of South Africa (
1996) addresses freedom of movement under section 21, it does not explicitly recognise transport as a human right. South Africa has enacted several pieces of legislation that mention people with disability and address various aspects related to disability; however, there is a lack of legal and policy frameworks specifically dedicated to ensuring accessible and inclusive transportation for people with disability (
Grobbelaar-du Plessis and Grobbler 2013). Notwithstanding the adoption of the CPRD, the Transport Summit on Universal Accessibility highlighted the continued and largely unresolved mobility challenges of people with disability and the necessity for comprehensive legislation to ensure universal access to transport (
Department of Transport 2024). Although the South African government has made some efforts to improve transport infrastructure and services, significant barriers persist for people with disability in accessing transportation in the country (
Lister and Dhunpath 2016). These transport barriers continue to hamper access to essential services such as education, employment, and social activities, and, in some cases, mobility is impossible amongst people with disability.
Understanding the service quality attributes which impact the mobility of people with disability is paramount for transport planners, the city, and transport providers to improve the provision of transport services. The City of Tshwane was selected as the most suitable site to conduct this study due to various socio-economic factors. The City of Tshwane is one the three largest metropolitan municipalities in South Africa in terms of population size. According to the Community Survey, the number of people living with some form of disability is increasing in the City of Tshwane (
Statistics South Africa 2018). Moreover, the City of Tshwane is experiencing rapid urbanisation and population growth (
Ndwandwe and Gumbo 2018;
Nkosi and Masuku 2016;
Statistics South Africa 2018). Very little research has specifically investigated the service quality barriers experienced by people with disability, especially in the City of Tshwane. In South Africa, most of the research on the mobility of people with disability has been conducted in the Western Cape and KwaZulu-Natal (
Morta-Andrews 2018;
Rivasplata and Le Roux 2018;
Lister and Dhunpath 2016).
Lister and Dhunpath (
2016) in KwaZulu-Natal focused on a specific mode of transport, while
Rivasplata and Le Roux (
2018) and
Morta-Andrews (
2018) in the Western Cape concentrated on a particular demographic subgroup; this study adopted a broader approach. This study examined the experiences of multiple groups of people with disability across all public modes of transport within the City of Tshwane. Many studies that have looked at the mobility of people with disability often considered service quality attributes as part of a broader study rather than as a distinct variable (
Bjerkan and Øvstedal 2020;
Øksenholt and Aarhaug 2018;
Iudici et al. 2017;
Sze and Christensen 2017). This, therefore, represents a gap in the current knowledge of transport for people with disability in a fast-developing urban environment in a developing economy.
This study specifically considered three different groups of people with disability; people with mobility, hearing and vision disability. The rationale behind the selection of these disability groups was that they tend to experience pronounced transportation challenges when compared to other disability groups (
Bezyak et al. 2020). For example, people with mobility disability may struggle with boarding and alighting vehicles; people with a hearing disability may not be able to hear announcements or communicate with the driver; while people with a vision disability may not be able to see a vehicle approaching a bus stop or station or read signage and directions. Although other groups of people with disability, like people with a mental disability, also experience significant transport barriers (
Øksenholt and Aarhaug 2018;
Bezyak et al. 2017;
Wahyuni et al. 2016), their exclusion from this study was based on ethical and practical considerations. This study aimed to understand the service quality barriers faced by people with disability, in the City of Tshwane, while accessing the public transport system. To achieve the aim of this study, the following secondary objectives were formulated:
- (1)
To identify the most important service attributes for people with disability which impact their transport mobility.
- (2)
To establish common traits and variations in transportation barriers among different groups of people with disability.
2. Literature Review
Service quality is “an organisation’s ability to meet and exceed customer expectations; of which, is evaluated through various dimensions, including reliability, safety, flexibility, convenience, and empathy” (
Mikuličić et al. 2024). Service quality in public transport is one of the most significant barriers encountered by people with disability in accessing public transport systems (
Bjerkan and Øvstedal 2020;
Park and Chowdhury 2018;
Kett et al. 2020;
Sil et al. 2023). The concept of service quality is considered complex, partly due to its nature which is intangible, heterogenous, and inseparable in terms of production and consumption (
Parasuraman et al. 1985). The literature reveals that authors have applied different criteria of service attributes to measure service quality in various contexts, such as accessibility, reliability, affordability, safety, and comfort (
Bjerkan and Øvstedal 2020;
Park and Chowdhury 2018;
Kett et al. 2020;
Sil et al. 2023).
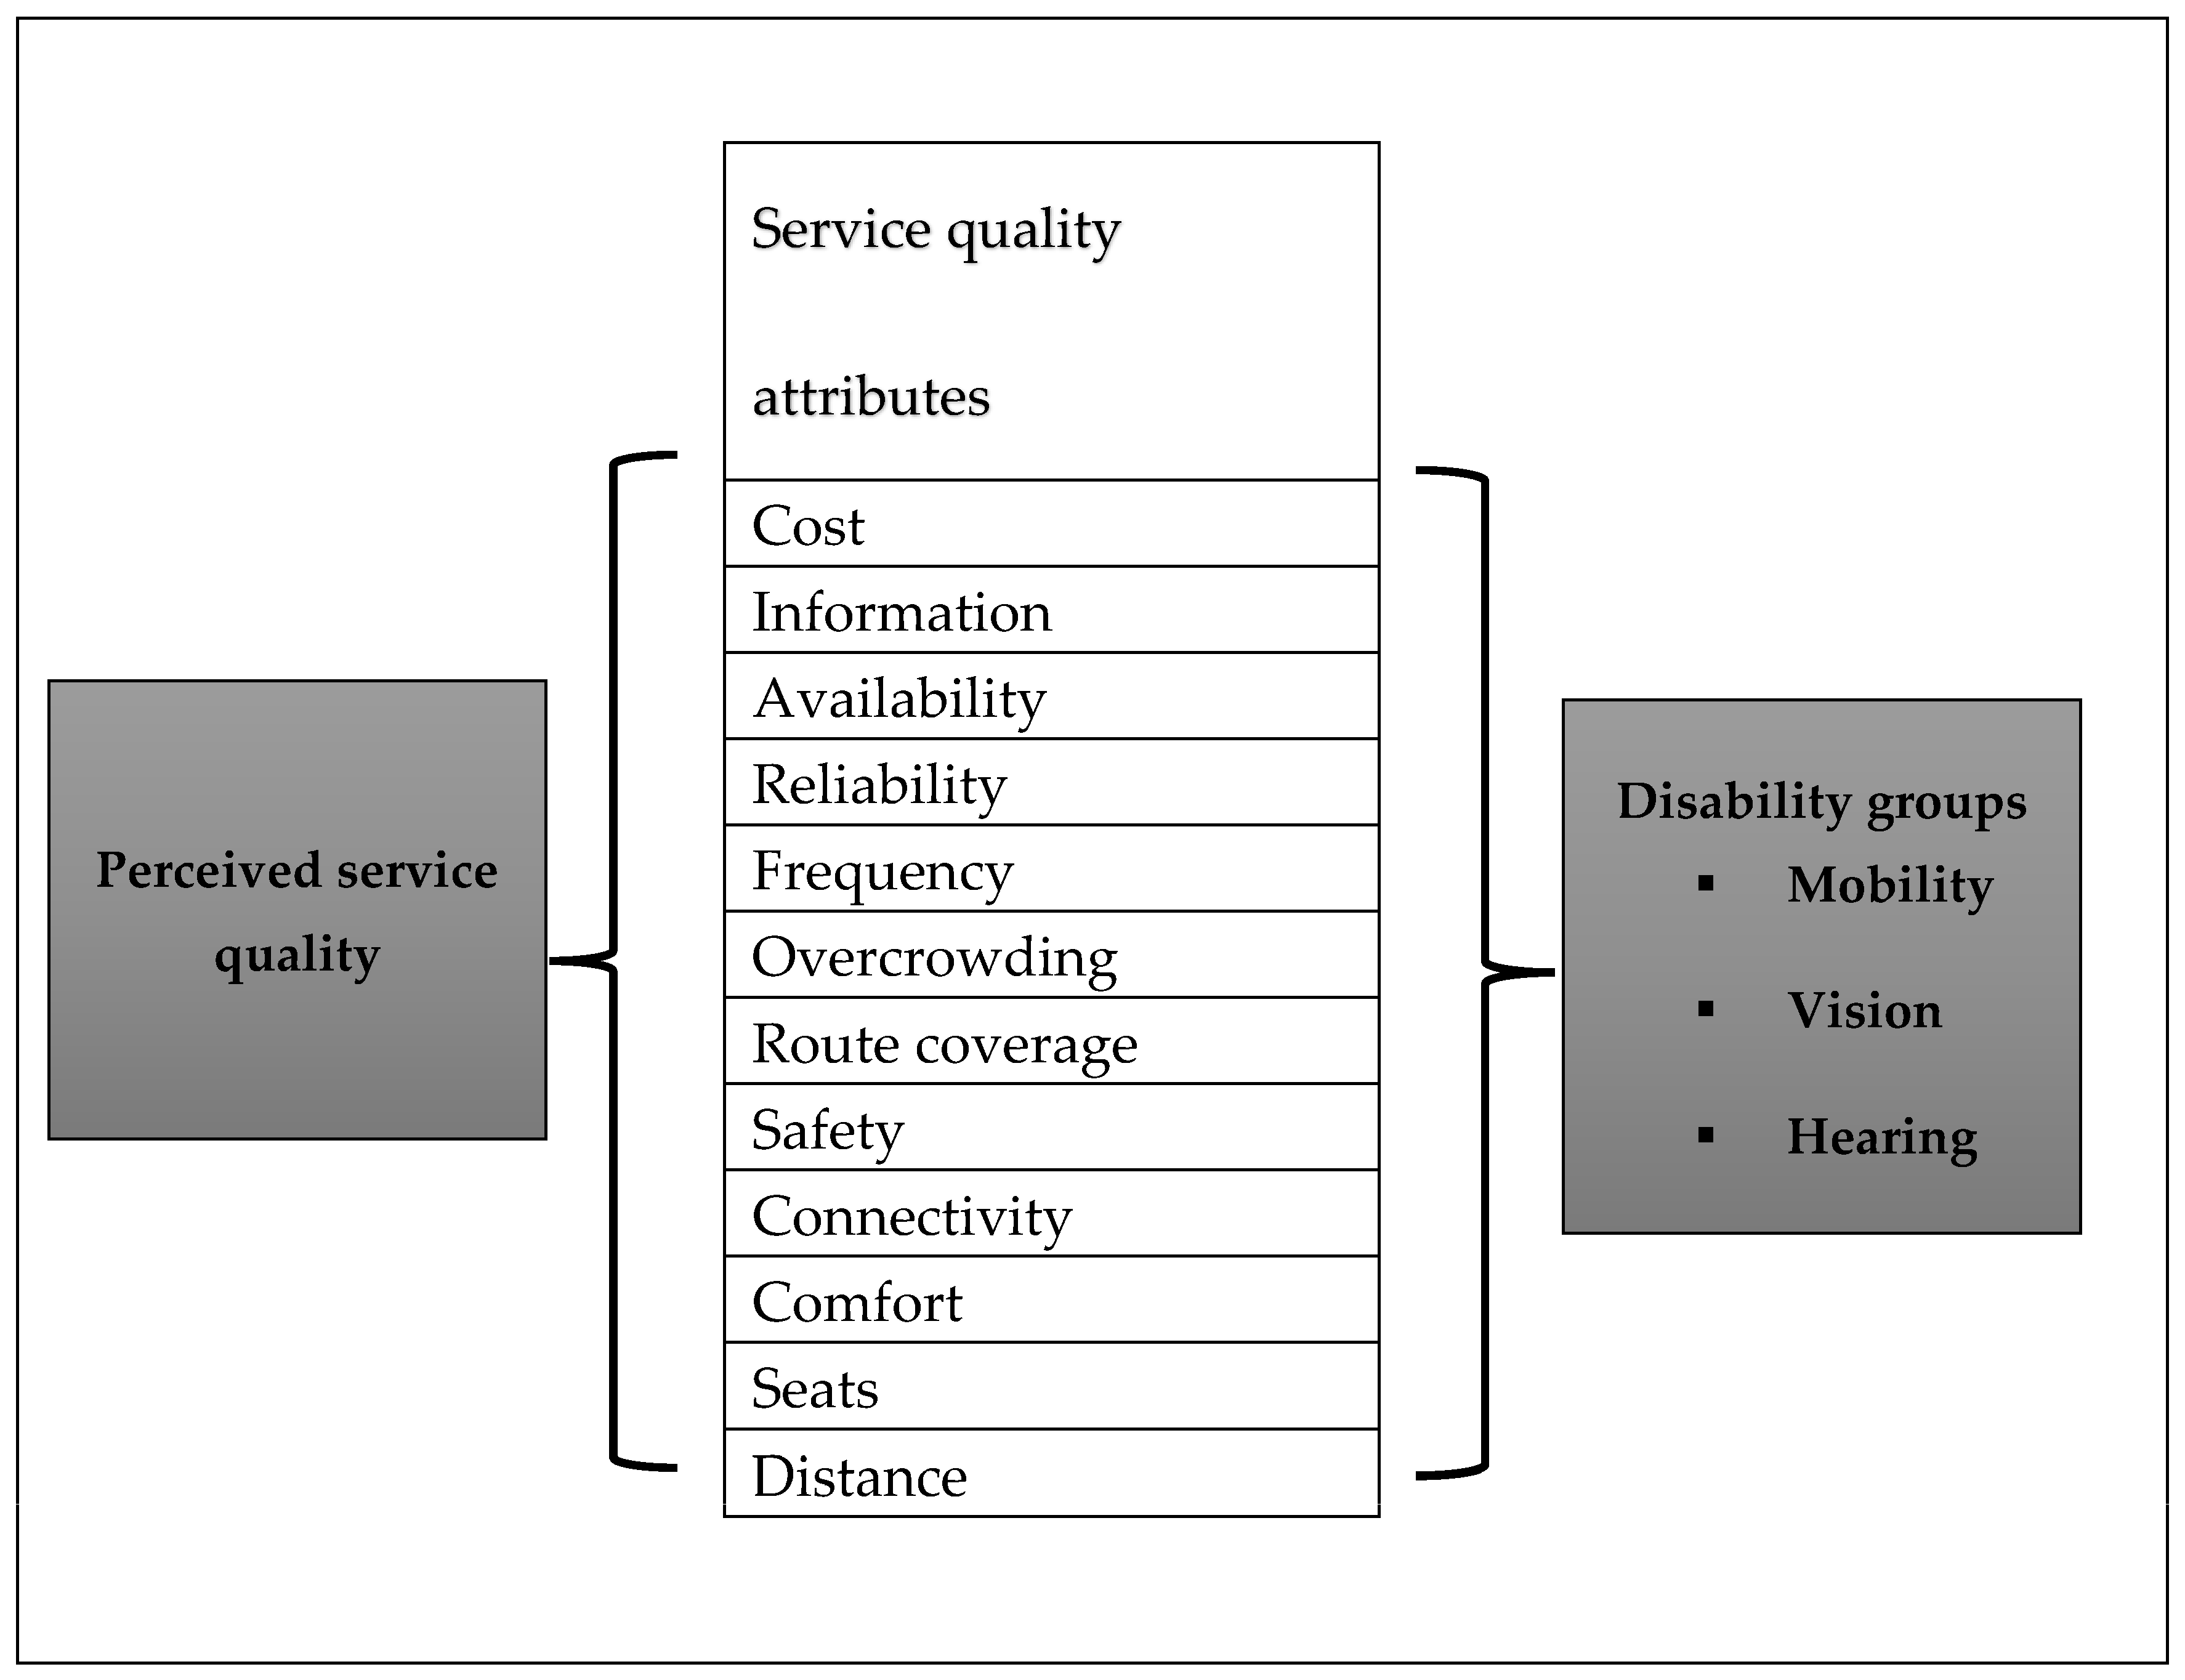
The service quality of a public transportation system is influenced by numerous factors, including those pertaining to “comfort and safety within vehicle, the time taken to cover the routes and convenience and existence of any supporting infrastructure” (
Anna et al. 2014). The service quality attributes as mentioned in the introduction that are identified from the literature include information (
Øksenholt and Aarhaug 2018), communication (
Øksenholt and Aarhaug 2018), safety, security (
Velho 2019), cost (
Owusu-Ansah et al. 2019;
Kett et al. 2020), reliability, connectivity, distance, overcrowding, and route coverage (
Park and Chowdhury 2018). Although the service quality of public transport is important for all, people with disability are often more affected by poor quality of service, as it is more difficult to access opportunities offered by the city (
Neven and Ectors 2023). As such, providing high quality public transport services is essential to ensure equity and inclusivity for all. Good and poor quality transport services are determined by service quality attributes. Good service quality is the ability of transport systems to meet the needs and expectations of users effectively by providing the key service quality attributes at acceptable levels (
Dell’Olio et al. 2010;
Tanwar and Agarwal 2025), and poor quality thus refers to transport services that fail to meet needs and expectations due to a lack or low levels of key service quality attributes.
Information and communication play an essential role throughout the journey chain of people with disability (
Øksenholt and Aarhaug 2018). Effective communication and accessible transport information are critical to ensure that people with disability can plan and complete their journeys safely and instill confidence in them (
Chiscano 2021;
Neven and Ectors 2023). Poor information and communication can exclude people with disability from using public transport (
Øksenholt and Aarhaug 2018).
Chiscano (
2021) found ineffective communication and poor transport information to be significant barriers for people with disability using public transport. Compared with other groups, people with vision and hearing disability are more severely affected by the poor presentation of information and ineffective communication. Issues concerning information and communication include the poor presentation of information, lack of a timetable, lack of real-time information, staff support system, and a lack of audio announcements on board and at the terminals (
Cepeda et al. 2018;
Duri and Luke 2022b;
Park and Chowdhury 2018;
Øksenholt and Aarhaug 2018;
Chiscano 2021).
The cost of transport is another problem encountered by people with disability (
Ahmad 2015;
Bombom and Abdullahi 2016;
Guzman et al. 2017;
Rivasplata and Le Roux 2018;
Owusu-Ansah et al. 2019). To a large extent, people using wheelchairs face additional transport costs. According to a study by
Owusu-Ansah et al. (
2019) conducted in Ghana, people with mobility disability tend to hire taxis as a means of avoiding verbal and psychological mistreatment from drivers and other passengers. However, this type of decision leads to high transport costs for people with disability. In Nigeria, drivers charge high transport fares for people in wheelchairs (
Bombom and Abdullahi 2016). Research conducted by
Kabia et al. (
2018) in Kenya found that female wheelchair users who travel with companions face additional transport costs, which are related to the attendance of their companions and the need for accommodating the wheelchair. The affordability of public transport is critical to people with disability as many may have limited access to private transport, especially in African countries (
Rivasplata and Le Roux 2018). Moreover, high transport costs may exclude people with disability from accessing transport services, which may impact their access to economic and social opportunities.
Transport safety is an important matter for people with disability, which is often compromised by a wide range of factors including poor public transport services.
Das Neves et al. (
2023) drew attention to the fact that some people with disability make conscious decisions to opt out of using public transport services as a means of prioritising their safety. Some of the issues concerning the safety of transportation emerge from drivers who lack occupational safety training on the transportation of people with disability (
Choi and Maisel 2022).
Das Neves et al. (
2023, p. 442) highlighted that passengers with a disability “want to be treated like the valid people they are, with a right to time, space, and safety, and for their voices to be not just be heard, but answered”. As certain types of disability are not visible, drivers may unknowingly put their passengers’ safety at risk by unintentionally disregarding their needs or condition, resulting in some people not using public transport for their own safety (
Duri and Luke 2022a;
Øksenholt and Aarhaug 2018).
Other issues concerning service quality are journey times and waiting times for transport services.
Bascom and Christensen (
2017) found that the limited operating hours of public transport services had an impact on the mobility of people with disability. Some people with disability encounter difficulties with complex routes and schedules (
Park and Chowdhury 2018). Although the infrastructure, operations, and services of public transport in developed cities have significantly improved, the same cannot be said for most developing cities across Africa (
Olowosegun et al. 2021). As such, there is a need for continued efforts to enhance the quality of public transport services, especially in African cities (
Duri and Luke 2024).
Figure 1 presents a summary of the service quality elements and represents the service quality framework adopted in this study.
Transport in the Context of South Africa
Policies and legislation in South Africa concerning the mobility of people with disability include the
White Paper on National Transport Policy (
2021);
Constitution of the Republic of South Africa (
1996); National Building Regulations and Building Standards Act (103 of 1977; National Road Traffic Act (93 of 1996);
Integrated National Disability Strategy (
1997); and the
White Paper on the Rights of Persons with Disabilities (WPRPD) (
2015). The
White Paper on National Transport Policy (
2021) articulates its vision as to “provide safe, reliable, effective, efficient, environmentally benign and fully integrated transport operations and infrastructure that will best meet the needs of freight and passenger customers, improving levels of service and cost in a fashion that supports government strategies for economic and social development whilst being environmentally and economically sustainable”. The key elements such as safety, cost, reliability, and integration highlighted in the
White Paper on National Transport Policy (
2021) show the South African government’s commitment to improve service quality in the transport sector. This policy aligns with the principles of service quality which is the focus of this study. Although the
White Paper on National Transport Policy (
2021) acknowledges the need for an inclusive transport system, it lacks specific guidelines and enforcement mechanisms. Similarly, the
NLTAA (
2023) emphasises accessibility, yet implementation in public transport is limited. While the
Integrated National Disability Strategy (
1997) aims to promote inclusivity, it does not directly address transport barriers. In the recent initiative, the Transport Summit on Universal Accessibility, one of the key resolutions relating to transport services is the importance of providing equitable, dignified, and responsive access to transport services for people with disability. This includes training transport operators and continuous transport improvement.
In South Africa, people with disability often encounter obstacles when using public transportation, arising from structural, socio-demographic, psychosocial, and service quality barriers, and limiting their independence and full societal participation (
Lister and Dhunpath 2016;
Vanderschuren and Nnene 2021;
Duri and Luke 2022b). The focus of this study is on service quality barriers which impact the mobility of people with disability in the City of Tshwane, South Africa. Service quality barriers in this study refer to dimensions of a service that determine its ability to meet customer expectations and needs. Examples of these dimensions include accessibility, information and communication, reliability, safety and security, comfort, frequency, route coverage, seats, affordability, travel time, and convenience (
Bjerkan and Øvstedal 2020;
Øksenholt and Aarhaug 2018;
Iudici et al. 2017;
Sze and Christensen 2017). Focusing on service quality barriers, especially in the context of public transportation (buses, trains, minibus taxis), is not only a critical area of research but also a matter of societal importance which may lead to improvement in the mobility gap amongst people with disability. Public transport can be defined as a system of shared passenger transport services that are available for use by the general public (
Preston 2019). For example, in the City of Tshwane, available forms of public transport are commuter rail, bus services, high speed rail—Gautrain, Bus Rapid Transit (BRT), and informal minibus taxis. The good service quality of public transport not only benefits people with disability but all of society.
3. Materials and Methods
This research study was based on a quantitative research method. Participants of this study were people with three different types of disabilities: people with mobility, vision, or hearing disability. As transport barriers are not homogenous, each group may hold unique perspectives and experiences when navigating public transport systems. A total of 214 questionnaires were fully completed with valid responses, consisting of 113 females and 101 males. People with mobility disability represented the highest proportion compared to the other groups.
The questionnaire, based on the literature review and prior studies, was designed to obtain information on service quality attributes which impact people with disability when using public transport services. The questionnaire consisted of a total of fifteen items, designed to measure service quality attributes. People with disability were asked to rate each item on a five-point Likert scale, with 1 representing ‘strongly disagree’ and 5 representing ‘strongly agree’.
For the data collection process, a self-administered questionnaire was utilised to gather information from people with disability living in the City of Tshwane during the month of July 2020. The first respondents were from the organisations of people with disability in Tshwane: Pathways Pretoria, South African National Deaf Association, South African National Council for the Blind, and Centurion Organisation for the Disabled. To expand the number of participants, snowball sampling was used to recruit people with disability from various areas within the city. Snowball sampling was the most appropriate method due to the absence of databases of people with disability in the city. To ensure the accuracy and completeness of the collected data, the participants were handed the questionnaires to fill out in the presence of the researchers. This approach was taken to minimise the number of incomplete questionnaires. The study utilised both online and hard copy questionnaires to accommodate diverse participant needs. The online questionnaire was designed to be compatible with screen reader software, enabling people with vision disability to participate independently.
The questionnaire was developed based on the existing literature about people with disability and their experiences accessing public transport services. This helped to ensure that the questions were relevant and applicable to the target population. A pilot study was conducted and the questions that were not clear to the participants were adjusted. The data were processed using the SPSS statistical software package version 26, which allowed for more accurate and efficient data analysis. In analysing data, a combination of descriptive statistics, factor analyses, and inferential statistics were employed.
This study was conducted in strict adherence to ethical research requirements and regulations. According to
De Vos et al. (
2011, p. 113), ”research should be based on mutual respect, acceptance, cooperation, promises and well-accepted conventions and expectations between all parties involved in a research project”. The Department of Transport and Supply Chain Management of the University of Johannesburg granted ethical approval for this research as per the university’s policy on ethical clearance certification. The necessary measures were taken to ensure that the research was conducted in an ethical and responsible manner. Informed consent forms ensured that all participants voluntarily agreed to participate in the study after being fully informed about its purpose, risks, and benefits. Research integrity was maintained by transparency in data collection and analysis to avoid any manipulation or misrepresentation of the findings. People with disability are considered a vulnerable population according to legislation. Therefore, all data collected during the study were securely stored, with appropriate measures in place to protect the privacy and confidentiality of the participants. Confidentiality and data protection adhered to ethical standards by ensuring participants’ identities and personal information remained confidential and complied with relevant data protection laws. This was done in accordance with the ethical standards and legal requirements governing research involving vulnerable populations.
4. Results
The findings from the analysis of data collected on service quality barriers experienced by people with disability are presented in this section. The results begin with a summary of the profile of respondents to provide the demographic and socio-economic characteristics of people with disability. This is followed by the descriptive results, exploratory factor analysis (EFA), and group comparison. The EFA is a statistical technique utilised in the study to uncover patterns and variables that contribute to the observed data, which may lead to a meaningful interpretation of results (
Pallant 2007). To establish similar traits and variations in transportation barriers among different groups of people with disability, a multiple comparison test (Scheffe) was performed.
Table 1 below presents a profile of respondents.
A survey was conducted to evaluate the service quality of public transport and the barriers experienced by people with disability in the City of Tshwane. A Likert-type scale was utilised to rate the level of agreement of participants with statements regarding service quality barriers.
A total of 15 items were evaluated by the participants, to provide insights into the specific challenges that people with disability face when accessing public transport, and the extent to which these challenges impact their travel experiences. The study assessed service quality barriers using a structured questionnaire consisting of 15 items, which were developed based on the service quality framework and existing literature. These items are shown in
Table 2.
Table 2 shows the mean and standard deviation for each statement regarding service quality barriers. The items listed in
Table 2 are organised from the highest to lowest mean score to provide a better understanding of key concerns.
The highest mean score (M = 4.27, Mdn = 4.00) was obtained for Item 7, ‘Travel time with public transport is too long’, and Item 11, ‘Drivers do not announce stops’, which suggests that respondents generally find these service quality barriers to be the most problematic. On the other hand, the lowest mean score (M = 3.26, Mdn = 3.00) was obtained for Item 9 ‘I have limited transport options or choices’; however, the group results indicate that it is a higher priority to people with vision and mobility disability.
The results indicate that respondents generally agree that the service quality barrier statements listed in the survey are relevant to them, and that most respondents are not satisfied with the quality of public transport service available to them. All items shown in
Table 2 present considerable barriers to participation in public transport services for people with disability. The major barriers experienced by all groups are long travel and waiting times, lack of information, and transport cost. The standard deviation was high in most cases, indicating considerable variation in the answers and suggesting that respondents experience service quality barriers in different ways. For example, Item 9 implies that people with hearing disability seem to have more transport options compared to other groups. Furthermore, Item 10 indicates that people with hearing disability are not severely affected by vehicle connection issues during a journey, while Item 6 has a highest mean score for people with vision disability, meaning they wait much longer for transport services. Passengers who are blind do not necessarily wait longer, but they perceive it as a greater problem. They rely on other passengers to hail public transport. Drivers may not recognise a blind person waiting unless they have a guide dog or a white cane, making it less likely that a driver stops for them. Blind passengers struggle to identify the correct vehicle (bus, taxi, or train) as it arrives. Differences between disability groups are discussed following the EFA.
To uncover the underlying structure of the variable and to interpret the results, an EFA was conducted. The Kaiser–Meyer–Olkin (KMO) measure of sampling (
Kaiser 1974) and Bartlett’s test of sphericity (
Bartlett 1950) were conducted to evaluate the strength of the linear association between the 15 items in the correlation matrix (see
Table 3).
Based on the Kaiser–Meyer–Olkin (KMO) measure of sampling adequacy value, which was 0.814, indicating a statistically significant structure that was viable to perform the EFA on items, and Bartlett’s test of sphericity which was significant (x2 = 1141.381, p < 0.001), it was concluded that a factor analysis could be conducted successfully. After the KMO and Bartlett’s test were conducted, the next step was to determine the number of factors. The results of the total variance explained indicate that only four factors in the initial solution had eigenvalues greater than 1, accounting for 66.701% of the variability in the original variables. This suggests that four key factors are associated with service quality barriers, although a significant portion of the variance remains unexplained. In the extracted solution, the cumulative variance explained by these four factors dropped to 56.342%, reflecting a loss of approximately 10.4% due to the extraction of latent factors. The scree plot further supported this finding, showing a clear inflection after the fourth factor, confirming that only the first four factors had eigenvalues greater than 1. These four factors were deemed meaningful and thus retained for rotation.
The communality values of the items in
Table 4 were all above 0.2, indicating that they belonged to their respective factor structures.
Table 4 below shows the rotated factor pattern and final communality regarding service quality barriers.
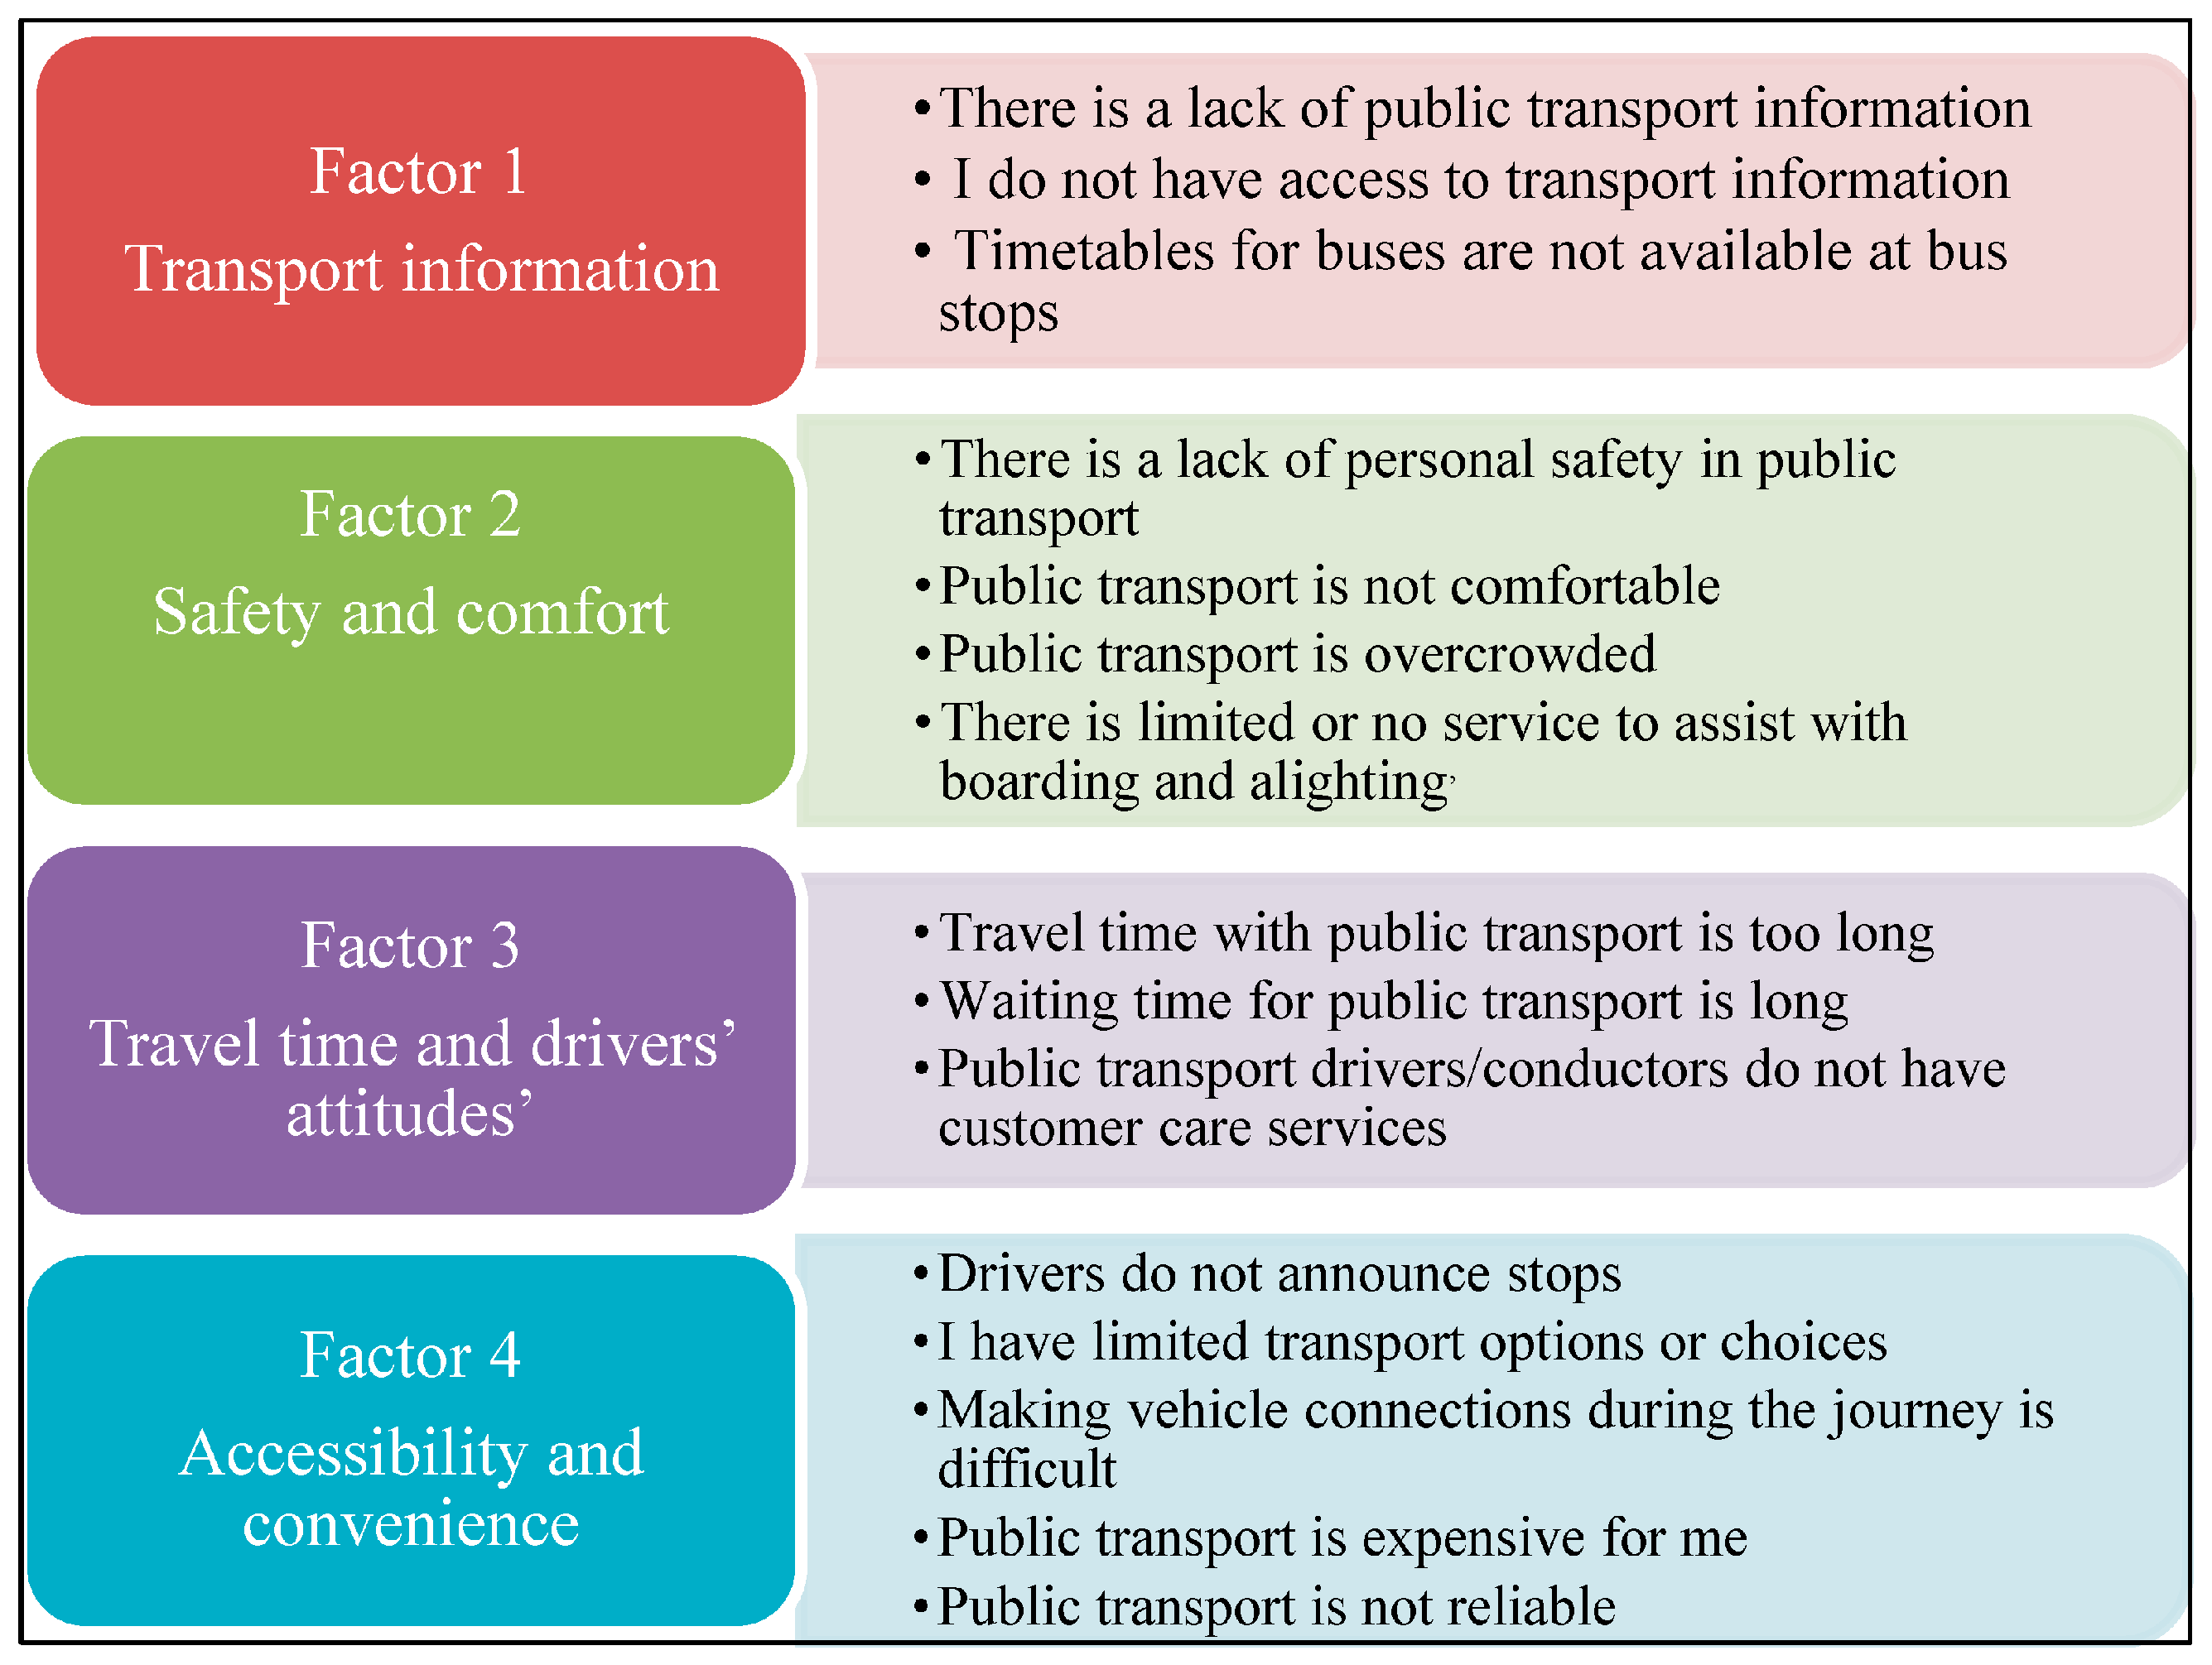
The EFA was conducted on the responses of fifteen items. Principal axis factoring was used to extract the factors, followed by the Varimax rotation. The items were loaded to four main factors. These are summarised in
Figure 2 below.
The secondary objective of this study was to establish similar traits and variations in transportation barriers among different groups of people with disability. In order to determine the similar traits and variations in ‘Safety and comfort’ among the different groups of people with disability, a multiple comparison test, the Scheffe test, was conducted. To account for Type 1 errors, a Bonferroni adjustment was applied by dividing the alpha value of 0.05 by the number of tests that were conducted (3), equalling 0.016667. Type 1 errors occur when a true null hypothesis is incorrectly rejected. When multiple statistical tests are conducted, the probability of making at least one Type 1 error increases. The Bonferroni adjustment lowers this risk.
Table 5 shows the results of the Scheffe test.
The results presented in
Table 5 highlight a statistical difference in the ’Safety and comfort’ factor between groups that have mobility and hearing disability (
p = 0.007), suggesting that their experiences relating to safety and comfort vary. People with mobility disability are likely to face more challenges in ensuring their safety and comfort while traveling compared to people with hearing disability. For example, a passenger in a wheelchair has potential safety risks on a bus if the driver starts driving before they are settled; this may not necessarily apply to passengers with hearing disability. The mobility and vision groups of passengers need more assistance than the hearing group.
The results however also indicate that there is no significant difference between groups with mobility and vision disability (p = 0.913) and groups with vision and hearing disability (p = 0.049). People with vision disability also face severe challenges similar to those experienced by people with mobility disability. For example, the results reflect that both groups, mobility and vision, need assistance in boarding and alighting vehicles, and public transport offers limited assistance in these situations.
In order to determine the variations in ‘Accessibility and convenience’ among the different groups of people with disability, a Scheffe test was conducted. To account for the number of tests conducted, a Bonferroni adjustment was applied by dividing the alpha value of 0.05 by 3 = 0.016667.
Table 6 shows the results of the Scheffe test. The statistical analysis indicated a significant difference in the ‘Accessibility and convenience’ between groups with mobility and hearing disability (
p < 0.001) and groups with vision and hearing disability (
p < 0.001). However, there was no significant difference between groups with vision and mobility disability (
p = 0.937), which suggests that these groups share common barriers in accessing transport.
When group comparison tests were conducted on the factors of ‘Transport Information’ and ‘Travel Time and Driver Attitudes’, no significant differences were found amongst the three groups of people with disability. This finding suggests that ‘Transport Information’ and ‘Travel Time and Driver Attitudes’ are universally important service quality attributes, impacting all groups of people with disability in a similar manner. Consequently, further testing was deemed unnecessary.
5. Discussion
The aim of this study was to understand service quality barriers faced by people with disability in the City of Tshwane while accessing the public transport system. The first objective was to ‘identify the most important service attributes for people with disability that impact their transport mobility’. The results show that people with disability are generally dissatisfied with the quality of public transport services in the City of Tshwane. Major barriers that emerged are long travel times, high transport costs, and a lack of transport information. These findings align with previous research on transport challenges experienced by people with disability (
Kabia et al. 2018;
Park and Chowdhury 2018;
Øksenholt and Aarhaug 2018;
Kett et al. 2020;
Chiscano 2021;
Park and Chowdhury 2022). Previous research (
Bezyak et al. 2017) has shown that when transport providers are understaffed, it leads to delays, missed pick-ups, and overcrowding. Similarly,
Nickpour et al. (
2012) found that in some cases, drivers are unwilling to provide services to people with disability, leading to extended waiting times, particularly for wheelchair users.
The high transport costs found in this study as a major barrier particularly affect passengers with mobility disability. In South Africa, a monthly income of ZAR 3000 is generally considered low, and a substantial portion of this income is often spent on transport. Regardless of disability status, such financial constraints can influence individuals’ perceptions of transport affordability. People with a mobility disability incur extra transport expenses from either the accommodation of wheelchairs or travel companions (
Guzman et al. 2017). Research in Stockholm (
Stjernborg 2019) and Kenya (
Kabia et al. 2018) confirms similar findings, where bus drivers often refuse to assist passengers in wheelchairs, leaving them stranded and forcing them to rely on more expensive transport options.
A major issue also found in this study was the absence of transport information. This aligns with studies by
Øksenholt and Aarhaug (
2018),
Kett et al. (
2020), and
Neven and Ectors (
2023), which found that poor information systems create significant barriers for people with disability. This study found that people with vision disability face additional challenges due to the lack of audio announcements at bus stops and inside vehicles. People with hearing impairments struggle with limited visual information displays, especially when digital signage is unavailable or not functioning. The absence of transport information further exacerbates the accessibility challenges for all disability groups.
The second objective of the research was to ‘establish similar traits and variations in transportation barriers among different groups of people with disability’. To understand whether all disability groups experience similar challenges, the study conducted a group comparison analysis. The EFA identified four key service quality dimensions that impact all three groups: Transport information (Factor 1); Safety and comfort (Factor 2); Travel time and driver attitudes (Factor 3); and Accessibility and convenience (Factor 4).
With Factor 1 (Transport information), the study found no statistically significant difference between all groups in terms of transport information barriers. This suggests that all disability groups face similar challenges when accessing public transport information. For example, vision-impaired passengers struggle with the lack of audio announcements, while hearing-impaired passengers rely on visual displays, which are often inadequate. Similarly, mobility-impaired passengers require route and scheduling information to plan their travel effectively.
Similarly to Factor 1, Factor 2 (Travel time and driver attitudes) showed no statistically significant difference between all groups regarding travel time and drivers’ attitudes. All groups experience long travel times and delays. The attitude of public transport drivers was highlighted as a major concern across all disability groups. Previous research reveals that drivers are often unwilling or unable to provide assistance to passengers with disability, which creates further accessibility barriers (
Bombom and Abdullahi 2016;
Stjernborg 2019;
Velho 2019).
With Factor 3 (Safety and comfort), the study found that people with mobility and vision disability were the most vulnerable to safety and comfort-related barriers. The literature indicates that wheelchair users struggle with uncomfortable seating and overcrowding, which can pose safety risks (
Ahmad 2015;
Iudici et al. 2017). The results also align with the research by
Iudici et al. (
2017), which found that female passengers with disability are particularly vulnerable to crime and harassment on public transport. In the context of South Africa, metro trains in Cape Town have been found to be highly overcrowded, making them inaccessible for wheelchair users (
Rivasplata and Le Roux 2018).
Lastly, with Factor 4 (Accessibility and convenience), this study found a statistically significant difference between people with mobility disability and those with hearing disability in terms of accessibility and convenience. People with hearing disability have more transport options because they do not require specialised vehicle designs, while people with mobility disability face more difficulties due to limited accessible vehicles and poor infrastructure (
Øksenholt and Aarhaug 2018;
Velho 2019). As reflected in the literature, ramps, low-floor buses, and accessible transport stations are still lacking in many regions, especially African countries (
Duri and Luke 2022c). Overall, the study shows that people with disability in the City of Tshwane face many challenges and are dissatisfied with public transport services.
The findings of this study highlight the persistent service quality barriers encountered by people with disability in urban public transport. However, it is important to acknowledge that people are not a homogeneous group and their experiences with transport vary widely. From an intersectional perspective, multiple identities such as age, gender, race, and socio-economic status compound the transport challenges experienced by people with disability. For example, women with disability from low-income households may encounter compounded difficulties that restrict mobility (
Iudici et al. 2017). Women with disability may have greater risks of gender-based violence and harassment in poorly monitored transport spaces. Given the broader context of pervasive gender-based violence in South Africa, women’s safety in public transport remains a serious concern (
Moghayedi et al. 2023). Intersecting factors including poverty shape how individuals access, perceive, and experience public transport. Failing to acknowledge these intersecting identities risks further marginalising those who are already in disadvantaged situations. Whilst acknowledging these factors, it should also be noted that this was not addressed in the current study. This should therefore be acknowledged as a limitation and considered as an area for future research.
6. Conclusions
The study highlights factors that contribute to the quality of transport services for passengers with disability in the City of Tshwane. The key challenges identified include long travel and waiting times, a lack of transport information, an absence of stop announcements, high transport costs, and inadequate accessibility measures. The results show that these barriers are not uniform across disability groups. People with mobility and vision disability experience greater difficulties in accessibility and safety compared to those with hearing disability. The findings also indicate that transport information and driver attitudes are critical service quality attributes affecting all groups equally.
Based on the findings of this study, it is recommended that the City of Tshwane improve its public transport system by implementing group-specific interventions to address service quality barriers experienced by people with disability. Real-time information should be made accessible through multiple formats, for example, audio announcements at stations and bus stops for passengers with visual impairments, and visual displays (digital screens and scrolling text) for those with hearing impairments. Printed and digital bus schedules should be readily available at bus stops and on mobile platforms, ensuring information is accessible in large print and easy-to-read formats to accommodate diverse user needs.
Furthermore, the provision of tactile ground surface indicators can enhance navigation for people who are blind, while accessible signage with icons and pictograms can benefit passengers with hearing disability. For inclusive and respectful interactions, regular training programs focusing on disability awareness and passenger assistance should be provided to all transport staff. These trainings should be tailored to address specific needs, for example, guiding techniques for assisting blind passengers, use of basic sign language for engaging with deaf passengers, and communication strategies for supporting people with cognitive disability.
The limitation of this study is that this research was only focused on passengers with disability; however, there are other people involved in their journeys, such as travel assistants, parents of children with disability, caregivers, friends, and relatives. These individuals’ experiences could also be valuable and provide further insights into the travel needs of people with disability; therefore, future studies could focus on exploring their experiences while traveling with people with disability. Minors and the elderly with disability are not covered in this study and this is acknowledged as a study limitation. These groups are classified as vulnerable, and as such it was important for the researchers to exclude them and adhere to ethical guidelines that safeguard the rights and well-being of participants. Future research should explore the perspectives of caregivers of minors and the elderly with disability. While the questionnaire included all public transport modes in the City of Tshwane, the responses were analysed in aggregate rather than disaggregated by transport mode. We acknowledge that users’ experiences could vary significantly depending on the mode of transport used. Future studies could explore mode-specific service quality perceptions among different disability groups to better isolate the impact of each mode. While this study sheds light on the persistent service quality barriers faced by people with disability in urban public transport, it does not account for the intersectionality of disability, such as the influence of gender, age, socio-economic status, and race. These overlapping identities significantly shape transport experiences and can intensify the challenges faced, particularly for groups such as women with disability from low-income backgrounds. Therefore, future studies should consider intersectional identifies to provide a more comprehensive understanding of mobility barriers.


