Abstract
Data from community-based research offer crucial insights into community needs, challenges, and strengths, informing effective decision making for development strategies. To ensure efficient analysis, accessible and user-friendly tools are necessary for quick and accurate results. While successful tools and programming languages exist, many social science researchers struggle with complex analytical tools due to limited exposure during their education, as such tools are often not required. Developing an automated, user-friendly tool for community research can support students, researchers, and data centers by bridging gaps in analysis capabilities and enhancing the accessibility of valuable insights. We developed a new automated tool using the Shiny framework in R designed primarily for analyzing data in community research, which often involves pre- and post-analysis tests. While the tool is specifically tailored for pre- and post-survey data, it can also be easily adapted to provide other statistical information. The findings presented in this paper highlight the efficiency of using this tool for community-based research and emphasize the need for further development to address its shortcomings. Furthermore, this paper is considered the groundwork for developing more accessible, user-friendly, and free tools in the future, especially in an era of advanced and complex technologies.
1. Introduction
Community-based research aims to enhance community health and well-being by fostering partnerships between communities and academic researchers (Hergenrather et al. 2010). It is increasingly recognized as a vital approach for addressing complex environmental, health, and social challenges (Flicker et al. 2008). Community research prioritizes the active involvement of community members, enhancing the relevance and accuracy of the data collected from the community directly while improving the effectiveness of interventions (Yau et al. 2024).
A central goal of community research is to improve quality of life through better practices in treatment, prevention, health promotion, and education (Wandersman 2003). In this context, statistical tools are crucial for analyzing diverse data, helping researchers identify patterns and relationships, especially in studies of human behavior and social interactions (Gupta 2024). Given that these data reflect the community’s true experiences, it is crucial to analyze it in a manner that is both accessible and efficient for researchers. The growing volume of research in social sciences, particularly community studies, underscores the increasing reliance on statistical tools for analyzing quantitative data. However, some researchers and non-researchers, such as program staff and practitioners, often struggle with understanding these tools and their proper use. This can often lead to frustration and abandoned projects. Therefore, user-friendly analytical tools are essential for social science and community research. To streamline the process, it is essential to incorporate automated analytical tools that manage complex data with minimal statistical expertise. These tools would enable researchers and community stakeholders who have limited technical skills to interpret results effectively without needing advanced knowledge of statistics or programming. By lowering technical barriers, such tools would encourage more researchers to engage in community-based research, allowing them to focus on solving real-world problems.
Quantitative social science, shaped by positivism, emphasizes using data to understand social issues (Babones 2016). This approach is also vital in community-based research where data collection and analysis help identify community needs, experiences, and appropriate techniques and certain knowledge for their interpretation (Greenwood and Freeman 2015; Altman 1998; García Garmendia and Maroto Monserrat 2017). This approach also ensures that the findings are accurate, relevant, and actionable for the community, fostering a deeper understanding of local issues and supporting evidence-based decision making for effective interventions.
Conducting statistical analyses demands considerable effort (Turner and Lambert 2015). In the past two decades, proficiency in statistical tools has become increasingly important to fully understanding others’ research and for conducting educational studies (Kittle 2014). Statistical methods are crucial in research as they help analyze data and draw clearer, more precise, and accurate conclusions (Rajasekar and Verma 2013). They give context and interpretation to otherwise meaningless numbers by turning raw data into meaningful information (Ali and Bhaskar 2016). When used effectively, these statistical tools enhance process quality (Ribeiro and Sarsfield Cabral 1999) and allows for systematic data analysis, pattern identification, and data-driven decision making, leading to more efficient and consistent processes.
Social science students frequently encounter difficulties with statistical analysis because statistical software is often not designed to accommodate users without a background in statistics or programming. Correspondingly, a significant factor contributing to researchers’ challenges during the data analysis phase is the inherent complexity of statistical software especially for new users (Ashour 2024; Masuadi et al. 2021). Several reports have highlighted the need to strengthen quantitative skills among undergraduates (MacInnes 2009). Surveys of social science disciplines, including sociology (MacInnes 2015; Williams et al. 2008) and politics (Adeney and Carey 2009; Parker 2010), revealed a widespread deficiency in quantitative methods training across many programs. Therefore, selecting appropriate software for beginners is crucial (Abbasnasab Sardareh et al. 2021), as it can improve research quality and reduce anxiety, which is often reported by students during their learning process in statistical courses (Denny et al. 2024). In this regard, Brezavšček et al. (2017) found that statistics anxiety and the perceived value of learning statistics are key factors influencing the intention to use statistical software. As Parker (2019) noted, despite strong support for undergraduate research, the teaching of methods in the social sciences, particularly quantitative methods, has been a longstanding concern. A related challenge in community-based research is selecting the appropriate methodological approach, especially when employing quantitative methods (Sterk and Elifson 2004). Given the rise of online and hybrid courses, as well as the high cost of many software packages (Wu and Zhang 2011), instructors may consider adopting alternative software solutions (Shepherd and Richardson 2024). This underscores the importance of accessible and user-friendly tools for analyzing data derived from such studies. In this context, open-source programs such as JASP, Jamovi, and PSPP emerge as valuable alternatives to traditional statistical software offering robust and user-friendly platforms that are particularly well-suited to academic settings (Kangiwa et al. 2024). These tools have been developed with accessibility and ease of use in mind, addressing the limitations of more complex programs like SPSS and SAS. Notably, Jamovi was developed to integrate newer technologies while preserving an intuitive interface (JASP Team 2020), and PSPP, part of the GNU Project, was created as a free alternative to SPSS and supports a broad range of statistical procedures (GNU Project 2021).
Building on the growing development of open-source statistical tools, it is essential to consider how these platforms can be adapted to meet the specific needs of social science and community-based research. While there is a substantial scholarship highlighting the importance of community issues and their societal impact, far less attention has been given to practical solutions for analyzing data in these areas. The core value of the survey analyzer lies in its ability to bridge the conceptual and practical challenges typically encountered with traditional data analysis tools. Specifically, it simplifies the complexities of handling data. In contrast to textbook examples, which often feature clean datasets, real-world data are frequently more intricate and difficult to navigate, making it harder for users to manage and analyze effectively. While current advanced platforms like SPSS, SAS, R, and Python offer graphical user interfaces to ease usability and offer a wide range of powerful features, they often assume users have at least a moderate understanding of statistical concepts. This poses a challenge for those without a strong background such as students, early-stage researchers, or professionals from non-quantitative fields who may struggle to choose the right tests, perform the analysis correctly, and interpret the results. Many tools also have complex interfaces and use technical language, which adds to the difficulty. While these tools are technically robust, they are not equally usable or accessible for all users, particularly those with limited statistical training.
This tool is designed to support common tasks such as pre- and post-intervention analysis, a core component of social impact assessment. It aims to lower barriers by guiding users through common data challenges and enabling quicker, more intuitive analysis without the need for extensive training. This is particularly beneficial for community partners and others outside academic or research settings by helping them engage more directly with their data and contribute meaningfully to evaluation efforts.
The primary motivation for developing this tool was to address missing values or data points in pre- and post-tests, or when participants complete only one of the tests. The tool aims to reduce the time analysts spend on routine tasks, such as handling missing or incomplete data. While these tasks are straightforward, they are often overlooked by those new to analyzing real-world data, which often leads to inefficiencies and potential errors. By automating data preparation steps, the tool frees up senior analysts’ time and allows them to focus on more complex tasks, such as data interpretation and advanced analysis. Additionally, this approach empowers student analysts to engage more directly with the interpretation of results, enhancing their learning experience and overall productivity. This shift not only improves the efficiency of the analysis process but also ensures that the focus remains on deriving meaningful insights from the data rather than the intricacies of the data cleaning procedures. While the tests themselves are not new, the way they have been simplified and democratized into an easy-to-use platform for fast and efficient data analysis is a novel approach. This makes the tool highly accessible to a wider range of researchers, including those with limited statistical expertise, and offers significant benefits for students and researchers alike.
2. Materials and Methods
2.1. Tool Development
The automated tool was developed using the Shiny framework in R with all computations implemented using base R functions. Its interactive components were built using the R packages shiny, shinyjs, shinywidgets, and rsconnect. The tool is designed to streamline data cleaning processes for survey analysis, accommodating both cross-sectional and repeated-measures study designs. Shiny was chosen for its interactivity and user-friendly interface, allowing users with minimal programming experience to perform complex data preprocessing tasks efficiently. The tool is specifically tailored to handle the most common challenges encountered in survey data, and it can restructure datasets for downstream statistical analysis.
The tool is web-based, and each session creates a new “container” that is promptly deleted once the session ends, ensuring that no data is permanently stored. However, the infrastructure used is not the HIPAA-compliant stack. The use of data ultimately remains at the discretion of the data analyst, who must ensure that only de-identified or public-use data sets are employed. Analysts can remove any identifiable information prior to sharing data with interns, students, or other project personnel, thereby upholding participant privacy and maintaining confidentiality throughout the research process.1
2.2. Data Sources and Types
The tool is designed to handle datasets commonly encountered in community-based research (healthcare, education, and other fields where survey data or experimental results are collected). These datasets typically include repeated measures, such as pre- and post-intervention data, or cross-sectional data collected at a single time point. Given a properly formatted file, the tool automatically identifies and processes selected variables to provide comprehensive descriptive statistics, including percentage frequencies or other summary statistics for each time point. This makes the tool particularly useful for quick, exploratory analysis and for summarizing results in situations where time or expertise is limited.
To test and validate the tool, we selected datasets that represent a wide range of real-world applications. These included survey responses with categorical variables, longitudinal datasets with repeated measures, and experimental data where outcomes were measured before and after an intervention. The choice of datasets was informed by common use cases in research and practice focusing on scenarios where users typically encounter challenges like incomplete data, non-standard formatting, and the need for rapid insights. Additionally, the option to download results in an accessible format makes the tool ideal for integrating into broader workflows, such as report writing or further statistical analysis in specialized software.
Furthermore, this automated tool has a maximum file size limit of 30 MB for CSV input files. While some adjustments could be made to handle larger datasets, the tool is not specifically designed for very large data use cases. Its capabilities are better suited for smaller datasets, and scaling to accommodate big data would require significant modifications. It is worth noting that smaller datasets do not refer to extremely limited data, but rather to datasets of moderate size. For example, based on the second user experience, the tool was successfully tested with a dataset of approximately 1.29 MB, comprising 1041 questionnaire responses from the CATCH program. This suggests that the tool can handle typical datasets commonly encountered in social science and program evaluation research. Preliminary tests indicate that it can efficiently process data up to 30 MB, making it suitable for most applied research contexts. Exceptions may include projects involving large-scale longitudinal tracking or geospatial data, which are generally uncommon in such settings.
2.3. Workflow Description
- To begin, upload a CSV file. The variable names must be in the first row, and the data should begin in the second row. To indicate missing data, leave the cell blank.
- The tool is designed to analyze both categorical and numerical variables. However, when performing numerical analyses, the variable must contain only numeric values. The presence of any text or non-numeric entries will result in the variable being treated as categorical. Additionally, users have the option to configure the tool to treat all variables as categorical, if preferred.
- The program can handle one-time surveys, but it can also handle pre-post surveys (or even >2 time points), if each individual assessment is recorded on a separate line. For this functionality, you must also include a variable that identifies the time point.
Figure 1 below shows the tool’s interface, illustrating the process of uploading a CSV file and configuring the data for analysis, including handling categorical variables and pre-post survey formats. It is worth noting that the tool does not support in-app data transformations such as combining categories or reordering factor levels. These types of modifications are common in survey analysis and are typically handled prior to using the tool. Users are expected to prepare their datasets in advance. In some cases, minimal data cleaning, such as resolving duplicate entries or managing instances where participants completed multiple surveys, may be conducted in software like Excel.
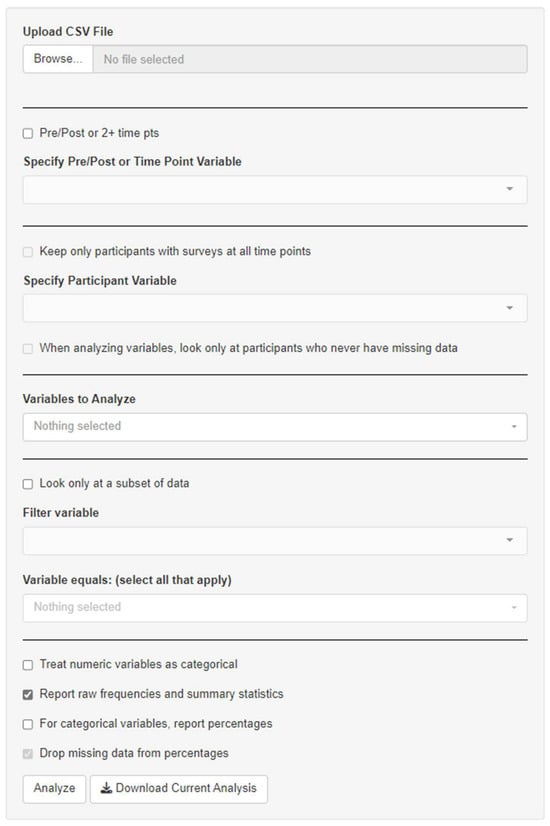
Figure 1.
User interface of the automated tool.
To ensure optimal functionality and accuracy, the tool verifies that the input file is in CSV format, which is essential for proper data processing. A potential limitation arises when the column headers are not clearly defined, as this can lead to difficulties in interpreting the printed output. This issue is often related to data cleaning requirements. The tool also allows flexibility in data handling by providing options for selecting either a one-off or pre/post-measure analysis. Users can choose to exclude missing cases or include instances where the same respondent has provided responses at both pre- and post-test stages. The treatment of missing data may vary depending on the type of variable. While imputation is a widely accepted method for addressing missing data, it may not always be appropriate in contexts where data are collected through voluntary surveys. In such cases, missing responses are often not missing at random as they may indicate a lack of knowledge, discomfort with a question, or disengagement. Therefore, imputation was not prioritized in the current version, as it can introduce interpretive complexity for community-based audiences by raising questions about which method to use, particularly when users are unfamiliar with the assumptions underlying various imputation techniques. Moreover, the tool is primarily designed for process evaluations and formative assessments that typically involve one or two time points, rather than for summative evaluation. Instead of applying complete case deletion, the tool conducts item-level analysis whereby missing responses are excluded only for the specific questions they affect while all other available data from the same participant are retained. The tool’s descriptive summaries also report the number of responses excluded due to missing data for each item, helping users assess the extent and potential impact of missingness. Furthermore, the tool supports data sub-setting based on variables such as grade or gender, depending on the user’s analytical needs.
3. Results
At the core of this study is a newly developed automated data analysis tool designed to streamline data preparation and analysis, particularly for users without advanced statistical expertise. This tool includes several key features aimed at improving efficiency, accessibility, and ease of use. The following section discusses each of these features.
3.1. Analysis of Pre- and Post Data Set
The automated data analysis tool simplifies the comparison of pre- and post-survey data (as well as surveys collected at more than two time points) by streamlining the process of analyzing changes over time. By automatically processing and organizing both datasets, the tool enables users to quickly identify differences in key variables before and after an intervention or event. To achieve this, the tool identifies and matches corresponding variables in the pre- and post-survey datasets based on predefined identifiers (e.g., personal ID, IP address, date). Then, the tool performs change calculations for continuous variables by computing the absolute or percentage change (e.g., pre-score to post-score differences), and for categorical variables. It calculates shifts in category frequencies (e.g., how many participants changed categories from pre to post). Finally, the tool aggregates the changes across all participants and presents them as summary statistics, providing a clear overview of the data shifts. The tool eliminates the need for manual calculations or complex statistical analysis, making it more accessible for researchers with varying levels of expertise.
The tool is optimized for analysis of one or more time points. However, if the dataset is not longitudinal, another variable can be substituted for time, thus creating cross-tabulation. In this case, users can use it to compare the distribution of males and females across different counties or analyze educational attainment by gender, with the tool automatically generating a summary that shows these outputs. The tool can also aid in analyzing pre- and post-scores in relation to nominal variables, such as gender and age. When continuous variables, such as age, are used, the tool performs numerical analysis if the variable contains only numeric values. It does not automatically transform continuous variables into categorical ones. However, if non-numeric text is present in a column intended for numerical analysis, the tool defaults to treating that variable as categorical to prevent errors. In the end, the tool aggregates the data and displays information for the selected variable combinations. This process resembles a simplified crosstab output, providing a quick and clear overview of the data’s structure.
3.2. Statistical Summary and Descriptive Note
The automated data analysis tool incorporates a statistical summary feature that computes and displays key summary statistics such as frequencies, summary stats (min, max, median, mean), percentages, etc. On the backend, the tool performs these calculations by first categorizing the dataset based on the selected variables. For each variable, it counts the occurrence (frequency) of each category within the dataset, then calculates the relative proportion (percentage) of each category by dividing the frequency of that category by the total number of observations. These computed values are then presented in an easily interpretable format, enabling users to quickly grasp the distribution and relative proportions of data points. For example, if a dataset contains a ‘Gender’ variable, the tool will count how many occurrences of ‘Male’ and ‘Female’ exist, then compute the percentage distribution of each within the total sample.
Additionally, the tool provides a descriptive note that dynamically generates a summary of the dataset’s key characteristics, including central tendencies and data completeness. The backend algorithm first scans the dataset to identify essential properties such as the number of variables, missing data points, and value ranges. In practice, the tool automatically identifies and reports missing values and inconsistencies across all variables, regardless of whether there is one missing value or one hundred. The tool consistently flags these issues in the descriptive notes to ensure comprehensive data reporting.
3.3. Cleaning and Missing Data
Missing data represent a critical concern in paired-sample and repeated-measures designs, especially in pre-test–post-test analyses commonly used in community-based research. A key challenge arises when participants provide data at only one time point, resulting in incomplete pairs that cannot be included in the analysis. This type of missing data, often due to participant dropout, is referred to as mortality and represents a threat to internal validity (Campbell and Stanley 1963). This can introduce systematic bias if the characteristics of those who drop out differ meaningfully from those who remain, potentially distorting the interpretation of intervention effects.
Recognizing this issue, the tool flags and excludes incomplete records, ensuring that only valid paired responses are analyzed. In this regard, this tool streamlines the data cleaning process in repeated-measures analyses by automating the handling of missing or incomplete data, such as missing survey responses, unanswered, duplicated, or no pre-test questions. It significantly reduces the time senior analysts spend on routine data cleaning tasks and allows junior analysts to focus more on interpreting results rather than managing data issues. The tool automatically identifies and processes missing data by excluding incomplete records and provides a summary of the number of participants removed due to missing data. This automation ensures more efficient data preparation, reducing the likelihood of errors typically encountered by those new to working with real-world datasets.
3.4. User Evaluation and Feedback
The following are practical examples using the tool with data from various fields of study by two different users at a research center primarily focused on social sciences and community-based projects.
3.4.1. First User
The first user demonstrated three distinct ways the survey analyzer supported their projects: demographic analysis, baseline reporting, and pre/post-test evaluation.
The first project, the Safe Family Collaborative, involved the analysis of demographic frequencies from survey data focused on injury prevention among families with young children in rural, low-income areas. The second project, the Social Emotional Learning Program, focused on enhancing middle school students’ life skills and awareness around substance use. Baseline data from 420 students across three schools were analyzed (see Supplementary S1 for data preparation). The final project, the Stroke Initiative and related programs, analyzed outcomes related to health, academic performance, and family well-being across several participant groups, including stroke patients, students, and parents (see Supplementary S2 for data preparation). All data sources for these projects consisted of anonymized pre- and post-surveys collected by community partners and were shared in Excel format. The files were organized by entity and measurement, resulting in multiple rows per participant. Global identifiers were used to consistently code individual participants across measurements (Table S1).
3.4.2. Second User
This tool was used by an organization as a practitioner tool to obtain timely feedback about student outcomes which demonstrated its valuable applications for practitioners involved in continuous monitoring, training evaluations, and more. The Excel data files were used to check for duplicate entries to ensure the information was for the current reporting period, and to verify that the data had been transported correctly (e.g., numbers sometimes appear as dates). After completing these steps, pre- and post-analyses were conducted on data across different projects (Table S2).
4. Discussion
The tool has been used in community-based education research to evaluate programs aimed at improving student outcomes, such as after-school initiatives. In health research, it has supported the analysis of community health programs by assessing pre- and post-intervention data. Its ability to simplify statistical analyses without requiring specialized expertise makes it ideal for community-based research, where time and resources are limited and actionable insights are essential.
As Aliberti et al. (2023) explained, the first step in data collection is calculating descriptive statistics, which helps summarize and interpret data and guides the selection of statistical tools for further analysis. In this regard, this newly developed automated tool features a statistical summary function designed to minimize manual data handling. It provides users, regardless of their statistical expertise, with an accessible view of data distribution and basic insights. For social science researchers, particularly those who do not require advanced techniques such as hypothesis testing or regression modeling, this tool offers a user-friendly and efficient way to identify patterns, detect errors, and recognize trends, ultimately enhancing the understanding of how the dataset evolves.
The ability to easily compare demographic factors such as sex, county, or education allows researchers to draw meaningful conclusions about how these variables intersect, supporting more nuanced insights into social, economic, and cultural trends. In this regard, the crosstab functionality of this tool is highly valuable for exploring relationships between categorical variables, particularly in the context of community research studies focused on areas like health and societal issues. By automating the process of cross-tabulation, this tool enables users to quickly identify and analyze complex associations and dependencies in their data. In community-based research, such as health assessments or social issue studies, the tool’s ability to perform quick crosstab and central tendency analyses makes it an ideal resource for needs assessments. It can be used both as a standalone tool or as part of larger research projects to derive meaningful insights from categorical data in an efficient manner.
Given the tool’s ability to perform both pre- and post-intervention analysis, it demonstrates significant potential for social impact assessment, a process that manages social issues across the entire project lifecycle, from pre-conception to post-closure (Vanclay 2019). Evaluating pre- and post-intervention outcomes is a commonly used approach in research (Dziadkowiec 2024), which further enhances the tool’s relevance for supporting comprehensive assessments. Social impact assessment, as defined by Esteves et al. (2012), focuses on managing the social challenges of development, highlighting the tool’s applicability in these fields. It enables researchers and practitioners to assess changes in key variables over time, thereby supporting evidence-based decision making in areas such as public policy, community development, education, and health interventions. This is particularly useful for community-based research, where understanding the impact of specific programs, policies, or changes in the community is essential. In this case, researchers can easily compare participants responses before and after a community initiative and evaluate shifts in attitudes, behaviors, or knowledge. This capability improves the efficiency of assessing program effectiveness by enabling the extraction of valuable insights with minimal effort through simple, automated tools. This automated tool is designed to avoid unnecessary complexity, which can overwhelm users with excessive features. This aligns with the findings of Rahman et al. (2017), who concluded that the complexity of build automation tools has less impact on their usage than their integration with existing workflows and tools, suggesting that improved integration can enhance their adoption.
The decision to exclude statistical tests, such as p-values, from this tool was made deliberately, considering the intended user base and the potential for misinterpretation of results. In this regard, the tool provides users with the ability to make cursory comparisons between categories, even when those categories have low frequencies. It also avoids encouraging users to make formal decisions about accepting or rejecting hypotheses based on such limited data. It enables new trainers and students to extract key insights from data, rather than feeling overwhelmed by complex statistical methods. The exclusion of inferential statistical functions from the tool was an intentional design choice, aligning with its primary goal of supporting community-based users in conducting preliminary data exploration. In many practical settings, such as formative evaluations or routine monitoring, descriptive statistics are sufficient to identify trends, assess program reach, and inform immediate decisions. The tool also serves as a foundational resource for users developing data literacy by offering a means to review and interpret data before pursuing more advanced analyses. While inferential methods are essential for research aimed at publication or causal inference, this tool prioritizes accessibility and transparency for everyday use by practitioners, educators, and community partners. In this way, it helps bridge the gap between academic research and applied data use.
This approach fosters statistical self-efficacy and positive attitudes toward statistics (Finney and Schraw 2003; Walker and Brakke 2017), helping users solve problems and build confidence in their statistical abilities (Mantooth et al. 2021).
The ability to view the variable names immediately upon uploading a CSV file is a helpful feature of the automated data analysis tool. This function offers users a clear understanding of the data’s structure and format right from the start. By exposing the names of variables upfront, the tool helps users quickly grasp the anatomy of the dataset, including the types and scope of the information it contains. This early insight is crucial for making informed decisions about how to approach data cleaning, transformation, and analysis. It also aids in identifying potential issues, such as inconsistencies or missing values before diving into more complex analytical steps, thus streamlining the preparatory phase and enhancing the overall analysis process.
Providing a descriptive note about the dataset is another feature particularly beneficial for users without an extensive background in data analysis. This descriptive note not only helps users understand the dataset’s key characteristics but also serves as a diagnostic tool in identifying potential issues within the data or the analysis process. In the event of errors or discrepancies, the descriptive note provides clear insights and enables users to quickly pinpoint the source of the problem and take corrective actions. This feature allows users to quickly understand key data trends (Maravelakis 2019), identify and address potential issues in real-time, and reduce the complexity of troubleshooting, thereby improving the overall efficiency and accuracy of the analysis process.
5. Conclusions
This automated data analysis tool offers several key benefits. Its ease of use makes it accessible to users without advanced coding skills, providing a quicker and more understandable way to analyze data. The tool also ensures easy interpretation of results by clearly reporting the number of participants excluded due to missing data and offering key summary statistics, such as the minimum, maximum, median, mean etc. Additionally, it is open access, free of cost, and designed for users without specialized training in statistics, making it accessible to a wider audience. From an organizational perspective, the tool reduces the workload of statisticians and provides valuable learning opportunities for student workers and interns, enhancing both efficiency and skill development within the research centers. When grant work requires quick analysis to assess program effectiveness (pre and post), the tool facilitates faster analysis and enables timely delivery of results, ultimately supporting more efficient program evaluation and decision making.
Another positive aspect of this tool is its applicability in community-based research, where researchers often face unique challenges in data analysis. By fostering positive attitudes toward statistics and reducing statistics anxiety, the tool supports more inclusive and effective research outcomes. The positive reception of this automated tool in community-based research highlights its adaptability and potential for widespread use, particularly in fields like education, health and other societal issues. This tool fills a unique gap in the landscape of data analysis software, offering a balance of ease-of-use and practicality, which is particularly valuable for those seeking quick and reliable insights without the intricacies of more sophisticated platforms.
The tool is designed as a learning resource for students and as an accessible analysis option for community partners without formal training in data analysis. It focuses on essential tasks such as descriptive summaries and pre/post comparisons, making it suitable for users seeking simple, effective ways to engage with their data. Its value lies not in replacing advanced statistical software but in complementing it and meeting the needs of users who might otherwise avoid data analysis due to its perceived complexity. By removing the need for specialized statistical knowledge or familiarity with technical terms like p-values, the tool allows users to concentrate on interpreting results rather than navigating complex analytical procedures. While it does not support inferential modeling or advanced visualization, it effectively serves its purpose as a tool for basic descriptive and exploratory analyses.
Although the tool is designed to prioritize simplicity and user-friendliness, several limitations should be acknowledged in its current form. Its functionality may fall short for users who require advanced statistical procedures, such as regression modeling, hypothesis testing, or more sophisticated data visualization techniques. The limited options for customization in reporting and visualization may not fully accommodate the varied demands of complex research contexts. Moreover, integrating enhanced visualizations remains a challenge, as doing so risks compromising the accessibility and intuitive design of the tool. Another constraint lies in the tool’s restricted data input format. Currently, it only accepts CSV files, which may hinder interoperability for users accustomed to working with alternative formats such as Excel, SPSS, or JSON. The tool also imposes a 30 MB file size limit, which may affect usability in community-based research that deals with larger datasets. Finally, while variable selection is supported, the tool lacks built-in capabilities for data transformations such as combining categories or reordering factor levels. As a result, users may need to perform these tasks externally prior to analysis. However, future versions aim to enhance the limitations. Planned improvements include addressing issues related to CSV file compatibility, thereby reducing formatting errors and improving data import reliability. Additionally, efforts are underway to simplify and organize output such as presenting results in clean, interpretable tables to help users quickly grasp key findings. The next version will also explore options for data recoding and computing variables, further supporting users in managing and preparing their data. These enhancements will be carefully designed to extend analytical capabilities while preserving the tool’s core focus on user-friendliness and clarity.
Supplementary Materials
The following supporting information can be downloaded at: https://www.mdpi.com/article/10.3390/socsci14060346/s1.
Author Contributions
Conceptualization, J.B., M.H. and W.J.; methodology, J.B. and M.H.; software, J.B.; validation, J.B., M.H. and A.P.D.R.; formal analysis, J.B. and M.H.; investigation, J.B. and M.H.; resources, J.B., W.J. and K.M.; data curation, J.B. and M.H.; writing—original draft preparation, J.B., M.H., A.P.D.R., R.A. and W.J.; writing—review and editing, J.B., M.H., A.P.D.R., R.A., W.J., and K.M.; visualization, J.B., M.H. and A.P.D.R.; supervision, J.B., M.H., W.J. and K.M.; project administration, J.B., M.H., W.J. and K.M.; funding acquisition, W.J., K.M. and J.B. All authors have read and agreed to the published version of the manuscript.
Funding
This research was funded by the U.S. Department of Education, Office of Elementary and Secondary Education, Leflore Promise Community, grant number S215N210019.
Institutional Review Board Statement
Not applicable.
Informed Consent Statement
Not applicable.
Data Availability Statement
The original contributions presented in this study are included in the article/supplementary material. Further inquiries can be directed to the corresponding author.
Acknowledgments
The authors would like to express their sincere gratitude to McKinlee Deutsch for her generous assistance in proofreading the manuscript. Her meticulous review and insightful suggestions significantly enhanced the clarity and overall quality of the paper. We also extend our heartfelt thanks to Shuai Yuan and Joseph Patrick Branson for their valuable assistance with the software and GitHub section of this project. Their support and guidance were instrumental in helping us navigate technical challenges and strengthen the technical foundation of our work.
Conflicts of Interest
The authors declare no conflict of interest.
Note
| 1 | This automated tool was developed with long-term applicability, aiming to support broader use beyond the scope of this study. Its complete source code is publicly available through an open-access GitHub repository: https://github.com/umccre/autoanalyzer, accessed on 24 January 2024. Version 1. |
References
- Abbasnasab Sardareh, Sedigheh, Gavin T. L. Brown, and Paul Denny. 2021. Comparing four contemporary statistical software tools for introductory data science and statistics in the social sciences. Teaching Statistics: An International Journal for Teachers 43: 1–10. [Google Scholar] [CrossRef]
- Adeney, Katharine, and Sean Carey. 2009. Contextualising the teaching of statistics in political science. Politics 29: 193–200. [Google Scholar] [CrossRef]
- Ali, Zulfiqar, and S. Bala Bhaskar. 2016. Basic statistical tools in research and data analysis. Indian Journal of Anaesthesia 60: 662–69. [Google Scholar] [CrossRef]
- Aliberti, Sara, Francesca D’Elia, and Domenico Cherubini. 2023. Tips for statistical tools for research methods in exercise and sport sciences. Physical Education Theory and Methodology 3: 20. [Google Scholar] [CrossRef]
- Altman, Douglas G. 1998. Statistical reviewing for medical journals. Statistics in Medicine 17: 2661–74. [Google Scholar] [CrossRef]
- Ashour, Laith. 2024. A review of user-friendly freely-available statistical analysis software for medical researchers and biostatisticians. Research in Statistics 2: 2322630. [Google Scholar] [CrossRef]
- Babones, Salvatore. 2016. Interpretive quantitative methods for the social sciences. Sociology 50: 453–69. [Google Scholar] [CrossRef]
- Brezavšček, Alenka, Petra Šparl, and Anja Žnidaršič. 2017. Factors influencing the behavioural intention to use statistical software: The perspective of Slovenian students of social sciences. Eurasia Journal of Mathematics, Science and Technology Education 13: 953–86. [Google Scholar] [CrossRef]
- Campbell, Donald T., and Julian C. Stanley. 1963. Experimental and Quasi-Experimental Designs for Research. Chicago: Rand-McNally. [Google Scholar]
- Denny, Dawn L., Glenda Lindseth, Fada Faan, Thomas Petros, and Justin A. Berg. 2024. Teaching statistics online: Comparing competency-based and traditional learning. Teaching and Learning in Nursing 19: e170–e75. [Google Scholar] [CrossRef]
- Dziadkowiec, Oliwier. 2024. Statistical methods for pre-post intervention design. Journal of Obstetric, Gynecologic & Neonatal Nursing 53: 9–13. [Google Scholar] [CrossRef]
- Esteves, Ana Maria, Daniel Franks, and Frank Vanclay. 2012. Social impact assessment: The state of the art. Impact Assessment and Project Appraisal 30: 34–42. [Google Scholar] [CrossRef]
- Finney, Sara J., and Gregory Schraw. 2003. Self-efficacy beliefs in college statistics courses. Contemporary Educational Psychology 28: 161–86. [Google Scholar] [CrossRef]
- Flicker, Sarah, Beth Savan, Brian Kolenda, and Matto Mildenberger. 2008. A snapshot of community-based research in Canada: Who? What? Why? How? Health Education Research 23: 106–14. [Google Scholar] [CrossRef] [PubMed]
- García Garmendia, J. L., and F. Maroto Monserrat. 2017. Interpretation of statistical results. Medicina Intensiva 42: 370–79. [Google Scholar] [CrossRef]
- GNU Project. 2021. PSPP. Version 3 of the License. Boston: Free Software Foundation. Available online: https://www.gnu.org/software/pspp/ (accessed on 20 May 2025).
- Greenwood, Darren C., and Jennifer V. Freeman. 2015. How to spot a statistical problem: Advice for a non-statistical reviewer. BMC Medicine 13: 270. [Google Scholar] [CrossRef]
- Gupta, Rupa Z. 2024. Statistical tools for social sciences: A comprehensive review and analysis. Journal of Emerging Technologies and Innovative Research 11: 34–38. Available online: https://www.jetir.org (accessed on 20 May 2025).
- Hergenrather, Kenneth C., Steve Geishecker, Maureen McGuire-Kuletz, David J. Gitlin, and Scott D. Rhodes. 2010. An introduction to community-based participatory research. Rehabilitation Education 24: 225–38. [Google Scholar] [CrossRef]
- JASP Team. 2020. JASP, Version 0.13.1; Computer software. Available online: https://jasp-stats.org/community-vision-and-goals/ (accessed on 20 May 2025).
- Kangiwa, Belllo Ibrahim, Ibrahim Muhammad Ladan, Hamza Sunusi, Saadatu Nassarawa, Akilu Sabo, Muhammad, and Aminu Umar. 2024. Free and Open-Source Software for Data Analysis: Leveraging the Potentials of JASP, Jamovi and PSPP in Nigeria Tertiary Institutions. International Journal of Multidisciplinary Research in Science, Technology and Innovation 3: 1–8. [Google Scholar]
- Kittle, Marian A. 2014. Trends in the use of statistical tools in educational research articles. The Journal of Educational Research 38: 34–46. [Google Scholar] [CrossRef]
- MacInnes, John. 2009. Proposals to Support and Improve the Teaching of Quantitative Research Methods at Undergraduate Level in the UK. Swindon: Economic and Social Research Council. [Google Scholar]
- MacInnes, John. 2015. Quantitative Methods Strategic Advisor Report. Swindon: Economic and Social Research Council. [Google Scholar]
- Mantooth, Renae, Ellen L. Usher, and Abigail M. A. Love. 2021. Changing classrooms bring new questions: Environmental influences, self-efficacy, and academic achievement. Learning Environments Research 24: 519–35. [Google Scholar] [CrossRef]
- Maravelakis, Petros. 2019. The use of statistics in social sciences. Journal of Humanities and Applied Social Sciences 1: 87–97. [Google Scholar] [CrossRef]
- Masuadi, Emad, Mohamud Mohamud, Muhannad Almutairi, Abdulaziz Alsunaidi, Abdulmohsen K. Alswayed, and Omar F. Ald-hafeeri. 2021. Trends in the usage of statistical software and their associated study designs in health sciences research: A bibliometric analysis. Cureus 13: e12639. [Google Scholar] [CrossRef] [PubMed]
- Parker, Jonathan. 2010. Undergraduate research-methods training in political science: A comparative perspective. PS: Political Science & Politics 43: 121–25. [Google Scholar] [CrossRef]
- Parker, Jonathan. 2019. Quantitative methods in the social sciences. In A Handbook for Teaching and Learning in Higher Education. London: Routledge, pp. 302–18. [Google Scholar]
- Rahman, Akond, Asif Partho, David Meder, and Laurie Williams. 2017. Which factors influence practitioners’ usage of build automation tools? Paper presented at the 2017 IEEE/ACM 3rd International Workshop on Rapid Continuous Software Engineering (RCoSE), Buenos Aires, Argentina, May 22; pp. 20–26. [Google Scholar] [CrossRef]
- Rajasekar, D., and Rajesh Verma. 2013. Research Methodology. Bengaluru: Archers & Elevators Publishing House. [Google Scholar]
- Ribeiro, Laura M. M., and J. A. Sarsfield Cabral. 1999. The use and misuse of statistical tools. Journal of Materials Processing Technology 92–93: 288–92. [Google Scholar] [CrossRef]
- Shepherd, Melissa A., and Elizabeth J. Richardson. 2024. Opting for open-source? A review of free statistical software programs. Teaching Statistics 46: 53–63. [Google Scholar] [CrossRef]
- Sterk, Claire E., and Kirk W. Elifson. 2004. Qualitative methods in community-based research. In Community-Based Health Research: Issues and Methods. New York: Springer Publishing Company, pp. 133–51. [Google Scholar]
- Turner, Kenneth J., and Paul S. Lambert. 2015. Workflows for quantitative data analysis in the social sciences. International Journal of Software Tools for Technology Transfer 17: 321–38. [Google Scholar] [CrossRef]
- Vanclay, Frank. 2019. Reflections on social impact assessment in the 21st century. Impact Assessment and Project Appraisal 38: 126–31. [Google Scholar] [CrossRef]
- Walker, Elizabeth Reisinger, and Karen Brakke. 2017. Undergraduate psychology students’ efficacy and attitudes across introductory and advanced statistics courses. Scholarship of Teaching and Learning in Psychology 3: 132–40. [Google Scholar] [CrossRef]
- Wandersman, Abraham. 2003. Community science: Bridging the gap between science and practice with community-centered models. American Journal of Community Psychology 31: 227–42. [Google Scholar] [CrossRef]
- Williams, Malcolm, Geoff Payne, Liz Hodgkinson, and Donna Poade. 2008. Does British sociology count? Sociology students’ attitudes toward quantitative methods. Sociology 42: 1003–21. [Google Scholar] [CrossRef]
- Wu, Yukun, and Le Zhang. 2011. Comparison of two academic software packages foranalyzing two-dimensional gel images. Journal of Bioinformatics and Computational Biology 9: 775–94. [Google Scholar] [CrossRef] [PubMed]
- Yau, Jessie Ho-Yin, Edwin Lok Yan Wong, Hotinpo Sky Kanagawa, Tianyin Liu, Gloria Hoi Yan Wong, and Terry Yat Sang Lum. 2024. Effectiveness of community-based participatory research (CBPR) interventions on mental health outcomes: A systematic review. Social Science & Medicine 363: 117491. [Google Scholar] [CrossRef]
Disclaimer/Publisher’s Note: The statements, opinions and data contained in all publications are solely those of the individual author(s) and contributor(s) and not of MDPI and/or the editor(s). MDPI and/or the editor(s) disclaim responsibility for any injury to people or property resulting from any ideas, methods, instructions or products referred to in the content. |
© 2025 by the authors. Licensee MDPI, Basel, Switzerland. This article is an open access article distributed under the terms and conditions of the Creative Commons Attribution (CC BY) license (https://creativecommons.org/licenses/by/4.0/).