Abstract
Eliminating extreme poverty and reducing poverty levels among marginalized groups are essential to achieving the Sustainable Development Goals. Despite broad national-level studies on multidimensional poverty, there is a lack of specific research focusing on marginalized groups, particularly ethnic minorities. This study aims to identify the multidimensional poverty status and determinants of poverty among ethnic farmers in Thua Thien Hue province, Central Vietnam, based on a survey of 283 respondents. The Alkire–Foster method was utilized to measure multidimensional poverty, and a binary logistic regression model was applied to identify the determinants of multidimensional poverty among farmers. The results showed that about 33.57% of households are in multidimensional poverty. The deprivation in the six poverty dimensions was inconsistent, with income at 68.23%, education and health at 9.69%, housing at 7.19%, information access at 3.65%, and living conditions at 1.56%. Nine factors significantly affect the multidimensional poverty of ethnic minority households, including the age of household heads, family size, number of shocks, labor, farm size, tropical livestock units (TLUs), customers, traded input values, and training participation. Diversifying livelihood activities, building the infrastructure system to have closer access to central markets and main roads, and enhancing the capacity of farmers to cope with shocks are necessary solutions to reduce the multidimensional poverty of ethnic minorities in Central Vietnam.
1. Introduction
Poverty reduction is crucial in achieving the Sustainable Development Goals (SDGs), particularly Goal 1, which aims to eradicate extreme poverty and reduce overall poverty levels (United Nations 2015). Reducing poverty can improve individuals’ well-being, promote economic growth, and foster sustainable development (World Bank 2020). The COVID-19 pandemic has recently highlighted that inadequate political, economic, and social interventions, which contribute to the vulnerability of poor populations, may exacerbate poverty levels in various countries worldwide, particularly in the poorest ones (Pereira and Oliveira 2020). Civil society organizations, the private sector, and especially governments must work together to implement effective poverty reduction strategies appropriate to the specific needs of different regions and communities (Mensah 2019).
Vietnam has made significant strides in reducing poverty and achieving sustained economic growth over the past few decades (ADB 2018). Specifically, the poverty rate based on the national poverty line (USD 3.2 a day) decreased from 58% in 1990 to 9.8% in 2016 (World Bank 2018). Despite this progress, significant challenges remain in reducing poverty among ethnic minorities. Recent studies have demonstrated that ethnic minority households face persistent disadvantages in poverty reduction efforts (Tri and Anh 2022). The national poverty reduction report spanning the years 1993 to 2006 indicates that the poverty rate for the Kinh and Hoa group, which constitutes the majority group, experienced a significant reduction from 54% in 1993 to 10% in 2006. In contrast, the poverty rate for minority groups decreased from 84% in 1993 to 52% in 2006 (Baulch 2010). Furthermore, the sustainability of poverty reduction efforts among ethnic minorities is inferior to that of the Kinh and Hoa group, as evidenced by the fact that 20% of ethnic minorities who escaped poverty in 2016 subsequently fell back into poverty in 2018, whereas the rate of re-poverty for the Kinh and Hoa group was only 7.6% (UNDP 2018). Notably, although ethnic minorities account for only 15% of Vietnam’s population, they represented 47% and 73% of the total poor in 2012 and 2016, respectively (Pimhidzai 2018). Assessing the situation of poverty and finding solutions to reduce poverty has always been the top concern of society, and poverty reduction for ethnic minority households is even more critical (Cuong et al. 2015).
Poverty is multifaceted, and most studies of multidimensional poverty use the Multidimensional Poverty Index (MPI), which was proposed by the United Nations Development Program (UNDP) and the Oxford Poverty and Human Development Initiative (OPHI). The MPI includes three poverty dimensions, namely education, health, and living standards, with ten indicators measuring the multidimensional poverty of a population (Alkire and Foster 2011). Based on the MPI framework, countries adjust the indicators to suit their specific context, called national MPIs. Data to calculate the national MPIs are collected through macro surveys conducted by governmental agencies (Alkire and Foster 2010; Alkire et al. 2017; Chen et al. 2019; Mare et al. 2022). However, the absence of an income indicator in the MPI framework has caused controversy because income poverty and the lack of essential social services are believed to be interconnected when examining the multifaceted nature of poverty (Yang and Mukhopadhaya 2017; World Bank 2018; Wang et al. 2021). The World Bank emphasized the necessity of including the monetary aspect as one of the dimensions in measuring multidimensional poverty and used the Multidimensional Poverty Measure (MPM). The MPM measures three dimensions: access to education, basic infrastructure, and the monetary headcount ratio at the USD 2.15 international poverty line (World Bank 2018). From 2015, the Vietnam Government issued the poverty line for 2016–2020 based on the multidimensional poverty measuring approach (Vietnam Government 2015). The national Multidimensional Poverty Index (MPI-VN) combines income deprivation and restricted access to essential social services, including education, healthcare, housing, water and sanitation, and information access. While the controversy about whether to include an income indicator when calculating multidimensional poverty continues, the lack of research into multidimensional poverty at the micro level shows the challenge of understanding the standards between nations, regions, and local governments in calculating poverty. There are a few research studies on multidimensional poverty at the micro level, including those of Bagli (2019), Nishimwe-Niyimbanira (2019), and Wang et al. (2021). Still, the contexts of those studies make it difficult to generalize their findings to Southeast Asian regions.
In Vietnam, data for calculating the MPI-VN are integrated into the macro data of the Vietnam Household Living Standard Surveys (VHLSSs) which the Vietnam government conducts every year to assess the implementation of the Comprehensive Strategy on Growth and Poverty Reduction, as well as to contribute to the evaluation of the Sustainable Development Goals (SDGs) and the socioeconomic development goals of Vietnam (GSO 2019). As a result, most of the recent multidimensional poverty studies often focus on macro data from VHLSSs and limit the research to that specific context (Bui and Erreygers 2020). These studies describe the general deprivation status of localities (provinces/regions) and population groups (rural/urban or between ethnic groups) (Pham et al. 2020; Thao 2019; Vu and Nguyen 2021). Pham and Mukhopadhaya (2022) researched the multidimensional poverty status of ethnic minorities and examined the significant impact of social capital in reducing poverty at both the community and household levels. The UNDP (2018) investigated the multidimensional poverty status of ethnic minorities in Vietnam and identified a widening gap in expenditure and income between the Kinh and ethnic minority groups. Although these previous studies have focused on ethnic minorities, they have relied on macro-level data and have been inconsistent in the indicators used to measure multidimensional poverty within that specific context. This inconsistency makes it difficult to conduct an in-depth analysis of poverty and identify its underlying causes in a particular socioeconomic context. Consequently, multidimensional poverty-reducing solutions for marginalized groups, particularly ethnic minorities, face challenges in terms of practical feasibility. While reducing poverty at the local level is essential, recent reports about multidimensional poverty in some Southeast Asian countries such as Thailand, the Philippines, Laos, Cambodia, and Indonesia have only focused on the national level (UNDP and OPHI 2022; OPHI 2020; Network Multidimensional Poverty Peer 2021). Addressing this challenge requires researchers to conduct more specific and in-depth studies in specific contexts. This study aims to adjust the MPI to fit the specific context and investigate the multidimensional poverty status of ethnic minority communities in the central regions of Vietnam. The findings will expand our understanding of these communities’ social and economic aspects and identify the factors affecting multidimensional poverty, providing a foundation for suggesting feasible solutions to mitigate poverty among ethnic minority communities. Moreover, this study will contribute indicators for researching multidimensional poverty at the micro level for specific contexts in Southeast Asian countries and other developing countries worldwide.
This paper is structured into seven sections. Section 2 concerns the theoretical underpinnings of multidimensional poverty, such as its definition, measurement, and determinants. Section 3 describes the study area. Section 4 outlines the methodology used to collect and analyze data. The obtained results are presented in Section 5, while Section 6 discusses the significant findings. Lastly, in Section 7, the paper concludes by summarizing multidimensional poverty status and deriving policy implications for future research.
2. Theoretical Background
2.1. Definition
The concept of poverty is multifaceted and subject to variations across different socioeconomic backgrounds and over time within the same society (Dartanto and Otsubo 2015). Generally, poverty is the deprivation of several human dimensions, including basic needs, income, capability, and social inclusion (Jansen et al. 2015). The economic approach to poverty typically measures income and consumption, where poor individuals have inadequate income to meet their basic survival needs, such as food, shelter, and clothing (Akindola 2009; Wagle 2002). Capability poverty, on the other hand, encompasses various dimensions such as skills, health, education, and physique and is considered more critical for human well-being than income or consumption of goods and services (Eberharter 2018; Wagle 2002). Apart from income and capability deprivation, people may be considered poor because they are excluded from mainstream political, economic, and cultural activities (Šoltés et al. 2022; Wagle 2002). An individual or a household is classified in multidimensional poverty when their income is insufficient to meet their basic needs, such as food, water, clothing, and shelter; they have inadequate access to social services such as education, healthcare, and security; or they face lack of opportunities and are vulnerable (Sen 1985). Therefore, poverty is a multidimensional concept that can be assessed using multidimensional indicators.
2.2. Multidimensional Poverty Measurement
Multidimensional poverty measurement is crucial in determining and designing programs and policies to reduce poverty. However, the complexity of poverty has led to a plethora of studies on various indicators used to measure multidimensional poverty (Bradshaw and Finch 2003). The Multidimensional Poverty Index (MPI), proposed by the United Nations Development Program (UNDP) and the Oxford Poverty and Human Development Initiative (OPHI), is the most prominent and widely used. MPI measures household poverty in three fundamental aspects, namely education, health, and living standards, and ten indicators (Alkire and Foster 2011). It is the first attempt to provide a concise multidimensional poverty measurement, and many countries have adopted and adapted it in different contexts, known as national MPIs. Researchers have modified Alkire and Foster’s methodology to include additional dimensions and indicators. For instance, Mare et al. (2022) adjusted the method by using 4 dimensions (education, health, living standards, and asset ownership) and 14 indicators to analyze multidimensional rural poverty in Ethiopia. In Taiwan, Chen et al. (2019) used five dimensions (education, medical care, environment, health, employment) and eight indicators to measure multidimensional poverty. The Thailand National MPI comprises four dimensions: education, healthy living, living conditions, and financial security, each with equal weight (Queen Elizabeth House 2020). The Philippine Statistics Authority released an MPI based on the Alkire–Foster method with 13 indicators identified across the following four dimensions: education; health and nutrition; housing, water, and sanitation; employment (Network Multidimensional Poverty Peer 2021).
Meanwhile, the World Bank emphasizes the necessity of including the monetary aspect as one of the dimensions. Although monetary poverty strongly correlates with deprivation in other domains, the correlation is far from perfect (Diaz-Bonilla and Sabatino 2022). The Poverty and Shared Prosperity 2020 report (World Bank 2020) shows that over a third of those experiencing multidimensional poverty are not captured by the monetary headcount ratio, consistent with prior report editions (World Bank 2018). The Multidimensional Poverty Measure (MPM) aims to understand poverty beyond economic deprivation, which remains the focal point of the World Bank’s global poverty monitoring, by including access to education, basic infrastructure, and the monetary headcount ratio at the USD 2.15 international poverty line. The three MPM dimensions, as well as indicators under each dimension, are weighted equally. Individuals or households are considered multidimensionally poor if they are deprived of indicators whose weight adds up to 1/3 or more (World Bank 2018).
In Vietnam, the government periodically issues national poverty reduction targets as a part of its development strategies. It revises the poverty lines to evaluate poverty rates for the next five-year period. The national Multidimensional Poverty Index (MPI-VN) for 2016–2020 combines income deprivation and restricted access to essential social services based on the Alkire–Foster approach. The MPI-VN includes five dimensions of poverty: education, healthcare, housing, water and sanitation, and information access. Each dimension has two indicators that carry equal weight (1/10) and depict the deprivation of access to basic social services. Based on the MPI-VN, households that fall into one of two categories are classified as experiencing multifaceted poverty. The first category includes households whose average monthly per capita income is below VND 700,000 (the poverty line of Vietnam), which indicates they are undoubtedly in multidimensional poverty. The second category includes households with an average monthly per capita income ranging from VND 700,000 to VND 1,000,000 that are deprived of 3/10 or more essential social service indicators (Vietnam Government 2015).
This study uses an index with a set of indicators listed in Table 1 to measure the multidimensional poverty level of the ethnic communities in the study site. These indicators were developed based on the OPHI and UNDP (Alkire and Foster 2011), the World Bank (World Bank 2018), and Vietnam Government (Vietnam Government 2015). The index, thus, includes six leading indicators: income, education, health care, housing, living conditions, and access to information. The income dimension includes only one indicator with 1/3 of the total weight, and the remaining five dimensions account for the rest of the weight, i.e., 2/3. Each dimension has two equally weighted indicators (1/15) (Table 1).

Table 1.
Multidimensional poverty dimensions, indicators, weights, and cutoff.
2.3. Determinants of Multidimensional Poverty
Previous studies have considered multidimensional poverty from micro and macro perspectives. From a micro standpoint, the demographic characteristics of the household head (age, gender, and education level), family size, number of employees, number of dependents, marital status, employment, household assets, and location of residence are determinants of household poverty (Dartanto and Otsubo 2015; Dika et al. 2021; Jiao 2021). In general, a typical poor family in rural areas would be a household headed by an elderly and uneducated female, with a large family with many young children, poor health, and few household assets.
From a macro perspective, economic, social, and geographical factors are considered significant determinants of poverty. Previous studies have emphasized that a high urbanization rate leads to the lack of provision of good public services such as transport, education, and health care, a fact which is considered a significant cause of poverty in regions with different economic conditions (Ren et al. 2017; Sanchez 2008). Meanwhile, sociologists often emphasize social capital or institutional relationships, which are often seen as primary factors of poverty (Liu et al. 2021; Pham and Mukhopadhaya 2022). Regarding geography and environmental factors, most studies emphasize geographical variables (e.g., terrain elevation, slope, soil quality, scale, road network, travel distance and time) as obstacles to poor people moving to main roads and town centers (Feeny et al. 2021; González et al. 2022; Imai et al. 2011; Que et al. 2022). Moreover, environmental variables related to severe pollution of habitats are significant poverty determinants (Feeny et al. 2021).
The ethnic minorities who live in remote areas, particularly mountains, face more challenges in accessing medical, education, and other essential services due to geographical and topographical location, natural disasters, and climate change (Nguyen and Leisz 2021; Sen et al. 2020). Research by Imai et al. (2011) reveals that ethnic minorities are poorer because they have more disadvantaged household characteristics than the majority. Several factors, such as limited labor, large family size, limited job opportunities, and insufficient motivation to seek education and escape poverty, also contribute to poverty in poor households among ethnic minorities (Nguyen 2018).
3. Study Area
The present investigation was carried out in Thua Thien Hue, a province located in Central Vietnam (Figure 1). The province encompasses a total area of 5058.99 km2 and comprises 1,142,000 people (Thua Thien Hue Statistical Office 2019). The mountainous area occupies about two-thirds of the land area of the region. The ethnic minorities reside in the two mountainous districts of Nam Dong and A Luoi and some communes of Phu Loc and Phong Dien districts, with a cumulative population of 53,671 people, accounting for 31.5% of the population in the mountainous region. The ethnic minority population consists of 21,279 Pa Co people accounting for 39.65%, 16,995 Co Tu people accounting for 31.67%, 12,651 Ta Oi people accounting for 23.57%, 1593 Van Kieu people accounting for 2.97%, and other minorities accounting for 2.14% (Thua Thien Hue Statistical Office 2019). The main livelihood activities of ethnic minorities in the study area are agricultural production and forest product collection (Truong et al. 2017). The policy of closing the forest and establishing many protected areas negatively affects forest-based households’ income (Sen et al. 2020). Income from agriculture has become the primary source of income for poor ethnic minority households. However, difficulties in market access due to the fragmented scale of production have been considered among the reasons for low incomes. Moreover, the geographical and topographical conditions of the mountainous areas create many challenges for local people in accessing medical and educational services. Climate change and frequent natural disasters have also caused significant obstacles to people’s living conditions and activities. The above-mentioned natural and social conditions are reasons for the remaining high poverty rate in the area. There are still numerous barriers that need to be investigated in detail to help local people, particularly minority people, to escape from poverty (Truong et al. 2017). Therefore, this study is necessary for developing solutions to reduce multidimensional poverty for the ethnic minority community in the Thua Thien Hue province and to spread the lessons to the other mountainous areas in Vietnam.
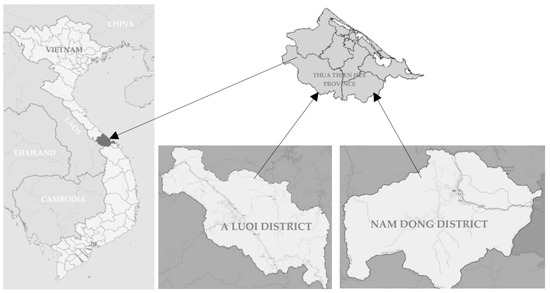
Figure 1.
Location of the study site.
4. Methodology
4.1. Data Collection
For this study, we conducted a cross-sectional survey from January to March 2021. Using Yamane’s formula, we determined 310 samples from 10,652 households with an error of 5.5% in the study area (Yamane 1967). A multistage sampling procedure was employed in this study (De Vaus 2013). In the first stage, 8 communes were randomly selected from 28 communes in Thua Thien Hue province’s mountainous districts, A Luoi and Nam Dong. In the second stage, a systematic random sampling method was applied to select respondents from the list of ethnic households provided by the commune’s agricultural officers. The questionnaire was reviewed by a group of five experts from a university and pre-tested with ten smallholder farmers in the study area. Six trained enumerators were hired to conduct face-to-face interviews with respondents. Each interview lasted 25 to 35 min with language support from local people. After eliminating 27 invalid questionnaires, 283 valid responses were collected (Table 2). We used a purposive sampling technique to select the critical informants for collecting qualitative data. In-depth interviews were conducted with eight commune leaders and two district officials to determine the intensity of the reasons for multidimensional poverty status and find solutions from the local governments. The interviews were performed in a friendly way with familiar questions such as “Please, describe the deprivation of water sources in the community. What do you see poor people do to improve their income? How do you see the local government’s interventions to reduce poverty?”
Table 2.
Overview of valid questionnaires in communes of Thua Thien Hue province.
4.2. Data Analysis
Data were analyzed using Microsoft Excel version 2016 and SPSS version 25.0 (IBM Corp 2017). Descriptive statistics, including percentages, means, standard deviations, minima, and maxima were applied to describe the status of demographic characteristics, livelihood activities, and poverty dimensions of households in the area. We used the Alkire–Foster method to measure the Multidimensional Poverty Index and the binary logistic regression model to determine factors affecting multidimensional poverty.
4.2.1. Multidimensional Poverty Measurement
In this study, the Alkire–Foster method was applied to measure multidimensional poverty (Alkire and Foster 2011; Pham et al. 2020). As is common, three critical stages were applied to perform the measurement: identification, aggregation, and decomposition.
Identification stage: This process includes two steps to identify poor households. First, deprivation in each aspect of multidimensional poverty is determined. If a household’s performance in a specific aspect is not equal to the corresponding deprivation threshold, it is considered deficient. The household deprivation score was the sum of all weighted dimensions (Table 1). Second, a poverty cutoff determines whether a household could be considered multidimensionally poor. It shows how many scores are needed to be considered multidimensionally poor. This study identified a household as multidimensionally poor if its deprivation score is greater than or equal to a given poverty cutoff (k = 0.33) (Alkire and Foster 2011).
Synthesis stage: The aggregation process requires getting a composite index after identifying deprivation in different dimensions of poverty. The Alkire–Foster methodology estimates three indices: the multidimensional poverty headcount ratio (H), the intensity of poverty (A), and the Multidimensional Poverty Index (MPI). They are defined as follows:
The headcount ratio (H) is the proportion of poor households in multiple dimensions. It is calculated as the number of households identified as multidimensionally poor (q) divided by the total number of households (n).
The intensity of poverty (A) indicates the average deprivation share among the household poor, and it can be calculated by adding up the deprivation scores of the poor and dividing them by the total number of poor households (q).
The Multidimensional Poverty Index (MPI) indicates the adjusted multidimensional headcount ratio. It can be calculated as the sum of the weighted deprivations only of the poor households, divided by the number of total households (n).
Decomposition stage: Decomposition by dimensions reveals the percentage contributions of different indicators to the multidimensional poverty index. The percentage contributions can be displayed as follows:
where S is the percentage contribution of each indicator to the Multidimensional Poverty Index (MPI), Wi is the weight of the i-th indicator, and CHi is the percentage of households deprived of the i-th indicator.
4.2.2. Determinants of Multidimensional Poverty
The binary logistic regression model was used to determine factors affecting smallholder farmers’ multidimensional poverty. This methodology has been used to assess the effects of multiple factors on the incidence of multidimensional poverty because the dependent variable is binary (0;1) (Shanthi 2019). The logistic regression technique predicts the probability of an outcome and estimates the effects of independent variables on these odds. The odds ratio (Pi/1 − Pi) is the ratio of the probability of a household being categorized as multidimensional poverty (Pi) compared to the probability of a household being classified as multidimensional non-poverty (1 − Pi). The binary logistic regression model is specified by the following equation:
where Li is the log of odds ratio, Pi/(1 − Pi) = odds ratio, Pi = 1 if household i is poor, and Pi = 0 if household i is not poor, X1, X2,…, and Xn are independent variables, B0 is the intercept, and B1, B2,…, and Bn are regression coefficients.
5. Results
5.1. Socioeconomic Characteristics of Ethnic Minority Households
Socioeconomic characteristics of ethnic minority households in Thua Thien Hue province are considered based on critical factors, including demographic characteristics, assets, livelihood activities, institutional factors, and external impacts relative to the life and production of farmers. The overall results of the respondents’ characteristics are shown in Table 3. The average age and years of schooling of the interviewed ethnic smallholders were 45.46 and 5.58 years, respectively. The average family size, number of laborers, and number of dependents in a household were 4.67, 2.9, and 1.46 people, respectively. The mean size of farmland was 4.9 Sao, while the average number of livestock owned by a smallholder farmer was 1.77 TLUs. Agricultural activities are essential (presenting an average of 4.43 activities), while the number of off-farm household income-generating activities was only 1.1. The mean food expenditure and traded input value for an ethnic household were VND 32.8 million and VND 6.08 million, respectively. The proportion of ethnic farmers participating in vocational education was relatively low (only 6%), compared with the ethnic farmers who participated in training programs at 60%. The mean value of the distance from the main road to the farms of respondents was 1.82 km. On average, an ethnic farmer had 6.72 customers who regularly bought agricultural produce. Respondents reported that they suffered on average 5.11 shocks in the last year.
Table 3.
Socioeconomic characteristics of respondents (n = 283).
5.2. Multidimensional Poverty of Ethnic Minority Households
5.2.1. Multidimensional Poverty Estimates for Different Poverty Cutoffs
The poverty cutoff (k) reflects the share of weighted indicators in which a household must be deprived to be classified as multidimensionally poor (Alkire and Santos 2014). Figure 2 presents the results estimated for various poverty cutoffs (k) of the three indices, namely multidimensional headcount ratio (H), Multidimensional Poverty Index (MPI), and multidimensional poverty intensity (A). When the k was increased from k = 0.1 to k = 0.7, there were two trends: the H and MPI lines decreased, but the A line increased in importance. For illustration, when the cutoff is lowest (k = 0.1), H and MPI are highest at 0.678 and 0.212, but A is the weakest at 0.313. When k changed to k = 0.4, both H and MPI decreased at 0.293 and 0.141, but A increased to 0.481. At the highest cutoff (k = 0.7), A is also highest at 0.733, while H and MPI are lowest at 0.007 and 0.005, respectively. The results showed that the multidimensional poverty rate of ethnic minority households in the study area is high. As a fact, households that fall in the range of the cutoffs k = 0.5–0.7 will be deprived in many indicators and easily fall into the extreme multidimensional poverty household group. This finding implies that when conducting poverty reduction programs, these households need to be considered as a priority.
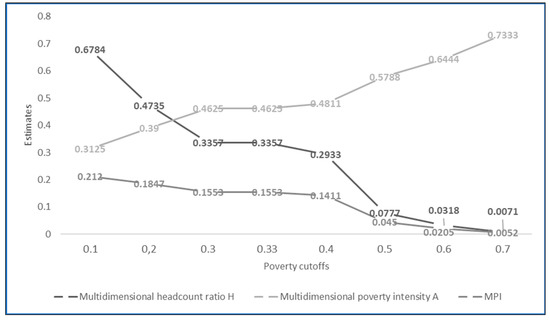
Figure 2.
Multidimensional poverty estimates for different poverty cutoffs.
5.2.2. The Contribution Rate of Indicators to the Multidimensional Poverty Index
Under the cutoff of k = 0.33, the Multidimensional Poverty Index (MPI) was decomposed according to indicators to explain the contribution of deprivations in each dimension or as an indicator of overall poverty. Figure 3 displays the various patterns of deprivation composition. Among the six dimensions, income contributes the largest to multidimensional poverty, accounting for 68.2%; education (adult education and child school attendance) and health (health insurance and access to health services) share the second largest proportion with 9.7%, followed by housing (living area and housing quality) at 7.2%, access to information (use of telecommunications services and assets for information access) at 3.7 %, and living conditions (water sources and latrine) at 1.6%. Among 11 deprivation indicators, the proportion of income (68.2%), adult education, and access to health service and living area (at the same 5.6%) were the four factors that most contributed to the MPI, accounting for 85.2%.
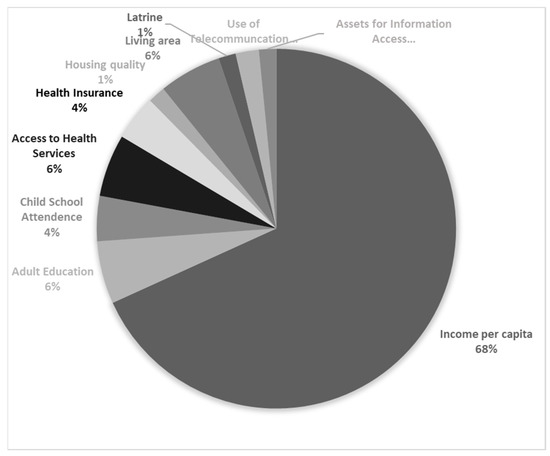
Figure 3.
Contribution of indicators to Multidimensional Poverty Index (k = 0.33).
5.3. Determinants of Multidimensional Poverty of Ethnic Minority Households
The multidimensional poverty determinants were identified using the binary logistic regression model. The dependent variable is a binary variable that shows whether a household is poor. With the poverty line (k = 0.33), the dependent variable corresponds to a value of 1 if the household’s poverty score is higher than the poverty line, and 0 otherwise. The independent variables are socioeconomic and household demographics (Table 3).
The parameters show that the research model fits the data quite well. The value of the chi-square test is 250.063 (with p = 0.000), and the value of −2 log likelihood is 111.121, indicating that the selected model is suitable. The pseudo-R-square values show a high degree of agreement of the observed variables included in the model, with the Cox and Snell R-square (0.587) and Nagelkerke R-square (0.814) being suitable. The Hosmer–Lemeshow test (sig. = 0.236 > 0.05) shows that the model selection is correct, with a correct prediction rate of 92.6% of the observations. The estimates of the logistic regression are presented in Table 4.
Table 4.
Results of a binary logistic regression model.
Results showed that three factors (age of household head, family size, and number of shocks) were significantly positively associated with the likelihood of multidimensional poverty. Households with a higher household head age were more likely to be poor. A one-year increase in household head age may mean a 5.8% growth in the probability of households falling into multidimensional poverty. Households with a big family size had a higher probability of being poor. That indicates that an increase of one person in a household multiplies the odds of multidimensional poverty by 3.37. Households with more shocks had a higher probability of being poor, which means a 99.3% growth in the probability of households falling into multidimensional poverty whenever a household adds one more shock.
Results showed that six factors (labor, farm size, TLUs, customers, traded input value, and participation in training programs) were significantly negatively associated with the likelihood of multidimensional poverty. Households that had more customers were more likely not to be poor. That suggests that having one more customer may mean a 14.1% reduction in the probability of households falling into multidimensional poverty. Households with more labor had a lower probability of being poor. That indicates that an increase of one laborer in a household reduces the odds of multidimensional poverty by 3.37 times. Households with more assets, such as land and livestock, had a lower probability of being poor, which means a 15.6% and 71.5% decrease in the likelihood of households falling into multidimensional poverty when a household increased by one Sao farmland and one TLU, respectively.
Meanwhile, some variables, such as gender of household head, education level of household head, vocational education of household head, number of dependents, number of agricultural activities, number of off-farm income sources, food expenditure, and distance from the main road, were not statistically significantly associated with the probability of being multidimensionally poor.
6. Discussion
This study adapted the multidimensional poverty index, including income and non-income indicators, to achieve an insight into the multidimensional poverty of the mountainous ethnic minorities in Central Vietnam. There are four main results of interest in this study, which are discussed in turn.
First, the results demonstrated that the headcount ratio of multidimensional poverty (k = 0.33) was 33.57%. This result was consistent with the reports of the proportion of the multidimensional poverty rate in the A Luoi district (39%) (A Luoi People’s Committee 2021). Still, it was also higher than the results of some previous studies in the same area (Northern and Coastal Central) at 6.6% (Duc 2019) and all of the country at 11.8% (Pham et al. 2020). This can be explained by the fact that the population in this study are ethnic minorities, who have more disadvantages than prevalent populations in the area and the whole country. Compared with some countries in Southeast Asia, the multidimensional poverty rate in this study is slightly lower than Cambodia’s rural multidimensional poverty at 42.8% (Alkire et al. 2021); however, it is 2 times higher compared to a report from Thailand, with a headcount ratio of 17.6% (Rawirin and Suphannada 2022), and a report from Malaysia, with a headcount ratio of 16.7% (Simler and Ali Ahmad 2021). The result equal to 1.96% (Alkire and Fang 2019) from China using panel data from multiple waves of the Health and Nutrition Survey showing the distribution of poor people, both multidimensional and income, is inconsistent with this study.
Second, although monetary deprivation was applied to establish poverty reduction policies, income indicators rarely merged with the deprivation of essential social service indicators to measure multidimensional poverty in previous studies in Vietnam (Nguyen 2018; Pham and Mukhopadhaya 2018; Thao 2019). The result of this study revealed that when combining the income dimension with health, education, and living standard dimensions, the contribution rate of income to the multidimensional poverty rate was the highest and most dominant. This finding aligns with the findings of Bui and Erreygers (2020), who discovered that consumption deprivation significantly leads to multifaceted inequality. The result from this study is inconsistent with the research of Wang et al. (2021), which indicated that income contributed less (15.03%) than health (34.27%) and education (27.45%) to multidimensional poverty of people in mountainous areas of southeast China.
Third, the result of the determinants of multidimensional poverty, examined by a logistic regression model to detect the effects of micro factors on the probability of being in poverty, showed that three factors, namely the age of the household head, family size, and the number of shocks suffered, were significantly positively associated with the likelihood of multidimensional poverty. Households with a higher household head’s age were more likely to be poor. A similar finding was reported in the research of Diem and Van Hoang (2018) and Dika et al. (2021). On the contrary, the finding of this study is not in line with the results of Jiao (2021) and Wang et al. (2021), who indicated that multidimensional poverty is insignificantly positively aligned with the age of the household head. The research of Garza-Rodriguez et al. (2021) found a significant negative relationship between the age of the household head and multidimensional poverty in Mexico that is inconsistent with this study. Households with a big family size had a higher probability of being poor. This finding is consistent with the research of Hoang and Vu (2021), but it is inconsistent with the results of other studies (Diem and Van Hoang 2018; Ho et al. 2022; Nguyen 2018) which found that the number of people negatively impacts the poverty rate. Based on empirical research from South Asian countries, Abbas et al. (2020) indicated two results: on the one hand, household size negatively impacts multidimensional energy poverty in Afghanistan and Bangladesh (inconsistent with this study); on the other hand, household size impacted multidimensional energy poverty positively in India, Nepal, the Maldives, and Pakistan (consistent with this study). Households experiencing more shocks had a higher probability of being poor in this study, which is consistent with the research of Feeny et al. (2021), who found that temperature shocks lead to increases in the measure of multidimensional energy poverty. Our findings are also consistent with the studies of Imai et al. (2011) and Pham et al. (2021), who showed that households living in vulnerable high mountains had a higher probability of being poor than those living in other regions.
Finally, the results showed that six factors, labor, farm size, TLUs, customers, traded input value, and participation in training programs, were significantly negatively associated with multidimensional poverty. Households that had more customers were more likely not to be poor. This can be explained by the fact that with more customers, the households increased their opportunities to integrate into the market. This helped them sell agricultural products quickly so as to enhance their incomes, significantly reducing multidimensional poverty. More customers aligning with being easy-to-connect to markets was found in previous studies (Abdullah et al. 2019; Hoang 2021; Rubhara and Mudhara 2019). Households with more labor had a lower probability of being poor in this study, consistent with the research of Jiao (2021). The result of households with more assets, such as land and livestock, having a lower probability of being poor is in line with previous studies (Do et al. 2020; Tran et al. 2014) but is inconsistent with the research of Dika et al. (2021) who found that land size and TLUs were significantly positively associated with the multidimensional poverty of a household.
7. Conclusions
Our study has applied an aggregated approach to measure multidimensional poverty, combining six poverty dimensions of income, education, health, housing, living conditions, and information access contextualized for a case study in Vietnam. The headcount ratio of multidimensional poverty of ethnic minorities in the study was high, and the deprivation of income indicator contributed the largest to the poverty rate. Nine factors affected the multidimensional poverty of ethnic minority households in the study area, namely the age of household head, family size, number of shocks, household labor, farm size, TLUs, customers, traded input value, and participation in training programs. To reduce multidimensional poverty for ethnic communities, this study recommends the following: First, farmers should diversify livelihood activities for themselves, including non-agricultural and agricultural households, increasing the number of livestock and improving the quality of agricultural land. Second, it is necessary to improve the infrastructure system to have closer access to central markets, main roads, and intervillage and intercommunal transportation systems. Third, agricultural mechanization and farmers’ collaboration should be promoted to reduce transaction costs while providing better market access. Finally, related departments, particularly the agricultural extension system at district and provincial levels, should help farmers increase access to credit organizations and participate in training programs to improve the capacity of farmers to cope with shocks.
Author Contributions
Conceptualization, D.T.N., L.T.H.S., H.G.H. and J.M.; methodology, D.T.N. and H.G.H.; investigation, D.T.N. and N.A.T.T.; data curation, D.T.N. and N.A.T.T.; writing—original draft preparation, D.T.N.; writing—review and editing, D.T.N., L.T.H.S., T.N.T. and J.M.; visualization, T.N.T. and N.A.T.T.; supervision, L.T.H.S., H.G.H. and J.M. All authors have read and agreed to the published version of the manuscript.
Funding
This research was funded by Asia-Pacific Network for Global Change Research (Grant No. CBA2022-05SY-Nguyen) and Hue University (Grant No. DHH2021-02-152). The APC was funded by the Internal Grant Agency (IGA) of the Faculty of Tropical AgriSciences, Czech University of Life Sciences (IGA20233111), the Strong Research Group Program of Hue University (Grant No. NCM DHH.2019.02), and Grants (#169430, #194004) from the Swiss Programme for Research on Global Issues for Development (R4D Programme) co-funded by the Swiss National Science Foundation (SNF) and the Swiss Agency for Development and Cooperation (SDC).
Institutional Review Board Statement
The University of Agriculture and Forestry, Hue University, follow the rule that IRB (Institutional Review Board) approval is not required for PhD theses conducted within our institution.
Informed Consent Statement
Informed consent was obtained from all subjects involved in the study.
Data Availability Statement
Not applicable.
Conflicts of Interest
The authors declare no conflict of interest. The funders had no role in the study’s design; in the collection, analyses, or interpretation of data; in the writing of the manuscript; or in the decision to publish the results.
References
- A Luoi People’s Committee. 2021. Socio-Economic Report in A Luoi District in 2021 and Planning in 2022. Available online: https://aluoi.thuathienhue.gov.vn/ (accessed on 24 October 2022).
- Abbas, Khizar, Shixiang Li, Deyi Xu, Khan Baz, and Aigerim Rakhmetova. 2020. Do socioeconomic factors determine household multidimensional energy poverty? Empirical evidence from South Asia. Energy Policy 146: 111754. [Google Scholar] [CrossRef]
- Abdullah, Fazli Rabbi, Riaz Ahamad, Sajjad Ali, Abbas Ali Chandio, Waqar Ahmad, Aasir Ilyas, and Izhar Ud Din. 2019. Determinants of commercialization and its impact on the welfare of smallholder rice farmers by using Heckman’s two-stage approach. Journal of the Saudi Society of Agricultural Sciences 18: 224–33. [Google Scholar] [CrossRef]
- Asian Development Bank. 2018. Key Indicators for Asia and the Pacific. Available online: https://www.adb.org/publications/key-indicators-asia-and-pacific-2018 (accessed on 10 October 2022).
- Akindola, Rufus B. 2009. Towards a definition of poverty: Poor people’s perspectives and implications for poverty reduction. Journal of Developing Societies 25: 121–50. [Google Scholar] [CrossRef]
- Alkire, Sabina, and Yingfeng Fang. 2019. Dynamics of Multidimensional Poverty and Uni-dimensional Income Poverty: An Evidence of Stability Analysis from China. Social Indicators Research 142: 25–64. [Google Scholar] [CrossRef]
- Alkire, Sabina, and James E. Foster. 2010. Designing the Inequality-Adjusted Human Development Index. Available online: https://www.ophi.org.uk/wp-content/uploads/ophi-wp37.pdf (accessed on 25 September 2022).
- Alkire, Sabina, and James Foster. 2011. Counting and multidimensional poverty measurement. Journal of Public Economics 95: 476–87. [Google Scholar] [CrossRef]
- Alkire, Sabina, and Maria Emma Santos. 2014. Measuring Acute Poverty in the Developing World: Robustness and Scope of the Multidimensional Poverty Index. World Development 59: 251–74. [Google Scholar] [CrossRef]
- Alkire, Sabina, Jose Manuel Roche, and Ana Vaz. 2017. Changes over time in multidimensional poverty: Methodology and results for 34 countries. World Development 94: 232–49. [Google Scholar] [CrossRef]
- Alkire, Sabina, Usha Kanagaratnam, and Nicolai Suppa. 2021. The global Multidimensional Poverty Index (MPI) 2021, OPHI MPI Methodological Note 51, Oxford Poverty and Human Development Initiative, University of Oxford. Available online: https://www.ophi.org.uk/wp-content/uploads/OPHI_MPI_MN_51_2021_4_2022.pdf (accessed on 15 January 2023).
- Bagli, Supravat. 2019. Multidimensional Poverty: An Exploratory Study in Purulia District, West Bengal. Economic Affairs 64: 517–27. [Google Scholar] [CrossRef]
- Baulch, Bob. 2010. Ethnic minority poverty in Vietnam. Chronic Poverty Research Centre Working Paper. Available online: https://ssrn.com/abstract=1719672 (accessed on 5 October 2022).
- Bradshaw, Jonathan, and Naomi Finch. 2003. Overlaps in Dimensions of Poverty. Journal of Social Policy 32: 513–25. [Google Scholar] [CrossRef]
- Bui, Thi Kim Thanh, and Guido Erreygers. 2020. Multidimensional Inequality in Vietnam, 2002–2012. Economies 8: 29. [Google Scholar] [CrossRef]
- Chen, Ke-Mei, Chao-Hsien Leu, and Te-Mu Wang. 2019. Measurement and Determinants of Multidimensional Poverty: Evidence from Taiwan. Social Indicators Research 145: 459–78. [Google Scholar] [CrossRef]
- Cuong, Nguyen Viet, Phung Duc Tung, and Daniel Westbrook. 2015. Do the poorest ethnic minorities benefit from a large-scale poverty reduction program? Evidence from Vietnam. The Quarterly Review of Economics and Finance 56: 3–14. [Google Scholar] [CrossRef]
- Dartanto, Teguh, and Shigeru Thomas Otsubo. 2015. Measurements and determinants of multifaceted poverty: Absolute, relative, and subjective poverty in Indonesia. In Globalization and Development Volume III. London: Routledge, pp. 99–143. Available online: https://www.jica.go.jp/jica-ri/publication/workingpaper/wp_54.html (accessed on 10 January 2023).
- De Vaus, David. 2013. Surveys in Social Research. London: Routledge. [Google Scholar] [CrossRef]
- Diaz-Bonilla, Carolina, and Carlos Sabatino. 2022. April 2022 Update to the Multidimensional Poverty Measure: What’s New. Global Poverty Monitoring Technical Note. Washington, DC: World Bank, License: CC BY 3.0 IGO. Available online: http://localhost:4000//entities/publication/84e8c4bd-38c7-59a8-b91d-c715b5f5243f (accessed on 10 January 2023).
- Diem, Hoang Xuan, and Tran Van Hoang. 2018. Multidimensional Poverty in Vietnam: Evidence from a Rural Household Survey. WIDER Working Paper 2018/127. Helsinki: UNU-WIDER. [Google Scholar] [CrossRef]
- Dika, Galgalo, Degefa Tolossa, and Shiferaw Muleta Eyana. 2021. Multidimensional poverty of pastoralists and implications for policy in Boorana rangeland system, Southern Ethiopia. World Development Perspectives 21: 100293. [Google Scholar] [CrossRef]
- Do, Truong Lam, Ngoc Ninh Ho, Dinh Thao Tran, and Xuan Trach Nguyen. 2020. Does cattle Production Contribute to Improving Welfare of Poor Ethnic Minority Households in Central Vietnam? Livestock Research for Rural Development. vol. 32, Article #161. Available online: http://www.lrrd.org/lrrd32/10/thaok32161.html (accessed on 9 March 2023).
- Duc, Lo Thi. 2019. Multidimensional poverty in Viet Nam: Sustainable poverty reduction 2016–2020. Multidimensional Poverty Peer Network. Dimensions Number 8, December 2019. Available online: https://mppn.org/wp-content/uploads/2019/12/Dimensions8_EN_webversion-4.pdf (accessed on 18 November 2022).
- Eberharter, Veronika V. 2018. Capability Deprivation, and the Intergenerational Transmission of Social Disadvantages: Empirical Evidence from Selected Countries. Social Sciences 7: 253. [Google Scholar] [CrossRef]
- Feeny, Simon, Trong-Anh Trinh, and Anna Zhu. 2021. Temperature shocks and energy poverty: Findings from Vietnam. Energy Economics 99: 105310. [Google Scholar] [CrossRef]
- Garza-Rodriguez, Jorge, Gustavo A. Ayala-Diaz, Gerardo G. Coronado-Saucedo, Eugenio G. Garza-Garza, and Oscar Ovando-Martinez. 2021. Determinants of Poverty in Mexico: A Quantile Regression Analysis. Economies 9: 60. [Google Scholar] [CrossRef]
- González, Fernando Antonio Ignacio, Maria Emma Santos, and Silvia London. 2022. Multidimensional Poverty and Natural Disasters in Argentina (1970–2010). Journal of Human Development and Capabilities 23: 206–27. [Google Scholar] [CrossRef]
- GSO. 2019. Statistical Yearbook of Vietnam. Hanoi: Statistical Publishing House. [Google Scholar]
- Ho, Ngoc Ninh, Truong Lam Do, Dinh Thao Tran, and Trung Thanh Nguyen. 2022. Indigenous pig production and welfare of ultra-poor ethnic minority households in the Northern mountains of Vietnam. Environment, Development and Sustainability 24: 156–79. [Google Scholar] [CrossRef]
- Hoang, Hung Gia. 2021. Factors affecting commercialisation of vegetables by central Vietnamese smallholders. African Journal of Science, Technology, Innovation and Development 14: 896–905. [Google Scholar] [CrossRef]
- Hoang, Viet Ngu, and Duc Cuong Vu. 2021. On the effects of trade on multidimensional deprivation: Evidence from Vietnam’s rice growing households. Economic Analysis and Policy 71: 476–85. [Google Scholar] [CrossRef]
- IBM Corp. 2017. IBM SPSS Statistics for Windows. version 25.0. Armonk: IBM Corp. [Google Scholar]
- Imai, Katsushi S, Raghav Gaiha, and Woojin Kang. 2011. Vulnerability and poverty dynamics in Vietnam. Applied Economics 43: 3603–18. [Google Scholar] [CrossRef]
- Jansen, Ada, Mariana Moses, Stanford Mujuta, and Derek Yu. 2015. Measurements and determinants of multifaceted poverty in South Africa. Development Southern Africa 32: 151–69. [Google Scholar] [CrossRef]
- Jiao, Wenxian. 2021. Analyzing multidimensional measures of poverty and their influences in China’s Qinba Mountains. Chinese Journal of Population, Resources and Environment 18: 14–221. [Google Scholar] [CrossRef]
- Liu, F., L. Li, Y. Zhang, Q. T. Ngo, and W. Iqbal. 2021. Role of education in poverty reduction: Macroeconomic and social determinants form developing economies. Environmental Science and Pollution Research 28: 63163–77. [Google Scholar] [CrossRef]
- Mare, Yohannes, Yishak Gecho, and Melkamu Mada. 2022. Assessment of multidimensional rural poverty in Burji and Konso area, Southern Ethiopia. International Review of Economics 69: 49–69. [Google Scholar] [CrossRef]
- Mensah, Justice. 2019. Sustainable development: Meaning, history, principles, pillars, and implications for human action: Literature review. Cogent Social Sciences 5: 1653531. [Google Scholar] [CrossRef]
- Network Multidimensional Poverty Peer. 2021. Philippines Launches a National MPI: Oxford Poverty and Human Development Initiative. Available online: https://mppn.org/philippines-launches-a-national-mpi/ (accessed on 12 January 2023).
- Nguyen, Ha Hong. 2018. The analysis of factors affecting multi-dimensional poverty of the Khmer Ethnic in Tra Vinh Province, Vietnam. International Journal of Economics and Financial Issues 8: 158. [Google Scholar]
- Nguyen, Yen Thi Bich, and Stephen J. Leisz. 2021. Determinants of livelihood vulnerability to climate change: Two minority ethnic communities in the northwest mountainous region of Vietnam. Environmental Science & Policy 123: 11–20. [Google Scholar]
- Nishimwe-Niyimbanira, Rachel. 2019. Income poverty versus multidimensional poverty: Empirical insight from Qwaqwa. African Journal of Science, Technology, Innovation and Development 12: 631–41. [Google Scholar] [CrossRef]
- OPHI. 2020. Thailand Country Briefing. Multidimensional Poverty Index Data Bank; Oxford: Oxford Poverty and Human Development Initiative, University of Oxford. Available online: www.ophi.org.uk/multidimensional-poverty-index/mpi-country-briefings/ (accessed on 12 January 2023).
- Pereira, Marcos, and Ana Marlucia Oliveira. 2020. Poverty and Food Insecurity May Increase as the Threat of COVID-19 Spreads. Public Health Nutrition 23: 3236–40. [Google Scholar] [CrossRef]
- Pham, Anh Thu Quang, and Pundarik Mukhopadhaya. 2018. Measurement of Poverty in Multiple Dimensions: The Case of Vietnam. Social Indicators Research 138: 953–90. [Google Scholar] [CrossRef]
- Pham, Anh Thu Quang, and P. Mukhopadhaya. 2022. Multidimensionl Poverty and The Role of Social Capital in Poverty Alleviation Among Ethnic Groups in Rural Vietnam: A Multilevel Analysis. Social Indicators Research 159: 281–317. [Google Scholar] [CrossRef] [PubMed]
- Pham, Anh Thu Quang, P. Mukhopadhaya, and H. Vu. 2020. Targeting Administrative Regions for Multidimensional Poverty Alleviation: A Study on Vietnam. Social Indicators Research 150: 143–89. [Google Scholar] [CrossRef]
- Pham, Anh Thu Quang, Pundarik Mukhopadhaya, and Ha Vu. 2021. Estimating poverty and vulnerability to monetary and non-monetary poverty: The case of Vietnam. Empirical Economics 61: 3125–77. [Google Scholar] [CrossRef]
- Pimhidzai, Obert. 2018. Climbing the Ladder: Poverty Reduction and Shared Prosperity in Vietnam. Washington, DC: World Bank Group. Available online: http://documents.worldbank.org/curated/en/206981522843253122/Climbing-the-ladder-poverty-reduction-and-shared-prosperity-in-Vietnam (accessed on 5 December 2022).
- Que, Nguyen Dang, Nguyen Van Song, Tran Duc Thuan, Dinh Van Tien, Thai Van Ha, Nguyen Thi Minh Phuong, Nguyen Thi Xuan Huong, and Pham Thi Lan Phuong. 2022. How temperature shocks impact energy poverty in Vietnam: Mediating role of financial development and environmental consideration. Environmental Science and Pollution Research 29: 56114–27. [Google Scholar] [CrossRef] [PubMed]
- Queen Elizabeth House. 2020. Global MPI Country Briefing 2020: Thailand (East Asia and the Pacific). Nutrition, 1, 6. Available online: https://ophi.org.uk/wp-content/uploads/CB_THA_2020.pdf (accessed on 15 January 2023).
- Rawirin, Techaploog, and Lowhachai Suphannada. 2022. National MPI of Thailand: The compilation process and the policy uses. Dimensions 13: 3. Available online: https://mppn.org/wp-content/uploads/2022/02/EN-Dimensions-Magazine-Nr13-February2022-3.pdf (accessed on 12 January 2023).
- Ren, Zhoupeng, Yong Ge, Jinfeng Wang, Jingyao Mao, and Qi Zhang. 2017. Understanding the inconsistent relationships between socioeconomic factors and poverty incidence across contiguous poverty-stricken regions in China: Multilevel modelling. Spatial Statistics 21: 406–20. [Google Scholar] [CrossRef]
- Rubhara, Theresa, and Maxwell Mudhara. 2019. Commercialization and its determinants among smallholder farmers in Zimbabwe. A case of Shamva District, Mashonaland Central Province. African Journal of Science, Technology, Innovation and Development 11: 711–18. [Google Scholar] [CrossRef]
- Sanchez, Thomas W. 2008. Poverty, policy, and public transportation. Transportation Research Part A: Policy and Practice 42: 833–41. [Google Scholar] [CrossRef]
- Sen, Amartya. 1985. A sociological approach to the measurement of poverty: A reply to Professor Peter Townsend. Oxford Economic Papers 37: 669–76. [Google Scholar] [CrossRef]
- Sen, Le Thi Hoa, Jennifer Bond, Alexandra Winkels, Nguyen Hoang Khanh Linh, and Nguyen Tien Dung. 2020. Climate change resilience and adaption of ethnic minority communities in the upland area in Thừa Thiên-Huế province, Vietnam. NJAS: Wageningen Journal of Life Sciences 92: 1–10. [Google Scholar] [CrossRef]
- Shanthi, R. 2019. Multivariate Data Analysis: Using SPSS and AMOS. Tamil Nadu: MJP Publisher. [Google Scholar]
- Simler, Kenneth, and Zainab Ali Ahmad. 2021. “Multidimensional Poverty in Malaysia,” World Bank Publications—Reports 36392. Washington, DC: The World Bank Group. [Google Scholar]
- Šoltés, Erik, Silvia Komara, and Tatiana Šoltésová. 2022. Exploration of poverty and social exclusion of Slovak population via contrast analysis associated with logit models. Quality & Quantity, 1–27. [Google Scholar] [CrossRef]
- Thao, Nguyen Phuong. 2019. Multi-dimensional poverty of migrant households: Illustrated analysis through Vietnam household living standards survey 2014 and 2016. Hue University Journal of Science: Economics and Development 128: 187–206. [Google Scholar] [CrossRef]
- Thua Thien Hue Statistical Office. 2019. Thua Thien Hue Statistical Yearbook in 2019; Thua Thien Hue: Statistical Publishing House.
- Tran, Quang Van, Sabina Alkire, and Stephan Klasen. 2014. Static and Dynamic Disparities between Monetary and Multidimensional Poverty Measurement: Evidence from Vietnam. OPHI Working Paper 97. Oxford: University of Oxford. [Google Scholar]
- Tri, Nguyen Minh, and Tran Tuan Anh. 2022. Development of the Social Security in Vietnam: Reality and Solutions. Journal of Educational and Social Research 12: 108. [Google Scholar] [CrossRef]
- Truong, Quang Hoang, Duc Ngoan Le, Thi Hoa Sen Le, Thanh Hung Hoang, Chi Tien Vo, Thanh Hien Nguyen, Truong Thi Nguyen, Van Loi Nguyen, Thi Thanh Toan Tran, and Thi Hoa Nguyen. 2017. Livelihood Need Assessment in Quang Nam and Thua Thien Hue provinces: Ecodit-Green Annamites Project in Central Vietnam. Washington, DC: USAID. [Google Scholar]
- UNDP. 2018. Multidimensional poverty in Vietnam: Reducing poverty in All Its Dimensions to Ensure a Good Quality Life for All. Available online: https://www.undp.org/sites/g/files/zskgke326/files/migration/vn/MDP-full-E.pdf (accessed on 12 December 2022).
- UNDP, and OPHI. 2022. Global Multidimensional Poverty Index 2022: Unpacking Deprivation Bundles to Reduce Multidimensional Poverty. Oxford: United Nations Development Programme (UNDP), and Oxford Poverty and Human Development Initiative (OPHI), University of Oxford. [Google Scholar]
- United Nations. 2015. Transforming Our World: The 2030 Agenda for Sustainable Development. Available online: https://sustainabledevelopment.un.org/post2015/transformingourworld (accessed on 20 November 2022).
- Vietnam Government. 2015. Decision 59/2015/QD-TTg Dated November 19, 2015 “On the Issuance of the Multi-Dimensional Poverty Line for the Period 2016–2020. Vietnam Government. Available online: https://datafiles.chinhphu.vn/cpp/files/vbpq/2015/11/59.signed.pdf (accessed on 15 October 2022).
- Vu, Linh Hoang, and Thuy-Anh Nguyen. 2021. Elderly Poverty in Vietnam: Trends and Determinants. Journal of Population and Social Studies 29: 526–43. [Google Scholar] [CrossRef]
- Wagle, Udaya. 2002. Rethinking poverty: Definition and measurement. International Social Science Journal 54: 155–65. [Google Scholar] [CrossRef]
- Wang, Chengchao, Benxiang Zeng, Dongshen Luo, Yuan Wang, Ying Tian, Shanshan Chen, and Xiu He. 2021. Measurements and Determinants of Multidimensional Poverty: Evidence from Mountainous Areas of Southeast China. Journal of Social Service Research 47: 743–61. [Google Scholar] [CrossRef]
- World Bank. 2018. Beyond Monetary Poverty. Washington, DC: World Bank. [Google Scholar] [CrossRef]
- World Bank. 2020. Poverty and Shared Prosperity 2020: Correcting Course: The World Bank. Available online: https://www.worldbank.org/en/publication/poverty-and-shared-prosperity (accessed on 10 December 2022).
- Yamane, Taro. 1967. Statistics: An Introductory Analysis, 2nd ed. New York: Harper and Row. [Google Scholar]
- Yang, Jing, and Pundarik Mukhopadhaya. 2017. Disparities in the level of poverty in China: Evidence from China family panel studies 2010. Social Indicators Research 132: 411–50. [Google Scholar] [CrossRef]


Disclaimer/Publisher’s Note: The statements, opinions and data contained in all publications are solely those of the individual author(s) and contributor(s) and not of MDPI and/or the editor(s). MDPI and/or the editor(s) disclaim responsibility for any injury to people or property resulting from any ideas, methods, instructions or products referred to in the content. |
© 2023 by the authors. Licensee MDPI, Basel, Switzerland. This article is an open access article distributed under the terms and conditions of the Creative Commons Attribution (CC BY) license (https://creativecommons.org/licenses/by/4.0/).