Article

Education for Environmental Justice: The Fordham Regional Environmental Sensor for Healthy Air

1
Department of Physics and Engineering Physics, Fordham University, 441 East Fordham Road, Bronx, NY 10458, USA
2
Department of Biological Sciences, Fordham University, 441 East Fordham Road, Bronx, NY 10458, USA
3
Information Technology, Fordham University, 441 East Fordham Road, Bronx, NY 10458, USA
4
Graduate School of Social Services, Fordham University, 113 West 60th Street, New York, NY 10023, USA
5
Information Technology, Fordham University, 113 West 60th Street, New York, NY 10023, USA
*
Author to whom correspondence should be addressed.
Soc. Sci. 2023, 12(12), 681; https://doi.org/10.3390/socsci12120681
Submission received: 1 September 2023 / Revised: 11 November 2023 / Accepted: 6 December 2023 / Published: 12 December 2023
(This article belongs to the Special Issue Social and Environmental Justice)

Abstract

:
In urban environments, the nonuniform distribution of pollution contributes to disproportionate exposure to harmful pollutants in low-income and high-poverty neighborhoods. Particulate matter, especially of the class PM 2.5 , results from combustion processes which are a main driver for human-caused global warming and climate change. A resulting impact on socio-economically disadvantaged communities like the Bronx, NY is the high incidence of asthma, other respiratory diseases, and cardiovascular disease. This disparity is an environmental justice concern. Project FRESH Air is educating the community through STEM outreach with sensors for monitoring particulate matter, student projects, curriculum development, and wider community engagement in order to educate for environmental justice.

1. Introduction

Recognizing the social and economic disparities in the Bronx community that hosts Fordham University, in Spring 2020 the university launched an initiative aimed at Reimagining Higher Education. This initiative brought together faculty, students, administrators, and community organizers to rethink (and act) on higher education that benefits not only the university but the larger Bronx community.
The Reimagining Initiative was composed of a reading group that studied innovative ideas from other institutions and an incubator group that explored realizable solutions to some of the daunting socio-economic and environmental problems facing the Bronx community.
Our team was part of the incubator group and focused on educating the public about and addressing the impacts associated with anthropogenic climate change. Climate change is often perceived as being a distant problem, both geographically and temporally. However, the impact of the Canadian wildfires on the air quality in the eastern United States in the summer of 2023 drove home the fact that climate change is impacting all of us at this very moment (Barnes et al. 2023; Burton 2023; McArdle et al. 2023; Parisien et al. 2023).
When settling on the approach that our team would take to communicate and educate about the consequences of widespread fossil fuel use, we asked the following question: How do we talk about climate change to one of the poorest communities in New York City? A few degrees of warming several decades away is a low priority when you are living paycheck-to-paycheck, so getting the community to buy in on that premise alone would be a challenge. Our approach targeted the one issue with an immediate impact and which has the potential to worsen: the chronic high incidence of asthma in the Bronx (Hardell et al. 2023; Kaur et al. 2022; Kordit et al. 2020; Orellana et al. 2021; Witonsky et al. 2019).
Asthma is a chronic, inflammatory respiratory disease that is significantly affected by environmental conditions (i.e., indoor and outdoor air quality). The economic burden of asthma is severe, leading to lost productivity and costing the United States over USD 80 billion in 2013, with nearly USD 3 billion in losses due to missed work and school days (Nurmagambetov et al. 2018; Soong et al. 2021). For those living below the poverty line, individual medical costs exceed USD 3500 per annum (Nurmagambetov et al. 2018), or more than 15% of the “poverty line” for a family of four.
The Bronx does not have the worst air quality in New York City (NYC); that distinction goes to midtown Manhattan. However, the population of midtown is largely transient, commuting into the city to work, and the buildings generally have good HVAC systems, making indoor air quality acceptable. Communities in the Bronx and Northern Manhattan (e.g., Hunts Point and Harlem) experience significant emissions from traffic, which, in conjunction with poorly sealed or “leaky” buildings, lead to environmentally driven health hazards such as asthma.
While not subject to the worst air quality, the borough of the Bronx, NY does experience the highest incidence of asthma-related emergency department (ED) visits and hospitalizations in NYC and has the dubious honor of leading the state with nearly 25% of asthma-related deaths state-wide (NY Department of Health 2020). The high incidence of asthma in and around the Bronx and the expectation that as the planet warms and the climate changes, conditions will worsen (Beggs and Bambrick 2005; Patella et al. 2018; Veremchuk et al. 2016) makes this the most suitable approach to engaging the Bronx community and provides a platform through which Fordham University can educate for justice.
The Fordham Regional Environmental Sensor for Healthy Air (FRESH Air) is our resulting Reimagining Incubator project that aims to educate Fordham students and our Bronx and Northern Manhattan community partners on climate change, air quality, and the adverse impacts they face in their environments. Working with middle and high schools and community youth organizations, we have been installing sensors for the measurement of particulate matter. In addition, students are engaged in activities to promote STEM interest, such as constructing their own sensors to learn about the physical principles that underlie the sensors, electronics, coding, data acquisition, and data analysis. FRESH Air is being integrated into the curricula, and students, teachers, and families engage with our team through webinars that showcase the state of the project.
In what follows, we will discuss the different facets of FRESH Air, giving first an overview of the sensor modality and the sensors being used, which include commercially available devices and homemade sensor platforms. The curriculum and webinar outreach will also be detailed. Ultimately, Project FRESH Air aims to empower students and their families with hyperlocal data that can be used to highlight the socio-economic and environmental injustices in their communities and act as a catalyst for change.

2. Particulate Sensors

2.1. Particulate Matter

Before detailing the sensors being used in Project FRESH Air, we will first discuss particulate matter, its impact on health, and its connection to climate change. The sensors that are part of Project FRESH Air measure particular matter (PM) of three different varieties: PM 1 , PM 2.5 , and PM 10 . The numerical value indicates the size of the particles in that class. For example, PM 2.5 , the most widely reported class of PM, comprises particles 2.5  μ m in diameter or smaller. Alternatively, the classes may be reported as coarse (PM 10 ), fine (PM 1 and PM 2.5 ), and ultrafine (PM 0.1 ), but we are primarily interested in fine PM.
While all these PM classes constitute respirable sizes, the extent of their penetration into the respiratory system varies significantly. Coarse particles are relatively large (e.g., pollen, silicates, metals) and aggravate the upper respiratory tract (Brunekreef and Forsberg 2005). Fine PM can make its way deep into the lungs, causing inflammation, and may trigger asthma attacks or lead to cardiovascular disease (Fongsodsri et al. 2021). This class is the primary focus of Project FRESH Air. Ultrafine PM, which we do not directly focus on, is able to get deep into the lungs, cross into the bloodstream, and translocate to essential organs in the body (Nemmar et al. 2002; Schraufnagel 2020). Aside from the potential health impacts alone, the coalescing of ultrafine particles to form fine PM is a major source of PM 2.5 (Schraufnagel 2020).
PM 2.5 is a byproduct of combustion processes. This applies to both indoor and outdoor concentrations (Hadley 2017; Martins and Carrilho da Graça 2018; McDuffie et al. 2021; Singh et al. 2017). In an urban environment, these come from a variety of sources, with the major sources being commercial cooking, motor vehicle traffic, non-road emissions (e.g., construction, industrial equipment), buildings (e.g., heating), and electricity generation. Of these sources, commercial cooking leads with 38% of emissions, while traffic produces 14% of PM 2.5 emissions in NYC (Environmental Protection Agency 2011). Traffic is an important consideration because of the asymmetric distribution of emissions within NYC. Many low-income, high-poverty neighborhoods see a disproportionate amount of motor vehicle traffic, especially commercial traffic associated with large trucks and delivery vehicles from distribution centers. Of the PM 2.5 produced by traffic emissions, nearly 15% originates from trucks and buses (Kheirbek et al. 2016).
The disparity of emissions exposures leads to a disparity in health outcomes and is fundamentally an environmental justice issue (Collins and Grineski 2022; Daouda et al. 2022; Liu et al. 2021; Mikati et al. 2018), which is where FRESH Air and its goal of community outreach and education is to play a role.

2.2. PurpleAir

PurpleAir (http://www.purpleair.com, accessed on 1 September 2023) manufactures low-cost sensors for measuring particulate matter, principally PM 2.5 . These microcontroller-run devices are WiFi-enabled and use two Plantower PMS5003 laser-based particle sensor modules. The two sensor modules provide redundancy and a check on the PM levels being monitored (Barkjohn et al. 2021). PurpleAir sensors have become widely dispersed and comparisons of collocated sensors with ambient air quality regulatory instruments have demonstrated a correlation that may be corrected for to achieve parity with Environmental Protection Agency (EPA) instruments (Barkjohn et al. 2021). In Project FRESH Air, we use the PA-II model. When connected to the internet at the site, the sensors will upload their measurements to the PurpleAir server. If the sensor is registered as public, then the air quality data will be available to anyone who accesses the website.
Figure 1 shows a screenshot of the map taken from the PurpleAir website on the morning of 28 July 2023. This region of the map focuses on the Bronx and Northern Manhattan; however, thousands of PurpleAir sensors are distributed worldwide, creating an extensive network for hyperlocal air quality measurements and making it possible to explore air quality in many cities and countries around the globe. The colored circles on the map are the publicly accessible sensors. The colors provide a visual indicator of the local air quality and range from green (good) to dark purple (dangerous), and the number within the circle is the air quality index (AQI) value for that sensor. Indoor sensors have a black ring around them, while outdoor sensors are simply solid circles.
Users can see a 72 h time series by clicking on the sensor on the map. This produces a plot for the site’s two particulate sensor modules (channels A and B). Figure 2 shows the plot generated by PurpleAir for an outdoor PA-II sensor located outside a physics lab in Freeman Hall, located on the Rose Hill campus of Fordham University in the Bronx, NY.
The AQI data during the previous 72 h period for any publicly available sensor may be downloaded from the PurpleAir website via the map. PurpleAir sensors are widely available and dispersed throughout the world, giving insight into hyperlocal air quality conditions around the globe.

2.3. FRESH Air Projects

Project FRESH Air seeks to educate and empower students and the community with local air quality data and through hands-on STEM activities. The most effective educational approaches involve hands-on experiences to reinforce the principles of the subject. To this end, we developed sensor kits that are constructed by students in our partner schools that are both in-class and after-school projects.

2.3.1. Incubator Prototype

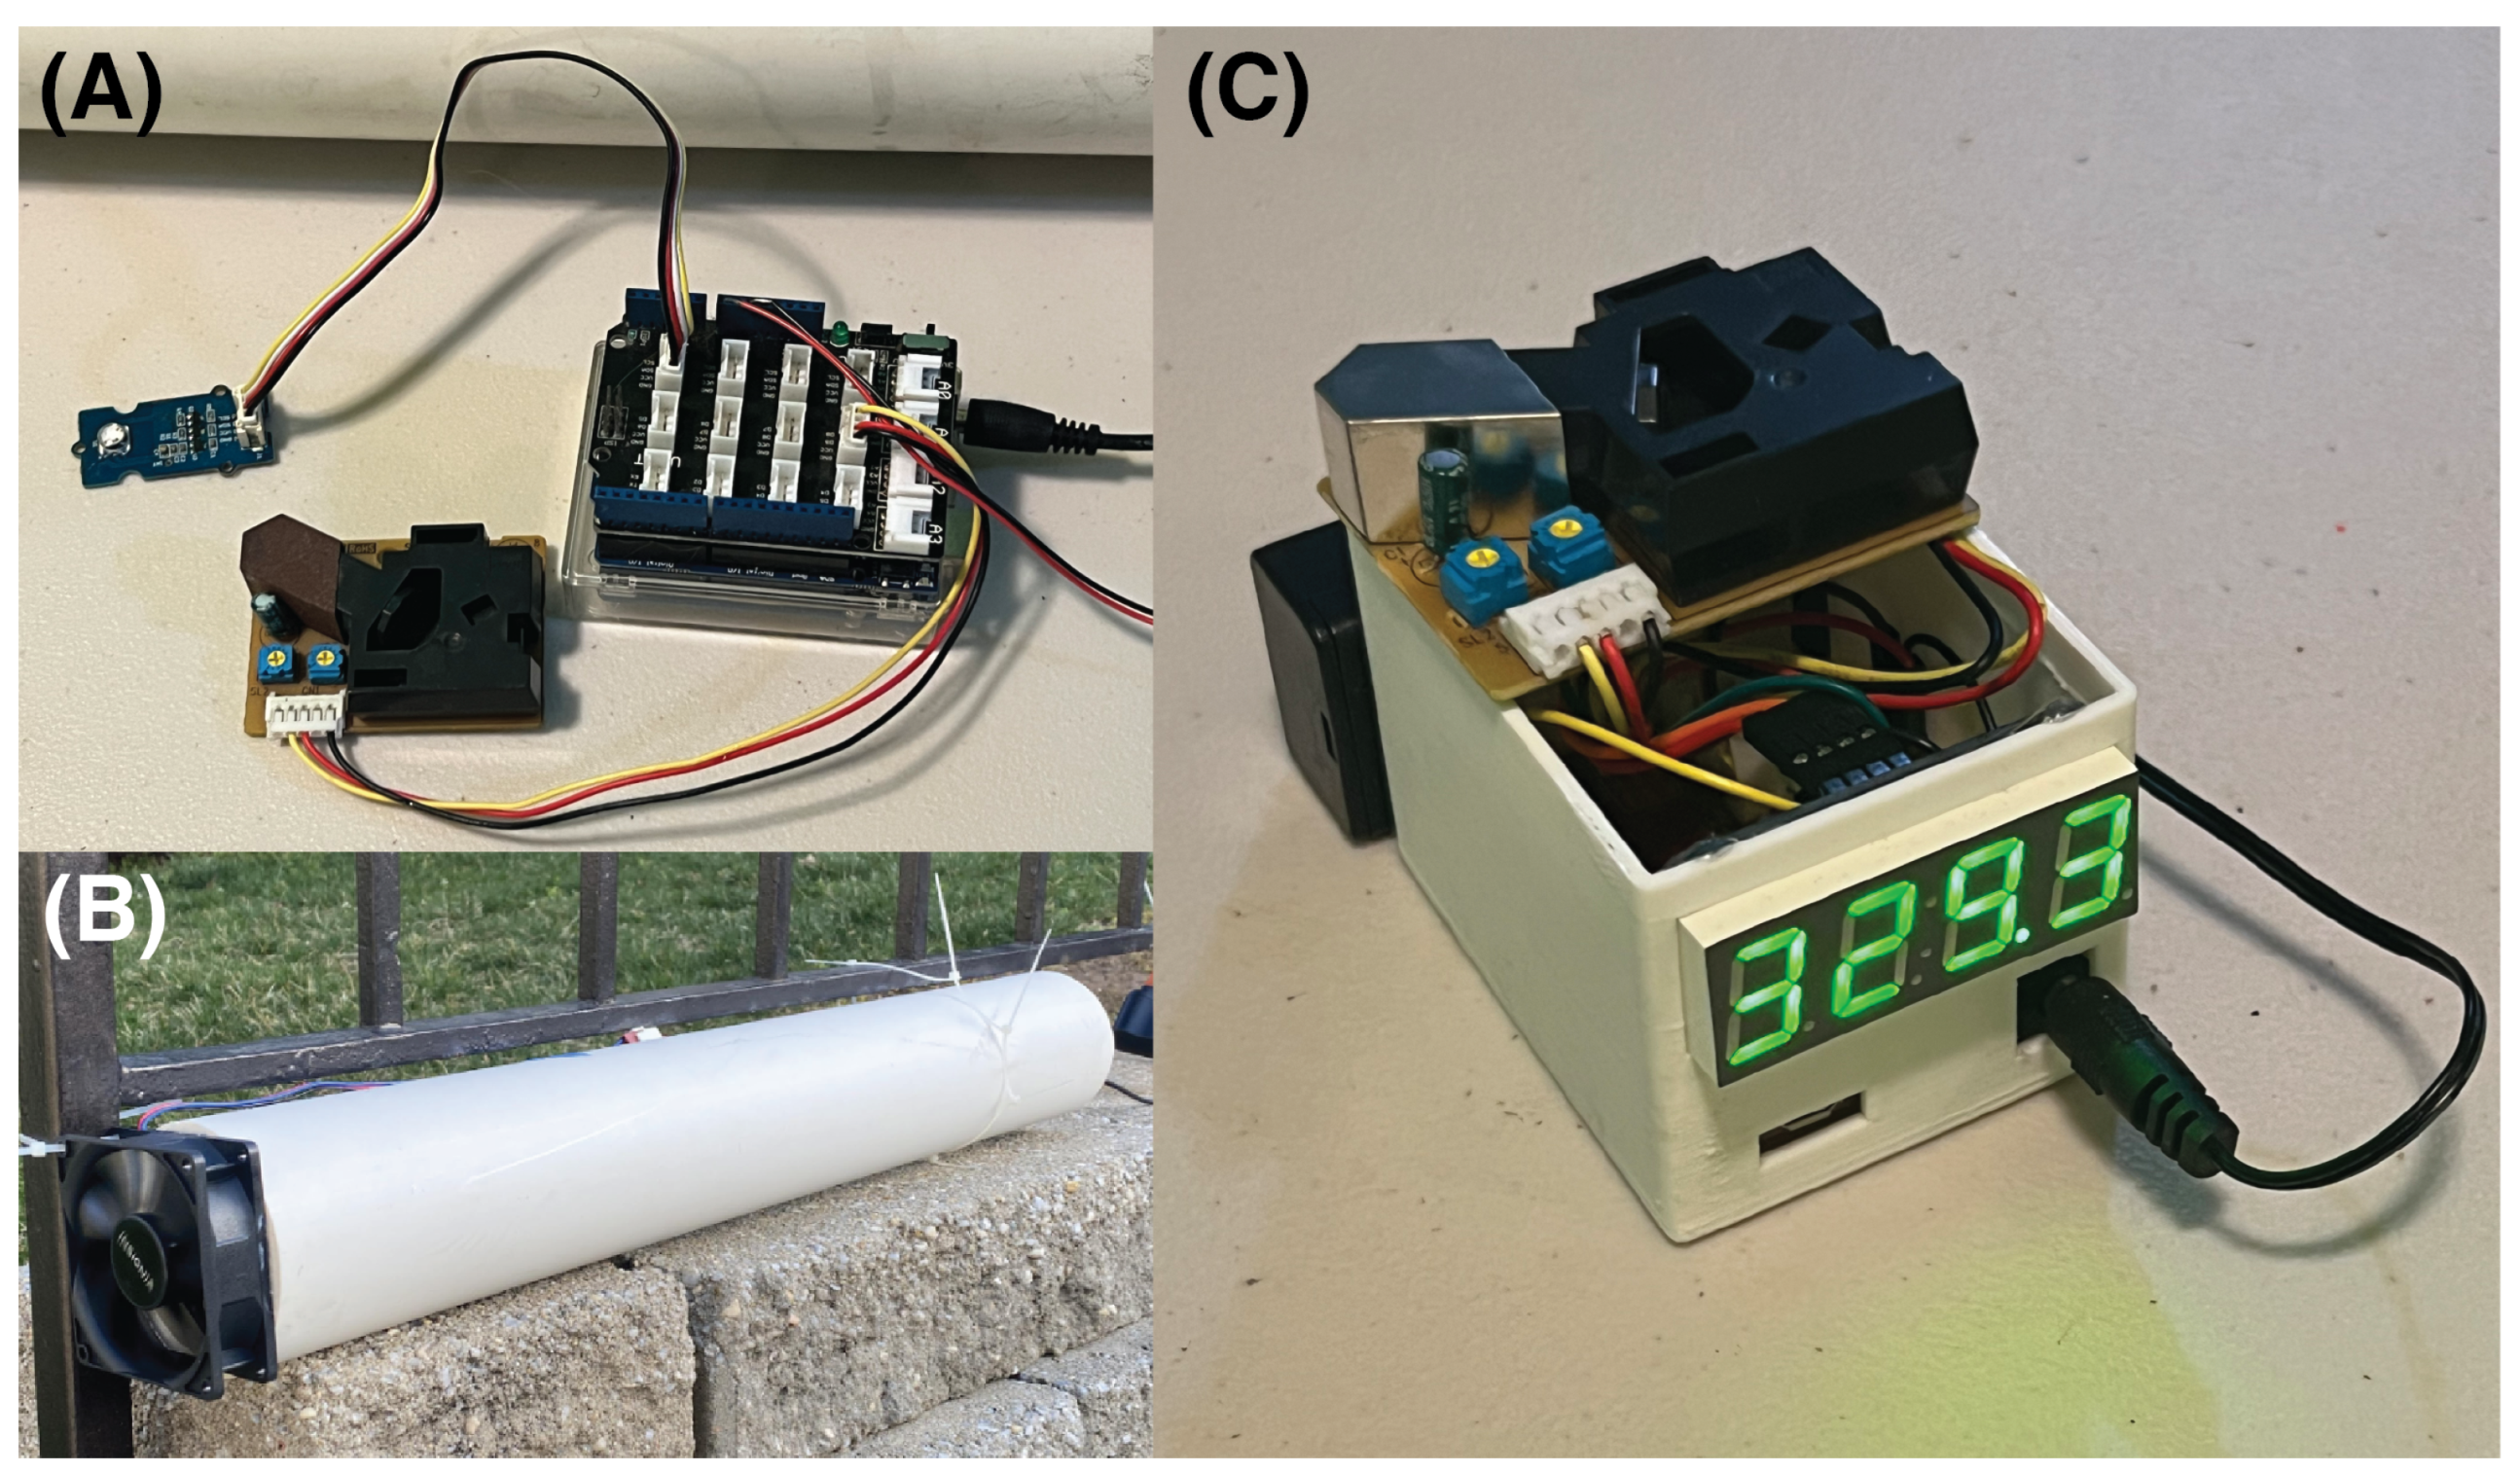
During the Reimagining Incubator, we developed a low-cost prototype sensor platform that would become the model for the associated STEM activities in our partner schools. Figure 3A shows a photograph of the core sensor platform. This device uses an Arduino Uno microcontroller to collect PM 2.5 concentration, temperature, humidity, and pressure data from various attached peripherals. The dust sensor (PPD42NS) and the barometer sensor board (BME280), which measure temperature, humidity, and pressure, are connected to the microcontroller via a base shield that sits atop the stack. Below the base shield is a real-time clock (RTC) data logger shield that is used to write the collected data to an SD card for subsequent plotting, analysis, and interpretation. CSV data files are written daily, with a new file created each day at midnight.
The fully assembled incubator prototype is shown in Figure 3B. The sensor from Figure 3A is placed within the PVC tube and an 80 mm computer fan is affixed to one end. The fan draws particle-laden air from the outside and flows it over the sensor boards, after which it exits the other end of the tube, which is left open. A bill of materials for this prototype platform is provided in Table 1, and the associated code is listed in Appendix A.
The dust sensor in this system works on the same principle as the PMS5003 used in the PurpleAir devices but uses an LED as the light source instead. A variation of this platform using the PMS5003 is currently being built by the Science Club at one partner high school located in Manhattan. This change in the sensor module requires adjusting the code provided in Appendix A, but this is a fairly straightforward change.

2.3.2. Portable School Kits

In an effort to raise awareness of climate change and disparities in local air quality, FRESH Air is working closely with local middle and high school teachers and students. In addition to monitoring the PurpleAir sensors, we also engage in hands-on activities designed to give the students a better understanding of the measurements being made and to promote interest in STEM fields. While the PurpleAir sensors provide information about the local air quality, they are essentially black boxes to the students. To give the students an understanding of the mechanism and an opportunity to learn about microcontrollers, programming, data collection, and data analysis, we have been working with our partner schools using Arduino-based kits.
In working with the science teachers at our partner schools, we provide complete written and video instructions on how to assemble the kit. Table 2 lists the bill of materials for the sensor kits that utilize the LED-based particle sensor. These modules are less expensive than the PMS5003 used in the PurpleAir sensors, allowing us to provide more kits to the classroom. Despite the difference in the light source, the sensing principle is the same and will be discussed in the next section.
Figure 3C shows a photograph of an assembled portable sensor kit. The particle sensor sits atop the 3D-printed box to allow it to easily sample the environment. The Arduino board mounts inside the box, and the alphanumeric LED display fits into the opening in the front. A battery in a holder is mounted to the side of the case and provides several hours of continuous operation. The display shows the PM 2.5 concentration in particle counts (pcs) per 0.01 ft 3 . To keep the costs down so that more kits may be provided to schools, we opted to exclude the RTC data logger from this embodiment; however, the implementation of one is straightforward.
The Arduino code provided to the schools for use in these portable sensor kits is listed in Appendix B. A stereolithography (STL) file of the 3D-printed box is available. Please contact us for the file.

2.4. Particle Counting: Principle of Operation

The Grove PPD42NS and the Plantower PMS5003 dust sensors count particles in a similar manner. Both sensor modules rely on light scattering. However, the Grove device uses an LED as the light source, while the Plantower modules use a laser.
Light scattering has a long history of being used to characterize particles. In 1908, Gustave Mie developed a comprehensive theory of light scattering by spherical particles (Mie 1908). In the intervening decades, theoretical and computational techniques have been developed for understanding the light scattering signatures from nonspherical particles, including spheroids, rods, and aggregates of smaller particles (Draine and Flatau 1994; Mackowski and Mishchenko 1996, 2011; Waterman 1965, 1971). However, many sensors, including those employed here, assume a spherical particle distribution where sizing is based on scattered light.
Each sensor module has a small sensing volume through which air flows. Small particles from the ambient environment are entrained within an air stream and flow through this sample region. When the PM crosses the light beam (either LED or laser), photons are scattered toward a photodetector. The Grove sensor looks slightly in the backward direction ( θ 90 ) , while the Plantower device captures light over a large solid angle centered on 90 . The scattered signal is proportional to the size of the particle within the beam so that larger particles will deflect more light and smaller particles will deflect less light (Bohren and Huffman 1983; van de Hulst 1957).
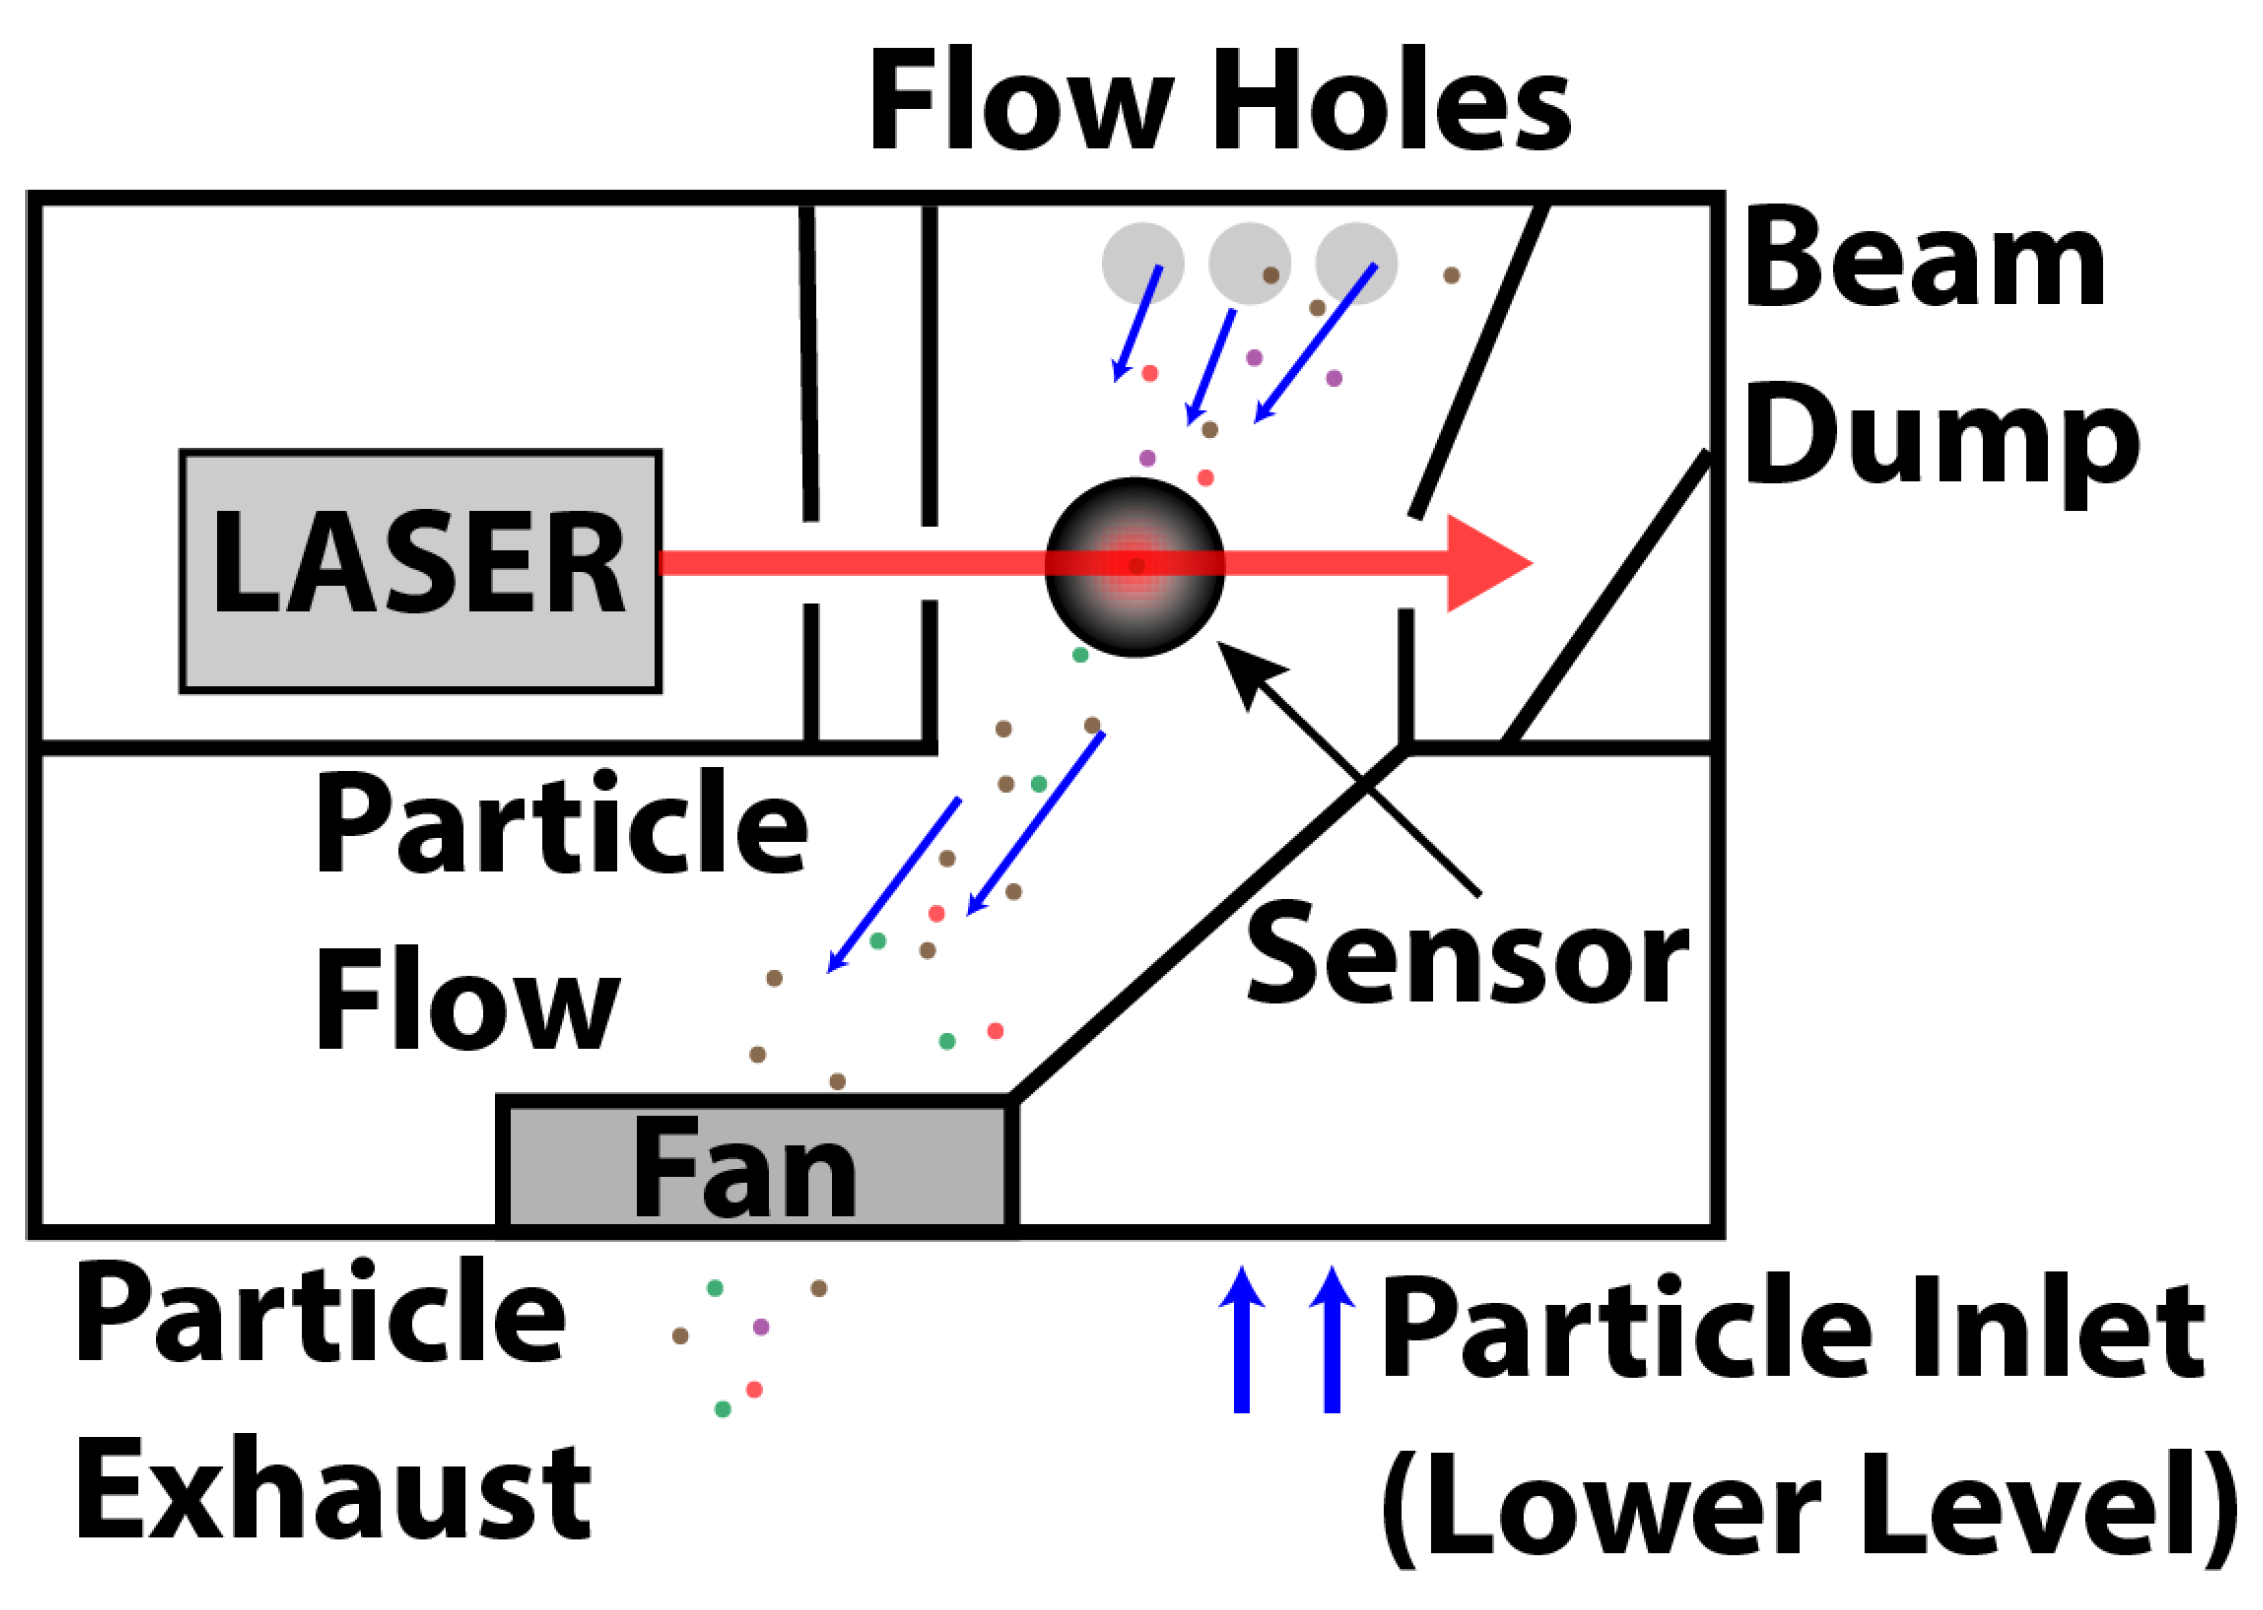
Figure 4 shows a simple schematic of the operating principle. This drawing is modeled on the PMS5003 module. Particle-laden air enters through vents in the side of the module and is directed through interior vent holes to the sample measurement region. The light source, a laser in this case, is located behind a series of baffles to reduce stray light. As PM cross the measurement region, they enter the beam and scatter light towards the photosensor. The unscattered beam is directed into a beam dump to eliminate stray light. The particles exit the measurement volume and leave the module through an exhaust fan.
Both modules are factory-calibrated to relate the measured signal to the particle size (Nguyen et al. 2021). The code on the microcontroller then determines the particle density (Grove, pcs/0.01 ft 3 ) or mass density (Plantower,  μ g/m 3 ). The PurpleAir sensor translates the mass concentration into an AQI, which is reported on their maps. The historical data downloaded with the PurpleAir API will give concentrations for PM 1 , PM 2.5 , and PM 10 .

3. Results and Discussion

In the following sections, we will discuss various FRESH Air sensor measurements. These measurements include those obtained from our prototype sensor and commercial PurpleAir devices. Throughout these discussions, we report PM measurements using both concentration ( μ g/m 3 ) and AQI.
The AQI developed by the United States Environmental Protection Agency categorizes air quality into six categories, as shown in Table 3. The AQI scale sets the level of 100 as the break point for the ambient air concentration that corresponds to the short-term national ambient air quality standard for the protection of public health. Values of AQI greater than 100 begin to pose a threat to classes of individuals, with the threat growing as the index gets larger. While an AQI less than 100 is satisfactory, below 50 is considered good. The PM 2.5 concentration range for each level is also indicated in Table 3 as it connects the index to the actual measurement.
Particle concentration is the primary measurement from the sensors and is useful from a pedagogical standpoint to allow students to understand the quantity of material being measured. AQI, a secondary measure, is derived from the concentration measurement and provides a widely accessible indication of the level of pollution exposure. For completeness, we include both in the discussion below. The EPA provides a calculator to convert between concentration and AQI, which may be found at http://www.airnow.gov (accessed 1 September 2023). Note that corrections are necessary to align PurpleAir sensor measurements with measurements from EPA instrumentation (Barkjohn et al. 2021); however, these corrections are not large. Correction factors for the other PM sensor modules used are not available, although we are currently engaged in testing to compare module variability.

3.1. Incubator Prototype

The prototype sensor developed during the Reimagining Incubator and described above in Section 2.3.1 was located at an outdoor site in the Tottenville neighborhood of Staten Island, NY. The photograph in Figure 3B shows PVC housing secured to a fence atop a stone wall. The Arduino Uno microcontroller and dust sensor module (Figure 3A) were placed within the tube and powered with a small power supply.
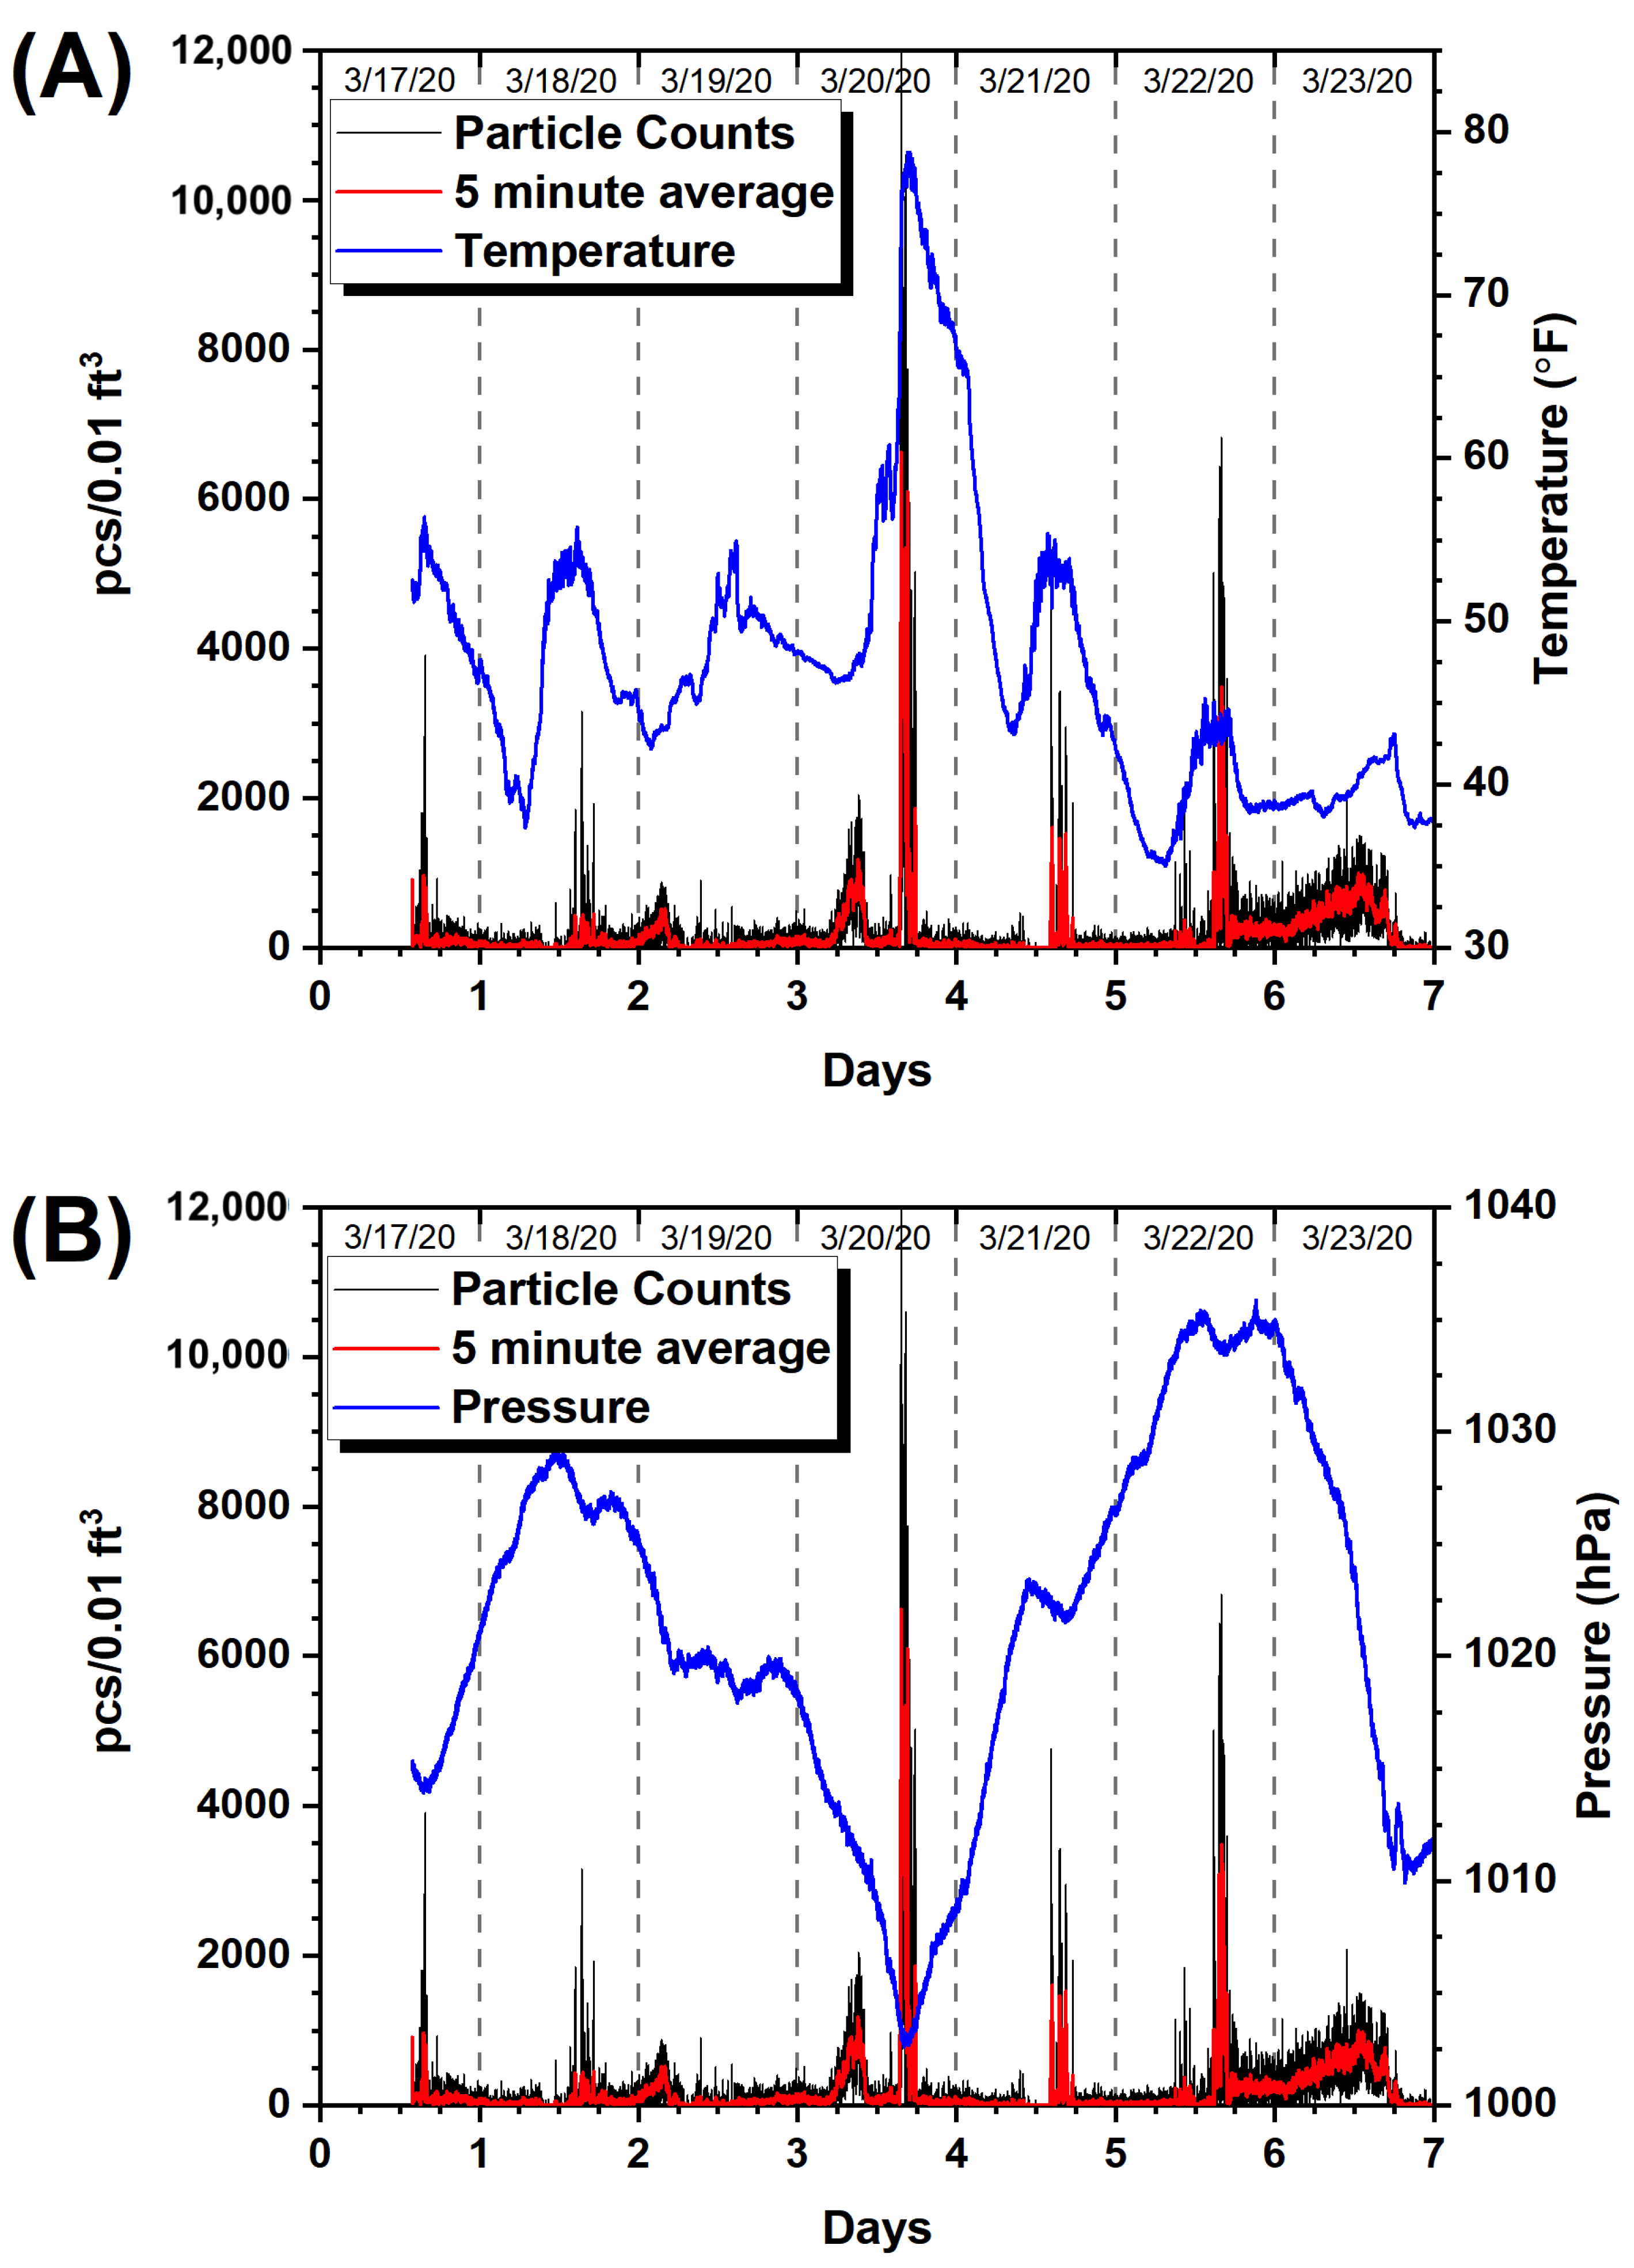
A week of testing was performed to determine the viability of the platform for use in school environments. The data shown here cover the week from 17 to 23 March 2020. Note that since the Grove dust sensor was used in this platform, the particle counts (pcs) per 0.01 ft 3 are given for the PM 2.5 concentration.
Figure 5A shows the recorded data for the week mentioned. The raw particle counts are shown in the black curve, while the red shows the data averaged over 5 min. Elevated particle counts (>1000 pcs/0.01 ft 3 ) are seen nearly every day around midday. These events may be attributed to landscaping activity in the neighborhood, which raises the airborne particle counts; landscaping continued unabated during the pandemic. The close proximity to Raritan Bay also means that salt particles may be found in the air, especially during times of storms.
On the evening of 20 March 2020, a rainstorm occurred. The winds associated with this storm blew lots of particulate matter around, resulting in a large spike of about 12,000 pcs/0.01 ft 3 , which corresponds to approximately 60  μ g/m 3 . This is a high concentration that has an AQI in the unhealthy category, but this event was short-lived and did not cause a significant health risk. The blue curve in Figure 5A represents the measured temperature ( F). The majority of the week was typical of spring in NY, but there was an increase in temperature to an atypical 80 F at the time the storm blew through.
Figure 5B shows the same particulate data for the week but overlays the observed pressure (hPa, blue curve). One notes that a decrease in pressure may be seen to coincide with the spike in particle density caused by the storm. This is completely consistent with the low pressure accompanying inclement weather such as wind and rain storms.
This sensor platform remained affixed to the fence, as shown in Figure 3B, for six months, collecting data continuously. New data files were created each day at 12:00 a.m., and the measurements were typical of those reported in Figure 5. The sensor platform demonstrated its viability for ease of use in an educational setting as both a teaching tool and a data acquisition platform.

3.2. FRESH Air Schools

To date, PurpleAir sensors have been installed at ten sites around the Bronx and Northern Manhattan. These sites represent Fordham University, middle schools, high schools, and community organizations. Both indoor and outdoor sensors have been installed so that we can observe the pollution exposure from external factors, but we can learn something about how “leaky” the building is by correlating indoor trends with the outdoor trends in addition to observing indoor air quality, which may degrade from cooking, smoking, furnaces, and other sources of indoor particulate matter.
In March 2023, a series of wildfires erupted in Canada. Wildfires, while often naturally occurring, can be worsened by environmental conditions associated with anthropogenic climate change. In this case, climate change doubled the likelihood of extreme fires through drying from lack of rainfall and high temperatures (Barnes et al. 2023; Burton 2023; Parisien et al. 2023). These fires grew worse over the year, and by June the impacts from the fires were affecting the east coast of the United States. Figure 6 shows Carbon Monoxide (CO) satellite measurements obtained from the Sentinel-5P mission of the European Space Agency’s Copernicus Programme. The map shows the average CO concentration from May through 13 June 2023. The massive amount of CO observed is the result of active wildfires and the impact outside of Canada is clearly seen by the deep orange over the central and eastern United States and out into the Atlantic.
The air quality in NYC was significantly degraded over a few days in early June due to these fires, which turned the air around the city into an orange haze, reduced visibility, and threatened those individuals with respiratory ailments. The FRESH Air network recorded a decline in NYC air quality during this time.
Figure 7 shows indoor and outdoor measurements, averaged over 6 h, using PurpleAir sensors from several of the FRESH Air sites during the month of June. Figure 7A shows outdoor measurements for Fordham University and three partner schools. The names of the schools are withheld in order to avoid potential negative impacts on the school if poor air quality is observed. Only four sites are shown, principally for clarity but also because a few sites were offline during this time period, so their data are incomplete.
The plot in Figure 7A shows a clear rise in PM 2.5 concentration during the first week of June, peaking at an average value of 218  μ g/m 3 , with one site measuring as high as 250  μ g/m 3 . This is a significant rise over a more typical baseline of around 10  μ g/m 3 . At the peak PM 2.5 concentration, NYC experienced an AQI in excess of 250, a value indicative of very unhealthy air affecting all individuals, especially the elderly, children, and those people with respiratory or heart disease.
The measurements at all the locations track each other reasonably well, indicating that this citywide pollution event was fairly uniform over the FRESH Air sites. There are several other higher readings that occurred in the weeks following this large event, which correspond to the continued invasion of NYC by wildfire emissions. There is a notable event at Partner School 3 around June 10–11. This is likely due to local effects associated with the sensor location (an enclosed courtyard) at the school due to a vortex that resulted in repeated sampling of the same particulate matter.
The indoor measurements for the same sites are shown in Figure 7B. Overall, the indoor measurements are lower than the outdoor measurements, with the average measured peak being 167  μ g/m 3 . However, Partner School 2 experienced considerably better indoor air quality than any of the other sites, having a peak PM 2.5 concentration of 57  μ g/m 3 . For three of the four sites shown, the AQI exceeded 215 on this day, indicating very unhealthy air. Partner School 2 fell into the unhealthy category. While Partner School 1 is located in a newer building that has windows that do not open and appears well sealed, it evidently experiences some leakage which allows the indoor air quality to track and mimic the outdoor measurements. Partner School 2 is an older building with windows that are not as well sealed but shows a distinctly lower concentration. We attribute the differences in these sites to improved air turnover in Partner School 2 compared to the other sites. While Partner School 1 may be well sealed with respect to windows and doors, there may be poor or damaged filters in the HVAC system, leading to more particulate matter being drawn into the building from the outside.

3.3. Curriculum Development

We work closely with our partner schools to integrate Project FRESH Air into the classroom as well as after-school activities with science clubs. To date, the primary curriculum development has been with the middle schools (sixth, seventh, and eighth grades). The questions addressed at each grade level are meant to formulate a deeper understanding of air quality, its impact on health, the effects on the community, and how we can address the issue. Some specific questions the students address are as follows:
  • What is air pollution?
  • What are the causes of air pollution?
  • What are the effects of air pollution?
  • How do we measure air pollution?
At each grade level, students drill deeper into these questions, making stronger connections among topics, such as specific types of pollutants and their physiological impacts. In addition to these general questions, students also seek to understand the different sources of pollution specific to their neighborhood and its impact on their community. This focus is particularly important to FRESH Air given the goal of the project and the historical inequities that have led to the environmental justice crisis we face: the widespread disparity in pollution impact on socio-economically disadvantaged neighborhoods in the Bronx and Northern Manhattan.
Project FRESH Air was integrated into the curriculum to address the Human Impacts standards for middle school students in New York State. Specifically, Project FRESH Air targets the following learning standards:
  • MS-ESS3-2: Analyze and interpret data on natural hazards, to forecast future catastrophic events, and inform the development of technologies to mitigate their effects.
  • MS-ESS3-3: Apply scientific principles to design a method for monitoring and minimizing a human impact on the environment.
Students have been involved in the construction of sensor platforms like those discussed in Section 2.3.1 and Section 2.3.2, which yield their own data about their local environment. In addition, the students have access to PurpleAir data. Data from both these sources have been plotted, analyzed, and interpreted. These plots resemble those presented earlier (Figure 5 and Figure 7).
Students working with Project FRESH Air are also exposed to a hands-on experience with the sensor kits they build, whether in the classroom or in after-school clubs. As part of their community engagement, Fordham students and faculty work with local middle and high school students and teachers to analyze and interpret the data. These efforts provide a purposeful goal where ideas can be tested, modified, and validated. At each stage of the sensor development project, students are able to see the workings of the device they are constructing and how each stage connects with the others. In this way, students not only get to see into the black box that commercial sensors often appear as but develop a sense of STEM awareness and impacts that will, as the students grow, drive underrepresented minorities into STEM disciplines.

3.4. Webinars

From the start, we have said to our partner schools that we do not just want a site with power and WiFi, but we want to be able to continuously engage with the students and the community. Project FRESH Air is not about setting sensors and forgetting about them. To this end, we offer webinars about four times per academic year, which roughly correspond to the mid-term and final periods of the fall and spring semesters at Fordham. These webinars are structured to provide project updates, solicit feedback, stimulate inquiry, and engage the broader air quality monitoring community.
All faculty, students, and families associated with our partner schools are invited to attend these online forums. In addition, we maintain a list of interested personnel from Fordham, other schools (middle through college), environmental justice organizations, and scientists. These nominally hour-long events are organized by Fordham students and begin with team members providing a brief overview of the project and the state of Project FRESH Air. The webinars always include a guest speaker from either the industry, academia, or the medical profession who works in air quality or health-impacts monitoring. Following the guest speaker, a discussion of their presentation or any similarly related topic ensues. Fordham students will sometimes lead discussions with attending students to consider their observations in their schools and neighborhoods. In addition, middle school students have presented their work highlighting the results of their academic inquiries through posters, presentations, and letters to various public officials.
The webinars have been successful in connecting with the community. They provide insight into the concerns parents have for their students in Bronx schools, but, more importantly, they raise awareness for the issues being faced by the community. We approach our goals through discussions of the interrelationships among PM 2.5 , asthma, and climate change, but Project FRESH Air has raised awareness of other air quality threats, particularly indoor air quality, that were largely unknown among our audience. This includes the deleterious effects of volatile organic compounds (VOCs) that may outgas from manufactured products, cleaning supplies, or other common household items.
Through these webinars, the community has become an active participant in Project FRESH Air. They are gaining knowledge of their environment, its impact on their daily lives, how it is expected to change over time, and what they can do to help improve it. More importantly, they are learning that science is not completely esoteric but is, in fact, something we can all do together.

4. Conclusions

Project FRESH Air seeks to raise awareness of climate change by introducing the Bronx and Northern Manhattan communities to the immediate impacts of poor air quality. These communities are among the poorest in New York City and experience a disproportionate amount of pollution from motor vehicle traffic and poor building infrastructure. Many in the community are unaware of the danger posed by PM 2.5 , its connection to the environment, and the potential for increased risk as the climate warms. Through outreach to local middle and high schools, Fordham faculty and students are able to provide an educational foundation of the impacts of particulate matter exposure and hands-on STEM projects to reinforce those ideas and cultivate a culture of knowledge and inquiry among the students at our partner schools. Armed with this knowledge and data from Project FRESH Air sensors, our partner students and their families will be empowered to effect positive change in their community. Furthermore, Fordham students, in both the classroom and the community, gain an understanding and appreciation of the extent and severity of poor air quality on Bronx residents.
Improvements in local air quality will have an immediate effect on the incidence of asthma and respiratory disease experienced by Bronx communities and will exhibit a long-term impact on potent greenhouse gas emissions that result from combustion processes, which are those same processes that contribute to anthropogenic warming and exacerbate health risks. By educating the community on the impacts of air quality, Project FRESH Air expects to see reductions in harmful greenhouse gases, making it a win–win for everyone.

Author Contributions

Conceptualization, S.H., U.S., M.M., M.K. and J.J.; methodology, S.H., U.S., M.M., M.K. and J.J.; software, S.H.; validation, S.H. and U.S.; formal analysis, S.H. and U.S.; investigation, S.H. and U.S.; resources, S.H. and U.S.; data curation, S.H. and U.S.; writing—original draft preparation, S.H. and U.S.; writing—review and editing, S.H., U.S., M.M., M.K. and J.J.; visualization, S.H.; supervision, S.H. and U.S.; project administration, S.H. and U.S.; funding acquisition, S.H. and U.S. All authors have read and agreed to the published version of the manuscript.

Funding

This research was funded, in part, through a generous donation from The McGroddy Family Fund.

Institutional Review Board Statement

Not applicable.

Informed Consent Statement

Not applicable.

Data Availability Statement

Data are available upon request. Additionally, FRESH Air sensors are on the PurpleAir open network and may be accessed there. Historical data may be obtained through the PurpleAir API (https://api.purpleair.com, accessed 1 September 2023).

Acknowledgments

We would like to thank Dean Eva Badowska and Anne Fernald for visioning the Reimagining Incubator from which FRESH Air was born and Julie Gafney and the Center for Community Engaged Learning for valuable connections to individuals at our partner schools. We are grateful to James McGroddy for seeing our vision and his generous support that has allowed FRESH Air to promote STEM outreach, especially in underserved communities.

Conflicts of Interest

The authors declare no conflict of interest. The funders had no role in the design of the study, in the collection, analyses, or interpretation of data, in the writing of the manuscript, or in the decision to publish the results.

Abbreviations

The following abbreviations are used in this manuscript:
AQIAir Quality Index.
ESAEuropean Space Agency.
HVACHeating, Ventilation, and Air Conditioning.
NYCNew York City.
pcsParticle Counts.
PMParticulate Matter.
RTCReal-time Clock.
STEMScience, Technology, Engineering, and Mathematics.
STLStereolithography.
VOCVolatile Organic Compound.

Appendix A. Arduino Code for Incubator Prototype

The following code was used for the prototype FRESH Air sensor developed as a proof-of-concept for the Reimagining Incubator. This is the foundation code for the larger sensing projects constructed in the high school science clubs.
  • #include "RTClib.h"
  • #include <Wire.h>
  • #include <SPI.h>
  • #include <SD.h>
  • #include <HP20x_dev.h>
  • #include <KalmanFilter.h>
  • #include "Arduino.h"
  •  
  • RTC_PCF8523 rtc;
  •  
  • /* Instance */
  • KalmanFilter t_filter;    //temperature filter
  • KalmanFilter p_filter;    //pressure filter
  • KalmanFilter a_filter;    //altitude filter
  •  
  • const int chipSelect = 10;
  •  
  • int pin = 8;
  • unsigned long duration;
  • unsigned long starttime;
  • unsigned long sampletime_ms = 30000;//sampe 30s ;
  • unsigned long lowpulseoccupancy = 0;
  • float ratio = 0;
  • float c = 0;
  •  
  • // the following variable is long because the time, measured in miliseconds,
  • // will quickly become a bigger number than can be stored in an int.
  • long timeSinceLastWrite = 0;
  • int dataWritten = 0;
  •  
  • // switch to tell if an SD card is present
  • int SDPresent = 1;
  •  
  • void setup()
  • {
  •   // initialize serial communications at 9600 bps:
  •   Serial.begin(9600);
  •   Wire.begin();
  •   rtc.begin();
  •  
  •   Serial.println("****HP20x_dev by seeed studio****\n");
  •   Serial.println("Calculation formula: H = [8.5(101325-P)]/100 \n");
  •   /* Power up,delay 150ms,until voltage is stable */
  •   delay(150);
  •   /* Reset HP20x_dev */
  •   HP20x.begin();
  •   delay(100);
  •  
  •   if (! rtc.begin())
  •   {
  •     Serial.println("Couldn’t find RTC");
  •     while (1);
  •   }
  •  
  •   // see if the card is present and can be initialized:
  •   Serial.print("Initializing SD card...");
  •   if (!SD.begin(chipSelect))
  •   {
  •     Serial.println("Card failed, or not present");
  •     // don’t do anything more:
  •     while (1);
  •   }
  •   Serial.println("card initialized.");
  •  
  •   pinMode(pin, INPUT);    //input pin for the particle sensor
  •   starttime = millis();   //get the current time;
  •  
  • }
  •  
  • void loop()
  • {
  •   // read the value from the sensor:
  •  
  •   duration = pulseIn(pin, LOW);
  •   lowpulseoccupancy = lowpulseoccupancy + duration;
  •   if ((millis() - starttime) > sampletime_ms) //if the sample time == 30s
  •   {
  •     ratio = lowpulseoccupancy / (sampletime_ms * 10.0); // Integer percentage 0=>100
  •     c = 1.1 * pow(ratio, 3) - 3.8 * pow(ratio, 2) + 520 * ratio + 0.62; // using spec sheet curve
  •  
  •     Serial.print("concentration = ");
  •     Serial.print(c);
  •     Serial.println(" pcs/0.01cf");
  •     //Serial.println("\n");
  •  
  •     long Temper = HP20x.ReadTemperature();
  •     Serial.print("Temper:");
  •     float t = Temper / 100.0;
  •     Serial.print(t);
  •     Serial.println("C.");
  •     /*
  •     Serial.println("Filter:");
  •     Serial.print(t_filter.Filter(t));
  •     Serial.println("C.\n");
  •     */
  •  
  •     long Pressure = HP20x.ReadPressure();
  •     Serial.print("Pressure:");
  •     float p = Pressure / 100.0;
  •     Serial.print(p);
  •     Serial.println("hPa.");
  •     /*
  •     Serial.println("Filter:");
  •     Serial.print(p_filter.Filter(t));
  •     Serial.println("hPa\n");
  •     */
  •     writeDataToSD(c, t, p);
  •  
  •     lowpulseoccupancy = 0;
  •     starttime = millis();
  •  
  •   }
  •   delay(200);
  •  
  • }
  •  
  • void writeDataToSD(float sConc, float sTemp, float sPress)
  • {
  •   // open the file. note that only one file can be open at a time,
  •   // so you have to close this one before opening another.
  •   char filename[] = "AQ000000.txt";
  •  
  •   DateTime now = rtc.now();
  •  
  •   int m = now.month();
  •   int d = now.day();
  •   int y = now.year() - 2000;
  •  
  •   filename[2] = m / 10 + ’0’;
  •   filename[3] = m % 10 + ’0’;
  •   filename[4] = d / 10 + ’0’;
  •   filename[5] = d % 10 + ’0’;
  •   filename[6] = y / 10 + ’0’;
  •   filename[7] = y % 10 + ’0’;
  •  
  •   File dataFile = SD.open(filename, FILE_WRITE);
  •  
  •   // if the file is available, write to it:
  •   if (dataFile)
  •   {
  •     dataFile.print(now.month(), DEC);
  •     dataFile.print("/");
  •     dataFile.print(now.day(), DEC);
  •     dataFile.print("/");
  •     dataFile.print(now.year(), DEC);
  •     dataFile.print(" ");
  •     dataFile.print(now.hour(), DEC);
  •     dataFile.print(":");
  •     dataFile.print(now.minute(), DEC);
  •     dataFile.print(":");
  •     dataFile.print(now.second(), DEC);
  •     dataFile.print(" ");
  •     dataFile.print(sConc);
  •     dataFile.print(" ");
  •     dataFile.print(sTemp);
  •     dataFile.print(" ");
  •     dataFile.println(sPress);
  •     dataFile.close();
  •   }
  •  
  •   Serial.print("Data written to ");
  •   Serial.println(filename);
  •  
  • }
  •  

Appendix B. Arduino Code for Portable School Kits

The following code is used by the partner schools in building the portable sensors based on the LED particle counting modules.
  • #include <Wire.h>
  • #include <SPI.h>
  • #include "Arduino.h"
  • #include <Adafruit_GFX.h>
  • #include "Adafruit_LEDBackpack.h"
  •  
  • Adafruit_7segment matrix = Adafruit_7segment();
  •  
  • int pin = 8;
  • unsigned long duration;
  • unsigned long starttime;
  • unsigned long sampletime_ms = 10000;//sample 30000 = 30s ;
  • unsigned long lowpulseoccupancy = 0;
  • float ratio = 0;
  • float c = 0;
  •  
  • void setup() {
  •  
  •   Serial.begin(9600);
  •   Wire.begin();
  •  
  •   pinMode(pin, INPUT);    //input pin for the particle sensor
  •   starttime = millis();   //get the current time;
  •  
  •   #ifndef __AVR_ATtiny85__
  •     Serial.begin(9600);
  •     Serial.println("7 Segment Backpack Test");
  •   #endif
  •     matrix.begin(0x70);
  • }
  •  
  • void loop() {
  •  
  •   duration = pulseIn(pin, LOW);
  •   lowpulseoccupancy = lowpulseoccupancy + duration;
  •   if ((millis() - starttime) > sampletime_ms) //if the sample time == 30s
  •   {
  •     ratio = lowpulseoccupancy / (sampletime_ms * 10.0); // Integer percentage 0=>100
  •     c = 1.1 * pow(ratio, 3) - 3.8 * pow(ratio, 2) + 520 * ratio + 0.62; // using spec sheet curve
  •  
  •     Serial.print("concentration = ");
  •     Serial.print(c);
  •     Serial.println(" pcs/0.01cf");
  •  
  •     matrix.print(c);
  •     matrix.writeDisplay();
  •  
  •     lowpulseoccupancy = 0;
  •     starttime = millis();
  •  
  •    }
  • delay(200);
  •  
  • }
  •  

References

  1. Barkjohn, Karoline K., Brett Gantt, and Andrea L. Clements. 2021. Development and application of a united states-wide correction for pm2.5 data collected with the purpleair sensor. Atmospheric Measurement Techniques 14: 4617–37. [Google Scholar] [CrossRef] [PubMed]
  2. Barnes, Clair, Yan Boulanger, Theo Keeping, Philippe Gachon, Nathan Gillett, Jonathan Boucher, François Roberge, Sarah Kew, Olivia Haas, Dorothy Heinrich, and et al. 2023. Climate Change More than Doubled the Likelihood of Extreme Fire Weather Conditions in Eastern Canada. Technical Report. London: Grantham Institute for Climate Change. [Google Scholar] [CrossRef]
  3. Beggs, Paul John, and Hilary Jane Bambrick. 2005. Is the global rise of asthma an early impact of anthropogenic climate change? Environmental Health Perspectives 113: 915–19. [Google Scholar] [CrossRef] [PubMed]
  4. Bohren, Craig F., and Donald R. Huffman. 1983. Absorption and Scattering of light By Small Particles. New York: Wiley. [Google Scholar]
  5. Brunekreef, Bert, and Bertil Forsberg. 2005. Epidemiological evidence of effects of coarse airborne particles on health. European Respiratory Journal 26: 309–18. [Google Scholar] [CrossRef] [PubMed]
  6. Burton, Philip J. 2023. Understanding spring wildfires in Canada’s northern forests. Global Change Biology 29: 5983–85. [Google Scholar] [CrossRef] [PubMed]
  7. Collins, Timothy W., and Sara E. Grineski. 2022. Racial/ethnic disparities in short-term PM2.5 air pollution exposures in the united states. Environmental Health Perspectives 130: 087701. [Google Scholar] [CrossRef] [PubMed]
  8. Daouda, Misbath, Lucas Henneman, Jeff Goldsmith, Marianthi-Anna Kioumourtzoglou, and Joan A. Casey. 2022. Racial/ethnic disparities in nationwide PM2.5 concentrations: Perils of assuming a linear relationship. Environmental Health Perspectives 130: 077701. [Google Scholar] [CrossRef] [PubMed]
  9. Draine, Bruce T., and Piotr J. Flatau. 1994. Discrete-dipole approximation for scattering calculations. Journal of the Optical Society of America A 11: 1491–99. [Google Scholar] [CrossRef]
  10. Environmental Protection Agency. 2011. National Emissions Inventory Data. Available online: https://www.epa.gov/air-emissions-inventories/2020-national-emissions-inventory-nei-data (accessed on 1 September 2023).
  11. Fongsodsri, Kamonpan, Supat Chamnanchanunt, Varunee Desakorn, Vipa Thanachartwet, Duangjai Sahassananda, Ponlapat Rojnuckarin, and Tsukuru Umemura. 2021. Particulate matter 2.5 and hematological disorders from dust to diseases: A systematic review of available evidence. Frontiers in Medicine 8: 692008. [Google Scholar] [CrossRef]
  12. Hadley, Odelle L. 2017. Background pm2.5 source apportionment in the remote northwestern united states. Atmospheric Environment 167: 298–308. [Google Scholar] [CrossRef]
  13. Hardell, Jennifer, Ellen J. Silver, Ilias Kavouras, Diana S. Lee, and Elissa Gross. 2023. Childhood asthma in the bronx, ny; the impact of pollutants on length of hospital stay. Journal of Asthma 60: 2160–69. [Google Scholar] [CrossRef] [PubMed]
  14. Kaur, Savneet, David Rosenstreich, Krystal L. Cleven, Simon Spivack, Joseph Grizzanti, Marina Reznik, and Sunit P. Jariwala. 2022. Severe asthma in adult, inner-city predominantly african–american and latinx population: Demographic, clinical and phenotypic characteristics. Journal of Asthma 59: 2341–51. [Google Scholar] [CrossRef] [PubMed]
  15. Kheirbek, Iyad, Jay Haney, Sharon Douglas, Kazuhiko Ito, and Thomas Matte. 2016. The contribution of motor vehicle emissions to ambient fine particulate matter public health impacts in new york city: A health burden assessment. Environmental Health 15: 89. [Google Scholar] [CrossRef] [PubMed]
  16. Kordit, David S., Marina Reznik, Cheng-Shiun Leu, and Sunit P. Jariwala. 2020. Longitudinal trends in asthma emergency department visits, pollutant and pollen levels, and weather variables in the bronx from 2001–2008. Journal of Asthma 57: 487–94. [Google Scholar] [CrossRef] [PubMed]
  17. Liu, Jiawen, Lara P. Clark, Matthew J. Bechle, Anjum Hajat, Sun-Young Kim, Allen L. Robinson, Lianne Sheppard, Adam A. Szpiro, and Julian D. Marshall. 2021. Disparities in air pollution exposure in the united states by race/ethnicity and income, 1990–2010. Environmental Health Perspectives 129: 127005. [Google Scholar] [CrossRef]
  18. Mackowski, Daniel W., and Michael I. Mishchenko. 1996. Calculation of the t-matrix and the scattering matrix for ensembles of spheres. Journal of the Optical Society of America A 13: 2266–78. [Google Scholar] [CrossRef]
  19. Mackowski, Daniel W., and Michael I. Mishchenko. 2011. A multiple sphere t-matrix fortran code for use on parallel computer clusters. Journal of Quantitative Spectroscopy and Radiative Transfer 112: 2182–92. [Google Scholar] [CrossRef]
  20. Martins, Nuno R., and Guilherme Carrilho da Graça. 2018. Impact of pm2.5 in indoor urban environments: A review. Sustainable Cities and Society 42: 259–75. [Google Scholar] [CrossRef]
  21. McArdle, Cristin E., Tia C. Dowling, Kelly Carey, Jourdan DeVies, Dylan Johns, Abigail L. Gates, Zachary Stein, Katharina L. van Santen, Lakshmi Radhakrishnan, Aaron Kite-Powell, and et al. 2023. Asthma-associated emergency department visits during the canadian wildfire smoke episodes—United States. MMWR Morbidity and Mortality Weekly Report 72: 926–32. [Google Scholar] [CrossRef]
  22. McDuffie, Erin E., Randall V. Martin, Joseph V. Spadaro, Richard Burnett, Steven J. Smith, Patrick O’Rourke, Melanie S. Hammer, Aaron van Donkelaar, Liam Bindle, Viral Shah, and et al. 2021. Source sector and fuel contributions to ambient pm2.5 and attributable mortality across multiple spatial scales. Nature Communications 12: 3594. [Google Scholar] [CrossRef]
  23. Mie, Gustav. 1908. Beiträge zur optik trüber medien, speziell kolloidaler metallösungen. Annalen der Physik 330: 377–445. [Google Scholar] [CrossRef]
  24. Mikati, Ihab, Adam F. Benson, Thomas J. Luben, Jason D. Sacks, and Jennifer Richmond-Bryant. 2018. Disparities in distribution of particulate matter emission sources by race and poverty status. American Journal of Public Health 108: 480–85. [Google Scholar] [CrossRef] [PubMed]
  25. Nemmar, Abderrahim, Peter H. M. Hoet, Benedicte Vanquickenborne, David Dinsdale, Michiel Thomeer, Marc F. Hoylaerts, Hubert Vanbilloen, Luc Mortelmans, and Benoit Nemery. 2002. Passage of inhaled particles into the blood circulation in humans. Circulation 105: 411–14. [Google Scholar] [CrossRef]
  26. Nguyen, Nam H., Huy X. Nguyen, Thuan T. B. Le, and Chinh D. Vu. 2021. Evaluating low-cost commercially available sensors for air quality monitoring and application of sensor calibration methods for improving accuracy. Open Journal of Air Pollution 10: 1–17. [Google Scholar] [CrossRef]
  27. Nurmagambetov, Tursynbek, Robin Kuwahara, and Paul Garbe. 2018. The economic burden of asthma in the united states, 2008–2013. Annals of the American Thoracic Society 15: 348–56. [Google Scholar] [CrossRef]
  28. NY Department of Health. 2020. Asthma Dashboard. Available online: https://apps.health.ny.gov/public/tabvis/PHIG_Public/asthma/# (accessed on 1 September 2023).
  29. Orellana, Renan Eduardo, Ismael Moradeyo, and Paul Uzodinma. 2021. Decades in crisis: Adapting a social-ecological framework to assess structural elements impacting asthma rates in the south bronx. Social Medicine 15: 21–31. [Google Scholar]
  30. Parisien, Marc-André, Quinn E. Barber, Mike D. Flannigan, and Piyush Jain. 2023. Broadleaf tree phenology and springtime wildfire occurrence in boreal canada. Global Change Biology 29: 6106–19. [Google Scholar] [CrossRef] [PubMed]
  31. Patella, Vincenzo, Giovanni Florio, Diomira Magliacane, Ada Giuliano, Maria Angiola Crivellaro, Daniela Di Bartolomeo, Arturo Genovese, Mario Palmieri, Amedeo Postiglione, Erminia Ridolo, and et al. 2018. Urban air pollution and climate change: “the decalogue: Allergy safe tree” for allergic and respiratory diseases care. Clinical and Molecular Allergy 16: 20. [Google Scholar] [CrossRef]
  32. Schraufnagel, Dean E. 2020. The health effects of ultrafine particles. Experimental Molecular Medicine 52: 311–17. [Google Scholar] [CrossRef]
  33. Singh, Nandita, Vishnu Murari, Manish Kumar, Shyamal C. Barman, and Tirthankar Banerjee. 2017. Fine particulates over south asia: Review and meta-analysis of pm2.5 source apportionment through receptor model. Environmental Pollution 223: 121–36. [Google Scholar] [CrossRef]
  34. Soong, Weily, Bradley E. Chipps, Sean O’Quinn, Jennifer Trevor, Warner W. Carr, Laura Belton, Frank Trudo, and Christopher S. Ambrose. 2021. Health-related quality of life and productivity among us patients with severe asthma. Journal of Asthma and Allergy 14: 713–25. [Google Scholar] [CrossRef] [PubMed]
  35. van de Hulst, Hendrik C. 1957. Light Scattering by Small Particles. Structure of Matter Series; New York: Wiley. [Google Scholar]
  36. Veremchuk, Lyudmila Vasilievna, Vera Innokentievna Yankova, Tatyana Isaakovna Vitkina, Anna Vladimirovna Nazarenko, and Kirill Sergeevich Golokhvast. 2016. Urban air pollution, climate and its impact on asthma morbidity. Asian Pacific Journal of Tropical Biomedicine 6: 76–79. [Google Scholar] [CrossRef]
  37. Waterman, Peter C. 1965. Matrix formulation of electromagnetic scattering. Proceedings of the IEEE 53: 805–12. [Google Scholar] [CrossRef]
  38. Waterman, Peter C. 1971. Symmetry, unitarity, and geometry in electromagnetic scattering. Physical Review D 3: 825–39. [Google Scholar] [CrossRef]
  39. Witonsky, Jonathan, Ryan Abraham, Jennifer Toh, Tulsi Desai, Mili Shum, David Rosenstreich, and Sunit P. Jariwala. 2019. The association of environmental, meteorological, and pollen count variables with asthma-related emergency department visits and hospitalizations in the bronx. Journal of Asthma 56: 927–37. [Google Scholar] [CrossRef]
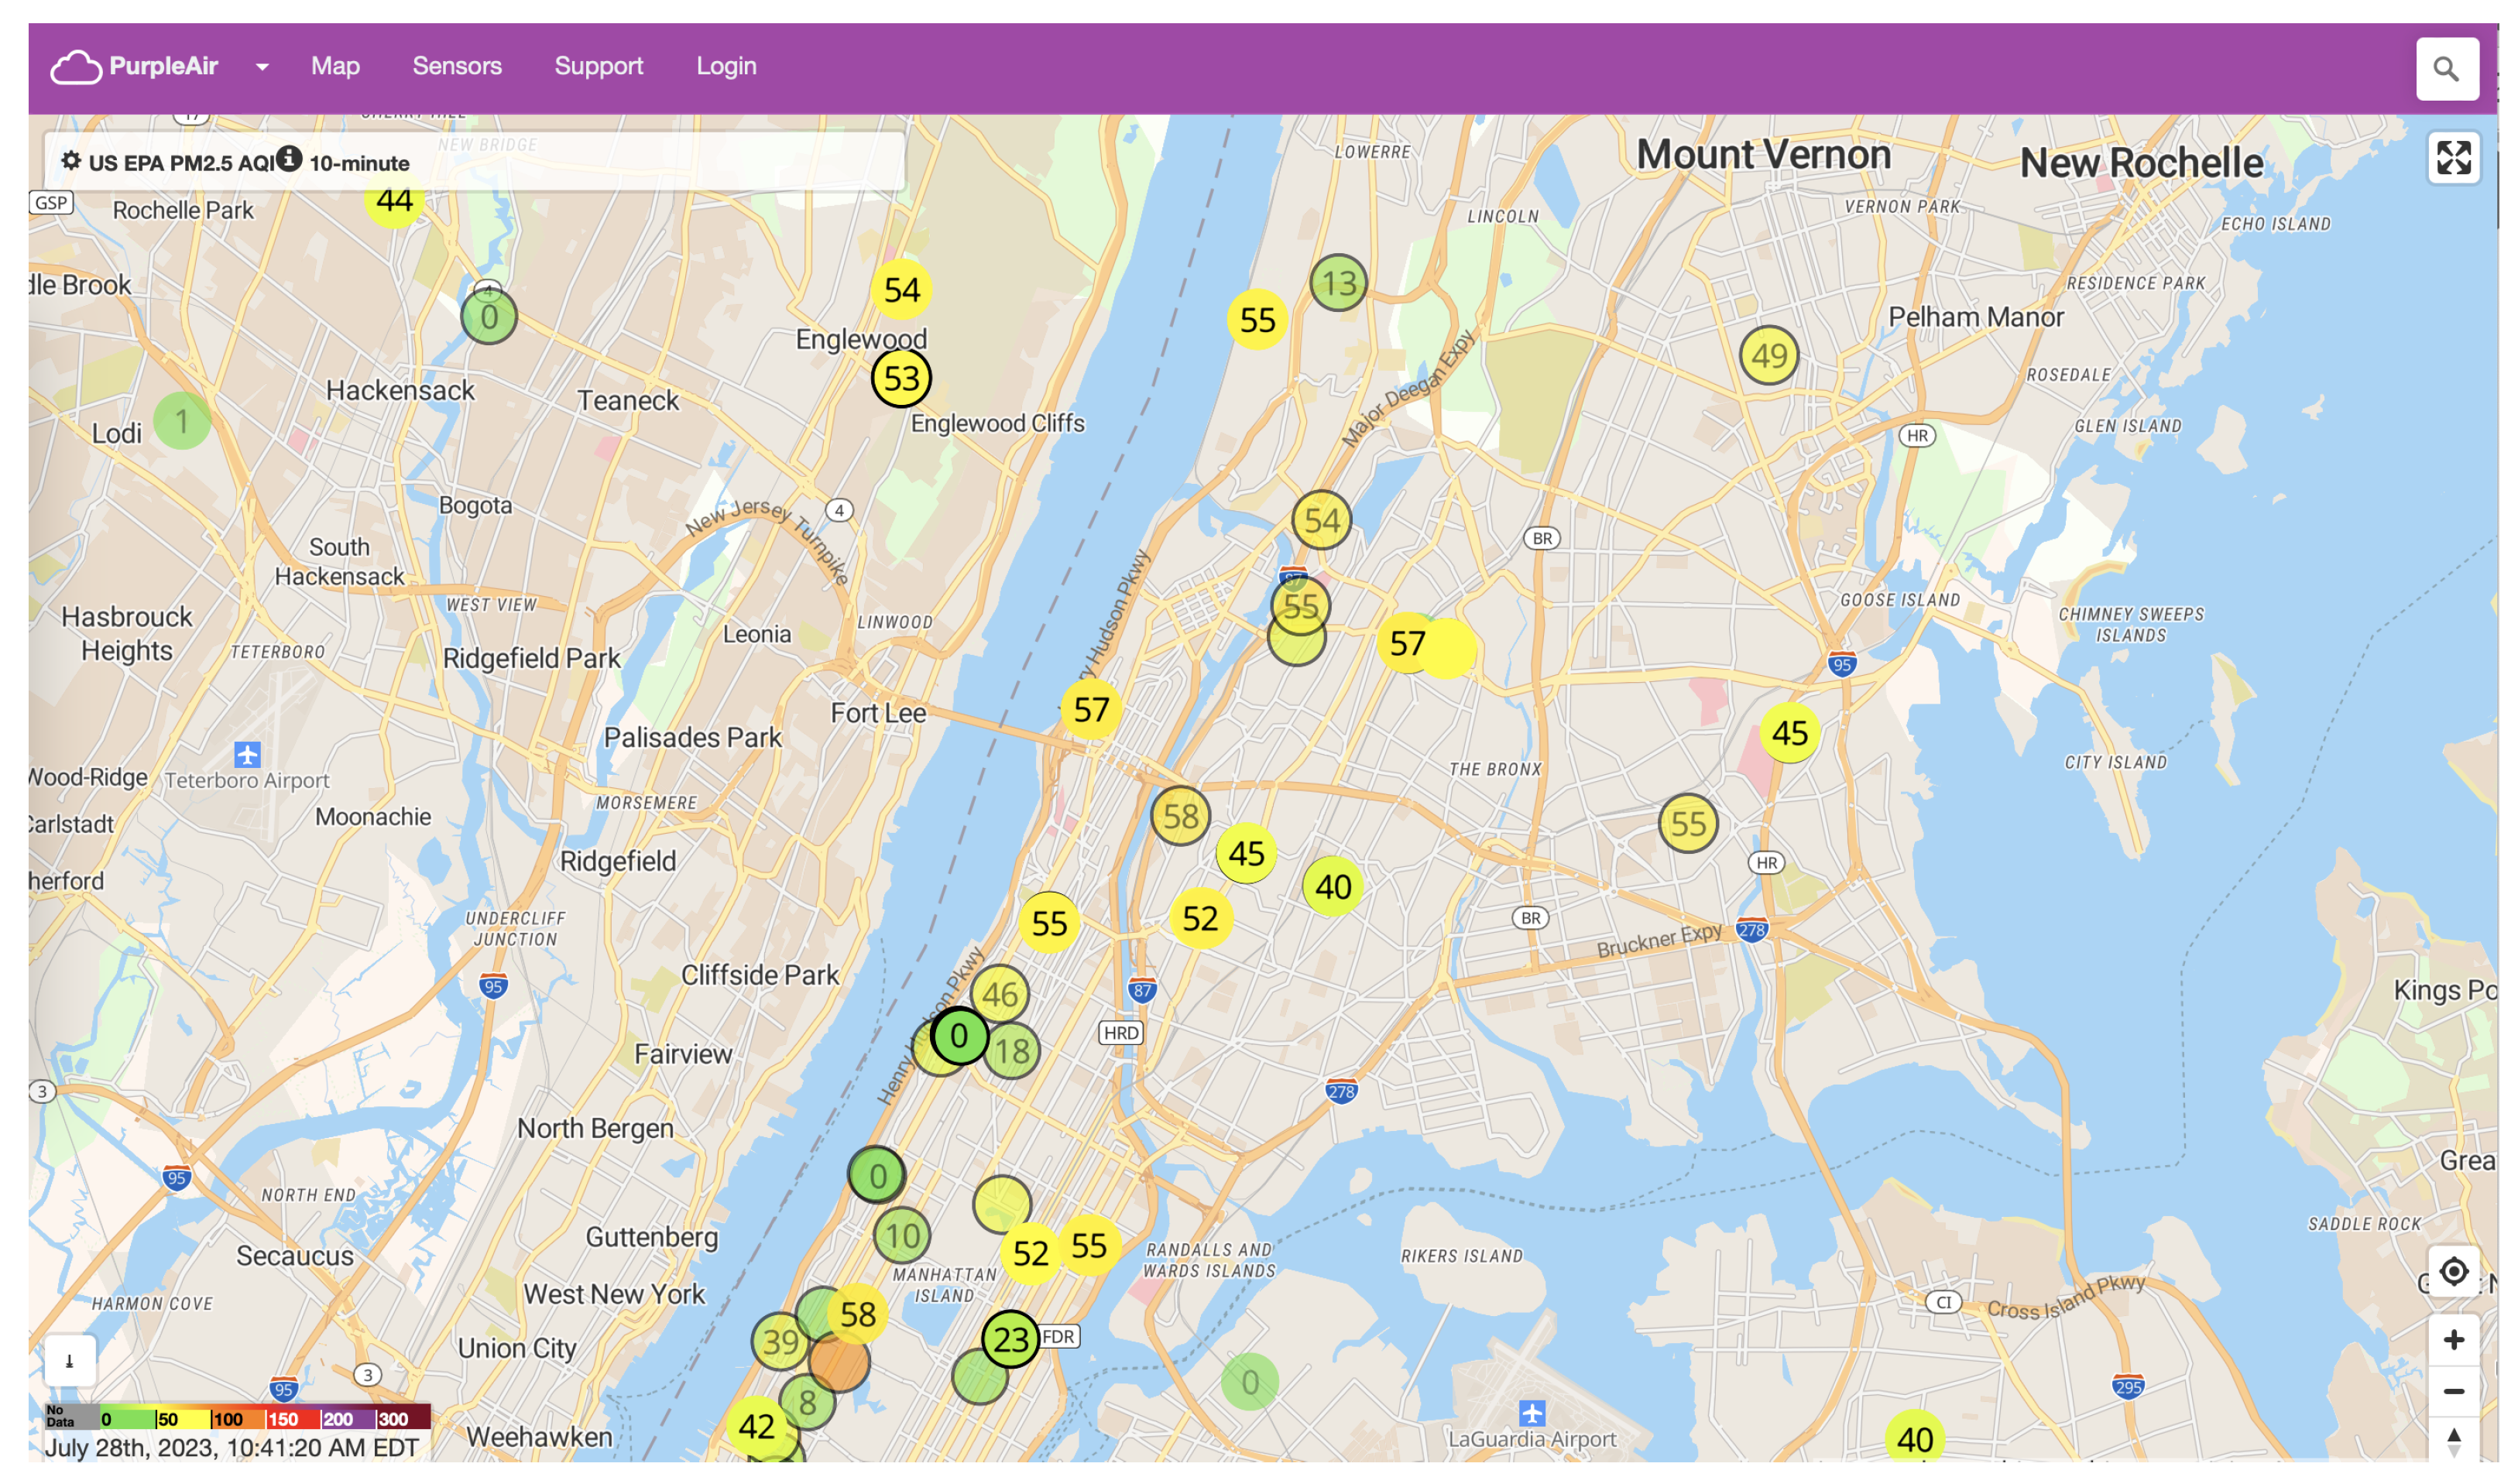
Figure 1. A screenshot of the PurpleAir sensor map centered on the Bronx and Northern Manhattan, NY, showing the public sensors in the vicinity. Note that these are publicly accessible sensors; not all of the sensors shown are part of Project FRESH Air.
Socsci 12 00681 g001
Figure 2. Time series data of the air quality index for the sensor located at a physics lab in Freeman Hall on the Rose Hill campus of Fordham University in the Bronx, NY.
Socsci 12 00681 g002
Figure 3. (A) The sensor project developed during the incubator showing the Arduino microcontroller with the RTC clock data logger board and Grove base shield for attaching peripherals. The dust sensor and temperature, humidity, and pressure sensor board are shown to the left of the microcontroller stack. (B) The assembled incubator project. The boards from (A) are placed within the PVC pipe and an 80 mm fan is attached to one end to flow air through the pipe and over the sensor boards. (C) An assembled portable kit that is used as a classroom project. The microcontroller is mounted inside the 3D-printed box. The dust sensor sits on top and the 7-segment display shows the reading in pcs/0.01 ft 3 . The device is powered by a 9 V battery attached to the back of the box.
Socsci 12 00681 g003
Figure 4. A simplified schematic showing the collection geometry for the PMS5003 dust sensor modules used in the PurpleAir sensors. The particulate matter enter through vent holes in the lower level of the module and are pulled into the upper level through flow holes by a fan. They cross the sensing region, where they scatter light from the laser beam toward a photodetector located below the stream. The PPD42NS uses an LED instead of a laser and the sensing geometry is in a single layer. The light scattering measurements determine the size of the particles that cross the beam within the sample volume. The photodetector collects light that is scattered nominally at 90 . Based on the measured signal, the size of the scatterer is determined using Mie theory.
Socsci 12 00681 g004
Figure 5. Measurements acquired by the incubator prototype sensor during the week of 17–23 March 2020 in the Tottenville neighborhood of Staten Island, NY. The particle measurements are the same in both panels. (A) includes the measured temperature, while (B) reports the measured pressure. The environmental data were recorded with the BME280 sensor, while particle counts were performed in the PPD42NS sensor module.
Socsci 12 00681 g005
Figure 6. Satellite measurements of the average carbon monoxide concentration from May through mid-June due to the 2023 Canadian wildfires. The deep orange shows the extent of the impact outside of Canada, with widespread coverage over much of Central and Eastern United States. Image Credit: ESA/Copernicus Programme/Sentinel-5P-CC-BY-SA IGO 3.0. Contains modified Copernicus Sentinel data 2023.
Socsci 12 00681 g006
Figure 7. FRESH Air sensor data for the month of June 2023, in which the Canadian wildfires severely affected the air quality in New York City. The data are from Fordham University and three partner schools, showing the concentration of PM 2.5 for the (A) indoor and (B) outdoor sensors.
Socsci 12 00681 g007
Table 1. Bill of materials for the incubator prototype sensor platform. The sensor components were purchased from Seeedstudio (https://www.seeedstudio.com/, accessed on 1 September 2023) and Adafruit (https://www.adafruit.com/, accessed on 1 September 2023). The pipe and fan are generic components that were used to protect the sensor from the weather and draw air into the tube, respectively.
ComponentPart NumberVendor
MicrocontrollerArduino UnoAdafruit
Grove Base Shield V2.0103030000SeeedStudio
Grove Dust SensorPPD42NSSeeedStudio
Temperature, Humidity, Pressure SensorBME280SeeedStudio
Data Logger Shield1141Adafruit
9VDC Power Supply63Adafruit
PVC Pipe, 3 × 3 Home Depot
80 mm fanAmazon
SD Card, 8 GB1294Adafruit
Table 2. Bill of materials for the particle sensor kits used in the classroom and built by students. The components were purchased from Seeedstudio (https://www.seeedstudio.com/, accessed on 1 September 2023) and Adafruit (https://www.adafruit.com/, accessed on 1 September 2023). The case was 3D-printed at Fordham, and the STL file is available upon request.
ComponentPart NumberVendor
MicrocontrollerSeeeduino V4.3SeeedStudio
Grove Dust SensorPPD42NSSeeedStudio
7-Segment Display880Adafruit
9 V Battery Holder67Adafruit
Jumpers F/M 3 1953Adafruit
9 V Battery1321Adafruit
Table 3. AQI scale used by the EPA to indicate the air quality level for pollutants. The concentrations for PM 2.5 shown are for 24-h average exposure.
Level of ConcernValues of IndexConcentration Range ( μ g/m 3 )
Good0–500–12
Moderate51–10012.1–35.4
Unhealthy for Sensitive Individuals101–15035.5–55.4
Unhealthy151–20055.5–150.4
Very Unhealthy201–300150.5–250.4
Hazardous300 and higher250.5 and higher
Disclaimer/Publisher’s Note: The statements, opinions and data contained in all publications are solely those of the individual author(s) and contributor(s) and not of MDPI and/or the editor(s). MDPI and/or the editor(s) disclaim responsibility for any injury to people or property resulting from any ideas, methods, instructions or products referred to in the content.