
Costs and Consequences of Traffic Fines and Fees: A Case Study of Open Warrants in Las Vegas, Nevada


Abstract
:1. Introduction
2. Why Assess Fines for Traffic Violations?
2.1. Fines and Fees System Makes Roads Safer
2.2. Traffic Fines and Fees System as a State’s Revenue Generating Instrument
2.3. Fines and Fees Compound Economic and Racial Inequalities
3. Methods
3.1. Data Sources
3.1.1. 2017–2018 Nevada Legislative Interim Study Committee
3.1.2. Las Vegas Municipal Court Open Warrant Data: 2012–2020
3.2. Data Analysis
4. Results
4.1. Why Has Nevada Increased Fines and Fees? A Legislative History
- USD 1 for city/county juvenile court(s);
- USD 3 for Municipal/Justice court(s);
- USD 5 to Supreme Court/The Administrative Office of the Courts (AOC)
- USD 2 for AOC;
- USD 2 for Uniform System of Judicial Records (USJR);
- USD 1 Judicial Education;
- USD 1 for Peace Officer Standards and Training (POST).
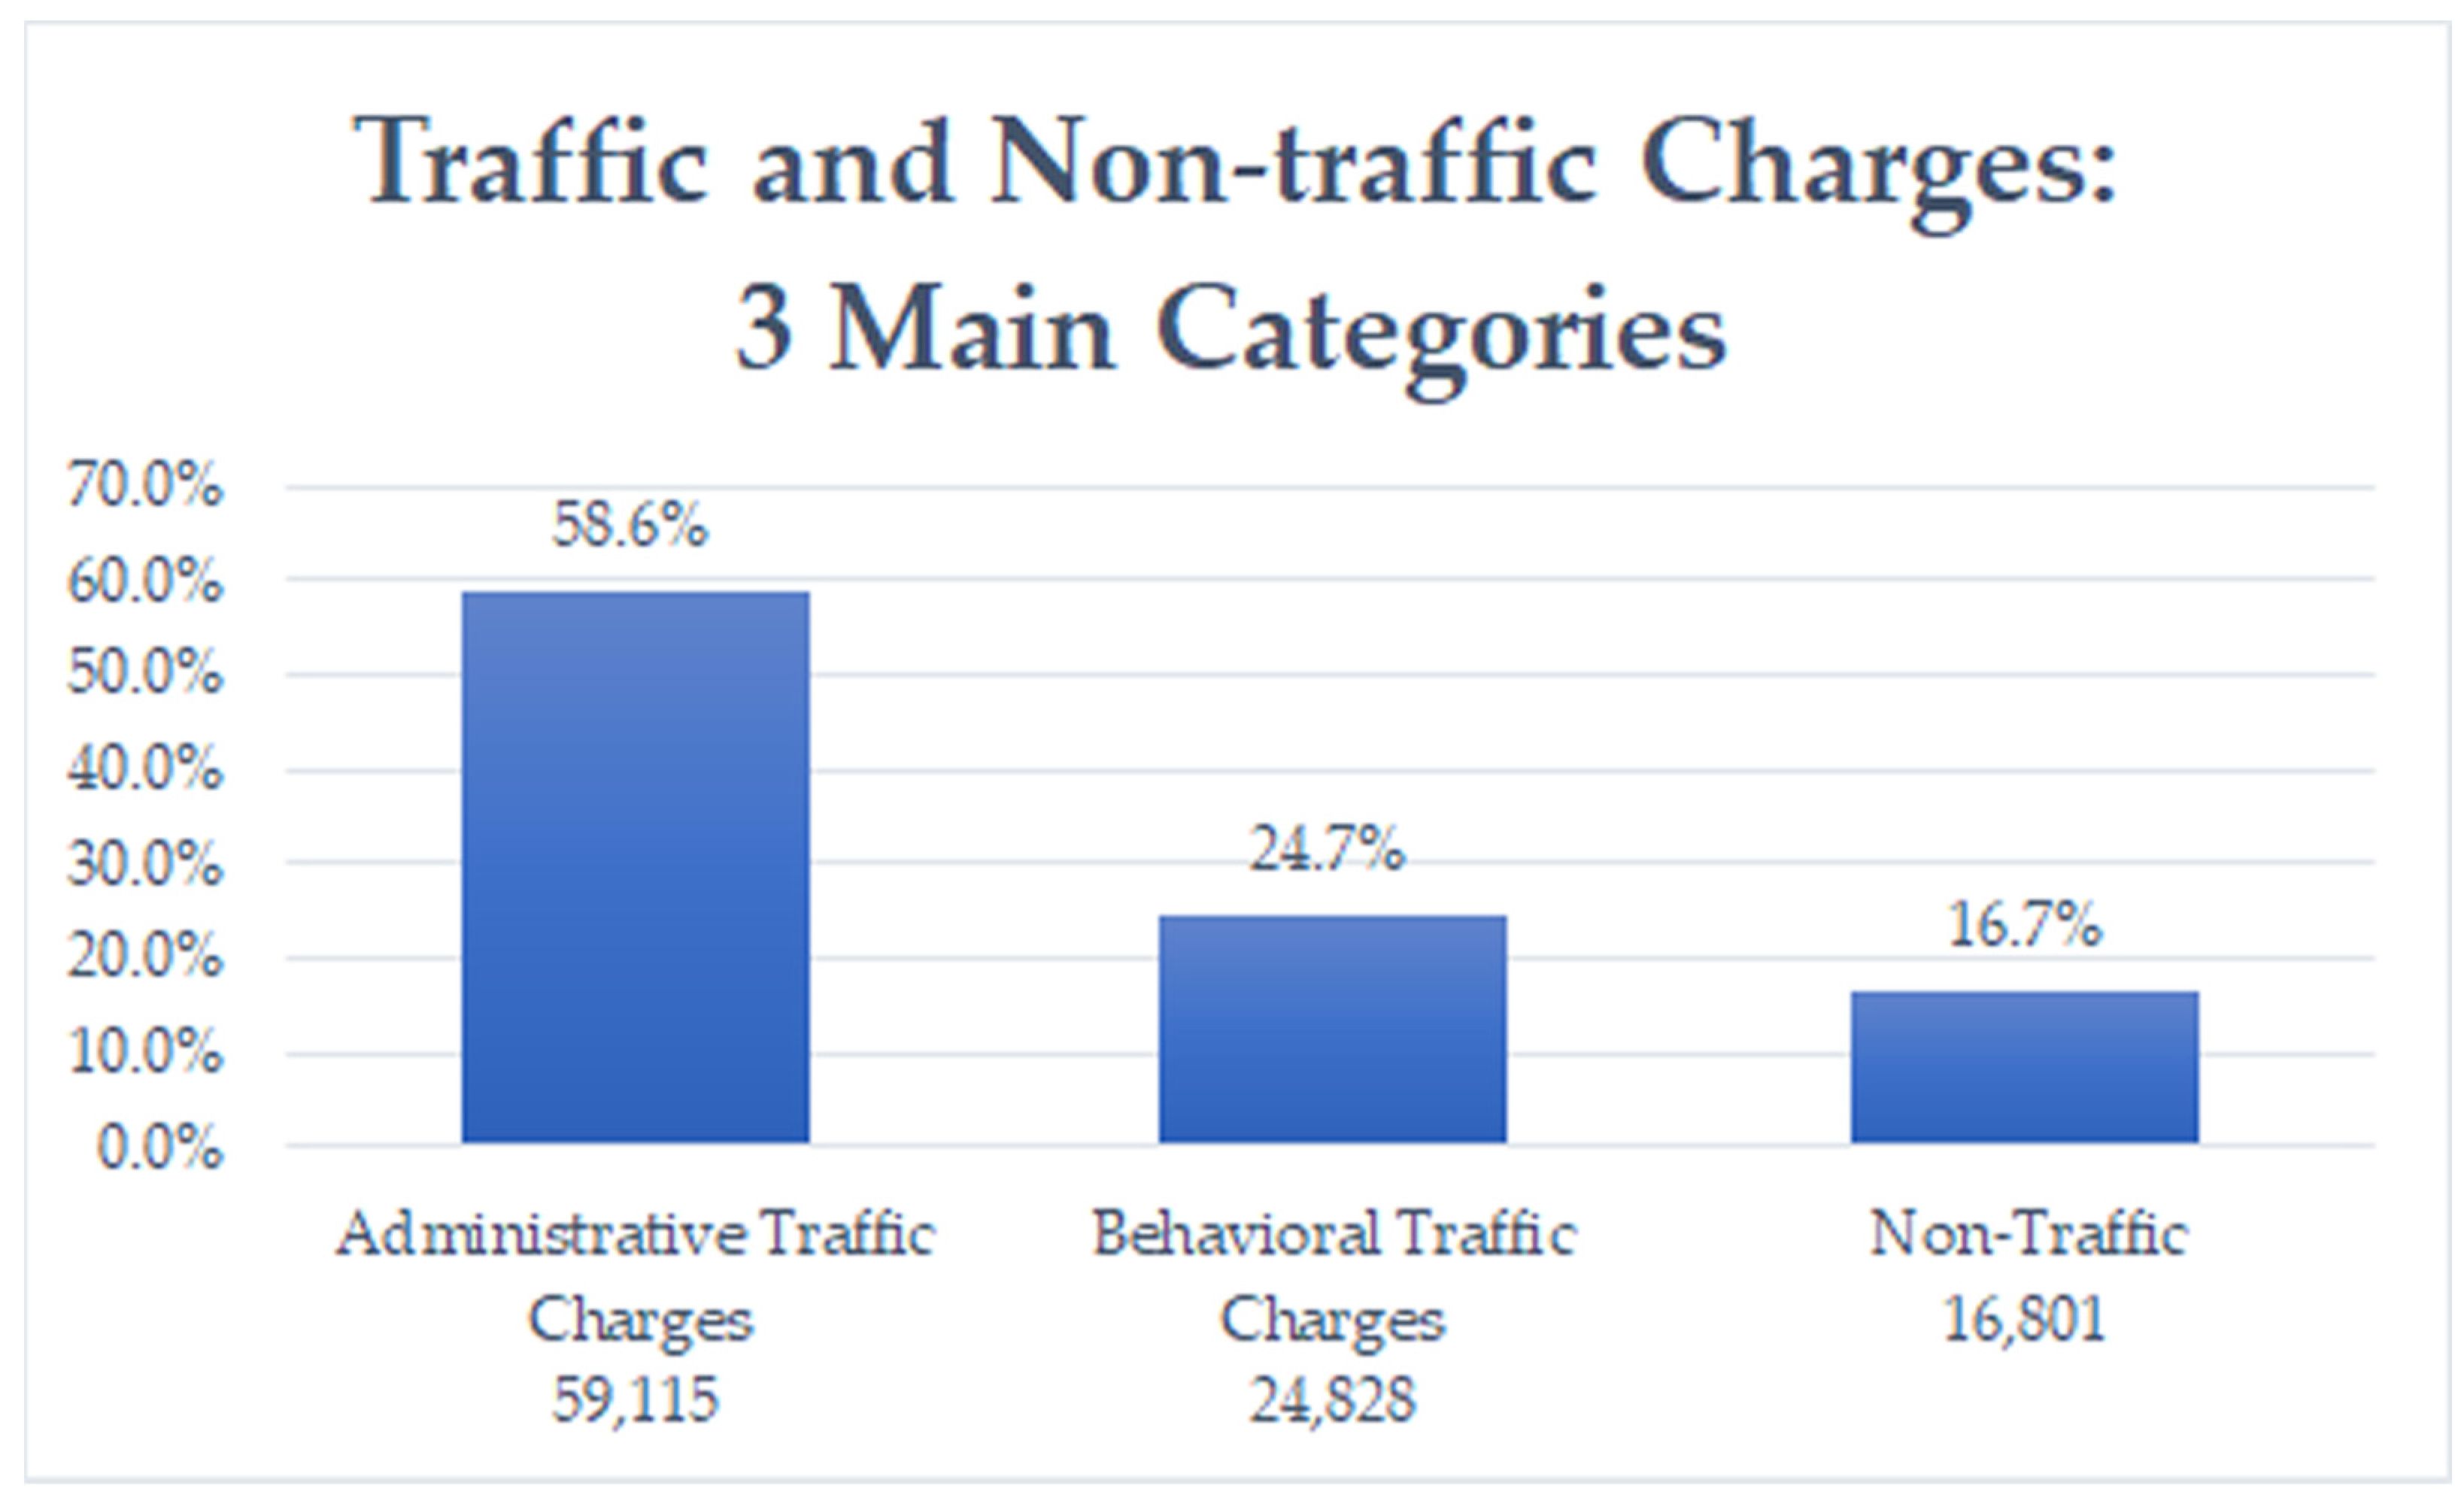
4.2. What Violations Receive the Most Warrants?
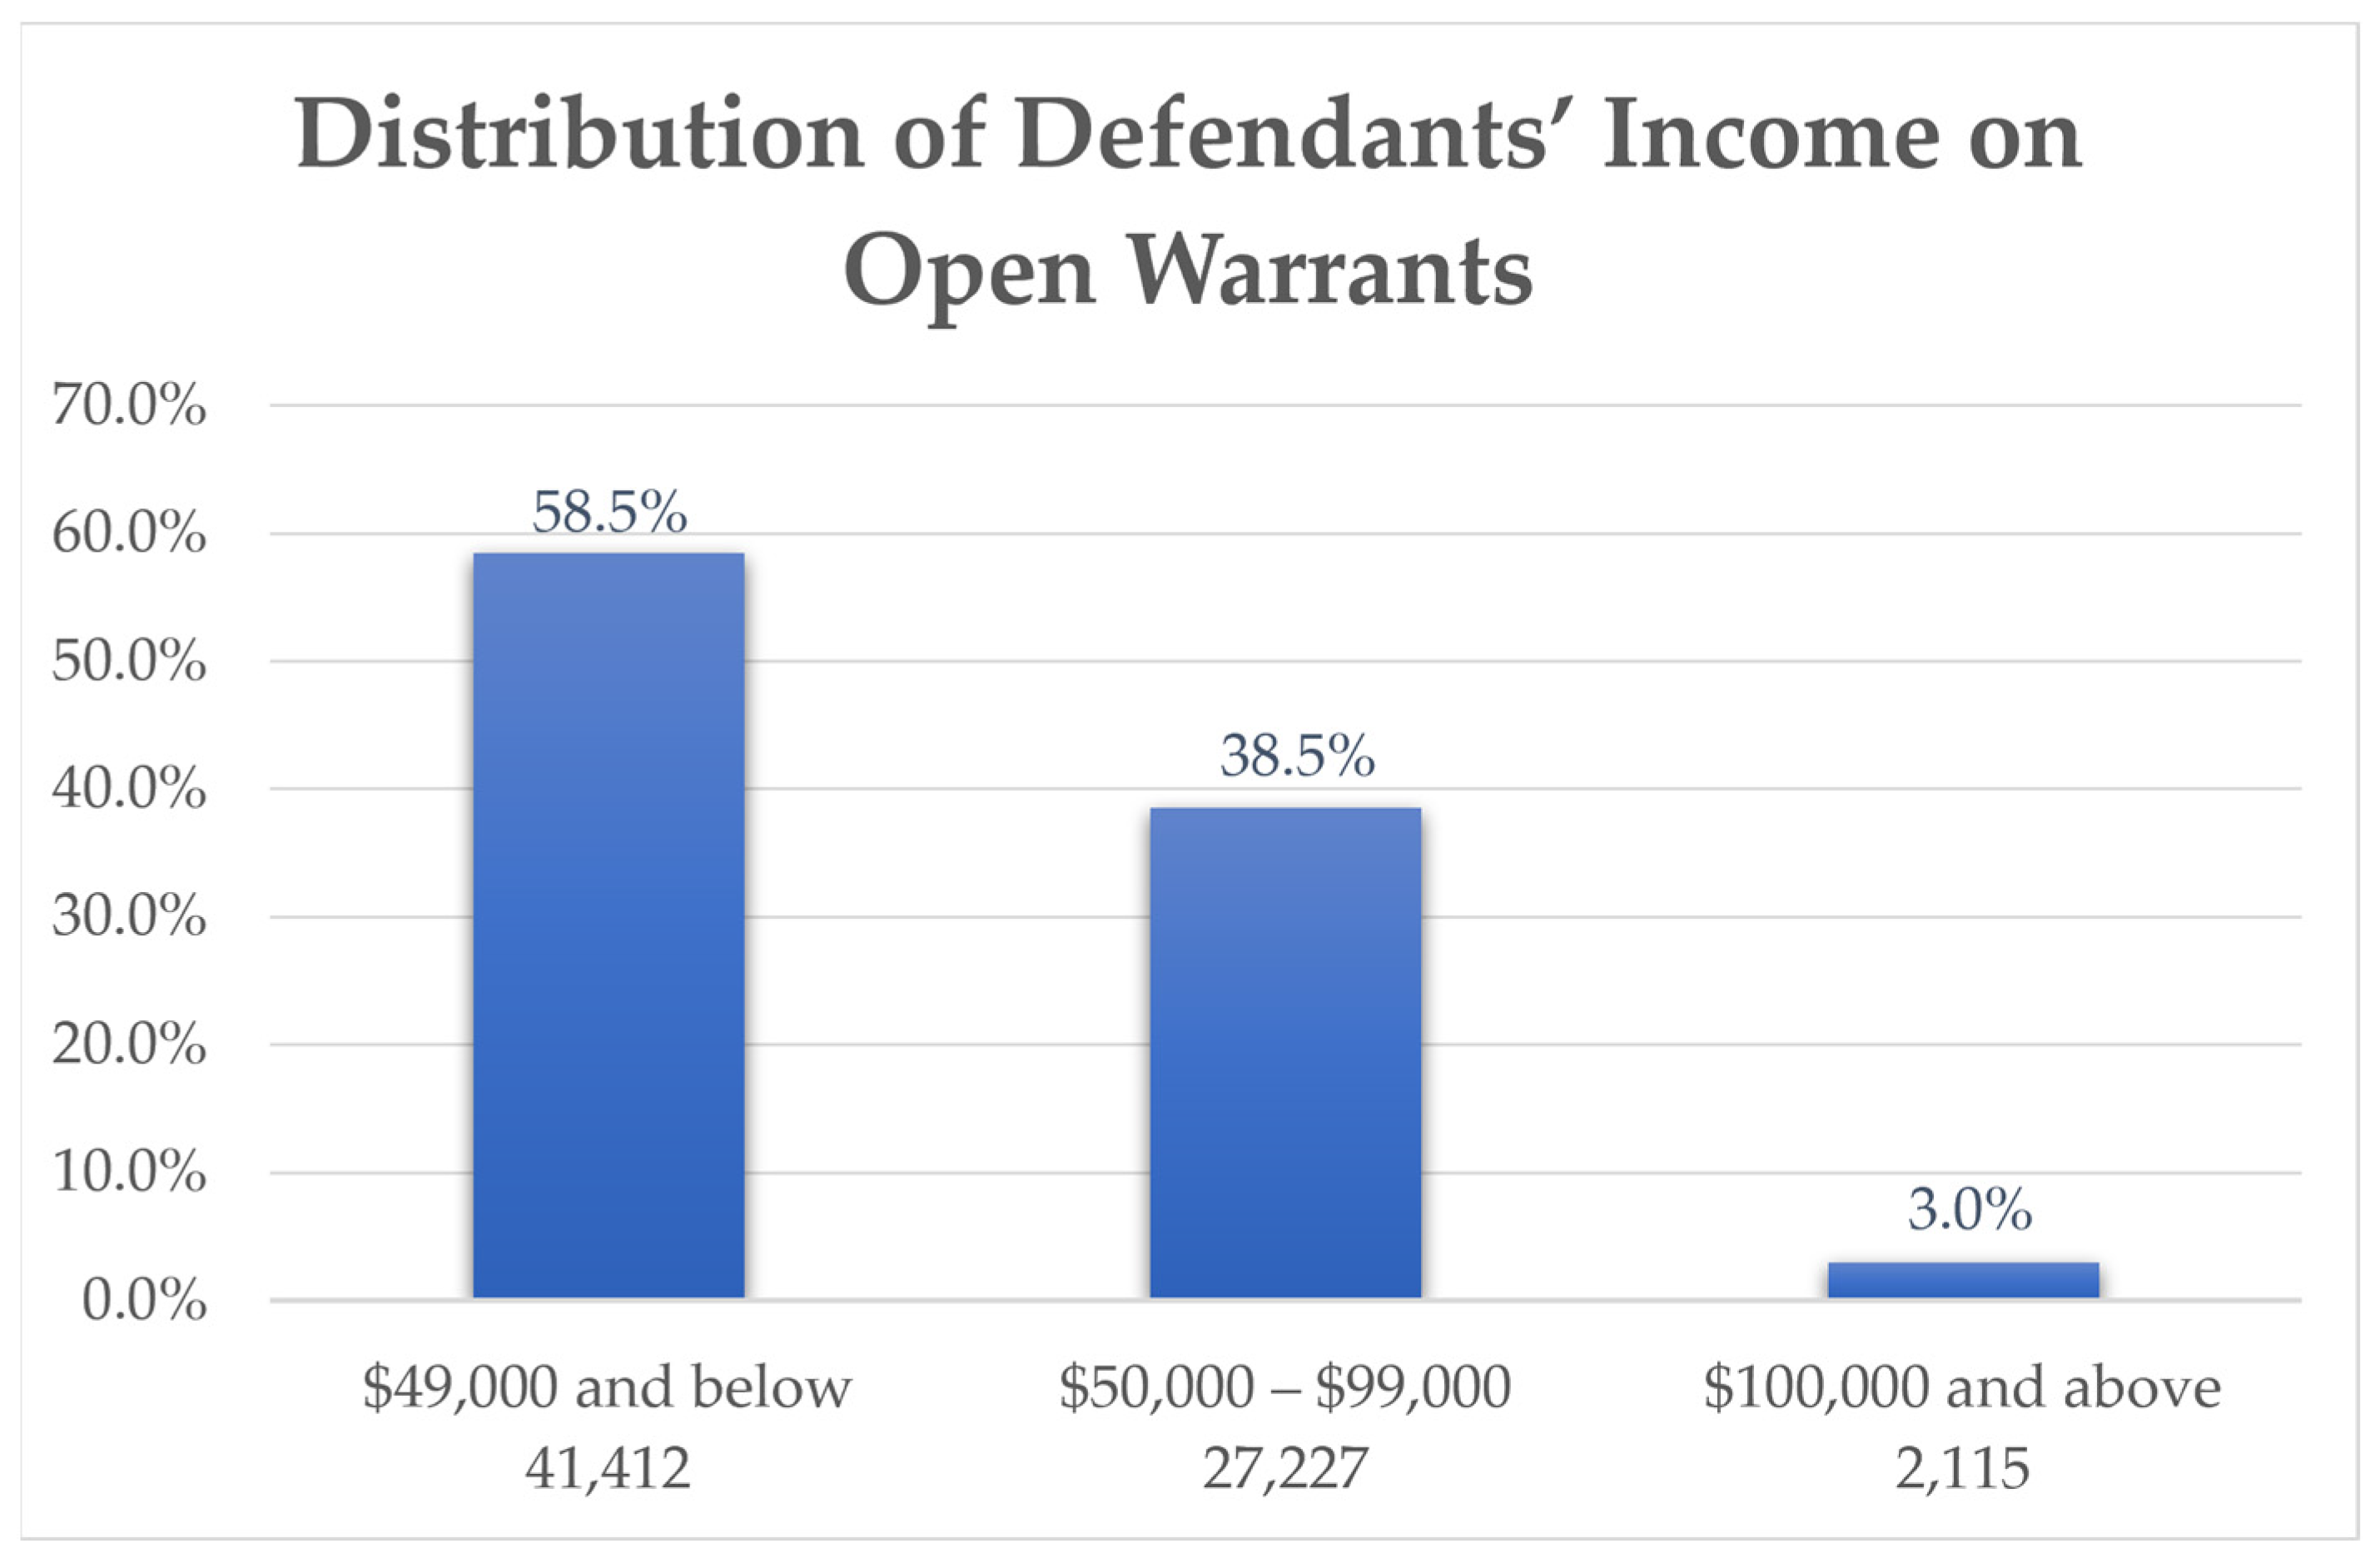
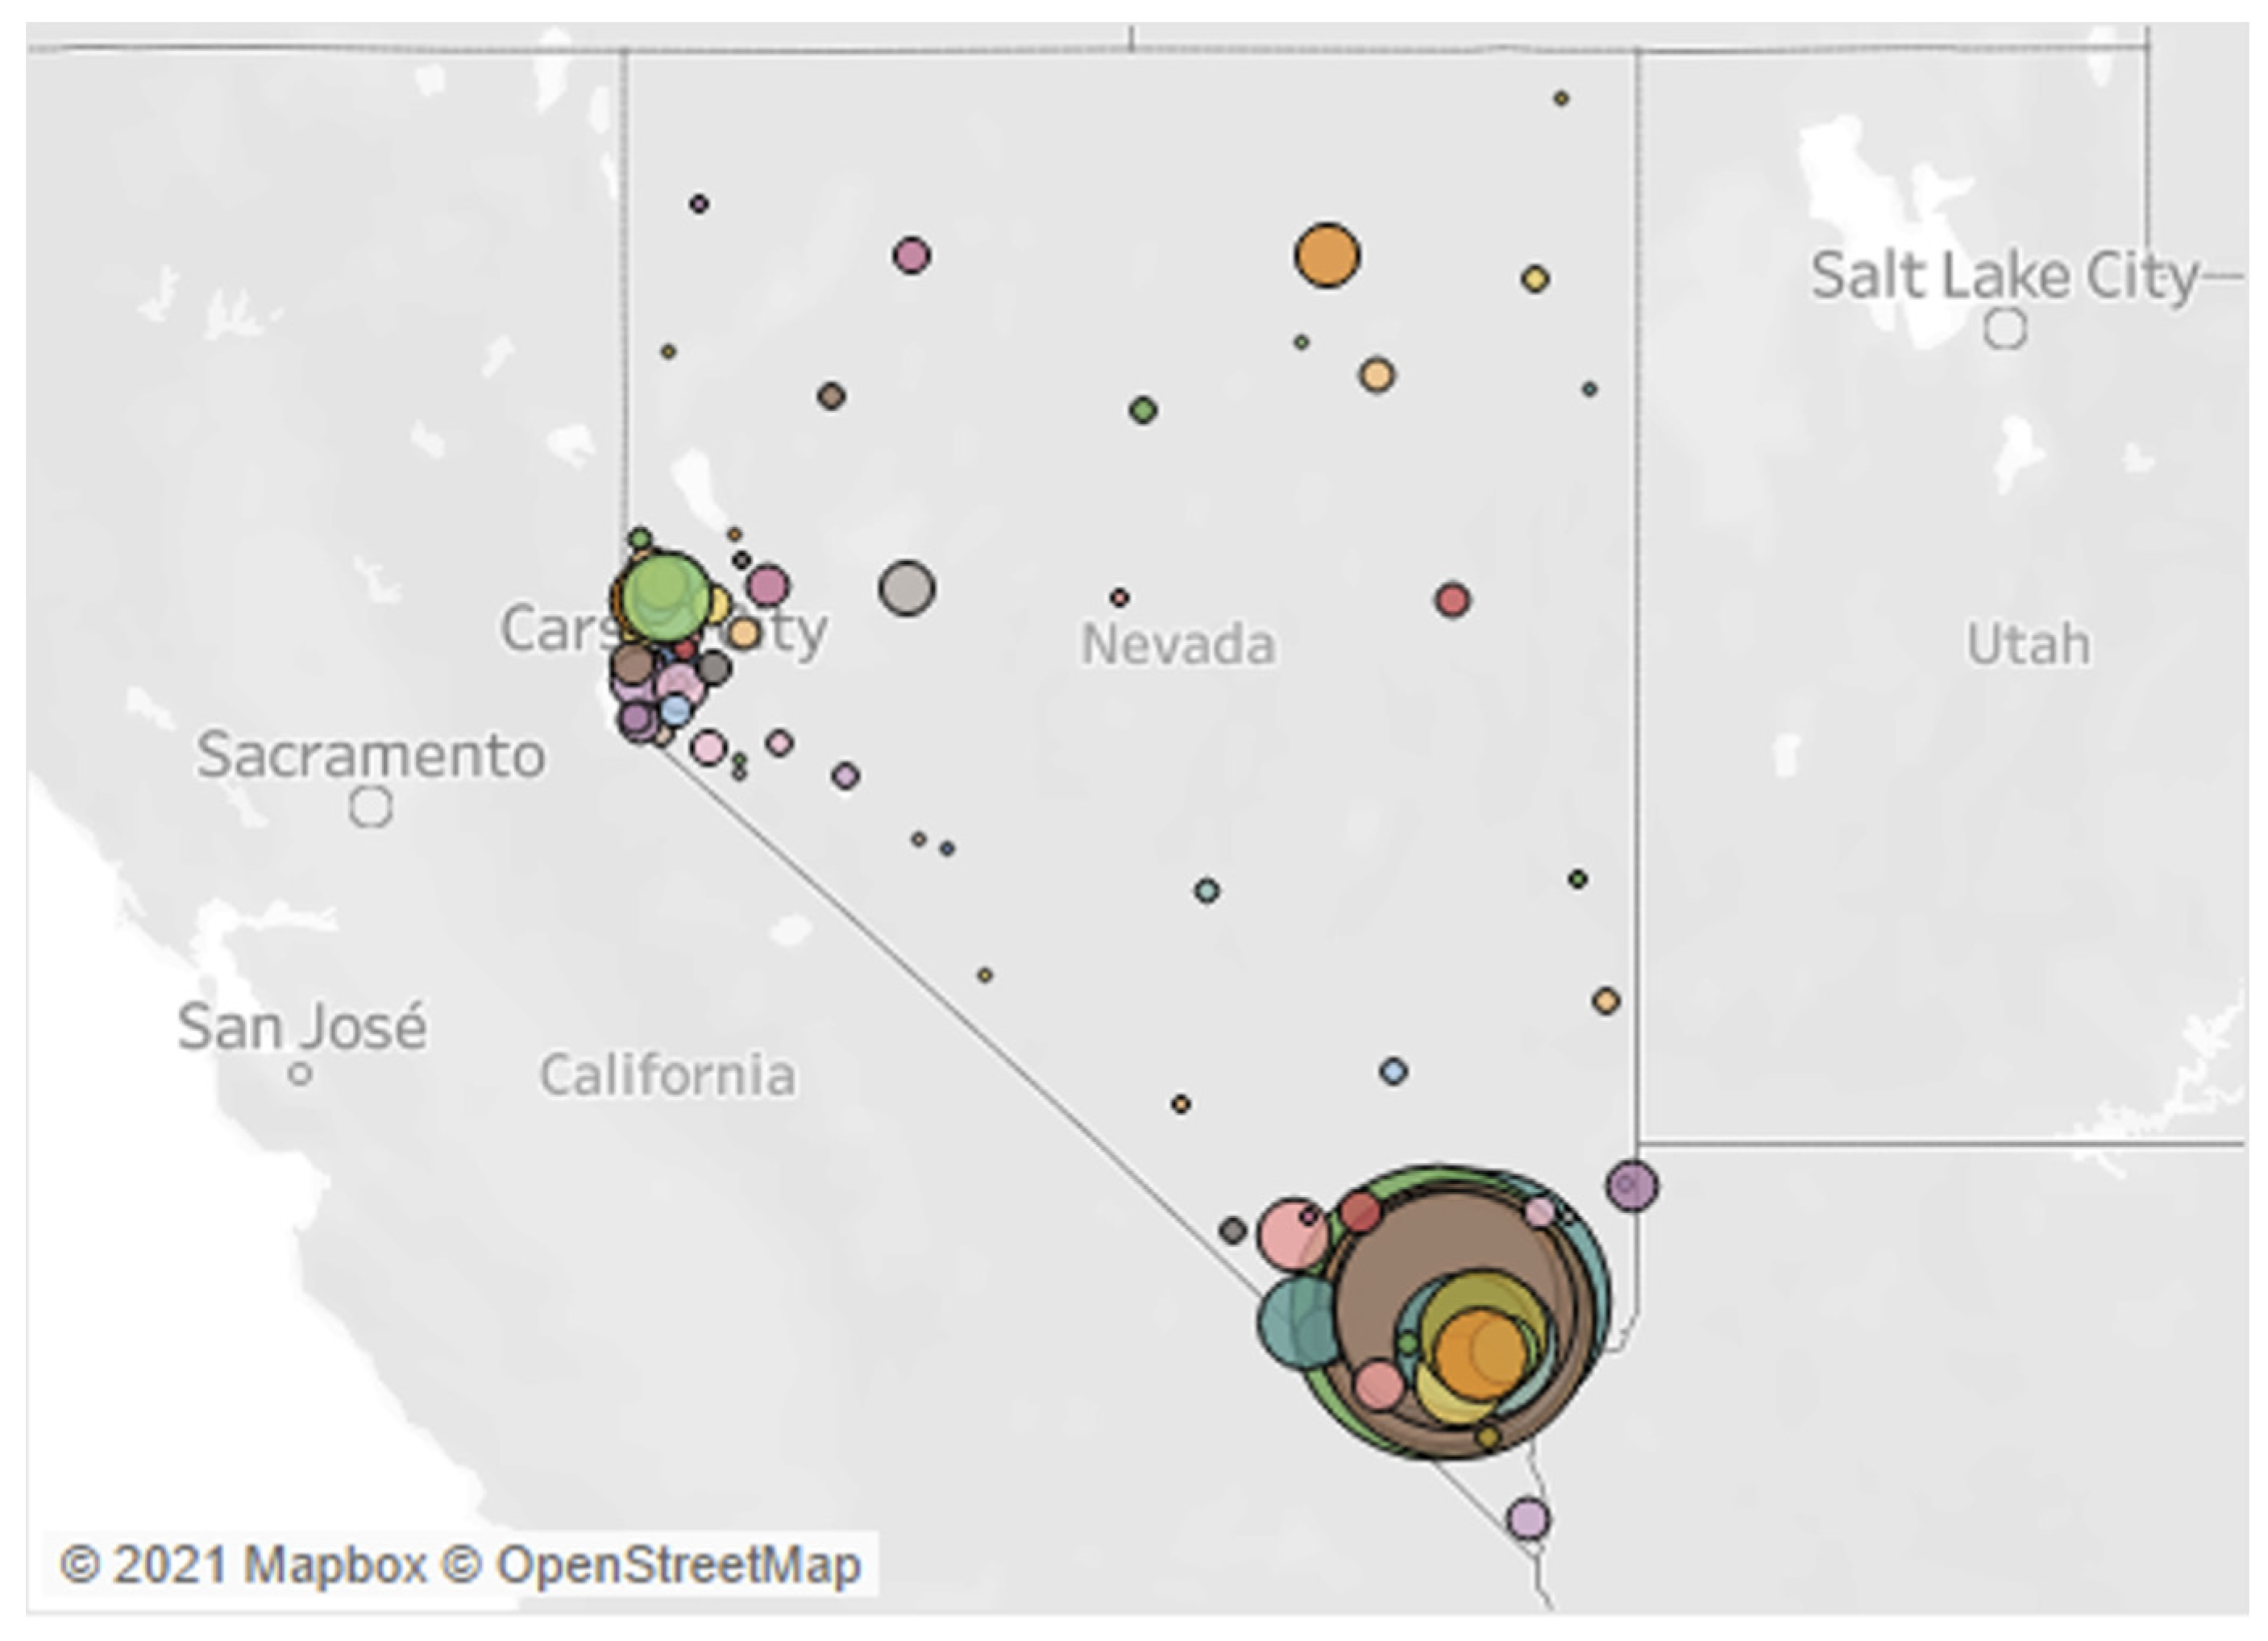
4.3. Who Is Impacted? Economic Inequality
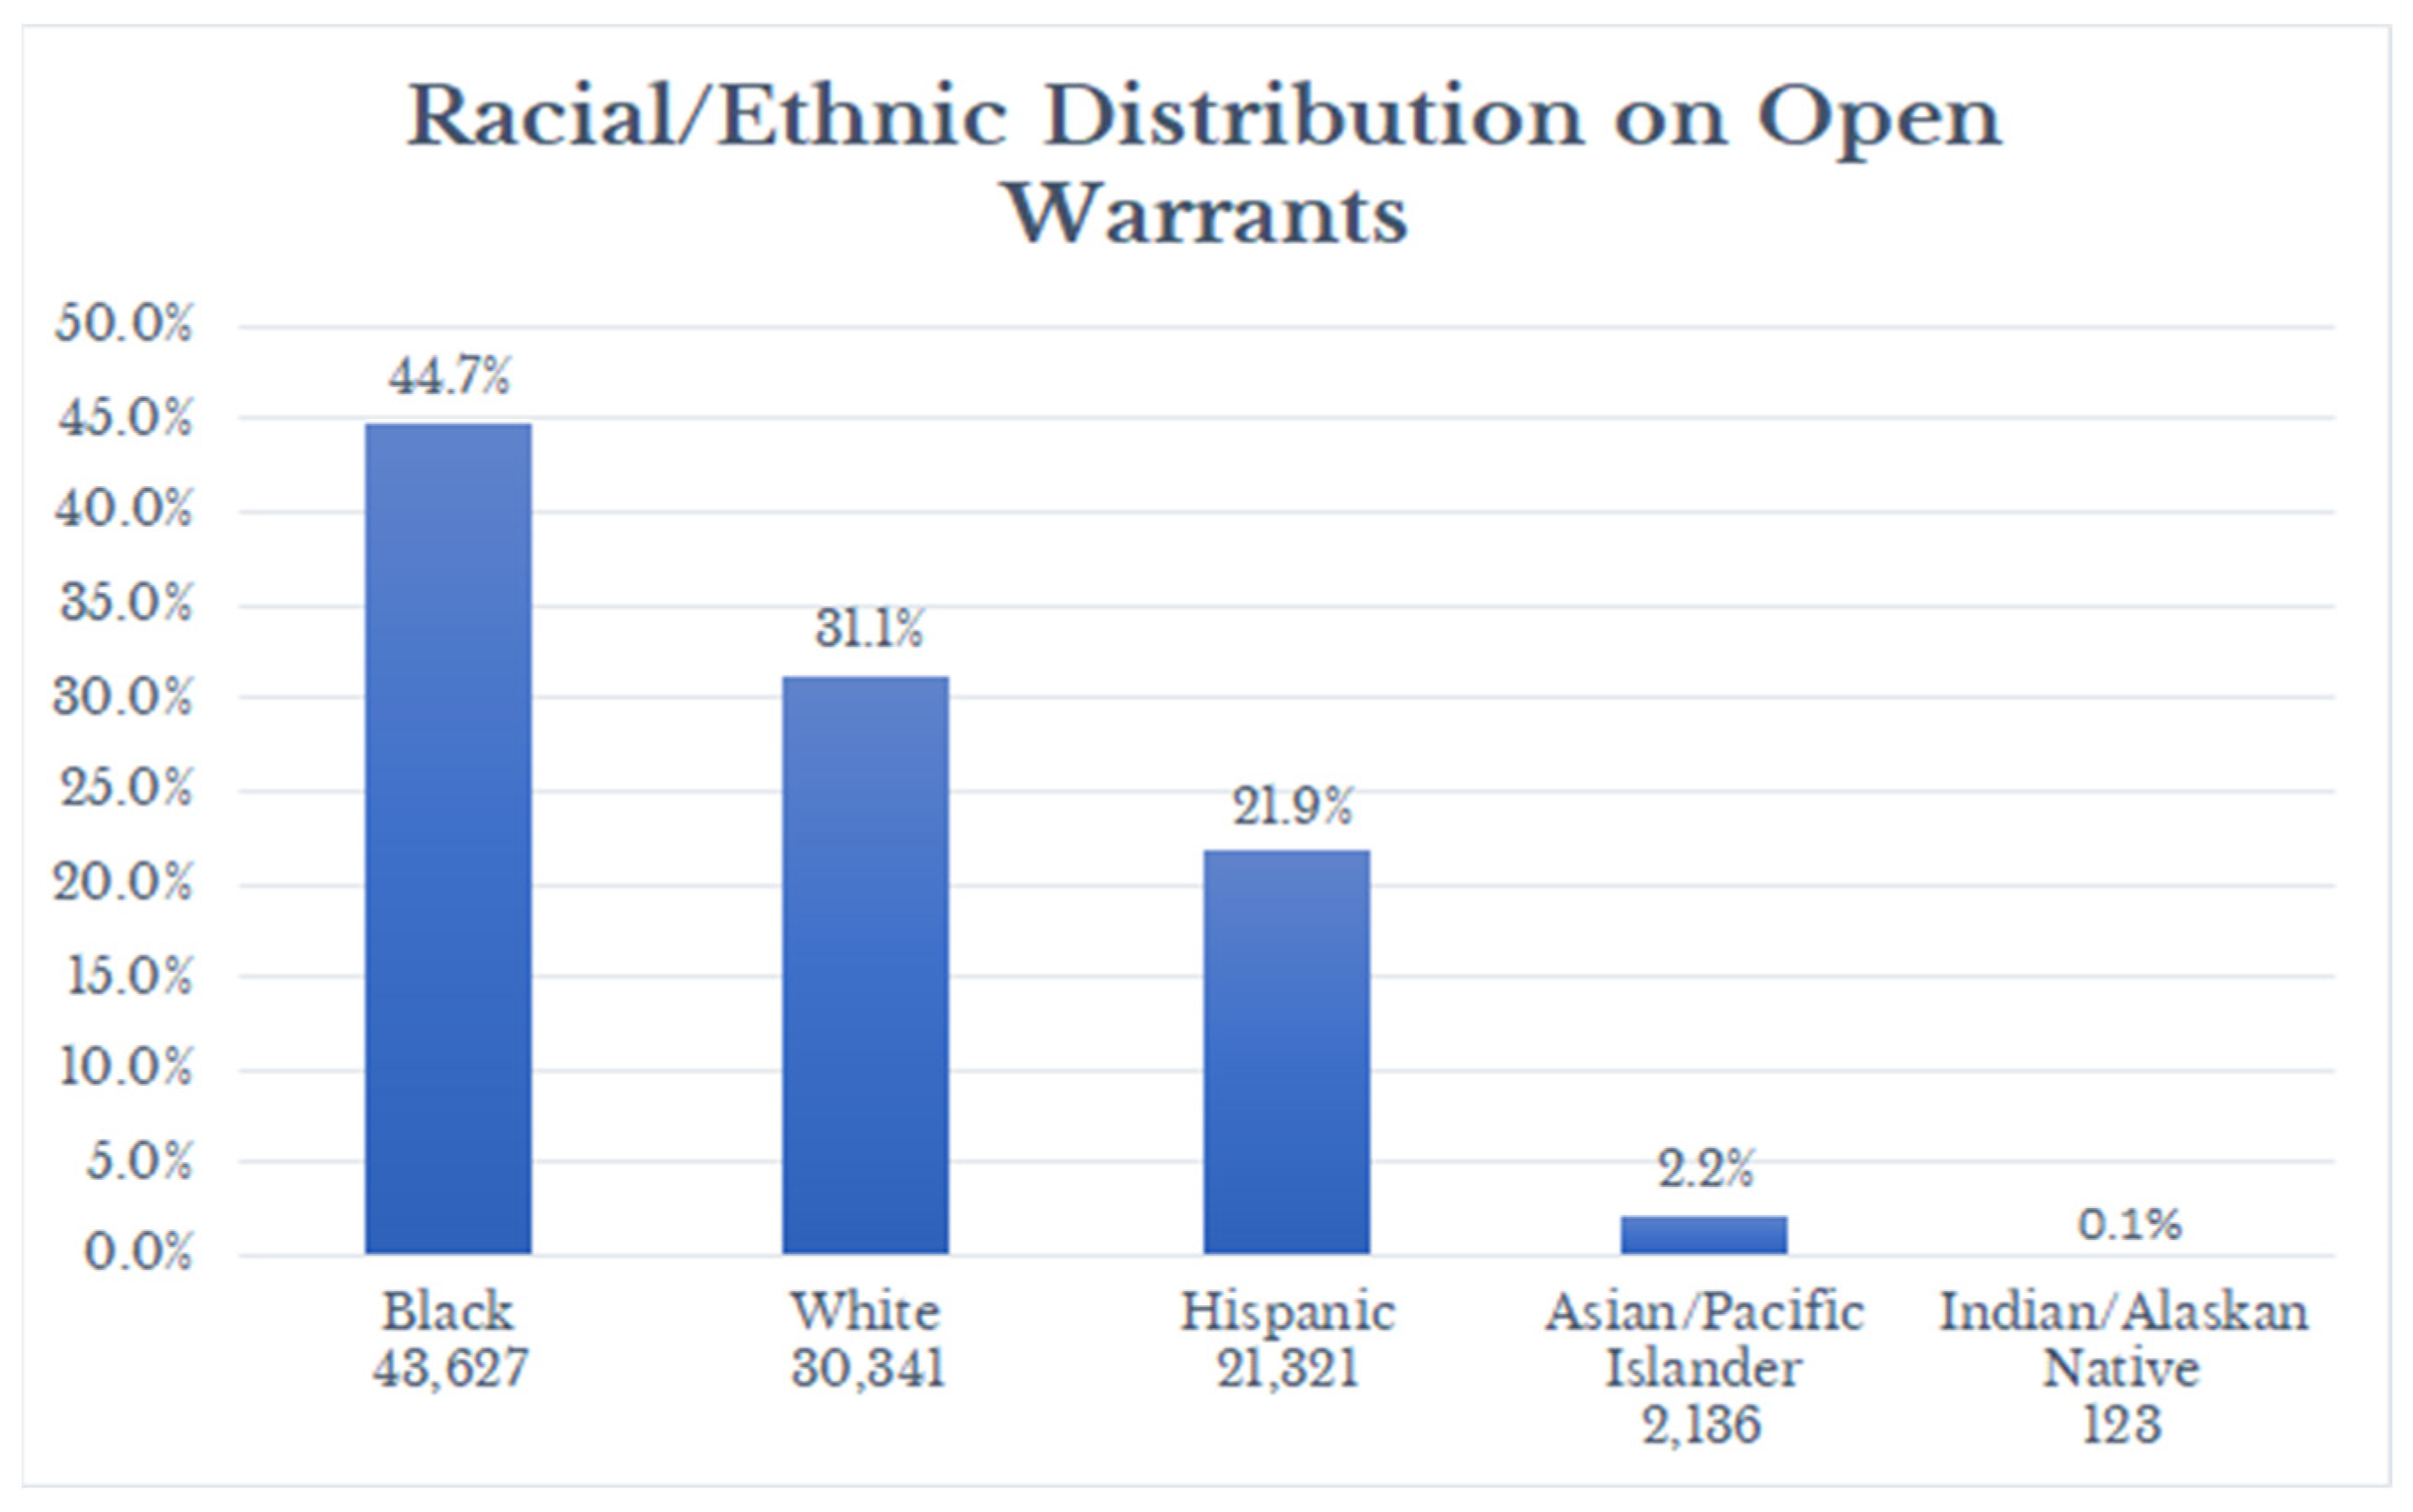
4.4. Who Is Impacted? Racial Inequality
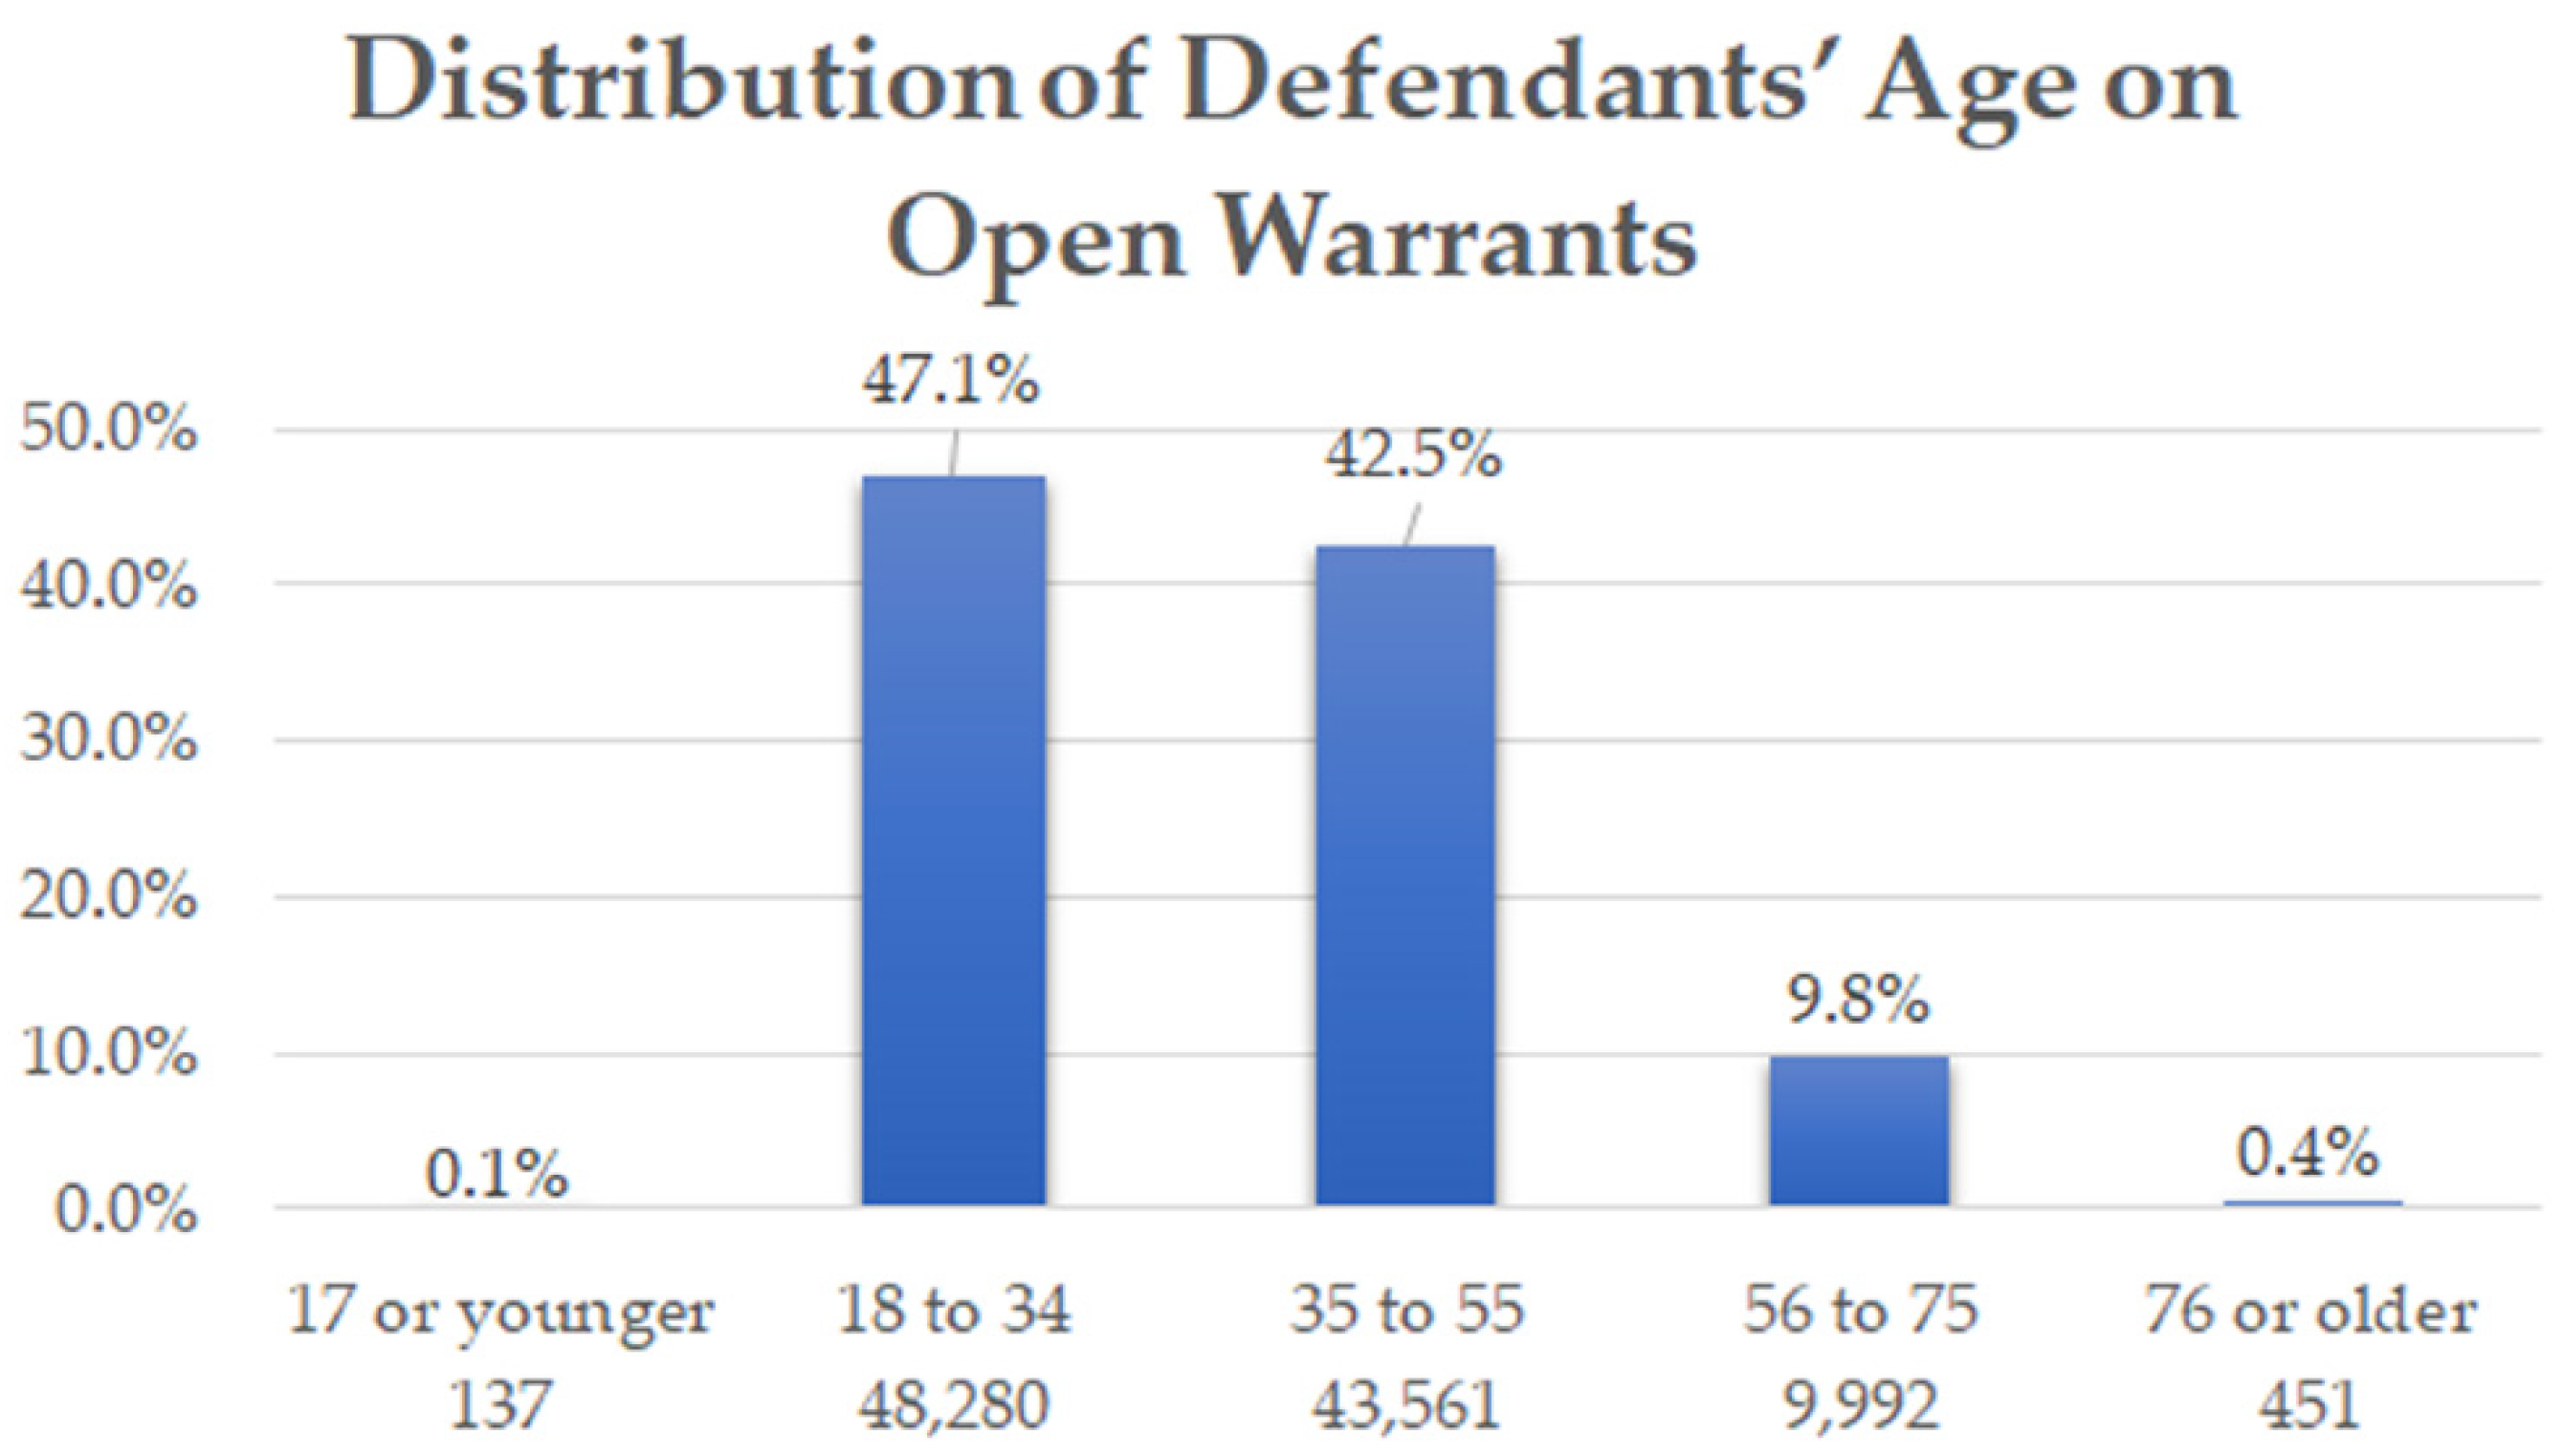
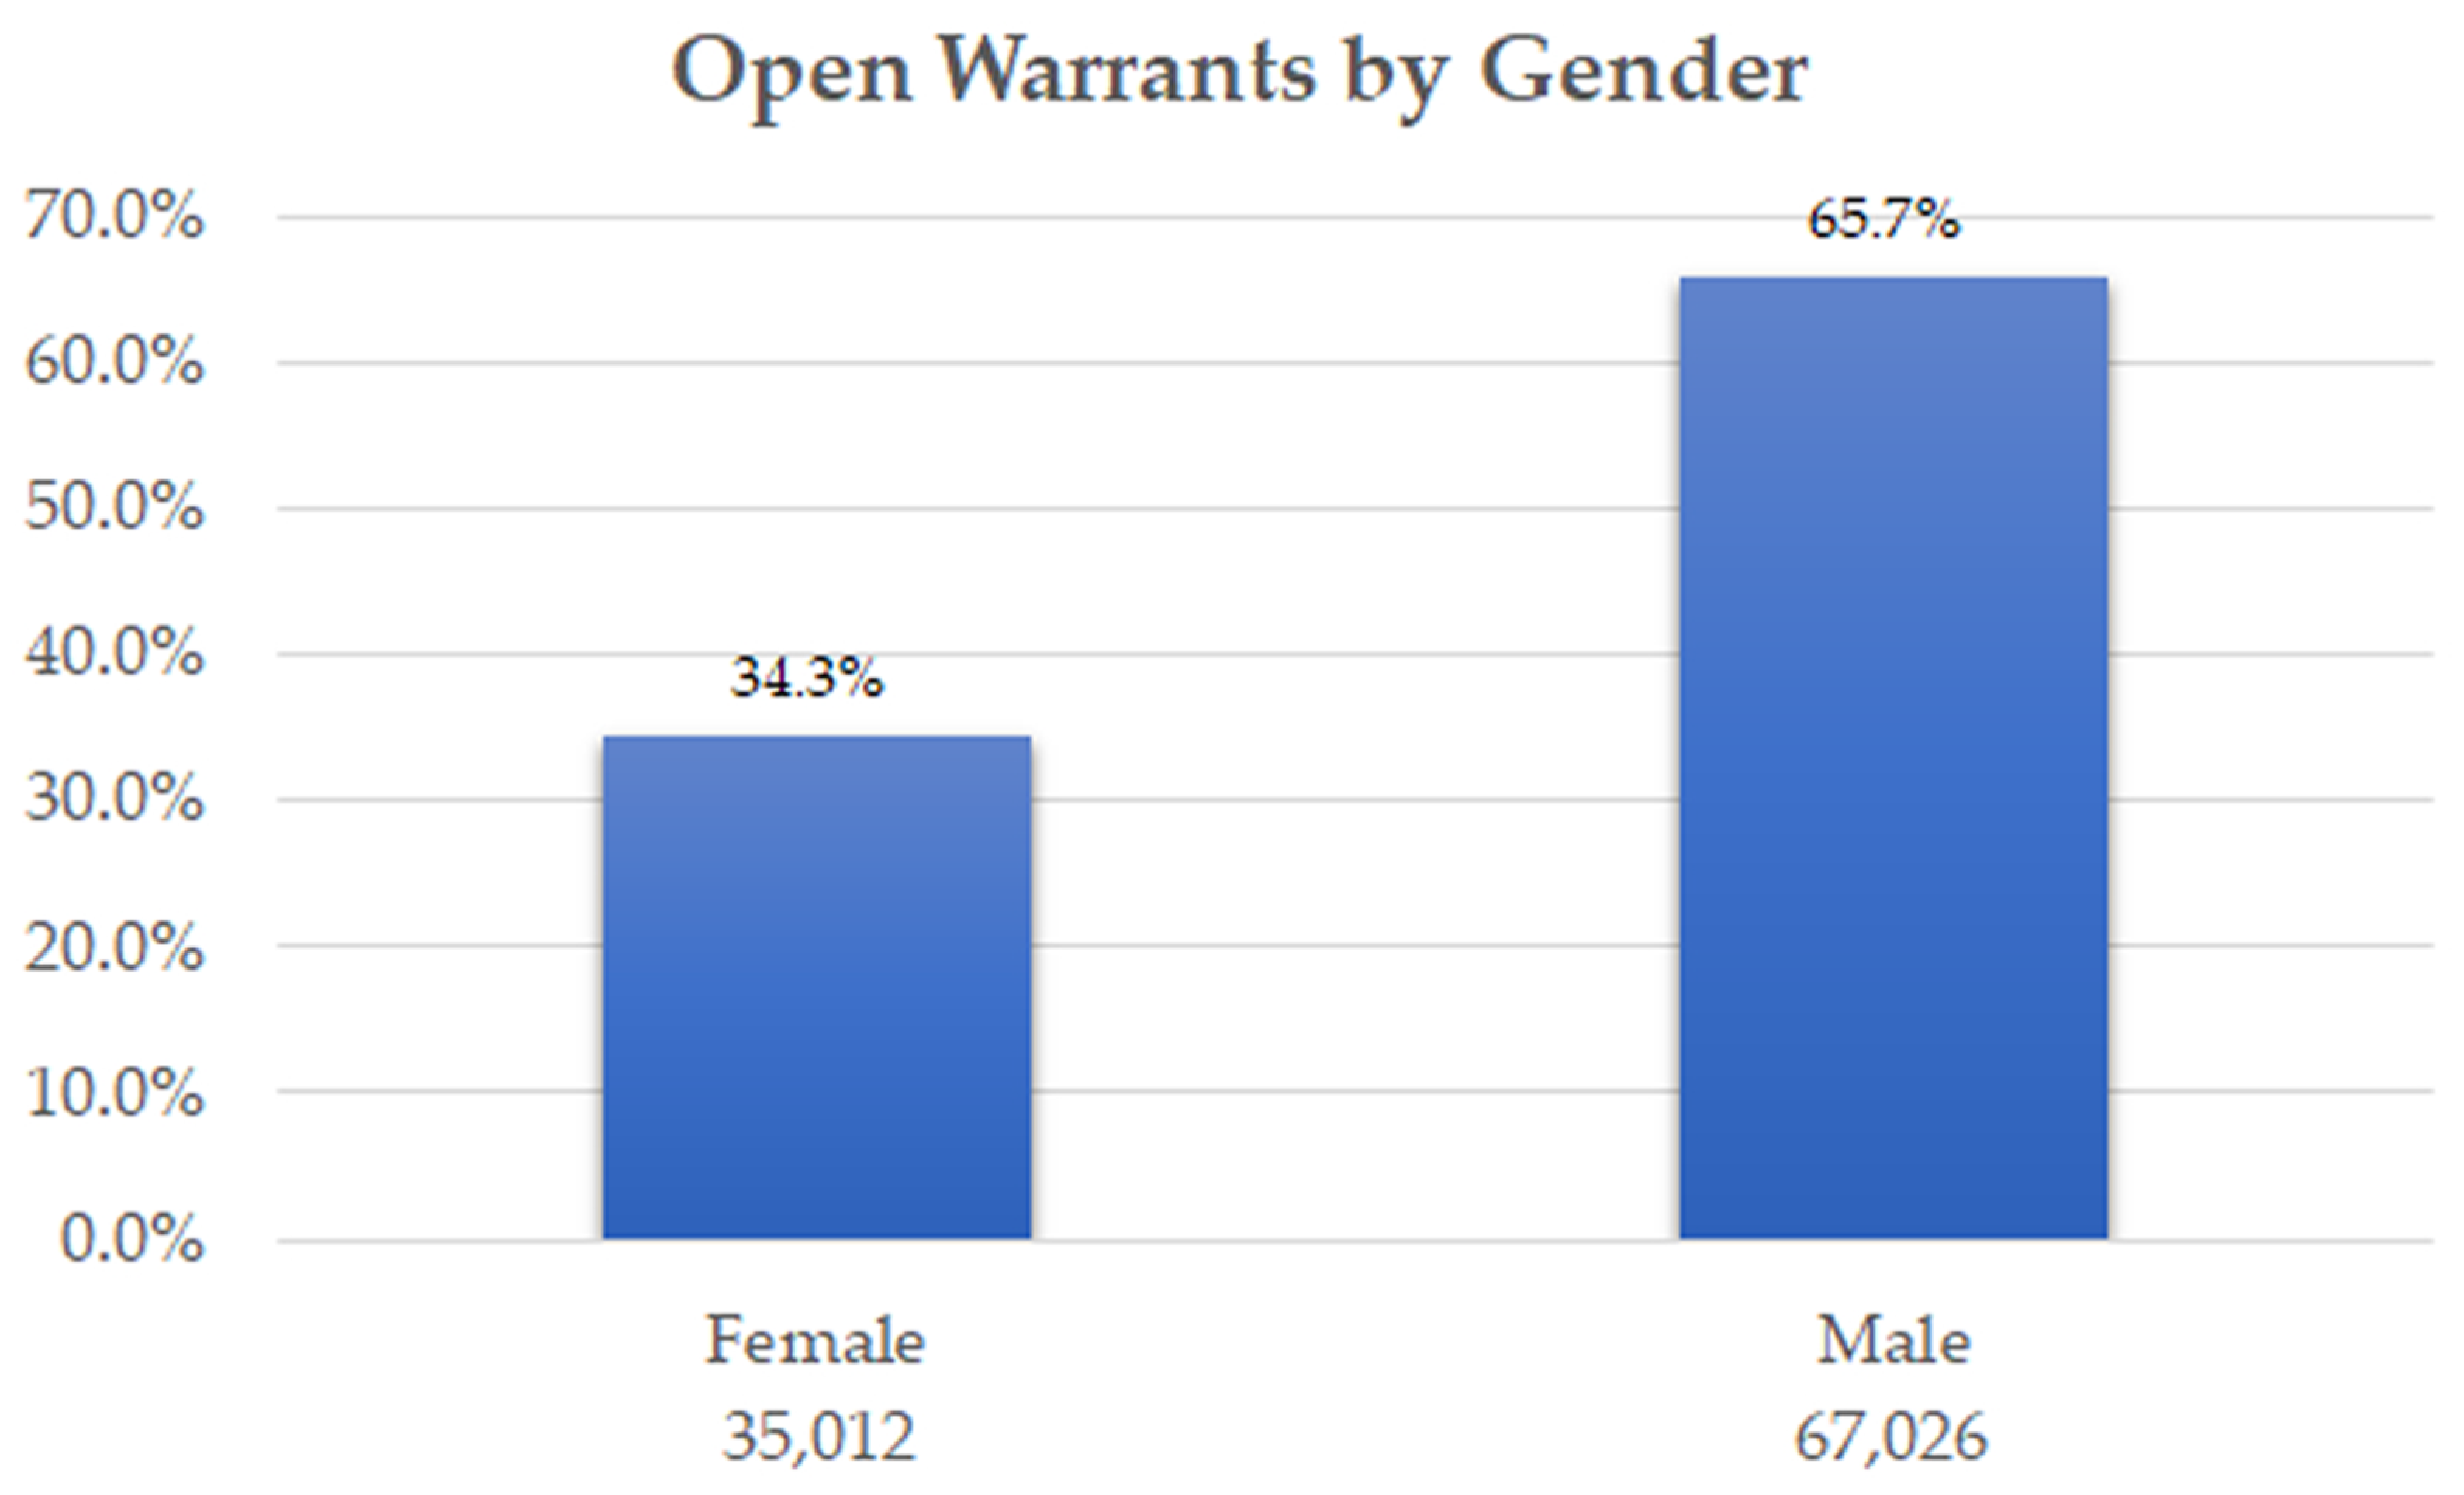
4.5. Who Is Impacted? Gender and Age
5. Discussion
Future Research
6. Limitations
7. Conclusions
Toward Criminal Justice Reform
Author Contributions
Funding
Institutional Review Board Statement
Informed Consent Statement
Data Availability Statement
Acknowledgments
Conflicts of Interest
Appendix A

| New Value | New Label | Old Label (of Charge) |
|---|---|---|
| 1 | Insurance | NO INSURANCE/SECURITY + |
| NO PROOF OF INSURANCE + | ||
| 2 | Driver license | CHANGE NAME/ADD ON DRIV LIC—IN 30 DAY + |
| DRIVE ON CANCELLED DRIV LIC + | ||
| DRIVE ON REVOKED DRIV LIC + | ||
| DRIVE ON SUSP/CANC/REV DRIVE LIC + | ||
| DRIVE ON SUSPENDED DRIVERS LICENSE + | ||
| DRIVERS LICENSE—URRENDER ON DEMAND + | ||
| DRIVING WITHOUT VALID LICENSE + | ||
| DRIVING WITHOUT VALID LICENSE—EXPIRED + | ||
| EMPLOY UNLICENSED DRVER/DRIVE MTR VEH + | ||
| MOTORCYCLE DRIVERS LICENSE REQUIRED + | ||
| NO DRIVERS LICENSE + | ||
| NO DRIVERS LICENSE IN POSSESSION + | ||
| NO MTRCYCLE DRIV LIC IN POSS—ADULT/JUV + | ||
| NO NEVADA DRIVERS LIC WITHIN 30 DAYS + | ||
| POSSESS ALTERED DRIV LIC + | ||
| POSSESS REVOKED DRIV LIC + | ||
| POSSESS SUSPENDED DRIVERS LICENSE + | ||
| USE/POSS SUSP/CANC/REV DRIV LIC + | ||
| VIOLATE INSTRUCTION PERMIT REQUIREMNTS + | ||
| VIOLATION OF RESTRICTION ON LICENSE + | ||
| UNLAWFUL TRANSFER OF LICENSE PLATES + | ||
| MORE THAN ONE DRIVERS LICENSE | ||
| NO COMMERCIAL LICENSE W/VALID ENDORSE | ||
| 3 | Vehicle conditions general/Road worthiness | BRAKE MAINTENANCE + |
| BRAKES + | ||
| BRAKES—EVERY MOTOR VEHICLE MUST HAVE + | ||
| BRAKES STOP WITHIN CERTAIN DISTANCE + | ||
| EXHAUST SYS—EXTEND PAST REAR/SIDE VEH + | ||
| EXHAUST SYSTEM—MUST BE GAS TIGHT + | ||
| ALL MOTOR VEHICLES MUST HAVE MIRRORS + | ||
| ALL MOTOR VEHICLES MUST HAVE MUFFLERS + | ||
| FENDERS REQUIRED + | ||
| MUST HAVE HORNS AND WARNING DEVICES + | ||
| MUST HAVE WINDSHIELDS—NOT DEFECTIVE + | ||
| TIRES—TREAD DEPTH—UNSAFE + | ||
| UNSAFE VEH—NOT EQUIPPED AS REQUIRED + | ||
| WINDSHIELDS/WINDOWS NOT OBSTRUCTED + | ||
| MIRRORS—TWO REQ NOT LESS 3" IN DIAMETR | ||
| WINDSHIELD WIPERS—MUST HAVE AND MAINTAIN | ||
| 4a | Lamps | 2 TAIL LIGHTS REQ/LOCATION AND DISTANCE + |
| FLASHING RED OR YELLOW SIGNAL + | ||
| HEAD LAMPS HOURS OF OPERATION + | ||
| HEAD LAMPS—2 REQUIRED/LOCATION ON VEH + | ||
| HEAD LAMPS—AT LEAST ONE REQ—PROPER LOC + | ||
| HIGH AND LOW BEAM USE—FAIL TO DIM + | ||
| LAMPS ON PARKED VEHICLES + | ||
| MOTORCYCLE DEFECTIVE HEADLAMPS + | ||
| MTR CYCLE HEADLAMPS—TIMES/OPERATION + | ||
| REFLECTOR AND CLEARANCE LAMP LOCATIONS + | ||
| STOP LAMPS REQUIRED + | ||
| TAIL LAMPS—REQUIRED WHEN HEADLIGHTS ON + | ||
| 4b | Light Color/Signals | COLOR OF LAMPS + |
| DISPLAY BLUE LIGHTS ON NON-EMERGENCY VEHICLE + | ||
| REFLECTORS—POSITION AND SIZE + | ||
| EXTRA LIGHTS AND REFLECT REQ CERTAIN VEH + | ||
| NO U-TURN SIGNS—OBEDIENCE TO + | ||
| REFLECTORS—COLORS AND DISTANCE SEEN + | ||
| SIGNAL LT—TOWED TRAILER/TOWING VEHICLE + | ||
| SIGNALS—HAND AND ARM—METHOD + | ||
| SIGNALS OF INTENTION—BY LAMP/HAND/ARM + | ||
| STOPPING SUDDENLY WITHOUT SIGNAL + | ||
| TINTING WINDOWS—RESTRICTED VIEW + | ||
| TOW CAR EQUIP—FLARES/WARNNG LTS/SIGNS + | ||
| TURN SIGNAL REQ—100’ CITY/300’ FREEWAY + | ||
| TURN SIGNALS + | ||
| UNSAFE TURN WITHOUT APPROPRIATE SIGNAL + | ||
| LANE CHANGE—MARKED HWY—AFTER SIGNAL + | ||
| LANE DIRECTIONAL CONTROL SIGNAL + | ||
| OBEDIENCE—NO LEFT/RIGHT TURN SIGNS + | ||
| OBEDIENCE—RAILWAY SIGNALS/SIGNS + | ||
| LICENSE PLATE LIGHT + | ||
| TURN SIGNAL REQ—100\’ CITY/300\’ FREEWAY | ||
| 5 | Seat and Belt | CARRY PASSENGERS—SEAT AND FOOTRESTS REQ + DRIVER MST USE SEAT BLTS AND SHOLDR HARN + |
| ILLEGAL RIDING—NOT ON PASSENGER’S AREA + | ||
| MORE THAN 3 PERSONS IN FRONT SEAT | ||
| MTRCYCL—NO THONGS/SANDALS/OPEN TOES + | ||
| PASSENGER MUST USE SEAT BELT + | ||
| VEH MUST HAV SEAT BLTS AND SHOLDR HARNES + | ||
| 6 | Minor/Underage | DRIVER ˂21 YEARS OLD—DRIVING INDUS VEH + |
| PERMITTING UNLICENSED MINOR TO DRIVE + | ||
| PERMITTING UNLICENSED PERSON TO DRIVE + | ||
| LEAVING CHILD UNATTENDED IN MOTOR VEHICLE + | ||
| DEVICE TO RESTRAIN CHILD UNDR 5YR/40LB + | ||
| DEVICE TO RESTRAIN CHILD UNDR 6YR/60LB + | ||
| 7 | Lane rule | DISREGARD ONE-WAY ST/ROTARY TRAF ISLAND + |
| DIVIDED HWY—DRIVE ON RIGHT OF ROADWAY + | ||
| DRIVE MORE THAN 200’ IN 2-WAY TURN LN + | ||
| DRIVING ON RIGHT HALF OF ROADWAY + | ||
| DRIVING ON SIDEWALK + | ||
| DRIVING THROUGH SAFETY ZONES + | ||
| FAILURE TO DRIVE IN TRAVEL LANE + | ||
| HOV—CAR POOL LANES + | ||
| LEFT TURN FROM ONE WAY ROADWAY + | ||
| LEFT TURN TO ONE WAY ROADWAY + | ||
| LEFT TURN—POSITION/METHOD AT INTERSECT + | ||
| MTRCYCL NOT TO BE DRIVEN ON SIDEWALK + | ||
| ON DIVIDED HIGHWAY—TURN ACROSS MEDIAN + | ||
| ONE WAY STREET + | ||
| REMOVE BARRIER—DRIVE ON CLOSED HIGHWAY + | ||
| RIGHT OF WAY FROM PRIVATE DRIVE/ROAD + | ||
| RIGHT OF WAY FROM YIELD SIGN + | ||
| RIGHT OF WAY—ALLEY/DRIVEWAY/BUILDING + | ||
| RIGHT OF WAY—PASS VEH STOPPED FOR PED + | ||
| RIGHT OF WAY—PEDESTRIANS IN CROSSWALK + | ||
| RIGHT OF WAY—RIGHT TURN ON RED SIGNAL + | ||
| RIGHT OF WAY—UNCONTROLLED INTERSECTION + | ||
| RIGHT TURN—POSITION/METHOD AT INTERSEC + | ||
| RIGHTS OF WAY FROM STOP SIGNS + | ||
| STOP IN TRAFFIC LANE + | ||
| STREETS OTHER THAN TRUCK ROUTES + | ||
| TWO WAY TURN LANE—FOR LEFT TURNS ONLY + | ||
| U-TURN AT INTERSEC WITH TRAF CONT DEV + | ||
| U-TURN IN FRONT FIRE STATION DRIVEWAY + | ||
| U-TURNS—BUSINESS DISTRICT OR UNSAFE + | ||
| UNSAFE TURNING MOVEMENT—LANE CHANGE + | ||
| VEHICLE TURNING LEFT AT INTERSECTION + | ||
| MTRCYCL RIGHT TO FULL USE TRAFFIC LANE | ||
| RGT OF WAY INTRSECTION—STOP | ||
| DRIVE MORE THAN 200\’ IN 2-WAY TURN LN | ||
| 8 | Pass/Overtake | NO PASSING 100’ INTERSECTION/CURVE/ETC + |
| NO PASSING ZONES—YELLOW LINE/MARKINGS + | ||
| PASS VEH IN OPPOSITE DIR —KEEP RIGHT + | ||
| PASS/OVERTAKE VEH ON LEFT—METHOD + | ||
| PASS/OVERTAKE VEH ON RIGHT—METHOD + | ||
| PASSING BETWEEN STOPPED OR MOVING VEH + | ||
| UNLAWFULLY OVERTAKE AND PASS VEHICLE IN SCHOOL ZONE + | ||
| 9 | Reckless driving general | BLOCK INTERSECTION—OBSTRUCT PASSAGE + |
| DRIVRS VIEW OBST/PASSENGER INTERFER + | ||
| FOLLOWING TOO CLOSE + | ||
| IMPROPER OR PROHIBITED U-TURN IN SCHOOL ZONE + | ||
| RECKLESS DRIVING + | ||
| WILLFUL OBSTRUCTION/DELAY OF TRAIN | ||
| WRITTEN REPORT BY DRIVERS/OWNERS W/INJURY/PROP DAM | ||
| 10 | Careless driving general | BOARD OR ALIGHT FROM MOVING VEHICLE + |
| DRIVING IN A CARELESS MANNER + | ||
| DRIVERS POSITION WHILE OPERATING | ||
| FAIL USE DUE CARE AVOID COLL W/PED + | ||
| FULL ATTENTION TO DRIVING + | ||
| HAND POSITION OF DRIVER + | ||
| HORNS—UNNECESSARY USE + | ||
| NO TV RECEIVER VISIBLE AT DRIVERS SEAT + | ||
| OPEN DOOR IN TRAFFIC—LEAVE DOOR OPEN + | ||
| UNATTENDED VEH—REMOVE KEY/STOP ENGINE + | ||
| REMOVE KEY/LOCK IGNITION/LEAVE ENG RUN + | ||
| UNSAFE BACKING + | ||
| UNSAFE LOAD + | ||
| UNSAFE STARTING A STOPPED VEHICLE + | ||
| 11a | Yield to Car | FAIL TO YEILD ON FLASHING YELLOW ARROW + |
| FAIL TO YIELD ON FLASHING YELLOW ARROW + | ||
| FAIL TO YIELD TO ONCOMING TRAFFIC + | ||
| FAIL TO YIELD TO PERSON RIDING BICYCLE + | ||
| YIELD SIGN—DISREGARD OF + | ||
| 12/11b | Yield to Pedestrian | FAILURE TO YIELD TO A PEDESTRIAN |
| 13/11c | Yield to emergency Vehicle | CROSSING FIRE HOSE + |
| FOLLOW FIRE TRUCKS—PARK W/IN 300’–500’ + | ||
| YIELD TO EMERGENCY VEHICLE + | ||
| 14 | Red Light Stop | DRIVE THRU PRIV PROP TO AVOID RED LITE + |
| RED FLAGS/LIGHTS—EXTENDED LOAD/LOAD>4’ + | ||
| RED LIGHTS AND SIRENS MAY REMOVE/DESTROY + | ||
| RED TRAFFIC SIGNAL—POSITION/METHOD + | ||
| STOP LIGHTS + | ||
| STOP REQ SIGNAL POL OFF—ATTEMPT ELUDE + | ||
| STOP SIGN—POSITION/METHOD OF STOP + | ||
| 15 | Plate and car registration | EXPIRED LICENSE PLATES + |
| FAIL TO SURRENDER SUSPENDED LICENSE PLATES + | ||
| FICTITIOUS/ALTERED—PLATES/CERTIFICATE + | ||
| FICTITIOUS/SUSP/REV VEH REGISTRATION + | ||
| LICENSE PLATES—METHOD OF DISPLAY + | ||
| NO NV LIC PLTS W/IN 30 DAYS RESIDENCY + | ||
| NO NV LIC PLTS W/IN 60 DAYS RESIDENCY + | ||
| NO REGISTRATION IN VEHICLE + | ||
| NO VEHICLE REGISTRATION + | ||
| OPERATE UNTREGISTERED MOPED + | ||
| OPERATE VEH W/ALT VEH NUM—SERIAL NUM + | ||
| PERMIT TO OPERATE UNREGISTERED VEHICLE + | ||
| REVOKED REGISTRATION + | ||
| SUSPENDED REGISTRATION/PLATES + | ||
| FAIL SUR PLATES/DL TO DEPT OF MTR VEH + | ||
| UNREGISTERED VEHICLE/TRAILER/SEMI TRAILER + | ||
| ADDRESS CHANGE—REG—WITHIN 10 DAYS + | ||
| ADDRESS CHANGE—REG—WITHIN 30 DAYS + | ||
| UNLAWFUL TO LEND LICENSE PLATES OR REG | ||
| 16 | Speed Limit | BASIC RLE—FSTER/POSTED 1–10 OVER + |
| BASIC RLE—FSTR/POSTED 11–15 OVER + | ||
| BASIC RLE—FSTR/POSTED 16–20 OVER + | ||
| BASIC RLE—FSTR/POSTED 21 OR OVER + | ||
| BASIC RLE—FSTR/POSTED 21–30 OVER + | ||
| BASIC RLE—FSTR/POSTED 31–40 OVER + | ||
| BASIC RLE—FSTR/POSTED 41+ OVER + | ||
| 17 | Speed on Conditions | BASIC SPEED—TOO FAST FOR CONDITIONS + |
| FAIL DECREASE SPD AND USE DUE CARE + | ||
| MANR/RAT/SPD—ENDGR LIF/LIMB/PROP—CRLES + | ||
| MINIMUM SPEED—IMPEDE OR BLOCK TRAFFIC + | ||
| MISDEMEANOR + | ||
| SPEED CONTEST + | ||
| IMPEDE TRAFFIC/TOO SLOW—MOVE TO RIGHT | ||
| PRIMA FACE SPD—SCH CROSS 1–15 OVER + | ||
| PRI/FACIE SPD—SCH ZN 16MPH/LIMIT | ||
| PRIMA FACIE SPD—SCH ZONES—15 MPH | ||
| SLOW TRAFFIC TO DRIVE IN RIGHT LANE + | ||
| 18 | Parking | VIOLATION PARK RULES ALCOHOL + |
| HANDICAPPED PARK ONLY (PERMIT) + | ||
| PARK TO SELL/WASH/GREASE/REPAIR VEH | ||
| PARKING ADJACENT TO SCHOOL WHEN POSTED | ||
| PARKING IN A TAXI OR BUS ZONE | ||
| PARKING IN RED ZONE + | ||
| PARKING NEAR FIRE HYDRANT + | ||
| PROHIB PARK GEN—SIDEWALK/DRIVEWAY/ETC + | ||
| STOP/STAND/PARK IN BUS STOP/TAXI STAND ZONE + | ||
| VIOLATION PARK RULES ALCOHOL + | ||
| VIOLATE PARK RULES + | ||
| PARK IN ALLEY, INCLUDING BLOCKING DRIVEWAY + | ||
| PARKING—OVER 18" FROM CURB FACE | ||
| PROJECT INTO ST—NOT > 15 IN FROM CURB | ||
| SET BRAKE—TURN WHEELS TO CURB ON GRADE | ||
| STOP/STAND/PARK IN HAZARD/CONGEST AREA | ||
| 19 | Duty | DUTY APPROACHING EMERGENCY VEHICLE + |
| DUTY GIVE INFORMATION AND RENDER AID + | ||
| DUTY TO STOP—PROPERTY DAMAGE ONLY | ||
| DUTY UPON ACCIDENT W/INJURY OR DAMAGE + | ||
| DUTY UPON DAMAGING UNATTENDED VEH/PROP + | ||
| IMMEDIATE REPORT OF ACCIDENT TO POLICE + | ||
| STOP FOR SCHOOL CROSSING GUARDS + | ||
| 20 | Power Showing | AGGRESSIVE DRIVING + |
| EXHAUST SYSTEM—MODIFIED TO MAKE NOISE + | ||
| EXHIBITION OF POWER + | ||
| OBEDIENCE AUTHORIZED FLAGMAN—SIGNAL + | ||
| OBEDIENCE TO TRAFFIC CONTROL DEVICE + | ||
| OBSTRUCTING TRAFFIC + | ||
| 21 | School bus | STOPPING FOR SCHOOL BUS |
| 22 | Tax/Truck and other Compliance | BEHIND ON LOG BOOK |
| FAILURE TO COMPLY W/TAXI STAND USE + | ||
| PROHIBITED/REQUIRED ACTS—TAXI DRIVER | ||
| TRIP SHEET—CAB + | ||
| TAXICAB STANDS—SEEKING FARE OR PARKING | ||
| HEIGHT—VEHICLE DISTANCE FROM ROADWAY | ||
| EQUIPMENT VIOLATION + | ||
| ABANDONED VEHICLE | ||
| 23 | DUI and Alcohol | DRINK INTOXICATING LIQUOR WHEN DRIVING |
| DUI DRUGS CHEMICALS ORGANIC SOLVENT | ||
| DUI LIQUOR | ||
| DUI LIQUOR AND/OR DRUGS | ||
| DUI SUBSEQUENT ARREST | ||
| MINOR IN CONSUMPTION OF ALCOHOL | ||
| MINOR IN POSSESSION OF ALCOHOL + | ||
| OPEN ALCOHOLIC CONTAINER IN VEHICLE | ||
| POSS/CNSM ALCOHOL ON PED MALL FROM GLASS/METAL/ORG + | ||
| 24 | Non-Traffic Charges | ACTIONS WHICH CONSTITUTE THEFT + |
| ADEQUATE WATER FOR ANIMALS + | ||
| AFFRAY + | ||
| AID AND ABET A PROSTITUTE + | ||
| ANIMAL VACCINATION CERTIFICATE REQ + | ||
| ASSAULT + | ||
| ATMPT SMOKE/CONSUME MARI IN PUBLIC PLACE/VEH/STORE + | ||
| BATTERY DOMESTIC VIOLENCE, FIRST OFFENSE + | ||
| BATTERY + | ||
| BATTERY DOMESTIC VIOLENCE—2nd Offense + | ||
| BATTERY DOMESTIC VIOLENCE—2ND OFFENSE + | ||
| BATTER DOMESTIC VIOLENCE, FIRST OFFENSE | ||
| BATTER DOMESTIC VIOLENCE, SECOND OFFENSE | ||
| BATTERY DOMESTIC VIOLENCE, SECOND OFFENSE + | ||
| BATTERY/DOMESTIC VIOLENCE + | ||
| BUSINESS LICENSE VIOLATION + | ||
| CARRY CONCEALED WEAPON W/O PERMIT + | ||
| COERCION + | ||
| COMMIT ACT/INTERFERE W/PEACEFUL CONDCT + | ||
| CONSUME ALCHOL ON PREMISE OFF/SALE ONLY + CONTRIBUTING TO DELINQUENCY OF MINOR + CONVICTED PERSON FAIL TO REGISTER + | ||
| CONVICTED PERSON FAIL/CHANGE ADDRESS + | ||
| CREATE DISTURBANCE IN SCHOOL + | ||
| CRUELTY TO ANIMALS + | ||
| DEFECATING IN PUBLIC + | ||
| DEFRAUDING AN INNKEEPER+ | ||
| DEFRAUD CAB DRIVER+ | ||
| DESTRUCTION PRIVATE PROPERTY | ||
| DISCHARGE OF A FIREARM + | ||
| DISTURBING THE PEACE + | ||
| DO BUSINESS WITHOUT A LICENSE + | ||
| DOG RUNNING AT LARGE + | ||
| DRAW A DEADLY WEAPON + | ||
| EMBEZZLEMENT + | ||
| EMISSIONS OF SMOKE, STEAM OR FUMES + | ||
| FAIL TO FURNISH INFO TO ANIMAL REGULATORY OFFICER + | ||
| FAIL TO REGISTER GARAGE + | ||
| FAILURE TO LICENSE DOG/CAT + | ||
| FAILURE TO RESTRICT ANIMAL | ||
| FALSE REPORT OF A CRIME + | ||
| FTA—ORDER TO SHOW CAUSE/WITNESS + | ||
| GARBAGE REMOVAL + | ||
| GIVE FALSE INFO TO PUBLIC OFFICER, GIVE OR LEAVE MARIJUANA TO PERSON UNDER 21 + | ||
| GRAFFITI + | ||
| GRAFFITI IMPLEMENTS WITH INTENT TO VAND + | ||
| HANDLEBAR HEIGHTS + | ||
| HARASSMENT + | ||
| INHALE GLUE/OTHER CHEMICAL + | ||
| INTERFERENCE WITH GARBAGE CONTAINER | ||
| JUNKAGE/DEAD STORAGE—MORE THAN 24 HRS | ||
| LEWD AND LASCIVIOUS BEHAVIOR + | ||
| LEWD EXPOSURE + | ||
| LITTERING + | ||
| LODGING IN A PASSENGER CAR | ||
| LODGING WITHOUT CONSENT + | ||
| LOITERING ABOUT A SCHOOL + | ||
| LOITERING ABOUT SCHOOL/PLACE CHILDREN CONGREGATE + | ||
| LOITERING FOR PURPOSE OF PROSTITUTION + | ||
| MAINTAINING A PUBLIC NUISANCE + | ||
| MALICIOUS DESTRUCTION OF PROPERTY + | ||
| MALICIOUS PROSECUTION + | ||
| MINOR GAMBLING | ||
| MINOR IN CASINO | ||
| MISUSE OF BUS SHELTER BENCH | ||
| NOISE DISTURBANCE + | ||
| OBEY ORDER/DIRECTION OF PUBLIC OFFICER + | ||
| OBSTRUCTING/FALSE INFO TO P. O. + | ||
| RESISTING PUBLIC OFFICER | ||
| OPEN CONTAINER AT BUS SHELTER | ||
| OBTAIN MONEY UNDER FALSE PRETENSES + | ||
| PERSONAL MARIJUANA CULTIVATION LAWS 1ST OFFENSE + | ||
| GLASS/METAL/ORG + | ||
| PARK BICYCLES—BLOCK PEDESTRIAN TRAFFIC | ||
| POSSESS FIREARM U/INFLUENCE DRUGS/ALC + | ||
| POSSESS HYPODERMIC DEVICE + | ||
| POSSESS LESS THAN 1 OUNCE OF MARIJUANA, POSSESS OPEN LIQUOR ON PLAYGROUND, | ||
| POSSESS UNREGISTERED FIREARM, | ||
| POSSESSION FIREWORKS, | ||
| POSSESSION OF A CONTROL SUB IMITATION, | ||
| POSSESSION OF A SHOPPING CART + | ||
| POSSESSION OF STOLEN PROPERTY + | ||
| PROHIBITED CONTAINER + | ||
| PROVOKE OR ATTEMPT TO PROVOKE BREACH OF PEACE + | ||
| PROVOKING BREACH OF PEACE + | ||
| REMAIN IN PARK AFTER HOURS OF CLOSURE + | ||
| ROLLER SKATES, ETC—ILLEGAL ON ROADWAY + | ||
| SALE/FURNISH LIQUOR TO MINOR + | ||
| SMOKE/CONSUME MARIJUANA IN PUBLIC PLACE/VEH/STORE + | ||
| SMOKING UNLAWFUL IN PUBLIC PLACES + | ||
| SOLICITING WITHOUT A PERMIT + | ||
| SPAY AND NEUTER + | ||
| SPITTING ON SIDEWALK + | ||
| STALKING + | ||
| SPILL LOAD ON HWY OR ST/COVERED LOAD + STANDARDS OF CONDUCT WHILE ON DUTY + | ||
| RIDE BICYCLE—1 PERSON UNLESS EQUIPPED + RESTRICTED USE BY BICYCLE/PED./MOPED + | ||
| STREET PREFORMER—DESIGNATION LOCATION + | ||
| PETIT LARCENY + | ||
| TAMPERING/INJURING A VEHICLE + | ||
| THREATEN TO HARM STUDENT OR SCHOOL EMPLOYEE, THREATENING PHONE CALL + | ||
| THROW BURNING OBJECT + | ||
| UNLAWFUL PRESENCE IN A CHILDRENS PARK + | ||
| UNLAWFUL PROSTITUTION RELATED ACTIVITY, UNLAWFUL TRANS/USE—DEALER REGISTRATI, UNLAWFUL USE OF CELL PHONE OR HANDHELD DEVICE, UNLAWFUL USE/POSSESSION OF DRUG PARAPHERNALIA, UNIFORM FIRE CODE , UNLAWFUL ACTS—STREET PERFORMERS + | ||
| UNLAWFUL COMMUNICATION/EXCHANGE WITH PRISONER + URINATING IN PUBLIC + | ||
| VEHICLE CONFINEMENT—ANIMALS + | ||
| VIOL DOM VIOLENCE TPO + | ||
| VIOLATE RESTRAINING ORDER, WALK IN ROADWAY WHEN SIDEWALK PROVIDED, WEAPON IN PARK, | ||
| NON-RESIDENT DRIVE ON CANCELLED DL, | ||
| NON-RESIDENT DRIVE ON REVOKED LIC, | ||
| NON-RESIDENT DRIVE ON SUSP/CANC/REV DL, | ||
| NON-RESIDENT DRIVE ON SUSPENDED LIC, | ||
| BICYCL—LIGHTS/REFLECTRS/BRKES/WARN DEV | ||
| BICYCL—PARENT/GUARDN—ENSURE RULES OBEY | ||
| BICYCL—RIDE ON RIGHT SIDE OF ROADWAY | ||
| BICYCL—SPEED TOO FAST FOR CONDITIONS | ||
| BICYCL—TRAFFIC SIGNALS TO BE OBEYED | ||
| BICYCLE—CARRYING ARTICLES | ||
| BIKE/SKATEBOARD ON SIDEWLK IN BUS DIST | ||
| BICYCL—ENTER/EMERGE—ALLEY/DRIVWY/BLDG | ||
| HDGEAR—GLASSES/SHIELDS HELMET FASTENED | ||
| PED CROSSING NOT IN CROSSWLK—JAYWALK | ||
| PEDESTRIAN FAIL TO USE CROSSWALK | ||
| PEDESTRIAN MUST USE RIGHT OF CROSSWALK | ||
| PEDESTRIAN OBSTRUCTING SIDEWALK | ||
| PEDESTRIAN ON HIGHWAY WHERE PROHIBITED | ||
| PEDESTRIAN OR VEHICULAR INTERFERENCE | ||
| PEDESTRIAN SHALL YIELD | ||
| PEDESTRIAN SOLICITING ON HIGHWAY | ||
| PEDESTRIAN UNDER INFLUENCE ON ROADWAY | ||
| PEDESTRIANS TO OBEY TRAFFIC SIGNALS + | ||
| PEEPING + | ||
| PROHIBIT CAMPING/LODGING/ETC W/PUBLIC RIGHT OF WAY | ||
| RESTRICTED ACCESS | ||
| TRESPASSING, TRESSPASS/LOITER/COMMIT NUISANCE ON/NEAR SCHOOL | ||
| HITCHHIKE/SOLICIT BUSINESS FROM DRIVER + | ||
| OBTAIN PROPERTY UNDER FALSE PRETENSES | ||
| SKATES, ETC—ILLEGAL FREMONT SIDEWALK | ||
| SOLICITING CERTAIN LOCATIONS | ||
| THROWING DEADLY MISSILES | ||
| UNLAWFUL ACTS/ANIMALS | ||
| UNLAWFUL USE FALSE IDENTIFICATION |
| 8 New Value Labels | 24 Old Value Labels | |
|---|---|---|
| 1 | Insurance | Insurance |
| 2 | Driver license | Driver license |
| 3 | Vehicle Conditions | Vehicle conditions |
| Lamps, Light Color/Signals | ||
| 4 | Moving Violations | Seat and Belt |
| Minor/Underage | ||
| Lane rule | ||
| Pass/Overtake | ||
| Reckless and Careless driving | ||
| Yield to car or pedestrian or emergency or school bus | ||
| Red Light Stop | ||
| Speed Limit | ||
| Duty | ||
| Power Showing | ||
| Tax/Truck and other Compliance | ||
| 5 | Vehicle Registration | Plate and car registration |
| 6 | Parking | Parking |
| 7 | DUI | DUI and Alcohol |
| 8 | Non-Traffic | Non-Traffic |
References
- Alexander, Michelle. 2011. The New Jim Crow: Mass Incarceration in the Era of Colorblindness. New York: The New Press. [Google Scholar]
- Beckett, Katherine A., Alexes M. Harris, and Heather Evans. 2008. The Assessment and Consequences of Legal Financial Obligations in Washington State. Research Report. Olympia: Washington State Minority and Justice Commission. [Google Scholar]
- Bornstein, Brian, and Alan Tomkins. 2015. Motivating Cooperation and Compliance with Authority: The Role of Institutional Trust. New York: Springer. [Google Scholar]
- Burton, Susan, and Cari Lynn. 2019. Becoming Ms. Burton: From Prison to Recovery to Leading the Fight for Incarcerated Women. New York: The New Press. [Google Scholar]
- Crozier, William E., and Brandon L. Garrett. 2020. Driven to Failure: An Empirical Analysis of Driver’s License Suspension in North Carolina. Duke Law Journal 69: 1585. [Google Scholar] [CrossRef]
- DeAngelo, Gregory, and Benjamin Hansen. 2014. Life and Death in the Fast Lane: Police Enforcement and Traffic Fatalities. American Economic Journal: Economic Policy 6: 231–57. [Google Scholar] [CrossRef]
- Farrell, Amy, Dean Jack McDevitt, Lisa Bailey, Carsten Andresen, and Erica Pierce. 2004. Massachusetts Racial and Gender Profiling Study. Boston: Institute on Race and Justice, Northeastern University. [Google Scholar]
- Fines and Fees Justice Center. 2018. Our Vision and Our Work. Available online: https://finesandfeesjusticecenter.org/about-fines-fees-justice-center/ (accessed on 23 September 2020).
- Foster, Lisa. 2017. Injustice Under Law: Perpetuating And Criminalizing Poverty Through The Courts. Georgia State University Law Review 33: 695. [Google Scholar]
- Fredericksen, Allyson, and Linnea Lassiter. 2016. Disenfranchised by Debt: Millions Impoverished by Prison, Blocked from Voting. Seattle: Alliance for Justice. [Google Scholar]
- Garrett, Brandon L., Sara. S. Greene, and Marin K. Levy. 2020. Fees, fines, bail, and the destitution pipeline. Duke Law Journal 69: 1463–1472. [Google Scholar]
- Garrett, Thomas A., and Gary A. Wagner. 2009. Red Ink in the Rearview Mirror: Local Fiscal Conditions and the Issuance of Traf-fic Tickets. Journal of Law and Economics 52: 71–90. [Google Scholar] [CrossRef] [Green Version]
- Harris, A., Beth Huebner, Karin Martin, Mary Pattillo, Becky Pettit, Sarah Shannon, Bryan Sykes, Chris Uggen, and April Fernandes. 2016. Monetary Sanctions in the Criminal Justice System: A Review of Law and Policy in California, Georgia, Illinois, Minnesota, Missouri, New York, North Carolina, Texas, and Washington. Research Report. New York: Laura and John Arnold Foundation. [Google Scholar]
- Hummel, Daniel. 2015. Traffic tickets: Public safety concerns or budget building tools. Administration & Society 47: 298–319. [Google Scholar] [CrossRef]
- Hunt, Amber. 2017. What Sam DuBose’s rap sheet tells us about him and the police. The Enquirer. [Google Scholar]
- Li, Jingyi, Sanie Amir, Elisa R. Braver, Patricia Langenberg, Min Zhan, Gordon Smith, and Patricia Dischinger. 2011. Are Current Law Enforcement Strategies Associated with a Lower Risk of Repeat Speeding Citations and Crash Involvement? A Longitu-dinal Study of Speeding Maryland Drivers. Annals of Epidemiology 21: 641–47. [Google Scholar] [CrossRef] [Green Version]
- Lidén, Gustav. 2017. Inequality in Local Digital Politics: How Different Preconditions for Citizen Engagement Can Be Explained. Policy and Internet 8: 270–91. [Google Scholar] [CrossRef]
- Luca, Dara Lee. 2015. Do Traffic Tickets Reduce Motor Vehicle Accidents? Evidence from a Natural Experiment. Journal of Policy Analysis and Management 34: 85–106. [Google Scholar] [CrossRef]
- Lyle, Michael. 2021. Traffic ticket decriminalization takes effect July 1, but law’s major provisions don’t. Nevada Current. [Google Scholar]
- Makowsky, Michael D., and Thomas Stratmann. 2009. Political economy at any speed: What determines traffic citations? American Economic Review 99: 509–27. [Google Scholar] [CrossRef]
- Makowsky, Michael D., and Thomas Stratmann. 2011. More tickets, fewer accidents: How cash-strapped towns make for safer roads. The Journal of Law and Economics 54: 863–88. [Google Scholar] [CrossRef] [Green Version]
- Martin, Karin D. 2018. Monetary myopia: An examination of institutional response to revenue from monetary sanctions for mis-demeanors. Criminal Justice Policy Review 29: 630–62. [Google Scholar] [CrossRef]
- Martin, Karin D., Bryan L. Sykes, Sarah Shannon, Frank Edwards, and Alexes Harris. 2018. Monetary Sanctions: Legal Financial Obligations in US Systems of Justice. Annual Review of Criminology 1: 471–95. [Google Scholar] [CrossRef]
- Miller, Lisa L. 2010. The Invisible Black Victim: How American Federalism Perpetuates Racial Inequality in Criminal Justice. Law and Society Review 44: 805–42. [Google Scholar] [CrossRef]
- Montare, Ariadne S. 2019. Civil Fines and the Cycle of Poverty. GPSolo 36: 37. [Google Scholar]
- Mughan, Siân. 2021. Municipal reliance on fine and fee revenues: How local courts contribute to extractive revenue practices in US cities. Public Budgeting & Finance 41: 22–44. [Google Scholar] [CrossRef]
- Nevada Legislative Interim Study. 2018. Nevada Legislative Interim Study 2017–18 on The Advisability and Feasibility of Treating Certain Traffic and Related Violations as Civil Infractions, A.C.R. 9, 2017, Reports and Data. Available online: https://www.leg.state.nv.us/App/InterimCommittee/REL/Interim2017/Committee/1421/Meetings (accessed on 13 September 2020).
- Norris, Clive, Neigel Fielding, Charles Kemp, and Jane Fielding. 1992. Black and Blue: An Analysis of the Influence of Race on Being Stopped by the Police. British Journal of Sociology 43: 207–24. [Google Scholar] [CrossRef]
- Nyberg, Jonna, Lena Levin, Katarina Larsson, and Thomas Strandberg. 2021. Distrust of Authorities: Experiences of Outcome and Processes of People Who Had Their Driving License Withdrawn Due to Visual Field Loss. Social Sciences 10: 76. [Google Scholar] [CrossRef]
- Pierson, Emma, Camelia Simoiu, Jan Overgoor, Sam Corbett-Davies, Daniel Jenson, Amy Shoemaker, Vignesh Ramachandran, Phoebe Barghouty, Cheryl Phillips, Ravi Shroff, and et al. 2020. A Large Scale Analysis of Racial Disparities in Police Stops Across the United States. Nature Human Behavior 4: 736–45. [Google Scholar] [CrossRef]
- Sances, Michael W., and Hye Young You. 2017. Who Pays for Government? Descriptive Representation and Exploitative Revenue Sources Journal of Politics 79: 1090–94. [Google Scholar] [CrossRef] [Green Version]
- Singla, Akheil, Charlotte Kirschner, and Samuel B. Stone. 2020. Race, Representation, and Revenue: Reliance on Fines and Forfei-tures in City Governments. Urban Affairs Review 56: 1132–67. [Google Scholar] [CrossRef]
- Sterling, Robin Walker. 2019. Invisible Injustice: A Review of Punishment without Crime: How Our Massive Misdemeanor System Traps the Innocent and Makes America More Unequal by Alexandra Natapoff. Journal of Community Psychology 48: 142–53. [Google Scholar] [CrossRef] [Green Version]
- Su, Min. 2020. Taxation by Citation? Exploring Local Governments’ Revenue Motive for Traffic Fines. Public Administration Review 80: 36–45. [Google Scholar] [CrossRef]
- Tay, Richard. 2010. Speed cameras: Improving safety or raising revenue? Journal of Transport Economics and Policy 44: 247–57. [Google Scholar] [CrossRef]
- Thompson, Cheryl W. 2021. Fatal Police Shootings of Unarmed Black People Reveal Troubling Patterns. Nevada Public Radio Morning Edition. [Google Scholar]
- United States Department of Justice. 2015. Investigation of the Ferguson Police Department. Available online: https://www.justice.gov/sites/default/files/opa/press-releases/attachments/2015/03/04/ferguson_police_department_report.pdf (accessed on 15 March 2021).
- Varghese, Femina P., Tania Israel, Guy Seymour, Rachel Becker Herbst, Lauren G. Suarez, and Candice Hargons. 2019. Injustice in the Justice System: Reforming Inequities for True ‘Justice for All’. The Counseling Psychologist 47: 682–740. [Google Scholar] [CrossRef]


| Year | Outcome of the Legislative Session |
|---|---|
| 1991 | Redistributed AA funds |
| 51% to supreme court | |
| 49% the executive branch | |
| 1995 | Authorized county/city to pass an AA fee of USD 10 for facilities |
| 1997 | Increased AA schedule from USD 100 to USD 105 |
| Authorized USD 2 and USD 7 for Juvenile and Justice/Muni courts respectively | |
| 2001 | Authorized Supreme court to receive higher than 51% of AA revenue |
| Added ‘Advisory Council for Prosecuting Attorneys (AG’s Office)’ to the recipients of AA funds within the executive branch | |
| 2003 | Increased AA from USD 105 to USD 115 |
| Authorized USD 7 as specialty court AA | |
| 2007 | Reduced AA allocation to supreme court to 48% |
| Authorized the ‘other 12% to fund specialty courts’ | |
| 2010 | Increased AA funds from USD 115 to USD 120 |
| Authorized that the funds collected from the USD 5 increment be sent directly to the state general fund |
| Major Categories | # of Warrants per Violation | Warrants % |
|---|---|---|
| Administrative Traffic Charges | 59,115 | 58.6 |
| Insurance | 15,457 | 15.3 |
| Drivers’ License | 26,234 | 26 |
| Vehicle Conditions | 1957 | 1.9 |
| Vehicle Registrations | 15,467 | 15.4 |
| Behavioral Traffic Charges | 24,828 | 24.7 |
| Moving Violations | 16,085 | 16 |
| Parking | 6515 | 6.5 |
| DUI | 2228 | 2.2 |
| Total Traffic | 83,943 | 83.3 |
| Non-Traffic | 16,801 | 16.7 |
| Total: | 100,744 | 100% |
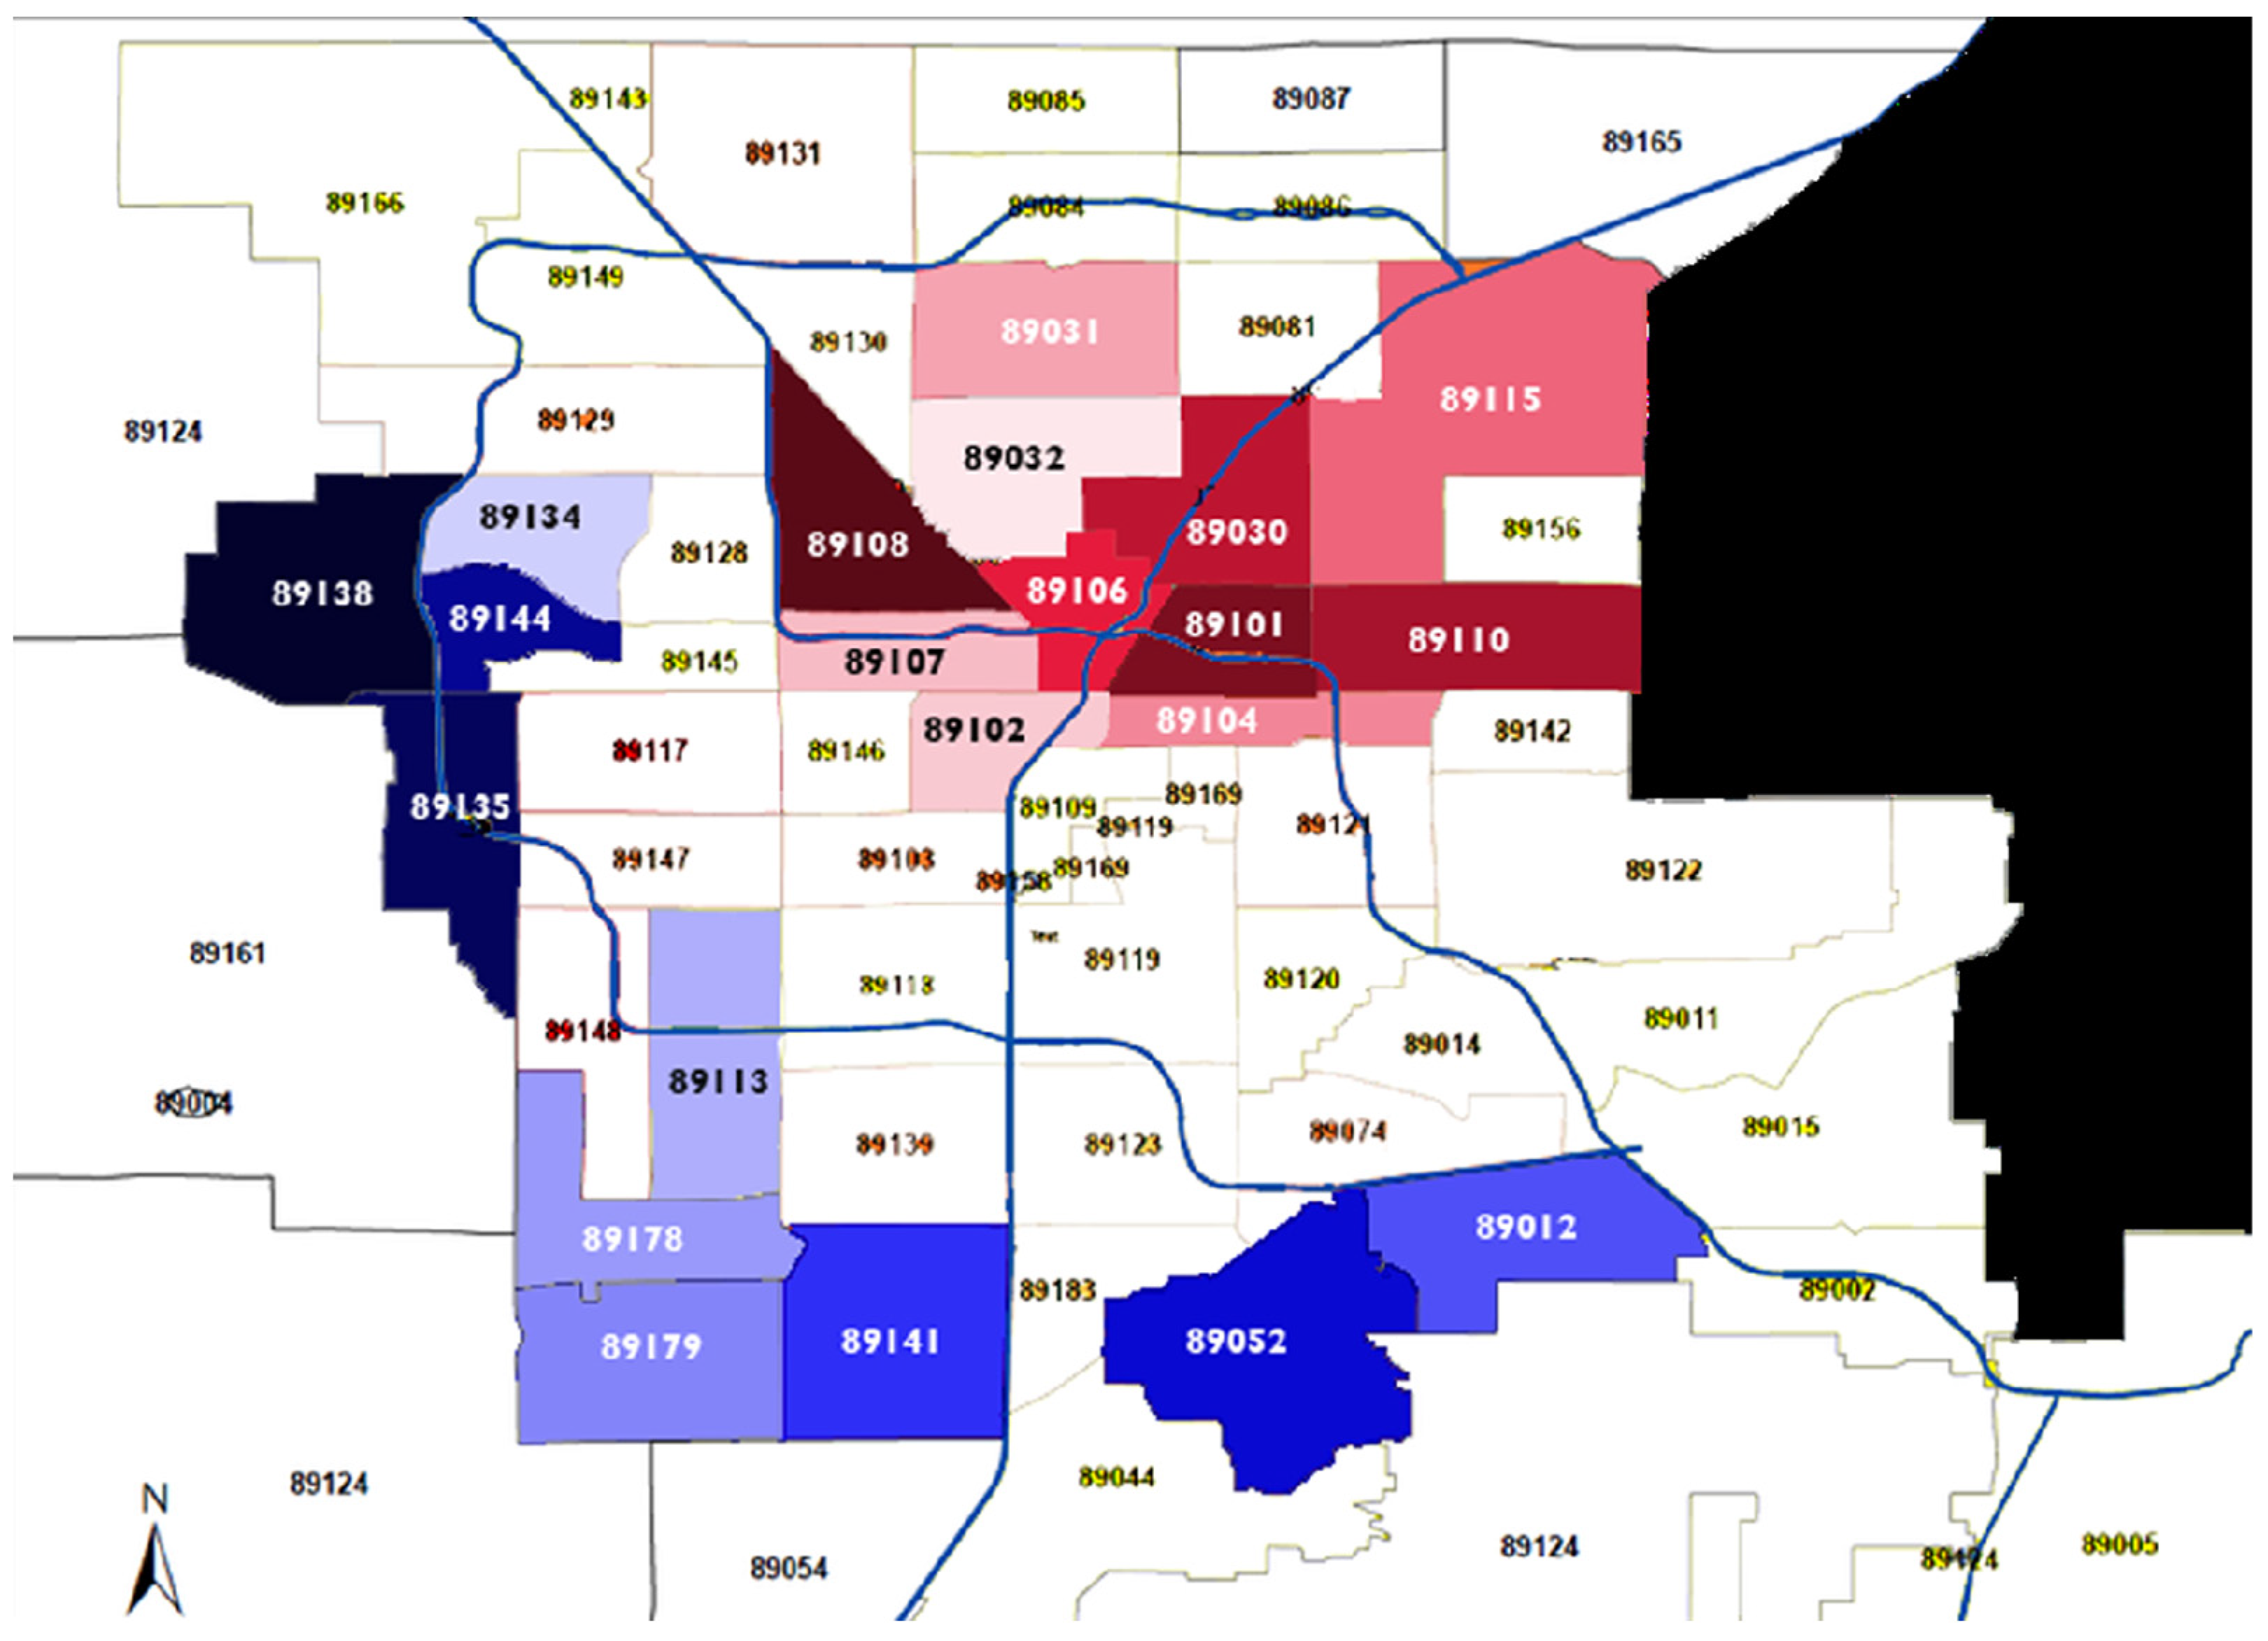
| ZIP Codes with Most Open Warrants | Wealthiest ZIP Codes | ||||
|---|---|---|---|---|---|
| Zip | Median Income 1 | Open Warrants % | Zip | Median Income | Open Warrants % |
| 89108 | USD 46,165 | 8.9 | 89138 | USD 120,759 | 0.1 |
| 89101 | USD 25,310 | 7.2 | 89135 | USD 94,821 | 0.3 |
| 89110 | USD 44,415 | 5.6 | 89144 | USD 88,750 | 0.3 |
| 89030 | USD 36,275 | 5.5 | 89052 | USD 85,021 | 0.2 |
| 89106 | USD 29,906 | 5.2 | 89141 | USD 89,649 | 0.4 |
| 89115 | USD 39,412 | 4.8 | 89012 | USD 81,992 | 0.2 |
| 89104 | USD 36,448 | 4.3 | 89179 | USD 99,662 | 0 |
| 89031 | USD 66,270 | 4.1 | 89178 | USD 88,517 | 0.4 |
| 89107 | USD 44,234 | 4.1 | 89113 | USD 72,479 | 0.4 |
| 89102 | USD 36,729 | 3.9 | 89134 | USD 69,461 | 0.3 |
| 89032 | USD 60,294 | 3.5 | Total Warrants | 2.60% | |
| Total Warrants | 57.10% | ||||
| Income Range | # of Open Warrants | Warrants % |
|---|---|---|
| USD 49,999 and below | 41,412 | 58.50% |
| USD 50,000 to USD 99,999 | 27,227 | 38.50% |
| USD 100,000 and above | 2115 | 3.00% |
| Total: | 70,754 2 | 100% |
| Race/Ethnicity | # of Open Warrants | Warrants % | Clark County Population |
|---|---|---|---|
| Black | 43,627 | 44.70% | 13.10% |
| White | 30,341 | 31.10% | 41.70% |
| Hispanic | 21,321 | 21.90% | 31.60% |
| Asian/Pacific Islander | 2136 | 2.20% | 11.30% |
| Indian/Alaskan Native | 123 | 0.10% | 1.20% |
| Total: | 97,548 1 | 100.00% | 98.90% |
| Black | White | Hispanic | Indian/ | Asian/Pacific Islander | |
|---|---|---|---|---|---|
| Alaskan Native | |||||
| Administrative | 61.9% (26,606) | 54.4% (16,058) | 61.0% (12,853) | 34.2% (8) | 61.5% (326) |
| Behavioral | 23.2% (9957) | 24.1% (7106) | 27.5% (5789) | 25.7% (30) | 23.4% (488) |
| Non traffic | 15.1% (6492) | 21.6% (6367) | 11.4% (2408) | 40.2% (47) | 15.2% (318) |
| Totals | 100% (43,055) | 100% (29,531) | 100 (21,050) | 100% (117) | 100% (2089) |
| Gender | # of Open Warrants | Warrants % |
|---|---|---|
| Female | 35,012 | 34.3 |
| Male | 67,026 | 65.7 |
| Total: | 1,020,381 | 100% |
| Age Range | # of Open Warrants | Warrants % |
|---|---|---|
| 17 or younger | 137 | 0.10% |
| 18 to 34 | 48,280 | 47.10% |
| 35 to 55 | 43,561 | 42.50% |
| 56 to 75 | 9992 | 9.80% |
| 76 or older | 451 | 0.40% |
| Total: | 102,421 | 100% |
Publisher’s Note: MDPI stays neutral with regard to jurisdictional claims in published maps and institutional affiliations. |
© 2021 by the authors. Licensee MDPI, Basel, Switzerland. This article is an open access article distributed under the terms and conditions of the Creative Commons Attribution (CC BY) license (https://creativecommons.org/licenses/by/4.0/).
Share and Cite
Kamanga, F.; Smercina, V.; Brents, B.G.; Okamura, D.; Fuentes, V. Costs and Consequences of Traffic Fines and Fees: A Case Study of Open Warrants in Las Vegas, Nevada. Soc. Sci. 2021, 10, 440. https://doi.org/10.3390/socsci10110440
Kamanga F, Smercina V, Brents BG, Okamura D, Fuentes V. Costs and Consequences of Traffic Fines and Fees: A Case Study of Open Warrants in Las Vegas, Nevada. Social Sciences. 2021; 10(11):440. https://doi.org/10.3390/socsci10110440
Chicago/Turabian StyleKamanga, Foster, Virginia Smercina, Barbara G. Brents, Daniel Okamura, and Vincent Fuentes. 2021. "Costs and Consequences of Traffic Fines and Fees: A Case Study of Open Warrants in Las Vegas, Nevada" Social Sciences 10, no. 11: 440. https://doi.org/10.3390/socsci10110440
APA StyleKamanga, F., Smercina, V., Brents, B. G., Okamura, D., & Fuentes, V. (2021). Costs and Consequences of Traffic Fines and Fees: A Case Study of Open Warrants in Las Vegas, Nevada. Social Sciences, 10(11), 440. https://doi.org/10.3390/socsci10110440