Article

Massachusetts Roadmap to Net Zero: Accounting for Ownership of Soil Carbon Regulating Ecosystem Services and Land Conversions

1
Department of Forestry and Environmental Conservation, Clemson University, Clemson, SC 29634, USA
2
University Key Lab for Geomatics Technology and Optimized Resources Utilization in Fujian Province, Fuzhou 350002, China
3
University of Arkansas Agricultural Experiment Station, Arkansas Forest Resources Center, University of Arkansas at Monticello, Monticello, AR 71655, USA
4
Department of Environmental Engineering and Earth Sciences, Clemson University, Anderson, SC 29625, USA
5
Geography Department, Portland State University, Portland, OR 97202, USA
*
Author to whom correspondence should be addressed.
Laws 2022, 11(2), 27; https://doi.org/10.3390/laws11020027
Submission received: 18 December 2021 / Revised: 25 January 2022 / Accepted: 27 January 2022 / Published: 23 March 2022

Abstract

:
The state of Massachusetts (MA) has passed comprehensive climate change legislation and a roadmap of achieving Net Zero emissions in 2050, which includes the protection of environmental resources (e.g., soil) and green space across the state. Soil resources are an integral part of the land cover/land use. They can be a significant source of greenhouse gas (GHG) emissions because of the conversion of “low disturbance” land covers (e.g., evergreen forest, hay/pasture) to “high disturbance” land covers (e.g., low-, medium-, and high-intensity developed land). These often “invisible” GHG emissions can be considered as “negative externalities” and “external costs” because of the difficulty in assigning ownership to the emissions. The combination of remote sensing and soil information data analysis can identify the ownership associated with GHG emissions and therefore expand the range of policy tools for addressing these emissions. This study demonstrates the rapid assessment of the value of regulating ecosystems services (ES) from soil organic carbon (SOC), soil inorganic carbon (SIC), and total soil carbon (TSC) stocks, based on the concept of the avoided social cost of carbon dioxide (CO2) emissions for MA by soil order and county using remote sensing and information from the State Soil Geographic (STATSGO) and Soil Survey Geographic Database (SSURGO) databases. Classified land cover data for 2001 and 2016 were downloaded from the Multi-Resolution Land Characteristics Consortium (MRLC) website. The results provide accurate and quantitative spatio-temporal information about likely GHG emissions, which can be linked to ownership. The state of MA can use these remote sensing tools and publicly available data to quantify and value GHG emissions based on property ownership, therefore “internalizing” the costs of these emissions for a cost-effective climate mitigation policy.

1. Introduction

Greenhouse gas emissions are often considered to be “negative externalities” and “external costs,” which are difficult to quantify because of their invisible nature. Integration of spatio-temporal and property ownership information that quantifiably links development to the amount of GHG emissions can “internalize” the costs of these emissions for a cost-efficient climate mitigation policy. Remote sensing analysis combined with soil and property ownership information can be used to identify and quantify GHG emissions because of conversion of “low disturbance” land covers (e.g., evergreen forest, hay/pasture) to “high disturbance” land covers (e.g., low-, medium-, and high-intensity developed land). Linking GHG emissions from soils with property ownership provides an opportunity to associate the cost of these emissions with the specific owner(s), soils, and land conversions, therefore, not burdening the government and public with unnecessary shared costs. Massachusetts’s goal of achieving net-zero GHG emissions by 2050 requires actionable quantitative information tied to land ownership. While land ownership is commonly in the public domain (e.g., tax, parcel ownership information), risks associated with GHG emissions would require information disclosures (Cohen 2001; Cohen and Viscusi 2012; EPA n.d.) which could be associated with either reputational or even regulatory actions that may alter the type and location of development (or even halt it) to limit GHG emissions.

The Role of Soils in Massachusetts Roadmap to Net-Zero

The state of Massachusetts seeks to achieve net-zero GHG emissions by 2050 (Senate Bill 9—An Act Creating a Next Generation Roadmap for Massachusetts Climate Policy n.d.) and reduce its carbon (C) emissions as part of the Massachusetts 2050 Decarbonization Roadmap (2020), which are potentially significant contributions to the Paris Agreement (United Nations 2015) and the United Nations Sustainable Development Goals (SDGs) (Keestra et al. 2016). The state of MA calls for a cost-effective reduction in GHG emissions, which requires rapid spatio-temporal assessment of sources and sinks of these emissions from various sources (e.g., the soil under different land uses, etc.) (Mikhailova et al. 2021a, 2021b). The ecosystem services/disservices (ES/ED) framework can be used as a valuation tool to assign a monetary value of social costs associated with GHG emissions based on the avoided social cost of carbon (SC-CO2) (Mikhailova et al. 2021b). Regulating ES/ED (e.g., carbon sequestration; CO2 emissions) are increasingly being used to value GHG emissions from the soil as a result of land conversions in other Northeastern states (e.g., New Hampshire, Rhode Island) (Mikhailova et al. 2021c, 2021d). For example, Mikhailova et al. (2021c) proposed to use soil carbon regulating ES and land cover change analysis to inform disclosures for the state of RI.
Pedodiversity of MA (soil type composition of the state) defines the soil regulating ES/ED potential with regards to its ability to store or release CO2 and the vulnerability of soil resources to climate change (Table 1, Figure 1) (Mikhailova et al. 2021a). There are five soil orders in the state of MA, which belong to slightly weathered (Entisols, Inceptisols, Histosols) and strongly weathered (Spodosols, Ultisols) soils with different soil C storages and vulnerabilities to climate change. The state of MA has selected Paxton as the State Soil (soil order: Inceptisols) for its high value in provisioning ES (e.g., apples, corn, and silage) (Natural Resources Conservation Service n.d.).
Massachusetts Senate Bill 9 (Senate Bill 9—An Act Creating a Next Generation Roadmap for Massachusetts Climate Policy n.d.) stresses the importance of ownership with regard to “direct emissions” (e.g., GHG emissions) by providing the following definition to them: “emissions from sources that are owned or operated, in whole or in part, by any person, entity or facility in the commonwealth including, but not limited to, emissions from any transportation vehicle, building, structure, distribution system or residential, commercial, institutional, industrial, waste management, agricultural or manufacturing process.” With a high proportion of private land ownership (93.7%, U.S. Bureau of the Census 1991) in the state, actions associated with GHG soil emissions can be tied directly to land ownership through existing public land ownership spatial databases (Figure 2).
This study hypothesizes that the state of MA can use remote sensing tools and publicly available data to quantify and value GHG emissions based on property ownership, therefore “internalizing” the costs of these emissions for a cost-effective climate mitigation policy. Our study will use the current MA Senate Bill 9 (Senate Bill 9—An Act Creating a Next Generation Roadmap for Massachusetts Climate Policy n.d.) and the Massachusetts 2050 Decarbonization Roadmap (2020) to show how soil and land cover analysis can be used to identify and update emission sources (e.g., hotspot of CO2 emissions associated with land cover change), and to evaluate how land cover change has and can impact greenhouse gas emissions, which could be linked to property ownership used to develop various cost-effective GHG mitigation policies (e.g., “internalizing” the costs of GHG emissions; information disclosure, etc.).
The specific objective of this study was to assess the value of SOC, SIC, and TSC in the state of MA (USA) and its change in the past 15 years based on the social cost of C (SC–CO2) and avoided emissions provided by C sequestration, which the U.S. Environmental Protection Agency (EPA) has determined to be $46 per metric ton of CO2, applicable for the year 2025 based on 2007 U.S. dollars and an average discount rate of 3% (EPA 2016a). Our calculations provide estimates for the monetary values of SOC, SIC, and TSC across the state and by different spatial aggregation levels (i.e., county) using the State Soil Geographic (STATSGO) and Soil Survey Geographic Database (SSURGO) databases and information previously reported by Guo et al. (2006). Classified land cover data for 2001 and 2016 were downloaded from the Multi-Resolution Land Characteristics Consortium (MRLC) website (MRLC n.d.).

2. Accounting for Soil Regulating Ecosystem Services in the State of Massachusetts

This study used both biophysical (science-based, Figure 1) and administrative (boundary-based, Figure 1) accounts to calculate monetary values for SOC, SIC, and TSC (Table 2 and Table 3). Although this framework was used primarily to account for soil regulating ES, it can be adapted for identifying the ownership of GHG emissions. Table 2 was enhanced by the addition of an “ownership” row, which can be used to categorize the ownership of GHG emissions (e.g., government, private, etc.).
The present study estimates monetary values associated with stocks of SOC, SIC, and TSC in MA based on reported contents (in kg m−2) from Guo et al. (2006). Values were calculated using the avoided social cost of carbon (SC-CO2) of $46 per metric ton of CO2, applicable for 2025 based on 2007 U.S. dollars and an average discount rate of 3% (EPA 2016a). According to the EPA, the SC-CO2 is intended to be a comprehensive estimate of climate change damages. Still, it can underestimate the true damages and cost of CO2 emissions due to the exclusion of various important climate change impacts recognized in the literature (EPA 2016a). Area-normalized monetary values ($ m−2) were calculated using Equation (1), and total monetary values were summed over the appropriate area(s) (noting that a metric ton is equivalent to 1 megagram (Mg) or 1000 kilograms (kg), and SC = soil carbon, e.g., SOC, SIC, or TSC):
$ m 2 = ( SOC / SIC / TSC   Content , kg m 2 ) × 1   Mg 10 3   kg × 44   Mg   CO 2 12   Mg   SC × $ 46 Mg   CO 2  
Table 4 presents area-normalized contents (kg m−2) and monetary values ($ m−2) of soil carbon, which were used to estimate stocks of SOC, SIC, and TSC and their corresponding values by multiplying the contents/values by the area of a particular soil order within a county (Table 3). For example, for the soil order Inceptisols, Guo et al. (2006) reported a midpoint SOC content of 8.9 kg m−2 for the upper 2-m soil depth (Table 4). Using this SOC content in equation (1) results in an area-normalized SOC value of $1.50 m−2. Multiplying the SOC content and its corresponding area-normalized value each by the total area of Inceptisols present in MA (10,185.9 km2, Table 3) results in an estimated SOC stock of 9.1 × 10¹⁰ kg (Table 5) with an estimated monetary value of $15.3B.
Land use/land cover change in MA between 2001 and 2016 was analyzed using classified land cover data from the Multi-Resolution Land Characteristics Consortium (MRLC) (MRLC n.d.). Changes in land cover, with their associated soil types, were calculated in ArcGIS Pro 2.6 (ESRI n.d.) by comparing the 2001 and 2016 data, converting the land cover to vector format, and unioning the data with the soils layer in the Soil Survey Geographic (SSURGO) Database (Soil Survey Staff n.d.a).

3. Soil Carbon Regulating Ecosystem Services and Land Cover Change in the State of Massachusetts

Based on avoided SC–CO2, the total estimated monetary mid-point value for TSC in the state of Massachusetts was $59.8B (i.e., 59.8 billion U.S. dollars, where B = billion = 109), $47.4B for SOC (79% of the total value), and $12.4B for SIC (21% of the total value). Previously, we have reported that among the 48 conterminous states of the U.S., Massachusetts ranked 43rd for TSC (Mikhailova et al. 2019a), 43rd for SOC (Mikhailova et al. 2019b), and 43rd for SIC (Groshans et al. 2019).

3.1. Storage and Value of SOC by Soil Order and County for Massachusetts

Soil orders with the highest midpoint monetary value for SOC were Histosols ($21.9B), Inceptisols ($15.3B), and Spodosols ($5.4B) (Table 5 and Table 6). The counties with the highest midpoint SOC values were Worcester ($8.4B), Plymouth ($6.5B), and Middlesex ($5.6B) (Table 5 and Table 6). Plymouth has the largest area occupied by Histosols (Table 3), which has a high SOC midpoint content (140.1 kg m−2; Table 4) and therefore a corresponding high monetary value of $4.4B (Table 6).

3.2. Storage and Value of SIC by Soil Order and County for the State of Massachusetts

Soil orders with the highest midpoint monetary value for SIC were Inceptisols ($8.7B), Entisols ($2.9B), and Histosols ($379.7M, where M = million = 106) (Table 7 and Table 8). The counties with the highest midpoint SIC values were Worcester ($2.2B), Franklin ($1.3B), and Plymouth ($1.1B) (Table 7 and Table 8).

3.3. Storage and Value of TSC (SOC + SIC) by Soil Order and County for Massachusetts

Soil orders with the highest midpoint monetary value for TSC were Inceptisols ($24.0B), Histosols ($22.2B), and Inceptisols ($7.8B) (Table 9 and Table 10). The counties with the highest midpoint TSC values were Worcester ($10.7B), Plymouth ($7.7B), and Middlesex ($6.7B) (Table 9 and Table 10). These rankings are the same as for SOC and reflect the dominant contribution of SOC to TSC in the State.

3.4. Land Use/Land Cover Change by Soil Order in Massachusetts from 2001 to 2016

Massachusetts experienced changes in land use/land cover (LULC) over the 15-year period (Table 11, Figure 3). Changes varied by soil order and original LULC classification, with most soil orders experiencing area losses in “low disturbance” LULC classes (e.g., evergreen forest, hay/pasture) while gaining in the areas of “developed” LULC classes. The most dramatic increases in developed land areas occurred in Middlesex, Worcester, and Plymouth counties, all in the eastern or central part of the state and geographically close to the population centers of Boston or Worcester. More detailed spatial and temporal analyses of land cover can identify critical locations of soil carbon regulating ecosystem services at risk.

4. Significance of Results for Massachusetts’ Climate Policy

The state of MA is experiencing the effects of climate change (EPA 2016b). The new MA’s law, Senate Bill 9—An Act Creating a Next Generation Roadmap for Massachusetts Climate Policy (n.d.), officially established a new Net Zero GHG emissions limit by 2050, and significantly increases protections for the environment across MA. Our study used the recently completed reports from 2020 to show how soil and land cover analysis can be utilized to identify and update emission sources (e.g., hotspot of CO2 emissions associated with land cover change) and evaluate how land cover change has and can impact GHG emissions. This study provides essential information for some of these strategies in the following ways:
Massachusetts 2050 Decarbonization Roadmap
Strategies to Achieve Net Zero: Natural Carbon Sequestration
The current version of the decarbonization roadmap does not contain pedodiversity (soil diversity) information (Massachusetts 2050 Decarbonization Roadmap 2020). Pedodiversity of MA (“portfolio-effect”) is defined by slightly (Entisols, Inceptisols, and Histosols) and strongly (Spodosols, Ultisols) weathered soils with Histosols being a hotspot of SOC storage valued at $21.9B (46% of total SC-CO2 associated with SOC) (Table 12). Soil inorganic carbon is mainly found in the soil order of Inceptisols (71% of the total SC-CO2 associated with SIC) (Table 12). Most of the soils in the state of MA have low sensitivity to climate change because of inherently low soil carbon content (except for Histosols) but can be a subject of soil carbon loss upon disturbance (e.g., urban development, etc.). Soils of MA have limited carbon sequestration (recarbonization) potential because of their soil chemical and physical properties as well as other environmental (e.g., global warming, etc.) and anthropogenic factors (e.g., past land cover changes: “land-use legacy”). The state of MA experienced widespread deforestation before the 1860s, and current forests are categorized biologically as “new growth,” which occupies over 60% of the total area (Massachusetts 2050 Decarbonization Roadmap 2020). The past deforestation and agricultural use were accompanied by soil erosion and carbon loss (Lu et al. 2013).
Natural Carbon Sequestration: Contributions to Massachusetts Emissions
The current version of the decarbonization roadmap states that “Massachusetts forests are projected to have the capacity to sequester about 5 MMTCO2e per year from now through 2050. This is equivalent to roughly 7% of the Commonwealth’s current emissions and roughly half of allowable residual emissions in 2050.” According to our study, MA’s forests experienced losses from land conversions from 2001 to 2016 (Table 11): mixed forest (−0.88% decrease from 2001), deciduous forest (−6.72%), evergreen forest (−3.89%). In general, the state of MA experienced losses in “low disturbance” land covers (e.g., forest, pasture, etc.) and increases in “high disturbance” land covers (e.g., developments with soil orders of Inceptisols ($489.78M) and Histosols ($228.09M) generating the highest social costs of carbon (Table 13). Soil order of Histosols is often found in wetlands, which are commonly protected by state and federal laws.
The increase in “high disturbance” covers affected all soil orders and counties in MA. The counties that have exhibited the most development are Middlesex ($236.4M), Worcester ($167.9M), and Plymouth ($159.0M) (Table 14, Figure 4). These types of developments are often called “contagious” developments (Robalino and Pfaff 2012) around existing urban areas, which are characterized by high costs of real estate and common in the state of MA, especially around the City of Boston (capital and the most populous city in MA) (Glaeser et al. 2006). Previous research reported that two-thirds of 187 communities surveyed in eastern and central Massachusetts had wetland regulations (which may protect Histosols) more stringent than state regulations (Glaeser et al. 2006). Despite this finding, our study found that Middlesex and Plymouth counties had high realized social costs of carbon associated with the soil order Histosols with $109.2M and $42.7M, respectively (Table 14). The “Massachusetts 2050 Decarbonization Roadmap” calls for “a more complete accounting of land use impacts on human and natural systems to understand the long-term systemic effects and the balance of ecosystem benefits given these dynamics (Massachusetts 2050 Decarbonization Roadmap 2020)”.
Natural Carbon Sequestration: Transition Needed for Decarbonization
The current version of the decarbonization roadmap states that decarbonization should involve “ensuring the viability and health of the Commonwealth’s existing 3.3 million acres of forested land is the primary strategy to ensure this sequestration potential is available in 2050.” According to our study, MA’s forests experienced losses from land conversions from 2001 to 2016 (Table 11): mixed forest (−0.88% decrease from 2001), deciduous forest (−6.72%), evergreen forest (−3.89%), and these losses affected all soil orders in all types of forests. According to the “Massachusetts 2050 Decarbonization Roadmap” “forest conversion driven by development both releases stored carbon through tree removal and significantly and often permanently limits potential future sequestration on that land (Massachusetts 2050 Decarbonization Roadmap 2020).” The MA’s roadmap compares the impacts of developments to timber harvesting and concludes that “the impacts of development, while static, will eventually be larger than those of harvesting, as the former prevents forest regeneration, while the latter allows, and can potentially amplify, regeneration over longer time horizons. While trees across Massachusetts contain, or store, about 100 million metric tons of carbon, the Commonwealth’s soil may store as much as four times that amount. A more complete accounting of land use impacts on human and natural systems is needed to understand the long-term systemic effects and the balance of ecosystem benefits given these dynamics (Massachusetts 2050 Decarbonization Roadmap 2020).”
Natural Carbon Sequestration: Near Term Implications
The current version of the decarbonization roadmap states that near term implications should include “encouraging dense development and best management practices for commercial timber harvesting, which can increase forest carbon sequestration, but only minimally; neither has the potential to significantly alter the 2050 sequestration potential of Massachusetts forests (Massachusetts 2050 Decarbonization Roadmap 2020).” Our results show that land conversions in the past 15 years affected all counties and soil orders with the most increase in already existing urbanized areas (e.g., Boston) with high real estate value. Developments mostly affected the soil orders of Inceptisols ($492.3M) and Histosols ($230.3M) even though Histosols are commonly associated with wetlands, which are often protected at the state and federal levels. Our findings indicate that there may be gaps in urban planning, which have allowed development with damaging realized social costs of carbon dioxide emissions without assigning responsibility or costs associated with these emissions. For example, our study provides information disclosure that can be linked to developments over the last 15 years that could be used to locate the owners of the properties with realized emissions. These property owners could be asked or required to provide compensation for these emissions in a voluntary or mandatory manner. Future emissions could be limited by incorporating information disclosures (e.g., climate information disclosure) by modeling potential social costs associated with proposed developments based on remote sensing, soil, and land cover change information. These information disclosures could be shared to improve public engagement and allow reputational or regulatory consequences for high-emission developments. This analysis can be tied to the existing land-parcel-based ownership information systems to develop a publicly available tracking system that links development with estimated GHG emissions over time which could be a valuable addition to the proposed carbon sink tracking system (Massachusetts 2050 Decarbonization Roadmap 2020). Bartkowski et al. (2018) discuss legal challenges in defining the ownership of land/soil ecosystem goods and services and their disservices (e.g., GHG emissions). Soils are an integral part of business ecosystems in MA, which generate various profits and damages (Mikhailova et al. 2020). In MA, “over the next 30 years, population-driven new development, mostly for housing, is expected to require approximately 125,000 acres of land”, which should be focused on the redevelopment of existing areas as much as is possible (Massachusetts 2050 Decarbonization Roadmap 2020).
Natural Carbon Sequestration: Continued Areas of Research and Future Investigation
The current version of the decarbonization roadmap proposed the following areas of research and future investigation:
1.
“Gaining a more complete accounting of land use impacts on human and natural systems to understand the long-term systemic effects and the balance of ecosystem benefits.”
The proposed accounting system and methodology that links property ownership with soil carbon resources could be expanded to above-ground carbon stocks (e.g., forests) to provide a detailed method to link land-use impacts to property ownership. Remote-sensing analysis based on historical data could provide quantitative information about past emissions, representing an “ecological debt” and its environmental justice value for monetary compensation (Warlenius et al. 2015). Due to high private land ownership (93.7%), most past, current, and future social costs of carbon dioxide emissions in MA are from private landowners (including foreign ownership) (Minchillo 2019). Many damages associated with climate change are seen as the MA’s government’s responsibility, which requires public expenditures to mitigate climate change in MA. Landowners responsible for these emissions could provide monetary compensation for this “ecological debt.” Since climate change is a global problem, it should be noted that MA’s contribution to this “ecological debt” can extend well beyond the state of MA.
2.
“Exploring the treatment of atmospheric carbon removals outside of Massachusetts’ borders.”
Achieving Net Zero emissions for MA, by definition, requires carbon accounting within the state of MA to have no overall GHG emissions, regardless of efforts outside the state. Even in the cases where it may be more efficient to make agreements with neighboring states for atmospheric carbon removal, it is crucial to account for GHG emissions to be able to assign MA-required contributions, which could be based on past, current, or future (projected) emissions. The state of MA is the largest in New England. Its realized social costs of GHG emissions from land development (2001–2016) were relatively high ($932.69M) in comparison with other states in the region for the same time: New Hampshire generated $648M Mikhailova et al. (2021c), and Rhode Island generated $157M Mikhailova et al. (2021d). It should be noted that New England states have somewhat similar limitations for carbon sequestration; therefore, the challenge of land development and Net Zero emissions goals would require creative GHG emission reduction and sequestration strategies.

5. Significance of Results in Broader Context

The results of this study make an important contribution in broader context since the GHG emissions from the state of MA are part of the whole country’s GHG emissions. Potential impacts for GHGs emissions include sea-level rise that may have a dramatic and catastrophic impact on MA in the figure (Figure 5). Regulating GHGs emissions in the United States is complex because many of the decisions that impact GHG emissions are made at the State or even local levels, which are responsible for land use designations and regulations. While these state-level decisions are not always controlled by the Federal Government, land use decisions that limit GHG emissions could be incentivized by the Federal Government. Additionally, some Federal legislation (e.g., federal wetland protection, EPA emission laws) may serve to limit future GHG emissions. Currently, most of the states do not have state-led adaptation plans with GHG reduction goals (Georgetown Climate Center 2022). In addition, while the Federal Government can regulate many GHG point emission sources (EPA n.d.), the land use decisions largely fall to state and local governments.
This paper highlights a methodology that could quantifiably assess a reduction of GHG emissions based on land use development decisions. For example, redevelopment of an existing urban site may not entail additional likely GHG emissions, when compared to the conversion of agricultural or forest land to a housing development. Reduction of GHG emissions could be in comparison with past emissions which can also be calculated with these methods.
The results of this study can be of benefit in resolving ambiguity in the land use component of mitigation contributions toward the Paris Agreement goals (Fyson and Jeffery 2019). In 2023, the Global Stocktake will be assessing the impacts of Nationally Determined Contributions (NDCs), which include land use, land use change, and forestry (LULUCF) activities (e.g., deforestation, forest restoration, etc.) (Fyson and Jeffery 2019). Fyson and Jeffery (2019) surveyed 167 NDCs and found that 121 included land information, “but only 11 provide a LULUCF target that can be fully quantified using information presented or referenced in the NDC.” Most of the NDCs surveyed were focused on emission reductions related to LULUCF, and there was limited mention of anthropogenic emissions associated with LULUCF (Fyson and Jeffery 2019). It is unclear if soils are accounted for as sinks or sources for emissions in a quantifiable way. Land cover change analysis focuses primarily on forest cover change that may not fully account for GHG emissions from soils caused by land conversion from low disturbance land cover to high disturbance land covers. Our study demonstrates that satellite-based land cover analysis can track both the locations of land conversion and, over time, the cumulative potential GHG emission impact. This methodology is not limited to the United States but can be applied worldwide with the increasing availability of both satellite-derived land cover, digital soil, and land ownership maps. There is an overall lack of transparency and accountability related to LULUCF and NDCs (Fyson and Jeffery 2019; Pauw et al. 2018). By translating potential GHG emissions to the social cost of emissions combined with quantifiable, spatially explicit methods, as with our study, it would be possible to integrate NDCs with land ownership and GHG emission responsibility. This assignment of responsibility for emissions can allow for specific regulatory or financial consequences. Alternatively, rewards could be assigned for carbon sequestration.

6. Conclusions

This study discussed the importance of accounting for ownership of soil carbon regulating ecosystem services/disservices and land conversions in MA. This study applied remote sensing, soil, and land cover change analysis to quantify soil C stocks, their value, and dynamics at the state and county levels in the state of MA, which can be linked to property ownership for cost-effective climate policy. The total estimated monetary mid-point value for TSC stocks in the state of Massachusetts was $59.8B (i.e., 59.8 billion U.S. dollars (USD), where B = billion = 109), $47.4B for SOC stocks, and $12.4B for SIC stocks. Soil orders with the highest midpoint value for SOC were Histosols ($21.9B), Inceptisols ($15.3B), and Spodosols ($5.4B). Soil orders with the highest midpoint value for SIC were Inceptisols ($8.7B), Entisols ($2.9B), and Histosols ($379.7M, where M = million = 106). Soil orders with the highest midpoint value for TSC were Inceptisols ($24.0B), Histosols ($22.2B), and Entisols ($7.8B). The counties with the highest midpoint SOC values were Worcester ($8.4B), Plymouth ($6.5B), and Middlesex ($5.6B). The counties with the highest midpoint SIC values were Worcester ($2.2B), Franklin ($1.3B), and Plymouth ($1.1B). The counties with the highest midpoint TSC values were Worcester ($10.7B), Plymouth ($7.7B), and Middlesex ($6.7B). Massachusetts has experienced changes in land use/land cover (LULC) between 2001 and 2016. The changes in LULC across the state have not been uniform but rather have varied by county, soil order, and pre-existing land cover. The counties that have exhibited the most development (e.g., Middlesex, Worcester, Plymouth) are those nearest the urban center of Boston, MA. Most soil orders have experienced losses in “low disturbance” land covers (e.g., evergreen forest, hay/pasture) and gains in “high disturbance” land covers (e.g., low-, medium-, and high-intensity developed land) with an area of 316 km2, and corresponding SC-CO2 of $932.69M. Histosols are a high-risk carbon “hotspot” that contributes over 40% of the total estimated sequestration of SOC in Massachusetts while covering only 5% of the total land area. Integration of pedodiversity concepts with administrative units can be useful to design soil- and land-cover-specific, cost-efficient policies to manage soil C regulating ES in Massachusetts at various administrative levels. Although this study was focused on identifying past realized social costs of C from land conversions, these techniques can also be used to identify the ownership of these emissions to potentially assign legal and financial responsibility for these emissions.
Even though identifying ownership and assignment of responsibility for land-use decisions can be complex, developing a transparent tracking system tied to existing land ownership spatial databases could help address this challenge. These systems would provide information disclosure that could help improve public engagement while also providing opportunities for land management decisions to minimize GHG emissions, directed by regulation or reputational benefit. Such a system could be used to project the consequences of potential land-use decisions, and if tied to regulatory costs, could help drive development that minimizes GHG emissions through market measures (e.g., dense developments). Our study demonstrates that it is possible to monetize “externalities” generated by land conversions which are essential information to help fairly distribute the costs associated with this conversion as part of the MA Net Zero roadmap.
Future research should focus on quantifying the cost of land conversion that negates opportunities for future carbon sequestration (e.g., forest to the parking lot, etc.). It is also essential to consider the “ecological debt” of past land conversions and the related financial obligation of these landowners to help mitigate the damages associated with these emissions. This study showed that it is possible to assign damages to specific areas (and by proxy, landholders). Even if these cannot be connected to damages, these landowners could help fund future mitigation efforts. Although the soil based GHG emissions can be tied to specific ownership, the consequences of these emissions go beyond state boundaries. Collective action by groups (e.g., states) may allow for more efficient, equitable, and fair GHG emission reductions, partitioned by contribution, which assigns responsibility from past or planned land conversion.

Author Contributions

Conceptualization, E.A.M.; methodology, E.A.M., M.A.S. and H.A.Z.; formal analysis, E.A.M.; writing—original draft preparation, E.A.M. and G.C.P.; writing—review and editing, E.A.M., C.J.P., G.C.P. and M.A.S.; visualization, H.A.Z., L.L. and Z.H. All authors have read and agreed to the published version of the manuscript.

Funding

This research received no external funding.

Institutional Review Board Statement

Not applicable.

Informed Consent Statement

Not applicable.

Data Availability Statement

Not applicable.

Acknowledgments

We would like to thank the reviewers for their constructive comments and suggestions.

Conflicts of Interest

The authors declare no conflict of interest.

Glossary

EDEcosystem disservices
ESEcosystem services
EPAEnvironmental Protection Agency
SC-CO2Social cost of carbon emissions
SDGsSustainable Development Goals
SOCSoil organic carbon
SICSoil inorganic carbon
SOMSoil organic matter
SSURGOSoil Survey Geographic Database
TSCTotal soil carbon
USDAUnited States Department of Agriculture

References

  1. Bartkowski, Bartosz, Bernd Hansjürgens, Stefan Möckel, and Stephan Bartke. 2018. Institutional economics of agricultural ecosystem services. Sustainability 10: 2447. [Google Scholar] [CrossRef] [Green Version]
  2. Bétard, François, and Jean-Pierre Peulvast. 2019. Geodiversity hotspots: Concept, method and cartographic application for geoconservation purposes at a regional scale. Environmental Management 63: 822–34. [Google Scholar] [CrossRef] [PubMed]
  3. Cohen, Mark A. 2001. Information as a policy instrument in protecting the environment: What have we learned? Environmental Law Reporter 31: 10425–31. [Google Scholar]
  4. Cohen, Mark A., and W. Kip Viscusi. 2012. The role of information disclosure in climate mitigation policy. Climate Change Economics 3: 1250020. [Google Scholar] [CrossRef]
  5. EPA (United States Environmental Protection Agency). 2016a. The Social Cost of Carbon. EPA Fact Sheet. Available online: https://19january2017snapshot.epa.gov/climatechange/social-cost-carbon_.html (accessed on 15 September 2021).
  6. EPA (United States Environmental Protection Agency). 2016b. What Climate Change Means for Massachusetts. Available online: https://19january2017snapshot.epa.gov/sites/production/files/2016-09/documents/climate-change-ma.pdf (accessed on 10 December 2021).
  7. EPA (United States Environmental Protection Agency). n.d. Greenhouse Gas Reporting Program (GHGRP). Available online: https://www.epa.gov/ghgreporting/learn-about-greenhouse-gas-reporting-program-ghgrp (accessed on 2 November 2021).
  8. ESRI (Environmental Systems Research Institute). n.d. ArcGIS Pro 2.6. Available online: https://pro.arcgis.com/en/pro-app/2.6/get-started/whats-new-in-arcgis-pro.htm (accessed on 1 September 2021).
  9. Fyson, Claire L., and Louise M. Jeffery. 2019. Ambiguity in the land use component of mitigation contributions toward the Paris Agreement goals. Earth’s Future 7: 873–91. [Google Scholar] [CrossRef]
  10. Georgetown Climate Center. 2022. A Leading Resource for State and Federal Policy. Available online: https://www.georgetownclimate.org/adaptation/plans.html (accessed on 17 December 2021).
  11. Glaeser, Edward L., Jenny Schuetz, and Bryce Ward. 2006. Regulation and the Rise of Housing Prices in Greater Boston. Cambridge: Rappaport Institute for Greater Boston, Harvard University, Boston: Pioneer Institute for Public Policy Research. [Google Scholar]
  12. Groshans, Garth R., Elena A. Mikhailova, Christopher J. Post, Mark A. Schlautman, and Lisha Zhang. 2019. Determining the value of soil inorganic carbon stocks in the contiguous United States based on the avoided social cost of carbon emissions. Resources 8: 119. [Google Scholar] [CrossRef] [Green Version]
  13. Guo, Yinyan, Ronald Amundson, Peng Gong, and Qian Yu. 2006. Quantity and spatial variability of soil carbon in the conterminous United States. Soil Science Society of America Journal 70: 590–600. [Google Scholar] [CrossRef] [Green Version]
  14. Keestra, Saskia D., Johan Bouma, Jakob Wallinga, Pablo Tittonell, Pete Smith, Artemi Cerdà, Luka Montanarella, John N. Quinton, Yakov Pachepsky, Wim H. van der Putten, and et al. 2016. The significance of soils and soil science towards realization of the United Nations Sustainable Development Goals. Soil 2: 111–28. [Google Scholar] [CrossRef] [Green Version]
  15. Lu, Xiaoliang, David W. Kicklighter, Jerry M. Melillo, Ping Yang, Bernice Rosenzweig, Charles J. Vörösmarty, Barry Gross, and Robert J. Stewart. 2013. A contemporary carbon balance for the Northeast Region of the United States. Environmental Science and Technology 47: 13230–38. [Google Scholar] [CrossRef] [PubMed] [Green Version]
  16. Massachusetts 2050 Decarbonization Roadmap. 2020. Available online: https://www.mass.gov/doc/ma-decarbonization-roadmap-abridged-english/download (accessed on 1 December 2021).
  17. Mikhailova, Elena A., Christopher J. Post, Mark A. Schlautman, Gregory C. Post, and Hamdi A. Zurqani. 2020. The business side of ecosystem services of soil systems. Earth 1: 15–34. [Google Scholar] [CrossRef]
  18. Mikhailova, Elena A., Garth R. Groshans, Christopher J. Post, Mark A. Schlautman, and Gregory C. Post. 2019a. Valuation of total soil carbon stocks in the contiguous United States based on the avoided social cost of carbon emissions. Resources 8: 157. [Google Scholar] [CrossRef] [Green Version]
  19. Mikhailova, Elena A., Garth R. Groshans, Christopher J. Post, Mark A. Schlautman, and Gregory C. Post. 2019b. Valuation of soil organic carbon stocks in the contiguous United States based on the avoided social cost of carbon emissions. Resources 8: 153. [Google Scholar] [CrossRef] [Green Version]
  20. Mikhailova, Elena A., Hamdi A. Zurqani, Christopher J. Post, Mark A. Schlautman, and Christopher J. Post. 2021a. Soil diversity (pedodiversity) and ecosystem services. Land 10: 288. [Google Scholar] [CrossRef]
  21. Mikhailova, Elena A., Lili Lin, Zhenbang Hao, Hamdi A. Zurqani, Christopher J. Post, Mark A. Schlautman, and Gregory C. Post. 2021b. Land cover change and soil carbon regulating ecosystem services in the state of South Carolina, USA. Earth 2: 674–95. [Google Scholar] [CrossRef]
  22. Mikhailova, Elena A., Lili Lin, Zhenbang Hao, Hamdi A. Zurqani, Christopher J. Post, Mark A. Schlautman, and Gregory C. Post. 2021c. Vulnerability of soil carbon regulating ecosystem services to land cover change in the state of New Hampshire. Earth 2: 208–24. [Google Scholar] [CrossRef]
  23. Mikhailova, Elena A., Lili Lin, Zhenbang Hao, Hamdi A. Zurqani, Christopher J. Post, Mark A. Schlautman, Gregory C. Post, and Peyton I. Mitchell. 2021d. Climate change planning: Soil carbon regulating ecosystem services and land cover change analysis to inform disclosures for the state of Rhode Island, USA. Laws 2: 92. [Google Scholar] [CrossRef]
  24. Minchillo, John. 2019. “American Soil” Is Increasingly Foreign Owned. National Public Radio. Available online: https://www.npr.org/2019/05/27/723501793/american-soil-is-increasingly-foreign-owned#:~:text=’American%20Soil‘%20Is%20Increasingly%20Foreign%20Owned%20The%20number%20of%20acres,alarm%20bells%20in%20farming%20communities (accessed on 9 December 2021).
  25. MRLC (Multi-Resolution Land Characteristics Consortium). n.d. Available online: https://www.mrlc.gov/ (accessed on 1 September 2021).
  26. Natural Resources Conservation Service. n.d. USDA. Paxton—Massachusetts State Soil. Available online: https://www.soils4teachers.org/files/s4t/k12outreach/ma-state-soil-booklet.pdf (accessed on 9 December 2021).
  27. Pauw, Pieter W., Richard J. T. Klein, Kennedy Mbeva, Adis Dzebo, Davide Cassanmagnago, and Anna Rudloff. 2018. Beyond headline mitigation numbers: We need more transparent and comparable NDCs to achieve the Paris Agreement on climate change. Climatic Change 147: 23–29. [Google Scholar] [CrossRef] [Green Version]
  28. Robalino, Juan A., and Alexander Pfaff. 2012. Contagious development: Neighbor interactions in deforestation. Journal of Development Economics 97: 427–36. [Google Scholar] [CrossRef]
  29. Senate Bill 9—An Act Creating a Next Generation Roadmap for Massachusetts Climate Policy. n.d. Available online: https://malegislature.gov/bills/192/S9 (accessed on 17 December 2021).
  30. Soil Survey Staff. n.d.a. Natural Resources Conservation Service, United States Department of Agriculture. n.d. Soil Survey Geographic (SSURGO) Database. Available online: https://nrcs.app.box.com/v/soils (accessed on 10 September 2021).
  31. Soil Survey Staff. n.d.b. Soil Survey Staff, Natural Resources Conservation Service, United States Department of Agriculture. Photos of Soil Orders. Available online: https://www.nrcs.usda.gov/wps/portal/nrcs/detail/soils/edu/?cid=nrcs142p2_053588 (accessed on 20 September 2021).
  32. The United States Census Bureau. 2018. TIGER/Line Boundary Shapefiles. Available online: https://www.census.gov/geographies/mapping-files/time-series/geo/tiger-line-file.2018.html (accessed on 10 September 2021).
  33. U.S. Bureau of the Census. 1991. Statistical Abstract of the United States: 1991; Washington, DC: U.S. Bureau of the Census, p. 201. Available online: https://www.census.gov/library/publications/1991/compendia/statab/111ed.html (accessed on 10 December 2021).
  34. United Nations. 2015. Paris Agreement. Available online: https://unfccc.int/sites/default/files/english_paris_agreement.pdf (accessed on 1 September 2021).
  35. Warlenius, Rikard, Pierce Gregory, and Vasna Ramasar. 2015. Reversing the arrow of arrears: The concept of “ecological debt” and its value for environmental justice. Global Environmental Change 30: 21–30. [Google Scholar] [CrossRef]
Figure 1. General soil map of Massachusetts (U.S.A.) (Latitude: 41°14′ N to 42°53′ N; Longitude: 69°56′ W to 73°30′ W) derived from the SSURGO database (Soil Survey Staff n.d.a) overlaid with county boundaries (The United States Census Bureau 2018).
Laws 11 00027 g001
Figure 2. The soil “hotspot” concept—an intersection between soil type and land cover classes under natural or anthropogenic disturbance (adapted from Bétard and Peulvast 2019; Mikhailova et al. 2021b), which can be used in conjunction with ownership information (e.g., private, government, foreign, etc.) for “internalizing” the costs of environmental pollution (e.g., greenhouse gas (GHG) emissions, etc.) for a cost-effective mitigation policy.
Laws 11 00027 g002
Figure 3. Land cover map of Massachusetts (U.S.A.) for 2016 (Latitude: 41°14′ N to 42°53′ N; Longitude: 69°56′ W to 73°30′ W) (based on data from (MRLC n.d.)).
Laws 11 00027 g003
Figure 4. The total dollar value of mid-point total soil carbon (TSC) storage value for newly “developed” land covers (open space, low, medium, and high intensity) from 2001 to 2016 in Massachusetts (U.S.A.) based on a social cost of C (SC-CO2) of $46 per metric ton of CO2 applicable for the year 2025 (2007 U.S. dollars with an average discount rate of 3% (EPA 2016a)).
Laws 11 00027 g004
Figure 5. Projections of future sea rise due to climate change in Massachusetts.
Laws 11 00027 g005
Table 1. Soil diversity (pedodiversity) is expressed as taxonomic diversity at the level of soil order and ecosystem service types in Massachusetts (U.S.A.) (adapted from Mikhailova et al. 2021a).
StocksEcosystem Services
Soil OrderGeneral Characteristics and ConstraintsProvisioningRegulation/
Maintenance
Cultural
Slightly Weathered
EntisolsEmbryonic soils with ochric epipedonxxx
InceptisolsYoung soils with ochric or umbric epipedonxxx
HistosolsOrganic soils with ≥20% of organic carbonxxx
Strongly Weathered
SpodosolsCoarse-textured soils with albic and spodic horizonsxxx
UltisolsHighly leached soils with B.S. < 35%xxx
Note: B.S. = base saturation.
Table 2. A conceptual overview of the accounting framework used in this study (adapted from Groshans et al. (2019)) which can also be used for greenhouse gas (GHG) emissions ownership for climate mitigation policy.
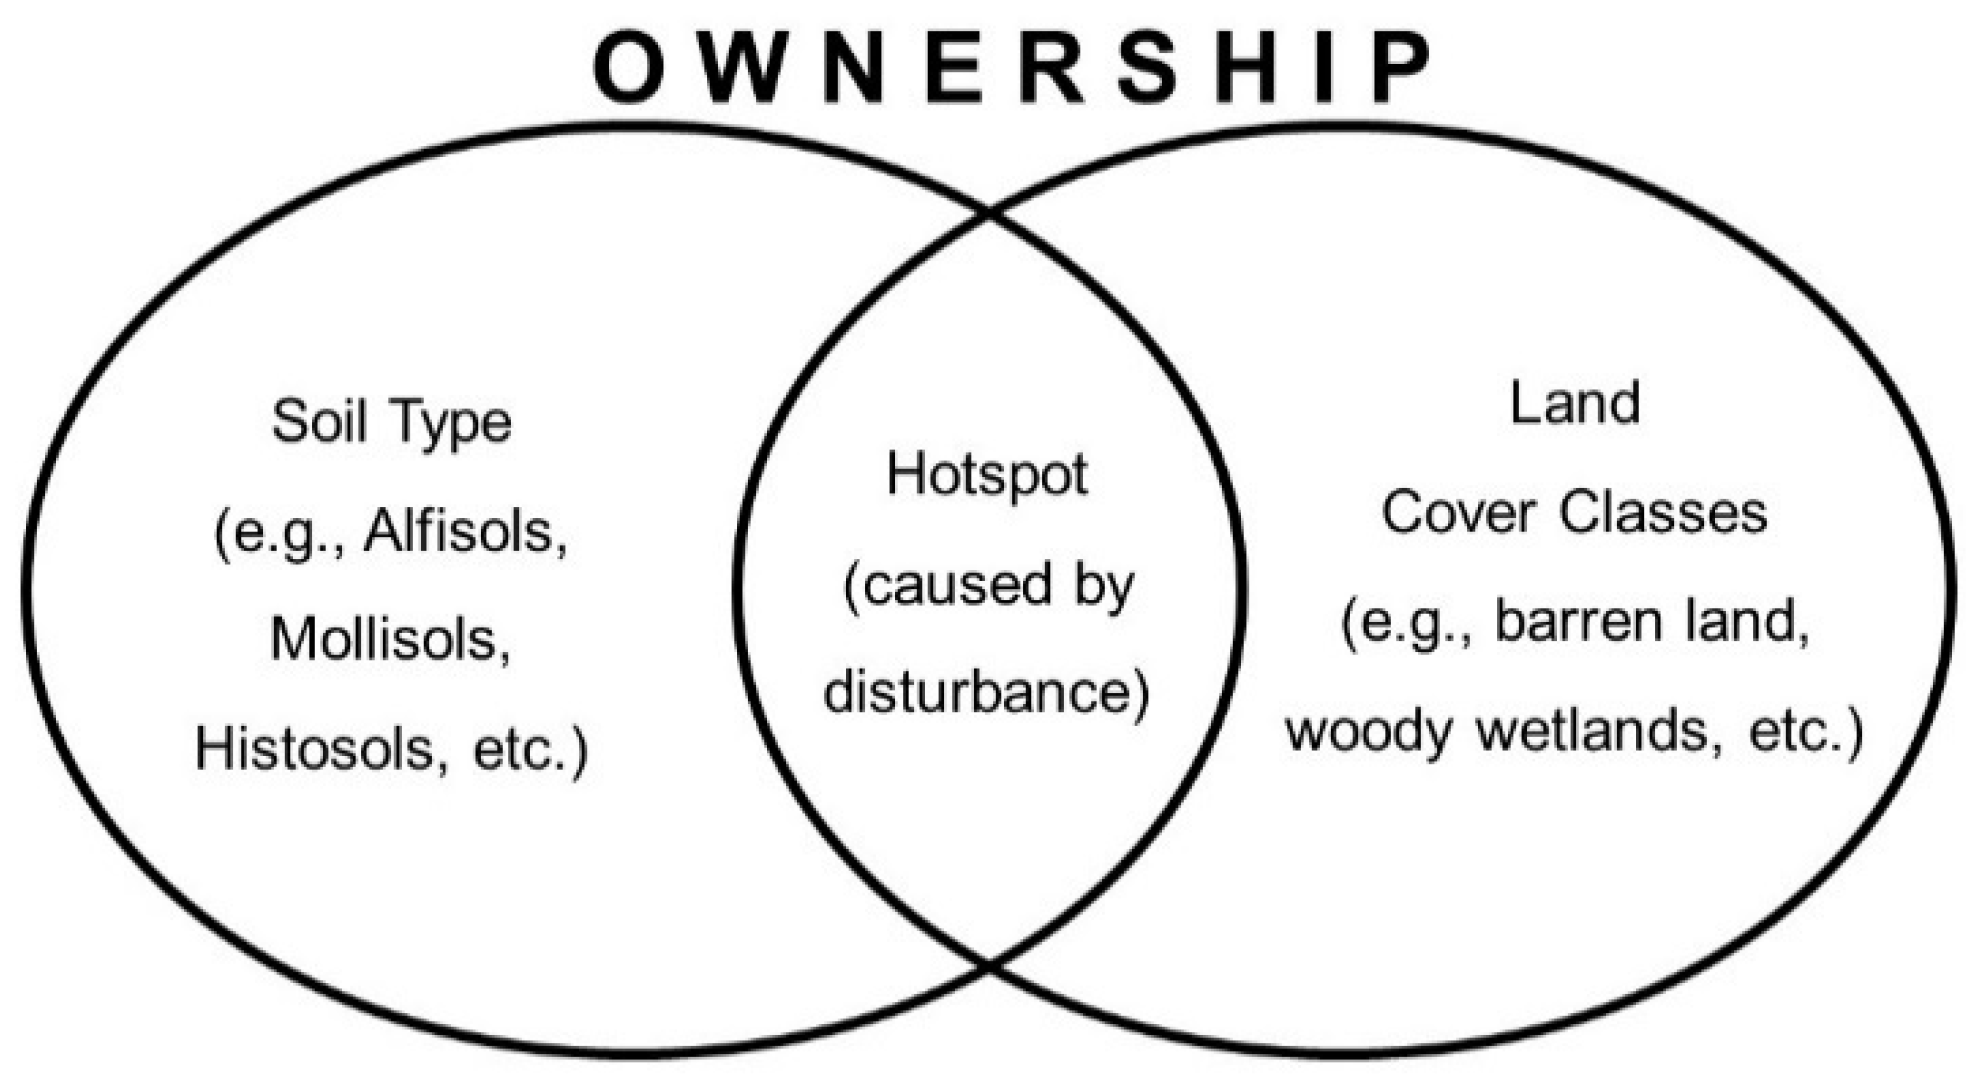
OWNERSHIP (e.g., government, private, foreign, shared, single, etc.)
Time (e.g., information disclosure, etc.)STOCKSFLOWSVALUE
Biophysical Accounts
(Science-Based)
Administrative Accounts
(Boundary-Based)
Monetary Account(s)Benefit(s)Total Value
Soil extent:Administrative extent:Ecosystem good(s) and service(s):Sector:Types of value:
Composite (total) stock: Total soil carbon (TSC) = Soil organic carbon (SOC) + Soil inorganic carbon (SIC)
Past
(e.g., post-development disclosures)

Current (e.g., status)

Future (e.g., pre-development disclosures)
Environment:The social cost of carbon (SC-CO2) and avoided emissions:
-
Soil orders (Entisols, Inceptisols, Histosols, Spodosols, Ultisols)
-
State (Massachusetts)
-
County (14 counties)
-
Regulating (e.g., carbon sequestration)
-
Carbon sequestration
-
$46 per metric ton of CO2 (2007 U.S. dollars with an average discount rate of 3% (EPA 2016a)
Table 3. Soil diversity (pedodiversity) by soil order (taxonomic pedodiversity) and county in Massachusetts (U.S.A.) based on Soil Survey Geographic (SSURGO) Database (Soil Survey Staff n.d.a).
CountyTotal Area (km2) (%)Degree of Weathering and Soil Development
Slight Strong
EntisolsInceptisolsHistosolsSpodosolsUltisols
2016 Area (km2), (% of Total County Area)
Barnstable 546.7 (3) 75.5 (14) 374.3 (68)76.4 (14) 20.6 (4)0 (0)
Berkshire 2117.1 (12) 273.3 (13) 481.9 (23)27.6 (1) 1334.4 (63)0 (0)
Bristol 1102.6 (6) 35.2 (3) 976.2 (89) 90.0 (8) 1.1 (0)0 (0)
Dukes 612.0 (4) 486.6 (80) 116.2 (19) 5.9 (1) 0 (0)3.3 (1)
Essex 1132.2 (7) 360.0 (32) 681.0 (60)84.0 (7) 7.1 (1)0 (0)
Franklin1577.2 (9) 75.9 (5) 1387.9 (88) 22.9 (1) 90.5 (6)0 (0)
Hampden 1439.5 (8) 506.2 (35) 756.3 (53)47.4 (3) 128.3 (9)1.2 (0)
Hampshire 915.4 (5)57.9 (6)637.1 (70) 52.5 (6) 168.0 (18)0 (0)
Middlesex 1314.2 (8)135.0 (10)1012.6 (77)166.6 (13) 0.0 (0)0 (0)
Nantucket 101.8 (1) 85.9 (84)5.6 (6) 6.6 (6) 3.7 (4)0 (0)
Norfolk 1030.3 (6) 423.4 (41)594.3 (58)12.7 (1) 0 (0)0 (0)
Plymouth 1597.5 (9)436.2 (27)804.4 (50) 186.0 (12) 170.9 (11)0 (0)
Suffolk 574.2 (3) 527.0 (92)43.4 (8)3.7 (1)0 (0)0 (0)
Worcester 3255.8 (19)124.9 (4)2314.8 (71)144.0 (4) 672.1 (21)0 (0)
Totals (100%)17,316.5 (100%)3603.0 (21)10,185.9(59)926.2 (5)2596.8 (15)4.5 (0)
Table 4. Area-normalized content (kg m−2) and monetary values ($ m−2) of soil organic carbon (SOC), soil inorganic carbon (SIC), and total soil carbon (TSC = SOC + SIC) by soil order based on data reported by Guo et al. (2006) for the upper 2 m of soil and an avoided social cost of carbon (SC-CO2) of $46 per metric ton of CO2 (2007 U.S. dollars with an average discount rate of 3% (EPA 2016a)).
Soil OrderSOC ContentSIC ContentTSC ContentSOC ValueSIC ValueTSC Value
Minimum—Midpoint—Maximum ValuesMidpoint Values
(kg m−2)(kg m−2)(kg m−2)($ m−2)($ m−2)($ m−2)
Slightly Weathered
Entisols1.8–8.0–15.81.9–4.8–8.43.7–12.8–24.21.350.822.17
Inceptisols2.8–8.9–17.42.5–5.1–8.45.3–14.0–25.81.500.862.36
Histosols63.9–140.1–243.90.6–2.4–5.064.5–142.5–248.923.620.4124.03
Strongly Weathered
Spodosols2.9–12.3–25.50.2–0.6–1.13.1–12.9–26.62.070.102.17
Ultisols1.9–7.1–13.90.0–0.0–0.01.9–7.1–13.91.200.001.20
Table 5. Midpoint soil organic carbon (SOC) storage by soil order and county for the state of Massachusetts (USA), based on the areas shown in Table 3 and the midpoint SOC contents shown in Table 4.
CountyTotal Storage
(kg) (%)
Degree of Weathering and Soil Development
Slight Strong
EntisolsInceptisolsHistosolsSpodosolsUltisols
Total SOC Storage (kg), (% of Total by County)
Barnstable 1.5 × 10¹⁰ (5)6.0 × 10⁸ (4)3.3 × 10⁹ (22)1.1 × 10¹⁰ (72)2.5 × 10⁸ (2)0 (0)
Berkshire 2.7 × 10¹⁰ (10)2.2 × 10⁹ (8)4.3 × 10⁹ (16)3.9 × 10⁹ (14)1.6 × 10¹⁰ (61)0 (0)
Bristol 2.2 × 10¹⁰ (8)2.8 × 10⁸ (1)8.7 × 10⁹ (40)1.3 × 10¹⁰ (58)1.4 × 10⁷ (0)0 (0)
Dukes 5.8 × 10⁹ (2)3.9 × 10⁹ (67)1.0 × 10⁹ (18)8.3 × 10⁸ (14)0 (0)2.3 × 10⁷ (0)
Essex 2.1 × 10¹⁰ (7)2.9 × 10⁹ (14)6.1 × 10⁹ (29)1.2 × 10¹⁰ (57)8.8 × 10⁷ (0)0 (0)
Franklin1.7 × 1010 (6)6.1 × 10⁸ (4)1.2 × 10¹⁰ (71)3.2 × 10⁹ (19)1.1 × 10⁹ (6)0 (0)
Hampden 1.9 × 10¹⁰ (7)4.0 × 10⁹ (21)6.7 × 10⁹ (35)6.6 × 10⁹ (35)1.6 × 10⁹ (8)8.7 × 10⁶ (0)
Hampshire 1.6 × 10¹⁰ (6)4.6 × 10⁸ (3)5.7 × 10⁹ (36)7.3 × 10⁹ (47)2.1 × 10⁹ (13)0 (0)
Middlesex 3.3 × 10¹⁰ (12)1.1 × 10⁹ (3)9.0 × 10⁹ (27)2.3 × 10¹⁰ (70)1.1 × 10⁵ (0)0 (0)
Nantucket 1.7 × 10⁹ (1)6.9 × 10⁸ (40)5.0 × 10⁷ (3)9.2 × 10⁸ (54)4.6 × 10⁷ (3)0 (0)
Norfolk 1.0 × 10¹⁰ (4)3.4 × 10⁹ (32)5.3 × 10⁹ (51)1.8 × 10⁹ (17)0 (0)0 (0)
Plymouth 3.9 × 10¹⁰ (14)3.5 × 10⁹ (9)7.2 × 10⁹ (18)2.6 × 10¹⁰ (67)2.1 × 10⁹ (5)0 (0)
Suffolk 5.1 × 10⁹ (2)4.2 × 10⁹ (82)3.9 × 10⁸ (8)5.2 × 10⁸ (10)0 (0)0 (0)
Worcester 5.0 × 10¹⁰ (18)1.0 × 10⁹ (2)2.1 × 10¹⁰ (41)2.0 × 10¹⁰ (40)8.3 × 10⁹ (17)0 (0)
Totals (%)2.8 × 10¹¹ (100%)2.9 × 10¹⁰ (10)9.1 × 10¹⁰ (32)1.3 × 10¹¹ (46)3.2 × 10¹⁰ (11)3.2 × 10⁷ (0)
Table 6. Monetary value of soil organic carbon (SOC) by soil order and county for the state of Massachusetts (USA), based on the areas shown in Table 3 and the area-normalized midpoint monetary values shown in Table 4.
CountyTotal SC-CO2
($)
Degree of Weathering and Soil Development
SlightStrong
EntisolsInceptisolsHistosolsSpodosolsUltisols
SC-CO2 ($ = USD)
Barnstable 2.5 × 1091.0 × 1085.6 × 1081.8 × 1094.3 × 1070
Berkshire 4.5 × 1093.7 × 1087.2 × 1086.5 × 1082.8 × 1090
Bristol 3.6 × 1094.8 × 1071.5 × 1092.1 × 1092.3 × 1060
Dukes 9.8 × 1086.6 × 1081.7 × 1081.4 × 10803.9 × 106
Essex 3.5 × 1094.9 × 1081.0 × 1092.0 × 1091.5 × 1070
Franklin2.9 × 1091.0 × 1082.1 × 1095.4 × 1081.9 × 1080
Hampden 3.2 × 1096.8 × 1081.1 × 1091.1 × 1092.7 × 1081.5 × 106
Hampshire 2.6 × 1097.8 × 1079.6 × 1081.2 × 1093.5 × 1080
Middlesex 5.6 × 1091.8 × 1081.5 × 1093.9 × 1091.8 × 1040
Nantucket 2.9 × 1081.2 × 1088.5 × 1061.6 × 1087.7 × 1060
Norfolk 1.8 × 1095.7 × 1088.9 × 1083.0 × 10800
Plymouth 6.5 × 1095.9 × 1081.2 × 1094.4 × 1093.5 × 1080
Suffolk 8.6 × 1087.1 × 1086.5 × 1078.8 × 10700
Worcester 8.4 × 1091.7 × 1083.5 × 1093.4 × 1091.4 × 1090
Totals4.7 × 10104.9 × 1091.5 × 10102.2 × 10105.4 × 1095.4 × 106
Table 7. Midpoint soil inorganic carbon (SIC) storage by soil order and county for the state of Massachusetts (USA), based on the areas shown in Table 3 and the midpoint SIC contents shown in Table 4.
CountyTotal Storage
(kg) (%)
Degree of Weathering and Soil Development
Slight Strong
EntisolsInceptisolsHistosolsSpodosolsUltisols
Total SIC Storage (kg), (% of Total by County)
Barnstable 2.5 × 10⁹ (3)3.6 × 10⁸ (15)1.9 × 10⁹ (77)1.8 × 10⁸ (7)1.2 × 10⁷ (1)0 (0)
Berkshire 4.6 × 10⁹ (6)1.3 × 10⁹ (28)2.5 × 10⁹ (53)6.6 × 10⁷ (1)8.0 × 10⁸ (17)0 (0)
Bristol 5.4 × 10⁹ (7)1.7 × 10⁸ (3)5.0 × 10⁹ (93)2.2 × 10⁸ (4)6.7 × 10⁵ (0)0 (0)
Dukes 2.9 × 10⁹ (4)2.3 × 10⁹ (79)5.9 × 10⁸ (20)1.4 × 10⁷ (0)0 (0)0 (0)
Essex 5.4 × 10⁹ (7)1.7 × 10⁹ (32)3.5 × 10⁹ (64)2.0 × 10⁸ (4)4.3 × 10⁶ (0)0 (0)
Franklin7.6 × 109 (10)3.6 × 10⁸ (5)7.1 × 10⁹ (94)5.5 × 10⁷ (1)5.4 × 10⁷ (1)0 (0)
Hampden 6.5 × 10⁹ (9)2.4 × 10⁹ (38)3.9 × 10⁹ (60)1.1 × 10⁸ (2)7.7 × 10⁷ (1)0 (0)
Hampshire 3.8 × 10⁹ (5)2.8 × 10⁸ (7)3.2 × 10⁹ (87)1.3 × 10⁸ (3)1.0 × 10⁸ (3)0 (0)
Middlesex 6.2 × 10⁹ (9)6.5 × 10⁸ (10)5.2 × 10⁹ (83)4.0 × 10⁸ (6)5.3 × 10³ (0)0 (0)
Nantucket 4.6 × 10⁸ (1)4.1 × 10⁸ (90)2.9 × 10⁷ (6)1.6 × 10⁷ (3)2.2 × 10⁶ (0)0 (0)
Norfolk 5.1 × 10⁹ (7)2.0 × 10⁹ (40)3.0 × 10⁹ (60)3.0 × 10⁷ (1)0 (0)0 (0)
Plymouth 6.7 × 10⁹ (9)2.1 × 10⁹ (31)4.1 × 10⁹ (61)4.5 × 10⁸ (7)1.0 × 10⁸ (2)0 (0)
Suffolk 2.8 × 10⁹ (4)2.5 × 10⁹ (92)2.2 × 10⁸ (8)8.9 × 10⁶ (0)0 (0)0 (0)
Worcester 1.3 × 10¹⁰ (18)6.0 × 10⁸ (5)1.2 × 10¹⁰ (90)3.5 × 10⁸ (3)4.0 × 10⁸ (3)0 (0)
Totals7.3 × 1010 (100%)1.7 × 10¹⁰ (24)5.2 × 10¹⁰ (71)2.2 × 10⁹ (3)1.6 × 10⁹ (2)0 (0)
Table 8. Monetary value of soil inorganic carbon (SIC) by soil order and county for the state of Massachusetts (USA), based on the areas shown in Table 3 and the area-normalized midpoint monetary values shown in Table 4.
CountyTotal SC-CO2
($)
Degree of Weathering and Soil Development
Slight Strong
EntisolsInceptisolsHistosolsSpodosolsUltisols
SC-CO2 ($ = USD)
Barnstable 4.2 × 1086.2 × 1073.2 × 1083.1 × 1072.1 × 1060
Berkshire 7.8 × 1082.2 × 1084.1 × 1081.1 × 1071.3 × 1080
Bristol 9.1 × 1082.9 × 1078.4 × 1083.7 × 1071.1 × 1050
Dukes 5.0 × 1084.0 × 1081.0 × 1082.4 × 10600
Essex 9.2 × 1083.0 × 1085.9 × 1083.4 × 1077.1 × 1050
Franklin1.3 × 1096.2 × 1071.2 × 1099.4 × 1069.1 × 1060
Hampden 1.1 × 1094.2 × 1086.5 × 1081.9 × 1071.3 × 1070
Hampshire 6.3 × 1084.8 × 1075.5 × 1082.2 × 1071.7 × 1070
Middlesex 1.0 × 1091.1 × 1088.7 × 1086.8 × 1078.8 × 1020
Nantucket 7.8 × 1077.0 × 1074.8 × 1062.7 × 1063.7 × 1050
Norfolk 8.6 × 1083.5 × 1085.1 × 1085.2 × 10600
Plymouth 1.1 × 1093.6 × 1086.9 × 1087.6 × 1071.7 × 1070
Suffolk 4.7 × 1084.3 × 1083.7 × 1071.5 × 10600
Worcester 2.2 × 1091.0 × 1082.0 × 1095.9 × 1076.7 × 1070
Totals1.2 × 10103.0 × 1098.8 × 1093.8 × 1082.6 × 1080
Table 9. Midpoint total soil carbon (TSC) storage by soil order and county for the state of Massachusetts (USA), based on the areas shown in Table 3 and the midpoint TSC contents shown in Table 4.
CountyTotal Storage
(kg) (%)
Degree of Weathering and Soil Development
Slight Strong
EntisolsInceptisolsHistosolsSpodosolsUltisols
Total TSC Storage (kg), (% of Total by County)
Barnstable 1.7 × 10¹⁰ (5)9.7 × 10⁸ (6)5.2 × 10⁹ (30)1.1 × 10¹⁰ (63)2.7 × 10⁸ (2)0 (0)
Berkshire 3.1 × 10¹⁰ (9)3.5 × 10⁹ (11)6.7 × 10⁹ (21)3.9 × 10⁹ (13)1.7 × 10¹⁰ (55)0 (0)
Bristol 2.7 × 10¹⁰ (8)4.5 × 10⁸ (2)1.4 × 10¹⁰ (51)1.3 × 10¹⁰ (48)1.4 × 10⁷ (0)0 (0)
Dukes 8.7 × 10⁹ (2)6.2 × 10⁹ (71)1.6 × 10⁹ (19)8.5 × 10⁸ (10)0 (0)2.3 × 10⁷ (0)
Essex 2.6 × 10¹⁰ (7)4.6 × 10⁹ (18)9.5 × 10⁹ (36)1.2 × 10¹⁰ (46)9.2 × 10⁷ (0)0 (0)
Franklin2.5 × 1010 (7)9.7 × 10⁸ (4)1.9 × 10¹⁰ (78)3.3 × 10⁹ (13)1.2 × 10⁹ (5)0 (0)
Hampden 2.5 × 10¹⁰ (7)6.5 × 10⁹ (25)1.1 × 10¹⁰ (42)6.8 × 10⁹ (27)1.7 × 10⁹ (6)8.7 × 10⁶ (0)
Hampshire 1.9 × 10¹⁰ (5)7.4 × 10⁸ (4)8.9 × 10⁹ (46)7.5 × 10⁹ (39)2.2 × 10⁹ (11)0 (0)
Middlesex 4.0 × 10¹⁰ (11)1.7 × 10⁹ (4)1.4 × 10¹⁰ (36)2.4 × 10¹⁰ (60)1.1 × 10⁵ (0)0 (0)
Nantucket 2.2 × 10⁹ (1)1.1 × 10⁹ (51)7.9 × 10⁷ (4)9.4 × 10⁸ (43)4.8 × 10⁷ (2)0 (0)
Norfolk 1.6 × 10¹⁰ (4)5.4 × 10⁹ (35)8.3 × 10⁹ (54)1.8 × 10⁹ (12)0 (0)0 (0)
Plymouth 4.6 × 10¹⁰ (13)5.6 × 10⁹ (12)1.1 × 10¹⁰ (25)2.7 × 10¹⁰ (58)2.2 × 10⁹ (5)0 (0)
Suffolk 7.9 × 10⁹ (2)6.7 × 10⁹ (86)6.1 × 10⁸ (8)5.3 × 10⁸ (7)0 (0)0 (0)
Worcester 6.3 × 10¹⁰ (18)1.6 × 10⁹ (3)3.2 × 10¹⁰ (51)2.1 × 10¹⁰ (32)8.7 × 10⁹ (14)0 (0)
Totals3.5 × 1011 (100%)4.6 × 10¹⁰ (13)1.4 × 10¹¹ (40)1.3 × 10¹¹ (37)3.3 × 10¹⁰ (9)3.2 × 10⁷ (0)
Table 10. Monetary value of total soil carbon (TSC) by soil order and county for the state of Massachusetts (USA), based on the areas shown in Table 3 and the area-normalized midpoint monetary values shown in Table 4.
CountyTotal SC-CO2
($)
Degree of Weathering and Soil Development
Slight Strong
EntisolsInceptisolsHistosolsSpodosolsUltisols
SC-CO2 ($ = USD)
Barnstable 2.9 × 1091.6 × 1088.8 × 1081.8 × 1094.5 × 1070
Berkshire 5.3 × 1095.9 × 1081.1 × 1096.6 × 1082.9 × 1090
Bristol 4.5 × 1097.6 × 1072.3 × 1092.2 × 1092.4 × 1060
Dukes 1.5 × 1091.1 × 1092.7 × 1081.4 × 10803.9 × 106
Essex 4.4 × 1097.8 × 1081.6 × 1092.0 × 1091.5 × 1070
Franklin4.2 × 1091.6 × 1083.3 × 1095.5 × 1082.0 × 1080
Hampden 4.3 × 1091.1 × 1091.8 × 1091.1 × 1092.8 × 1081.5 × 106
Hampshire 3.3 × 1091.3 × 1081.5 × 1091.3 × 1093.6 × 1080
Middlesex 6.7 × 1092.9 × 1082.4 × 1094.0 × 1091.9 × 1040
Nantucket 3.7 × 1081.9 × 1081.3 × 1071.6 × 1088.1 × 1060
Norfolk 2.6 × 1099.2 × 1081.4 × 1093.0 × 10800
Plymouth 7.7 × 1099.5 × 1081.9 × 1094.5 × 1093.7 × 1080
Suffolk 1.3 × 1091.1 × 1091.0 × 1088.9 × 10700
Worcester 1.1 × 10102.7 × 1085.5 × 1093.5 × 1091.5 × 1090
Totals6.0 × 10107.8 × 1092.4 × 10102.2 × 10105.6 × 1095.4 × 106
Table 11. Land use/land cover (LULC) change by soil order in Massachusetts (USA) from 2001 to 2016.
NLCD Land Cover Classes
(LULC)
2016 Total Area by LULC (km2) (Change in Area, 2001–2016, %)Degree of Weathering and Soil Development
SlightStrong
EntisolsInceptisolsHistosolsSpodosolsUltisols
2016 Area by Soil Order, km2 (Change in Area, 2001–2016, %)
Barren land113 (−6.88%)75.5 (−5.3%)28.0 (−10.7%)4.9 (−11.2%)4.6 (−2.4%)0.0 (7.7%)
Woody wetlands2044 (−0.45%)273.3 (−0.6%)1111.9 (−0.9%)429.0 (0.3%)229.3 (0.4%)0.1 (0.0%)
Shrub/Scrub132 (137.74%)35.2 (60.6%)77.2 (155.6%)1.3 (111.4%)17.6 (586.2%)0.3 (872.7%)
Mixed forest3937 (−0.88%)486.6 (−1.9%)2362.6 (−0.9%)88.4 (−0.6%)999.2 (−0.4%)0.4 (−1.3%)
Deciduous forest3769 (−6.72%)360.0 (−12.7%)2522.2 (−7.3%)57.8 (−5.9%)826.1 (−2.0%)3.1 (−10.1%)
Herbaceous237 (40.89%)75.9 (13.8%)137.6 (57.2%)4.8 (23.9%)18.1 (86.4%)0.1 (77.9%)
Evergreen forest1761 (−3.89%)506.2 (−5.2%)997.5 (−3.5%)43.9 (−3.6%)213.4 (−2.8%)0.1 (0.0%)
Emergent herbaceous wetlands292 (−2.87%)57.9 (−4.0%)54.4 (−3.6%)167.0 (−2.3%)12.4 (−2.5%)0.0 (0.0%)
Hay/Pasture626 (−8.21%)135.0 (−9.7%)417.9 (−7.9%)7.7 (−8.1%)65.5 (−6.8%)0.0 (−11.1%)
Cultivated crops227 (1.44%)85.9 (0.5%)78.7 (3.8%)33.1 (−0.3%)29.6 (0.1%)0.0 (0.0%)
Developed, open space1433 (5.86%)423.4 (3.6%)861.0 (7.2%)41.3 (10.2%)107.2 (2.4%)0.2 (6.0%)
Developed, medium intensity1094 (10.93%)436.2 (9.5%)619.7 (11.7%)16.7 (16.8%)21.2 (13.1%)0.0 (23.1%)
Developed, low intensity1413 (7.22%)527.0 (4.6%)810.3 (9.0%)27.5 (10.7%)48.5 (5.7%)0.1 (15.9%)
Developed, high intensity239 (16.46%)124.9 (13.4%)107.0 (19.8%)2.7 (28.4%)4.3 (21.4%)0.0 (0.0%)
Table 12. Distribution of soil carbon regulating ecosystem services in the state of Massachusetts (USA) by soil order (photos courtesy of USDA/NRCS (Soil Survey Staff n.d.b)). Values are taken/derived from Table 3, Table 6, Table 8, and Table 10.
Soil Regulating Ecosystem Services in the State of Massachusetts
Degree of Weathering and Soil Development
Slight
85%
Strong
15%
Entisols
21%
Inceptisols
59%
Histosols
5%
Spodosols
15%
Ultisols
0.03%
Laws 11 00027 i001 Laws 11 00027 i002 Laws 11 00027 i003 Laws 11 00027 i004 Laws 11 00027 i005
Social cost of soil organic carbon (SOC): $47.4B
$4.9B$15.3B$21.9B$5.4B$5.4M
10%32%46%11%0.01%
Social cost of soil inorganic carbon (SIC): $12.4B
$2.9B$8.7B$379.7M$259.7M$0.0
24%71%3%2%0%
Social cost of total soil carbon (TSC): $59.8B
$7.8B$24.0B$22.2B$5.6B$5.4M
13%40%37%9%0.009%
Sensitivity to climate change
LowLowHighLowLow
SOC and SIC sequestration (recarbonization) potential
LowLowLowLowLow
Note: Entisols, Inceptisols, Spodosols, and Ultisols are mineral soils. Histosols are mostly organic soils. M = million = 106; B = billion = 109.
Table 13. Increases in developed land and maximum potential for realized social costs of carbon due to complete loss of total soil carbon (TSC) of developed land by soil order in Massachusetts (USA) from 2001 to 2016. Values are derived from Table 4 and Table 11.
NLCD Land Cover Classes
(LULC)
Degree of Weathering and Soil Development
SlightStrong
EntisolsInceptisolsHistosolsSpodosolsUltisols
Area Change, km2 (SC-CO2, $ = USD)
Developed, open space14.86 ($32.25M)58.16 ($137.25M)3.81 ($91.64M)2.47 ($5.35M)0.01 ($16,199.99)
Developed, medium intensity37.85 ($82.12M)65.06 ($153.53M)2.41 ($57.96M)2.46 ($5.33M)0.01 ($9,719.99)
Developed, low intensity23.20 ($50.34M)66.67 ($157.34M)2.66 ($63.95M)2.63 ($5.70M)0.01 ($15,120.00)
Developed, high intensity14.76 ($32.03M)17.65 ($41.65M)0.60 ($14.53M)0.75 ($1.63M)0.00 (0.00)
Totals (316 km2, $932.69M)90.67 ($196.76M)207.54 ($489.78M)9.49 ($228.09M)8.30 ($18.01M)0.03 ($41,040.00)
Note: Entisols, Inceptisols, Spodosols, and Ultisols are mineral soils. Histosols are mostly organic soils. M = million = 106.
Table 14. Increases in land development (LULC: developed open space, developed medium intensity, developed low intensity, and developed high intensity) and maximum potential for realized social costs of C due to complete loss of total soil carbon of developed land by soil order and county in Massachusetts (USA) from 2001 to 2016.
CountyTotal Area Change (km2)
(SC-CO2, $ = USD)
Degree of Weathering and Soil Development
Slight Strong
EntisolsInceptisolsHistosolsSpodosolsUltisols
Developed Area Increase between 2001 and 2016 (km2) (SC-CO2, $ = USD)
Barnstable 11.94 ($28.8M)6.34 ($13.7M)5.48 ($12.9M)0.08 ($2.0M)0.05 ($99,602.8)0
Berkshire 4.46 ($12.3M)0.43 ($933,534.4)3.23 ($7.6M)0.09 ($2.2M)0.71 ($1.5M) 0
Bristol 46.32 ($128.1M)12.01 ($26.1M)33.32 ($78.6M)0.97 ($23.4M)0.02 ($43,009.4) 0
Dukes 0.55 ($1.3M)0.14 ($294,902.6)0.41 ($966,420.1)0 0 0
Essex 26.24 ($66.7M)5.40 ($11.7M)20.26 ($47.8M)0.27 ($6.5M)0.30 ($660,114.2)0
Franklin2.15 ($4.9M)0.78 ($1.7M)1.37 ($3.2M)0 0 0
Hampden 13.71 ($32.0M)6.74 ($14.6M)6.89 ($16.3M)0.05 ($1.1M)0 0.03 ($39,960.0)
Hampshire 4.61 ($10.4M)2.31 ($5.0M)2.28 ($5.4M)0 0.02 ($50,777.6) 0
Middlesex 60.05 ($236.4M)19.87 ($43.1M)35.64 ($84.1M)4.54 ($109.2M)0 0
Nantucket 0.13 ($266,148.2)0.10 ($210,924.1)0.02 ($55,224.1)000
Norfolk 36.17 ($87.7M)8.46 ($18.4M)27.53 ($65.0M)0.18 ($4.4M)00
Plymouth 53.03 ($159.0M)19.99 ($43.4M)26.91 ($63.5M)1.78 ($42.7M)4.35 ($9.44M)0
Suffolk 1.24 ($3.6M)0.26 ($558,991.6)0.95 ($2.2M)0.04 ($843,453.1)00
Worcester 57.58 ($167.9M)8.85 ($19.2M)44.31 ($104.6M)1.58 ($38.0M)2.84 ($6.2M)0
Totals318.18 ($939.5M)91.68 ($198.9M)208.57 ($492.3M)9.58 ($230.3M)8.29 ($180.1M)0.03 ($39,960.0)
Publisher’s Note: MDPI stays neutral with regard to jurisdictional claims in published maps and institutional affiliations.

