Article

Climate Change Planning: Soil Carbon Regulating Ecosystem Services and Land Cover Change Analysis to Inform Disclosures for the State of Rhode Island, USA

1
Department of Forestry and Environmental Conservation, Clemson University, Clemson, SC 29634, USA
2
University Key Lab for Geomatics Technology and Optimized Resources Utilization in Fujian Province, No. 15 Shangxiadian Road, Fuzhou 350002, China
3
University of Arkansas Agricultural Experiment Station, Arkansas Forest Resources Center, University of Arkansas at Monticello, Monticello, AR 71655, USA
4
Department of Environmental Engineering and Earth Sciences, Clemson University, Anderson, SC 29625, USA
5
Geography Department, Portland State University, Portland, OR 97202, USA
*
Author to whom correspondence should be addressed.
Laws 2021, 10(4), 92; https://doi.org/10.3390/laws10040092
Submission received: 12 October 2021 / Revised: 8 November 2021 / Accepted: 9 November 2021 / Published: 2 December 2021

Abstract

:
The state of Rhode Island (RI) has established its greenhouse gas (GHG) emissions reduction goals, which require rapidly acquired and updatable science-based data to make these goals enforceable and effective. The combination of remote sensing and soil information data can estimate the past and model future GHG emissions because of conversion of “low disturbance” land covers (e.g., evergreen forest, hay/pasture) to “high disturbance” land covers (e.g., low-, medium-, and high-intensity developed land). These modeled future emissions can be used as a predevelopment potential GHG emissions information disclosure. This study demonstrates the rapid assessment of the value of regulating ecosystems services (ES) from soil organic carbon (SOC), soil inorganic carbon (SIC), and total soil carbon (TSC) stocks, based on the concept of the avoided social cost of carbon dioxide (CO2) emissions for RI by soil order and county using remote sensing and information from the State Soil Geographic (STATSGO) and Soil Survey Geographic Database (SSURGO) databases. Classified land cover data for 2001 and 2016 were downloaded from the Multi-Resolution Land Characteristics Consortium (MRLC) website. Obtained results provide accurate and quantitative spatio-temporal information about likely GHG emissions and show their patterns which are often associated with existing urban developments. These remote sensing tools could be used by the state of RI to both understand the nature of land cover change and likely GHG emissions from soil and to institute mandatory or voluntary predevelopment assessments and potential GHG emissions disclosures as a part of a climate mitigation policy.

Climate change mitigation requires information that quantifiably links development to the amount of GHG emissions. Remote sensing analysis can be combined with soil information databases to track development over time and estimate likely GHG emissions. This provides important benchmark information about the impact of development on GHG emissions while also identifying potential hotpots for GHG emissions which may be associated with future development. Rhode Island’s goal of achieving net-zero GHG emissions by 2050 requires quantitative information to both evaluate soil-associated GHG emissions and to access the potential impact of future developments. Public information disclosures of past and/or future GHG emissions are one possible method to reduce future emissions. These disclosures could be associated with regulatory or reputational impacts that change development behavior to limit GHG emissions.

1. Climate Change Planning and Soil Information Gaps for the State of Rhode Island

The state of Rhode Island seeks to achieve net-zero GHG emissions by 2050 (The 2021 Act on Climate Bills n.d.) and manage its C emissions as part of the 2016 Rhode Island Greenhouse Gas Emissions Reduction Plan (Rhode Island Greenhouse Gas Emissions Reduction Plan 2016). These efforts are important contributions to the Paris Agreement (United Nations 2015) and the United Nations Sustainable Development Goals (SDGs) (Keestra et al. 2016), but are challenging to achieve given a relatively short time period and insufficient information available to enable implementation. Successful reduction in GHG emissions relies on rapid assessment of sources and sinks of these emissions from various sources, including soil under various land uses (Mikhailova et al. 2021b). The ecosystem services/disservices (ES/ED) framework is a useful valuation tool, which can be combined with remote sensing analysis to conduct an economic analysis of ES/ED and land use change (Liu 2014). Ecosystem services can be described as either provisioning (providing raw materials, such as food), regulating (benefiting humans through natural processes, such as C sequestration), or cultural (providing non-material human benefits, such as recreation) (Mikhailova et al. 2020). Provisioning ES have historically been given more weight when valuing a natural resource such as soil, but as global climate change has continued to alter Earth’s ecosystems, the regulating ES/ED related to soil C (e.g., C sequestration, etc.) have increasing importance (Mikhailova et al. 2019a, 2019b).
Rhode Island’s “2021 Act on Climate” bills (The 2021 Act on Climate Bills n.d.) outline various “responsibilities and oversights relating to assessing, integrating, and coordinating climate change efforts”, many of which involve soil resources within the state (e.g., food security, ecosystems, emission reductions, etc.). Pedodiversity of RI (soil type composition of the state) defines the soil regulating ES/ED potential with regards to its ability to store or release CO2, and vulnerability of soil resources to climate change (Table 1, Figure 1) (Mikhailova et al. 2021a; Wright and Sautter 1988). There are three soil orders in the state of RI, all of which belong to the category of slightly weathered soils but have different soil C storage and vulnerability to climate change. Entisols (13% of the total state area), found mostly along the coastlines and in the southern portion of RI, are “embryonic” soils with limited soil C storage capacity. Inceptisols (75% of the total state area) are also relatively “young” soils with low C content. Because of their large area extent in the state, RI selected Inceptisols as the State Soil (soil series name: Narragansett) for its high value in provisioning ES (e.g., silage, corn, hay, and vegetables) (Natural Resources Conservation Service n.d.). Histosols (12% of the total state area) are organic soils, which can become a hotspot of CO2 emissions upon disturbance (e.g., land cover change, etc.) (Mikhailova et al. 2021c). Subaqueous soils are also found in the state and provide many types of ES/ED (Bradley and Stolt 2003). The state of Rhode Island is one of the most densely populated states in the U.S., which significantly impacted the use of its soils and subsequent loss of soil C (so called “land-use legacy”).
This “land-use legacy” was used in quantifying a contemporary C balance for the Northeast Region of the U.S., including RI (Lu et al. 2013). Moreover, “legacy” effects of previous human activities resulted in the destruction of coastal wetlands by filling (EPA 2016b). This “land-use legacy” has important implications for soil C, food security, vulnerability of natural systems, and “redressing past environmental and public health inequities” as it is mandated in the Rhode Island’s “2021 Act on Climate” bills (The 2021 Act on Climate Bills n.d.).
Rhode Island’s “2021 Act on Climate” bills require that an updated plan to reduce greenhouse gasses be completed by 31 December 2022, which will likely include more stringent recommended actions to reduce emissions compared to the 2016 greenhouse gas reduction plan (Rhode Island Greenhouse Gas Emissions Reduction Plan 2016). Previous research on agricultural and forest-based ecosystem services for RI identified several challenges, including high proportion of private land ownership (90%), and difficulties in accessing tradeoffs when comparing the impact of policies on multiple ecosystem services (Liu et al. 2013). Reduction in GHG emissions requires accurate spatio-temporal information about emissions, which can be also used to develop soil-related GHG information disclosure policies. Information disclosure is a tool frequently used in emissions reduction strategy commonly applied to toxic emissions (Cohen and Viscusi 2012). Information disclosure has been proven to be effective in reducing pollution, politically more practical than new regulations (or legislation) (Cohen and Viscusi 2012), and more cost-effective to the government compared to designing and application of new regulations (Cohen 2001). Information disclosures can be voluntary or mandatory with or without government involvement (Cohen and Viscusi 2012). Additionally, there are private information disclosure programs, which can rate organizations based on various types of disclosures and provide a third-party assessment (Cohen and Viscusi 2012). There are various types of disclosure information (e.g., at the facility or firm level, product labels) (Cohen and Viscusi 2012).
The United States Environmental Protection Agency (U.S. EPA) adapted information disclosure to report GHG emissions (EPA n.d.). EPA’s Greenhouse Gas Reporting Program (GHGRP) requires reporting of GHG emissions from large GHG sources covering 41 categories (e.g., lime manufacturing, cement production, etc.), which can be displayed as an interactive website, data highlights, and downloadable data files (EPA n.d.). According to EPA, “these data can be used by businesses and others to track and compare facilities’ greenhouse gas emissions, identify opportunities to cut pollution, minimize wasted energy, and save money. States, cities, and other communities can use EPA’s greenhouse gas data to find high-emitting facilities in their area, compare emissions between similar facilities, and develop common-sense climate policies” (EPA n.d.).
The hypothesis of this study is that the spatial and temporal analysis of RI’s pedodiversity integrated with land cover change analysis will provide actionable information to help develop the new greenhouse gas emission’s reduction plan by 31 December 2022. Our study will use the current plan, formulated in 2016 (Rhode Island Greenhouse Gas Emissions Reduction Plan 2016), to show how soil and land cover analysis can be used to identify and update emission sources (e.g., hotspot of CO2 emissions associated with land cover change), and to evaluate how land cover change has and can impact greenhouse gas emissions, which could be used to develop various GHG information disclosure policies to enhance the state’s climate change planning efforts.
The specific objective of this study was to assess the value of SOC, SIC, and TSC in the state of RI (USA) and its change in the past 15 years based on the social cost of C (SC–CO2) and avoided emissions provided by C sequestration, which the U.S. Environmental Protection Agency (EPA) has determined to be $46 per metric ton of CO2, applicable for the year 2025 based on 2007 U.S. dollars and an average discount rate of 3% (EPA 2016a). Our calculations provide estimates for the monetary values of SOC, SIC, and TSC across the state and by different spatial aggregation levels (i.e., county) using the State Soil Geographic (STATSGO) and Soil Survey Geographic Database (SSURGO) databases and information previously reported by Guo et al. (Guo et al. 2006). Classified land cover data for 2001 and 2016 were downloaded from the Multi-Resolution Land Characteristics Consortium (MRLC) website (MRLC n.d.).

2. Accounting for Soil Regulating Ecosystem Services in the State of Rhode Island

This study used both biophysical (science-based, Figure 1) and administrative (boundary-based, Figure 1) accounts to calculate monetary values for SOC, SIC, and TSC (Table 2 and Table 3). Although, this framework was used primarily in accounting for soil regulating ES, it could be adapted for GHG emissions information disclosures associated with the past, current, and future emissions. The table was enhanced by the addition of the “time” column, which can be used to categorize the types of GHG information disclosures (e.g., past, current, and future) (Table 2).
The present study estimates monetary values associated with stocks of SOC, SIC, and TSC in RI based on reported contents (in kg m−2) from Guo et al. (2006). Values were calculated using the avoided social cost of C (SC-CO2) of $46 per metric ton of CO2, applicable for 2025 based on 2007 U.S. dollars and an average discount rate of 3% (EPA 2016a). According to the EPA, the SC-CO2 is intended to be a comprehensive estimate of climate change damages. Still, it can underestimate the true damages and cost of CO2 emissions due to the exclusion of various important climate change impacts recognized in the literature (EPA 2016a). Area-normalized monetary values ($ m−2) were calculated using Equation (1), and total monetary values were summed over the appropriate area(s) (noting that a metric ton is equivalent to 1 megagram (Mg) or 1000~kilograms (kg), and SC = soil carbon):
$ m 2 = ( SOC / SIC / TSC   Content , kg m 2 ) × 1   Mg 10 3   kg × 44   Mg   CO 2 12   Mg   SC × $ 46 Mg   CO 2  
Table 4 presents area-normalized contents (kg m−2) and monetary values ($ m−2) of soil C, which were used to estimate stocks of SOC, SIC, and TSC and their corresponding values by multiplying the contents/values by the area of a particular soil order within a county (Table 3). For example, for the soil order Inceptisols, Guo et al. (2006) reported a midpoint SOC content of 8.9 kg m−2 for the upper 2-m soil depth (Table 4). Using this SOC content in equation (1) results in an area-normalized SOC value of $1.50 m−2. Multiplying the SOC content and its corresponding area-normalized value each by the total area of Inceptisols present in RI (1979 km2, Table 3) results in an SOC stock of 1.76 × 10¹⁰ kg (Table 5) with an estimated monetary value of $2.97B (Table 6).
Land use/land cover change in RI between 2001 and 2016 was analyzed using classified land cover data from the Multi-Resolution Land Characteristics Consortium (MRLC) (MRLC n.d.). Changes in land cover, with their associated soil types, were calculated in ArcMap 10.7 (ESRI n.d.) by comparing the 2001 and 2016 data, converting the land cover to vector format, and unioning the data with the soils layer in the Soil Survey Geographic (SSURGO) Database (Soil Survey Staff 2021a).

3. Soil Carbon Regulating Ecosystem Services and Land Cover Change in the State of Rhode Island

Based on avoided SC–CO2, the total estimated monetary mid-point value for TSC in the state of RI was $13.4B (i.e., 13.4 billion U.S. dollars, where B = billion = 109), $11.3B for SOC (84% of the total value), and $2.1B for SIC (16% of the total value). Previously, we have reported that among the 48 conterminous states of the U.S., RI ranked 48th for TSC (Mikhailova et al. 2019a), 48th for SOC (Mikhailova et al. 2019b), and 46th for SIC (Groshans et al. 2019).

3.1. Storage and Value of SOC by Soil Order and County for Rhode Island

Soil orders with the highest midpoint monetary value for SOC were Histosols ($7.91B), and Inceptisols ($2.97B) (Table 5 and Table 6). The counties with the highest midpoint SOC values were Providence ($4.85B), Washington ($3.80B), and Kent ($1.82B) (Table 5 and Table 6). Providence has the largest area occupied by Histosols (Table 3), which has a high SOC midpoint content (140.1 kg m−2; Table 4) and therefore a corresponding high monetary value of $4.85B (Table 6).

3.2. Storage and Value of SIC by Soil Order and County for the State of Rhode Island

Soil orders with the highest midpoint monetary value for SIC were: Inceptisols ($1.70B), and Entisols ($276M, where M = million = 106) (Table 7 and Table 8). The counties with the highest midpoint SIC values were Providence ($838M), Washington ($667M), and Kent ($349M) (Table 7 and Table 8). Like SOC data, SIC is typically extrapolated with soil depth and can be overestimated by soil survey data (Groshans et al. 2019).

3.3. Storage and Value of TSC (SOC + SIC) by Soil Order and County for Rhode Island

Soil orders with the highest midpoint monetary value for TSC were Histosols ($8.05B), and Inceptisols ($4.67B) (Table 9 and Table 10). Histosols contributed 60% to the total social cost of total soil carbon. The counties with the highest midpoint TSC values were Providence ($5.69B), Washington ($4.47B), and Kent ($2.17B) (Table 9 and Table 10). These rankings are the same as for SOC and reflect the dominant contribution of SOC to TSC in the State. Histosols contributed the largest proportion of the potential total social costs in almost all counties except for Newport County. Providence County had the largest proportion of the potential total social costs in the state with Histosols as a major potential hotspot.
It should be noted that Histosols only comprise 14% of the total land area for Providence County (Table 3), despite having such a large potential contribution to the social cost of carbon. Inceptisols made the second largest contribution to the potential total social costs in all counties with a total TSC storage percentage within each county ranging from 32% to 39% across the counties. The potential total social costs associated with Inceptisols were greatest in Providence ($2.01B) and Washington ($1.43B) counties. In contrast, Entisols had a limited contribution in total TSC storage percentage within each county which ranged from 2% to 24% across the counties.

3.4. Land Use/Land Cover Change by Soil Order in Rhode Island from 2001 to 2016

Rhode Island experienced changes in land use/land cover (LULC) over the 15-year period from 2001 to 2016 (Table 11, Figure 2). Changes varied by soil order and original LULC classification, with most soil orders experiencing area losses in “low disturbance” LULC classes (e.g., evergreen forest, hay/pasture) while gaining in the areas of “developed” LULC classes. The most dramatic increases in developed land areas occurred in Providence, Kent, and Washington counties, which are all in the eastern part of the state and geographically closest to the urban center of Providence, the state capital of RI. More detailed spatial and temporal analyses of land cover can identify critical locations of soil C regulating ecosystem services at risk. This information can be used to meet various objectives aimed at greenhouse gas emissions reductions outlined by the “2021 Act on Climate” bills (The 2021 Act on Climate Bills n.d.), including: “inclusion in procedures and public metrics for periodic measurement, not less frequently than once every five (5) years, of progress necessary to meet these targets and for evaluating the possibility of meeting higher targets through cost-effective measures.” Remote sensing analysis allows rapid assessment on a yearly basis if needed.

4. Significance of Results for Rhode Island’s Climate Change Planning

Rhode Island’s “2021 Act on Climate” bills require that an updated plan to reduce GHG be completed by 31 December 2022, which will likely include more stringent recommended actions to reduce emissions compared to the 2016 greenhouse gas reduction plan (Rhode Island Greenhouse Gas Emissions Reduction Plan 2016). Our study used the current plan, formulated in 2016 (Rhode Island Greenhouse Gas Emissions Reduction Plan 2016), to show how soil and land cover analysis can be utilized to identify and update emission sources (e.g., hotspot of CO2 emissions associated with land cover change) and to evaluate how land cover change has and can impact GHG emissions. This study provides important information for some of these strategies in the following ways:
2016 Greenhouse Gas Emissions Reduction Plan
GHG Sources and Projections: Current GHG profile
Currently, only land/land use is included in the RI’s GHG profile in “other” category (3% of the total GHG emissions) (Rhode Island Greenhouse Gas Emissions Reduction Plan 2016). Pedodiversity concepts (Table 12) can be used to refine this category by showing soil C storage, its value, and potential GHG emissions hotspots. Pedodiversity of RI (“portfolio-effect”) is defined by three soil orders (Entisols, Inceptisols, and Histosols) with Histosols being a hotspot of SOC storage valued at $7.91B (70% of total SC-CO2 associated with SOC). Soil inorganic carbon is mostly found in the soil order of Inceptisols (80% of the total SC-CO2 associated with SIC). Pedodiversity can be quantified and valued at various administrative levels (e.g., state, county, property, etc.) to develop cost-effective GHG reduction strategies.
Monetary values of soil C can be interpreted using the concepts of “avoided” and “realized” social costs, where “avoided” social cost refers to the benefits of sequestered soil C, and “realized” soil cost refers to damages resulting from CO2 emissions. “Realized” social cost is the maximum potential cost that would occur if all stocks of sequestered soil C were released to the atmosphere as CO2. These costs vary within the state and at the county level. Information in Table 12 can be also used to determine possible GHG mitigation pathways in RI’s soils, which is somewhat limited because of “portfolio-effect.” Entisols and Inceptisols are relatively young soils with limited recarbonization potential. Histosols are often protected soils because of their high soil C content and association with wetland environments.
Mikhailova et al. (2021b) proposed a methodology for identifying “realized” social costs of C because of soil disturbance (e.g., conversion from forest to development), which can be analyzed using remote sensing (land cover change). This type of analysis was performed for the state of RI and can be used not only to identify the active sources of greenhouse gas emissions but also use it to model future projections of GHG emissions because of land cover change. Results reported in Table 13 and Table 14 show that all soil orders within the state of RI experienced increases in developed land with corresponding realized social costs of C with soil orders of Inceptisols and Histosols having the highest realized social costs. Providence County had the highest increases in developed areas and corresponding realized social costs (53% from state total) and most likely associated with developments near existing urban areas (Figure 3).
It should be noted that the largest contribution to the “realized” social cost of C for Providence County was from the soil order of Histosols ($42.9M) which only occupy 14% of the total land area in the county (Table 3). Histosols are commonly associated with wetland areas which can be protected from development at the state and federal levels. Wetland areas provide additional ecosystem benefits beyond the soil carbon storage, which can include providing unique habitats for a range of plant and animal species.
Policy and Implementation: Land Use Conservation
Description of Mitigation Option: “Land use conservation strategies preserve natural systems and environments that provide carbon dioxide “sinks”, helping to reduce the state’s net GHG footprint. Strategies include protecting existing forest acreage, reforestation, conservation of riparian buffers, enhanced forest management programs (on both private and public lands), reductions in soil erosion to minimize losses in soil C storage, coastal wetland protection (e.g., blue C), and enhanced urban tree canopies (Rhode Island Greenhouse Gas Emissions Reduction Plan 2016).” Strategies include:
-
Protecting existing forest acreage: Table 11 of our study provides total area measurements of land covers in RI including mixed forest, deciduous forest, and evergreen forest. Between 2001 and 2016, total area of mixed forest decreased by 0.23%, total area of deciduous forest decreased by 4.98%, and total area of evergreen forest decreased by 1.30%. For each land cover, our data shows the types of soil found and the change between the years 2001 and 2016. For example, in mixed forests, area (soil order Entisols) decreased by 0.65%.
-
Reforestation: The data in Table 11 of our study also provides spatial analysis of RI’s land cover types and the changes that have occurred between 2001 and 2016. This analysis helps identify the regions of the state where reforestation efforts may be most needed. Total area of mixed, deciduous, and evergreen forests decreased between 2001 and 2016 by 0.23%, 4.98%, and 1.30% respectively. These changes indicate that deciduous forests have been most impacted by development and suggest that this forest type can be one of the focuses of reforestation efforts.
-
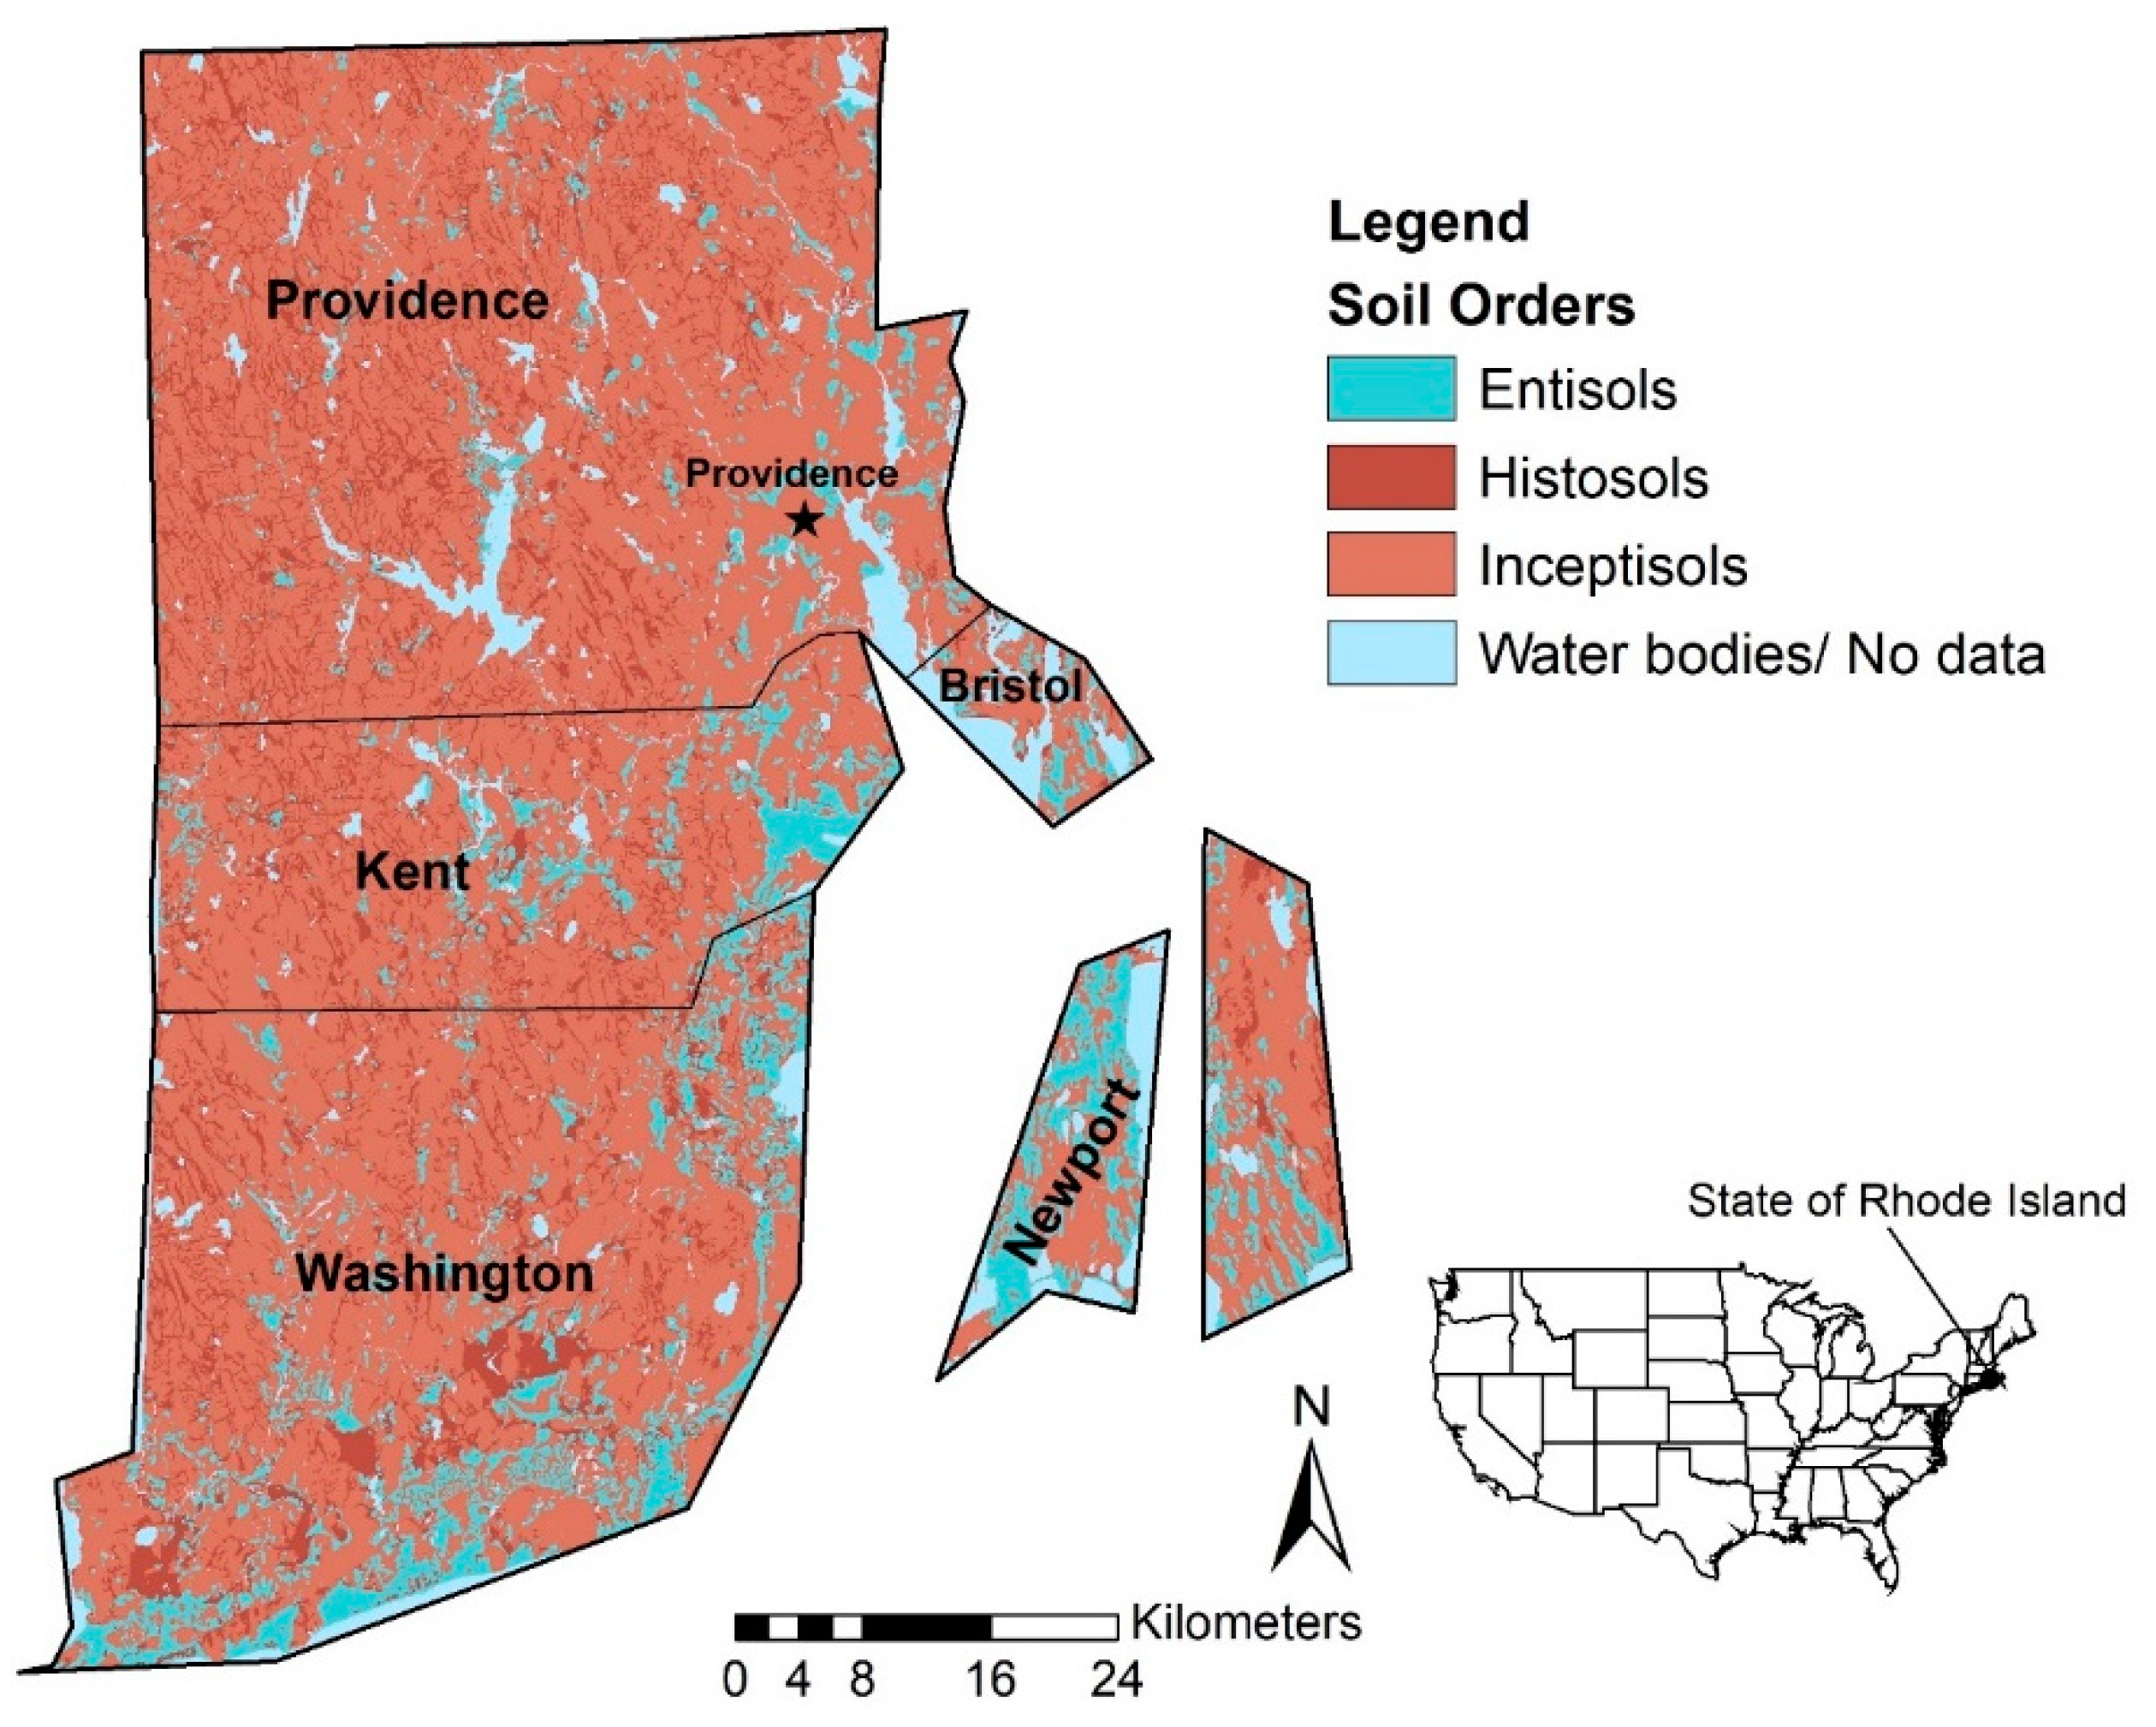
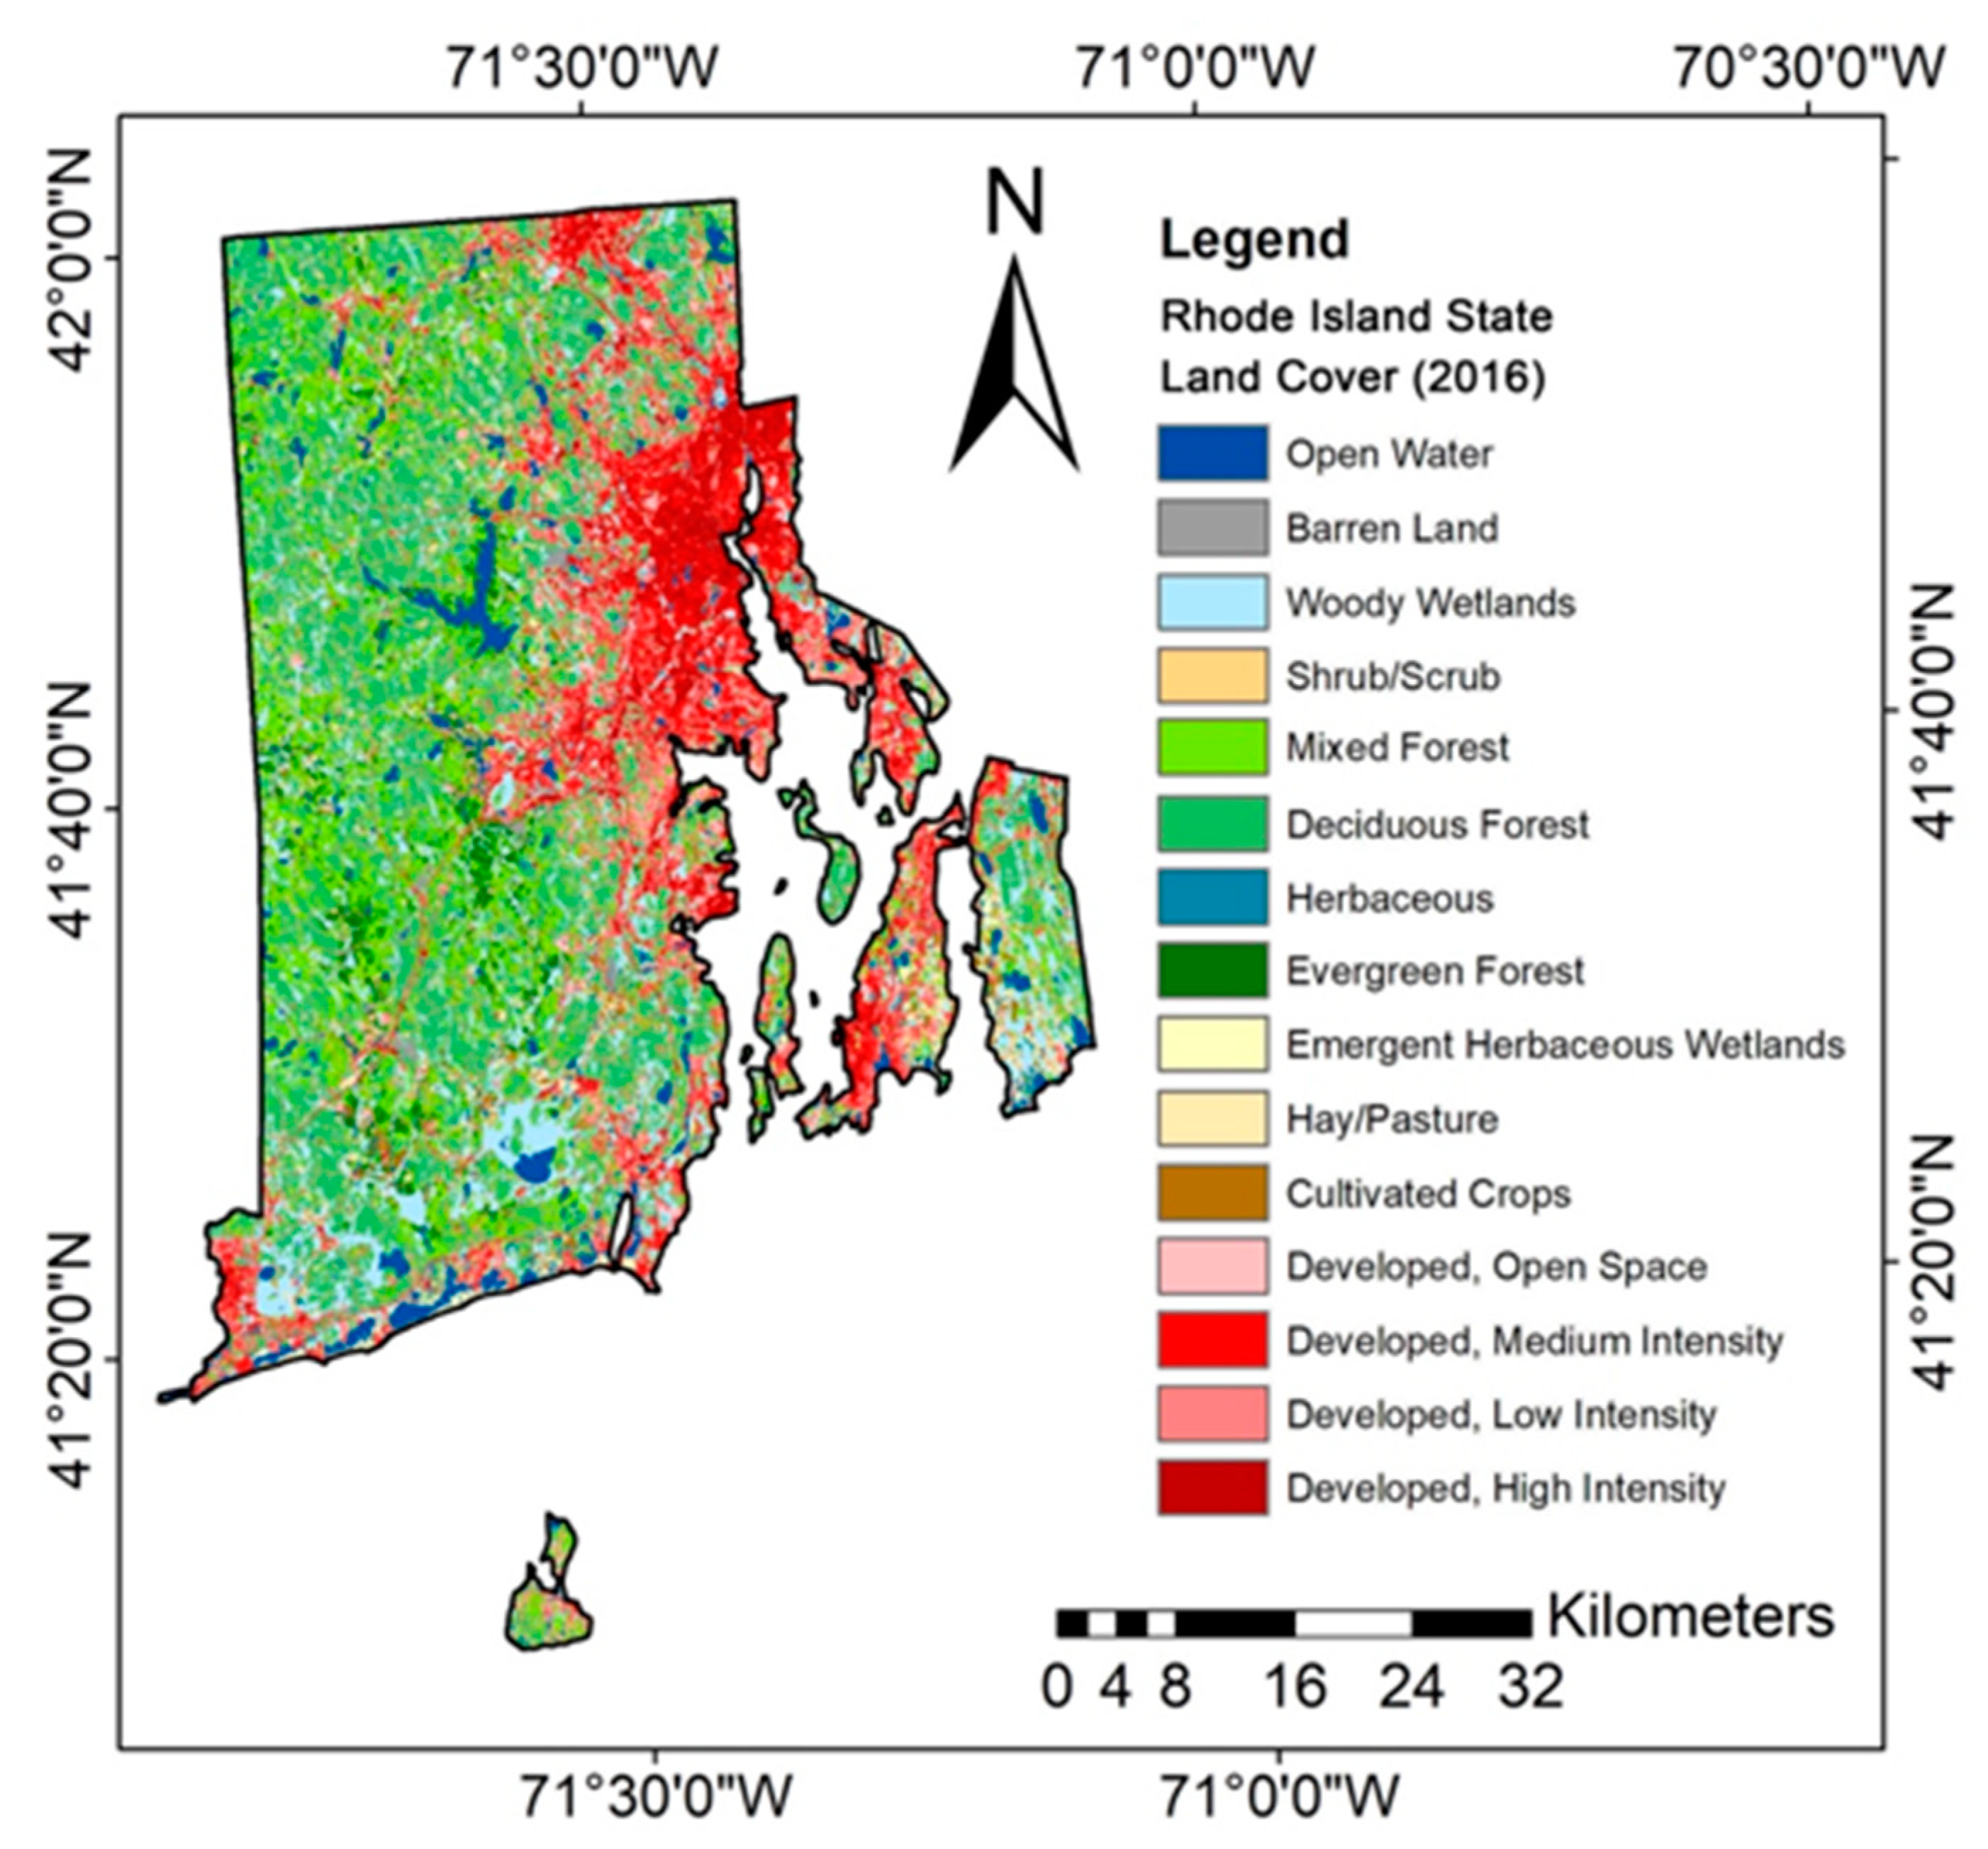
Conservation of riparian buffers: The spatial analysis provided in our study’s land cover maps shows land cover around bodies of water where riparian buffer zones are found. Mixed forest is a dominating land cover type surrounding open water in RI. Woody wetlands are also found in many of the buffer zones around water bodies (Figure 2). Additionally, the soil map of RI shows the soil types found in the riparian buffer zones. Inceptisols are the dominant soil order of RI, though, in the more southern regions of the state, Histosols can be found near some water bodies (Figure 1). Our study shows that Histosols have the greatest total SOC storage (Table 9) as well as the greatest sensitivity to climate change and social cost of SOC (Table 12). This analysis indicates a need for greater conservation of riparian buffers where these Histosols are found. Mixed forests and, to an even greater extent, woody wetlands are the most important target areas for riparian buffer conservation. With this information, the state can identify the buffers around wetlands with the most potential for C release and seek to concentrate protection efforts in those regions.
-
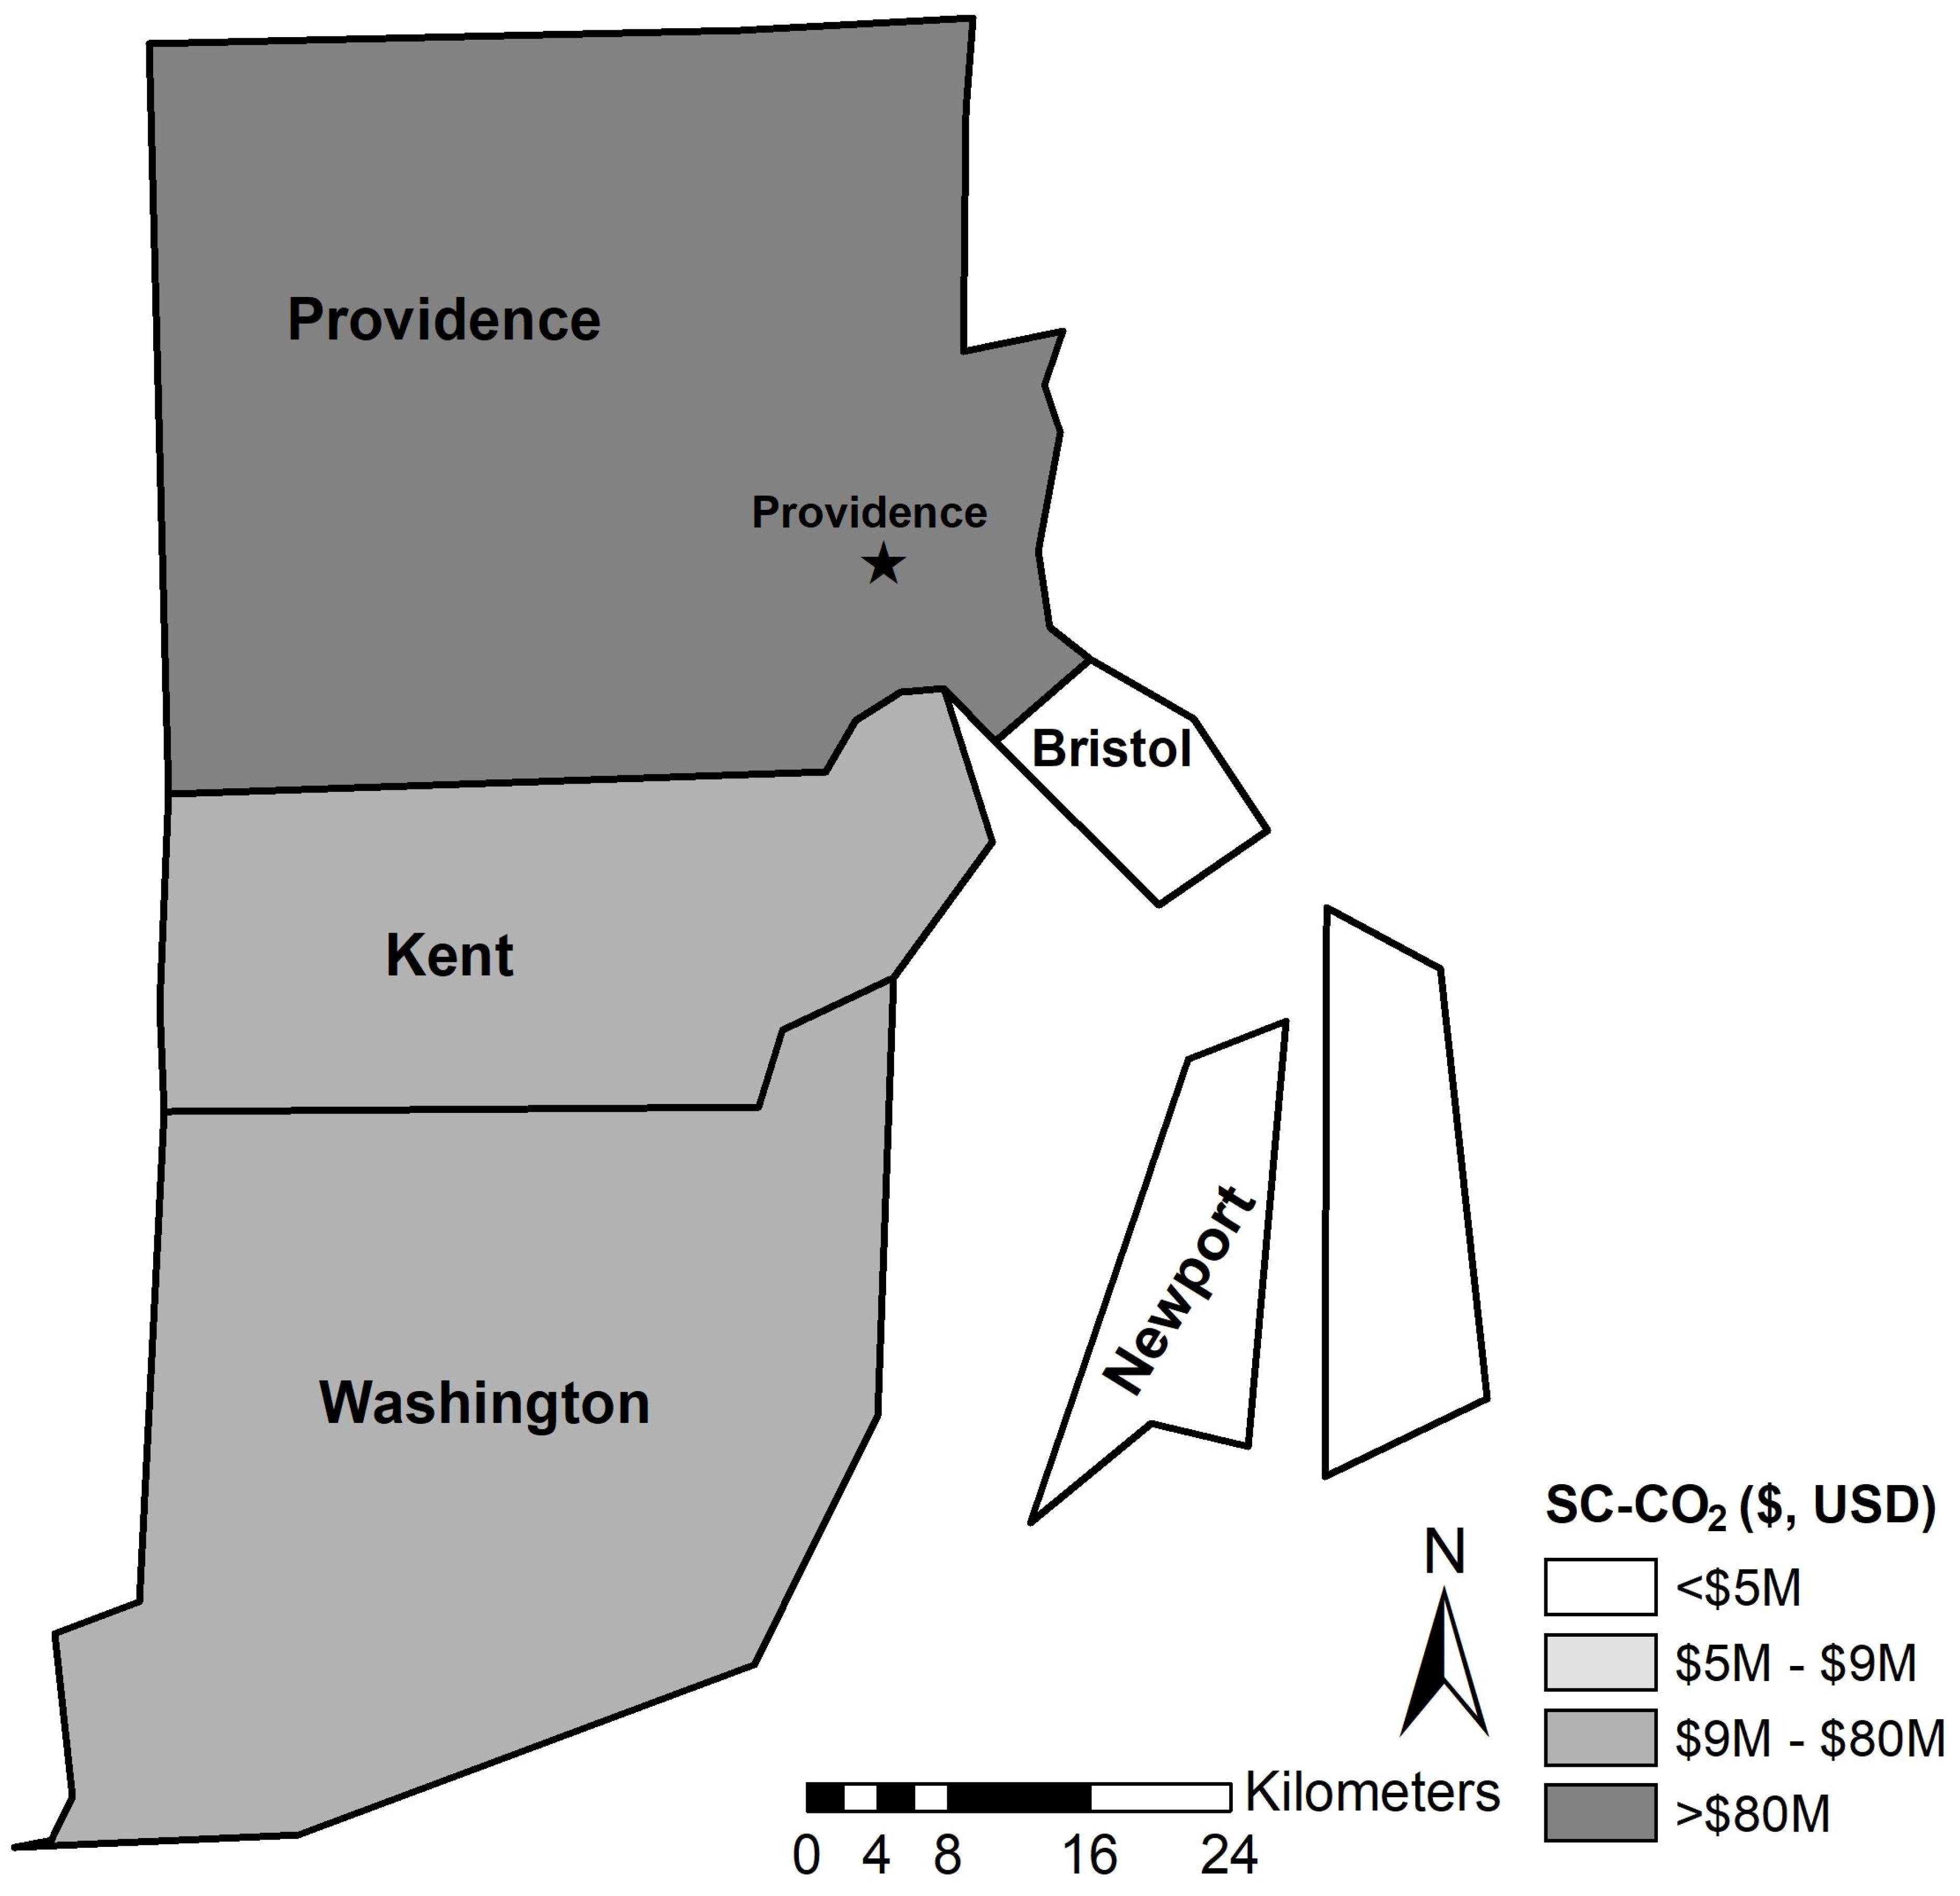
Enhanced forest management programs (on both private and public lands): Spatial information indicates the regions of the state covered in various forest types. Land cover changes of RI show that between 2001 and 2016 the state has seen an increase in high, medium, and low intensity development, and a decrease in mixed and deciduous forests as development continues to spread. Table 11 of our study quantifies these changes and indicates that high intensity development has increased by 6.60%, medium intensity development has increased by 4.41%, and low intensity development has increased by 4.34%. Greatest of all is the increase in developed open space: from 2001 to 2016 there has been a 7.51% increase in this “land cover”. Using this data, RI’s policymakers may be better able to identify areas (e.g., areas surrounding the city of Providence, etc.) that require particular attention.
-
Reductions in soil erosion to minimize losses in soil C storage: Table 5 of our study shows the total SOC storage of Entisols, Inceptisols, and Histosols across the five counties of RI. In all five counties, Histosols had the greatest SOC storage, adding up to 70% of the state’s SOC storage in total. Table 11 of our study indicates that between 2001 and 2016, Histosols total area decreased as development increased. Using our study’s data, areas with the greatest amount of at-risk C storage can be most stringently protected. In this case, Providence and Washington counties are shown to contain the greatest total area of Histosols, and therefore should be considered the most important areas to reduce soil erosion caused by development (Table 3).
-
Coastal wetland protection: Our study found that Histosols are often found in wetland areas of RI, and “are carbon-rich sources of greenhouse gas emissions”. This means that protecting these soils should be a priority when the state is planning overall wetland protection measures. Table 11 of our study indicates that woody wetlands decreased by 0.38% and emergent herbaceous wetlands decreased by 6.65% between 2001 and 2016. In these areas, Histosols area decreased by 0.57% and 6.06%, respectively. These findings, along with an understanding that Histosols contain the greatest C storage and therefore pose the greatest threat in terms of C emissions, will help policymakers protect them from developments.
Mitigation Policy Considerations: “Scenario modeling results indicate that achieving the Resilient Rhode Island GHG targets could likely require no net future loss of forest or cropland. Policymakers could aim to align future local and state conservation policies with this broader goal, and adoption of a “no net-loss of forests” policy, which other states in the region have endorsed, could be explored.”
-
Table 11 of our study indicates losses of mixed forest (−0.23%), deciduous forest (−4.98%), evergreen forest (−1.30%), and hay/pasture land cover (−8.46%) between 2001 and 2016. This shows that the goal of a “no net-loss of forests” policy was, between those years, unsuccessful. Cultivated cropland in the state increased by 23.72% during that time, indicating that that goal was achieved.
-
Our study identifies Histosols as the soil order most sensitive to climate change and therefore the greatest emissions threat (Table 12). This data suggests that RI should allocate the greatest protective measures to areas rich in Histosols when pursuing the climate change mitigation, and that the state should anticipate the greatest emissions in those regions as the climate warms up.
-
Our study contributes to the mitigation effort and quantifies the expected damages as CO2 is released from soil (Table 2). It also helps with resilience as cities in RI can begin budgeting for the cost of these damages. With these calculations, the state can carefully analyze which land covers and soil regions should receive the most stringent protections from development.
-
Table 11 in this study quantifies the degree of weathering and soil development across different land covers, including forests. In mixed, deciduous, and evergreen forests, areas of soil orders of Entisols and Inceptisols were decreased between 2001 and 2016. Area of Histosols was also decreased except for a 0.02% increase in Histosols in mixed forests during that time. Knowing this data will be critical to accurately determining the impact of forest loss in RI. This contributes to the goal of avoiding C loss in forests.

5. Conclusions

This study demonstrated the application of spatial analysis tools to generate the data necessary to quantify soil C stocks, their value, and dynamics at the state level to be used in conjunction with RI’s GHG emissions reduction plan. The total estimated monetary mid-point value for TSC stocks in the state of RI was $13.4B (i.e., 13.4 billion U.S. dollars (USD), where B = billion = 109), $11.3B for SOC stocks, and $2.1B for SIC stocks. Soil orders with the highest midpoint value for SOC were Histosols ($7.9B), and Inceptisols ($2.9B). Soil orders with the highest midpoint value for SIC were Inceptisols ($1.7B), and Entisols ($276M, where M = million = 109). Soil orders with the highest midpoint value for TSC were Histosols ($8.1B), and Inceptisols ($4.7B). The counties with the highest midpoint SOC values were Providence ($4.85B), Washington ($3.80B), and Kent ($1.82B). The counties with the highest midpoint SIC values were Providence ($838M), Washington ($667M), and Kent ($349M). The counties with the highest midpoint TSC values were Providence ($5.69B), Washington ($4.47B), and Kent ($2.17B). Rhode Island has experienced land use/land cover (LULC) changes between 2001 and 2016 with most maximum potential “realized” social cost of carbon (C) of $157M with soil orders of Inceptisols ($75.3M) and Histosols ($68.0M) contributing the largest share of the total realized value. The counties that have exhibited the most development (e.g., Providence, Kent, and Washington) are those nearest the urban center of Providence, RI. Most soil orders have experienced losses in “low disturbance” land covers (e.g., evergreen forest, hay/pasture) and gains in “high disturbance” land covers (e.g., low-, medium-, and high-intensity developed land). Histosols are a high-risk C “hotspot” that contributes over 70% of the total estimated sequestration of SOC in RI while covering only 12% of the total land area. Spatial analysis offers a rapid temporal assessment of soil C regulating ES/ED using pedodiversity and land cover concepts, which can be used to design soil- and land-cover specific, cost-efficient policies to manage soil C regulating ES/ED in the state of RI at various administrative levels. Although this study was focused on identifying past realized social cost of C, these techniques can also be used to generate an information disclosure of potential GHG releases (including associated social costs) for proposed developments.
Analysis of past development impact may inform locations where future development may occur. Similar land cover analysis based on satellite remote sensing and soil information databases could be used to develop information disclosures of potential GHG emissions. This information disclosure before a development could be used in either a voluntary or required process to estimate the social cost of carbon before initiating a development. This disclosure could in some cases stop a proposed development or cause a statutory cost for proceeding with a development. If voluntary, this disclosure could benefit a developer, because in the cases of development with little social cost of carbon, a project could be “labeled” as low carbon impact which could be used as part of a sustainable branding initiative since the benefit of carbon disclosures is worldwide and not just local (Cohen and Viscusi 2012). There are many possible benefits to developers who provide voluntary disclosures (e.g., reputational, advantage in the marketplace, greater potential for public partnerships). As climate change awareness and impact increase, the marketplace may favor companies that document their efforts to minimize GHG emissions through information disclosures. This study suggests methods that would enable developers to compare different potential development or redevelopment projects to minimize GHG emissions which they may disclose to provide a competitive advantage. While this study has focused on land cover and soils analysis, it may be possible to enhance these methods by incorporating other factors (e.g., climate, land management intensity, etc.) (Duro et al. 2014).

Author Contributions

Conceptualization, E.A.M.; methodology, E.A.M., M.A.S. and H.A.Z.; formal analysis, E.A.M.; writing—original draft preparation, E.A.M. and P.I.M.; writing—review and editing, E.A.M., C.J.P., G.C.P. and M.A.S.; visualization, H.A.Z., L.L. and Z.H. All authors have read and agreed to the published version of the manuscript.

Funding

The publishing of this article was partially supported by the Clemson University Libraries Open Access Publishing Fund and the Clemson Department of Forestry and Environmental Conservation.

Institutional Review Board Statement

Not applicable.

Informed Consent Statement

Not applicable.

Data Availability Statement

Not applicable.

Acknowledgments

We would like to thank the reviewers for their constructive comments and suggestions.

Conflicts of Interest

The authors declare no conflict of interest.

Abbreviations

EDEcosystem disservices
ESEcosystem services
EPAEnvironmental Protection Agency
SC-CO2Social cost of carbon emissions
SDGsSustainable Development Goals
SOCSoil organic carbon
SICSoil inorganic carbon
SOMSoil organic matter
SSURGOSoil Survey Geographic Database
TSCTotal soil carbon
USDAUnited States Department of Agriculture
U.S.A.United States of America

References

  1. Bradley, Michael P., and Mark H. Stolt. 2003. Subaqueous soil-landscape relationships in a Rhode Island estuary. Soil Science Society of America Journal 67: 1487–95. [Google Scholar] [CrossRef] [Green Version]
  2. Cohen, Mark A. 2001. Information as a policy instrument in protecting the environment: What have we learned? Environmental Law Reporter 31: 10425–31. [Google Scholar]
  3. Cohen, Mark A., and W. Kip Viscusi. 2012. The role of information disclosure in climate mitigation policy. Climate Change Economics 3: 1250020. [Google Scholar] [CrossRef]
  4. Duro, A., V. Piccione, M. A. Ragusa, and V. Veneziano. 2014. New enviromentally sensitive patch index-ESPI-for MEDALUS protocol. In AIP Conference Proceedings. University Park: American Institute of Physics, vol. 1637, pp. 305–12. [Google Scholar]
  5. EPA—United States Environmental Protection Agency. 2016a. The Social Cost of Carbon. EPA Fact Sheet. Available online: https://19january2017snapshot.epa.gov/climatechange/ social-cost-carbon_.html (accessed on 15 September 2021).
  6. EPA—United States Environmental Protection Agency. 2016b. What Climate Change Means for Rhode Island. Available online: https://19january2017snapshot.epa.gov/sites/production/files/2016-12/documents/social_cost_of_carbon_fact_sheet.pdf (accessed on 7 October 2021).
  7. EPA—United States Environmental Protection Agency. n.d. Greenhouse Gas Reporting Program (GHGRP). Available online: https://www.epa.gov/ghgreporting/learn-about-greenhouse-gas-reporting-program-ghgrp (accessed on 2 November 2021).
  8. ESRI—Environmental Systems Research Institute. n.d. ArcMap 10.7. Available online: https://support.esri.com/en/products/desktop/arcgis-desktop/arcmap/10-7-1 (accessed on 1 September 2021).
  9. Groshans, Garth R., Elena A. Mikhailova, Christopher J. Post, Mark A. Schlautman, and Lisha Zhang. 2019. Determining the value of soil inorganic carbon stocks in the contiguous United States based on the avoided social cost of carbon emissions. Resources 8: 119. [Google Scholar] [CrossRef] [Green Version]
  10. Guo, Yinyan, Ronald Amundson, Peng Gong, and Qian Yu. 2006. Quantity and spatial variability of soil carbon in the conterminous United States. Soil Science Society of America Journal 70: 590–600. [Google Scholar] [CrossRef] [Green Version]
  11. Keestra, Saskia D., Johan Bouma, Jakob Wallinga, Pablo Tittonell, Pete Smith, Artemi Cerdà, Luka Montanarella, John N. Quinton, Yakov Pachepsky, Wim H. van der Putten, and et al. 2016. The significance of soils and soil science towards realization of the United Nations Sustainable Development Goals. Soil 2: 111–28. [Google Scholar] [CrossRef] [Green Version]
  12. Liu, Tingting, Nathaniel H. Merrill, Arthur J. Gold, Dorothy Q. Kellogg, and Emi Uchida. 2013. Modeling the production of multiple ecosystem services from agricultural and forest landscapes in Rhode Island. Agricultural and Resource Economics Review 42: 251–74. [Google Scholar] [CrossRef]
  13. Liu, Tingting. 2014. Three Essays on the Economics of Ecosystem Services and Land Use Change. Ph.D. thesis, University of Rhode Island, Kingston, RI, USA. Available online: https://digitalcommons.uri.edu/cgi/viewcontent.cgi?article=1277&context=oa_diss (accessed on 1 September 2021).
  14. Lu, Xiaoliang, David W. Kicklighter, Jerry M. Melillo, Ping Yang, Bernice Rosenzweig, Charles J. Vörösmarty, Barry Gross, and Robert J. Stewart. 2013. A contemporary carbon balance for the Northeast Region of the United States. Environmental Science and Technology 47: 13230–38. [Google Scholar] [CrossRef] [PubMed] [Green Version]
  15. Mikhailova, Elena A., Christopher J. Post, Mark A. Schlautman, Gregory C. Post, and Hamdi A. Zurqani. 2020. The business side of ecosystem services of soil systems. Earth 1: 15–34. [Google Scholar] [CrossRef]
  16. Mikhailova, Elena A., Garth R. Groshans, Christopher J. Post, Mark A. Schlautman, and Gregory C. Post. 2019a. Valuation of total soil carbon stocks in the contiguous United States based on the avoided social cost of carbon emissions. Resources 8: 157. [Google Scholar] [CrossRef] [Green Version]
  17. Mikhailova, Elena A., Garth R. Groshans, Christopher J. Post, Mark A. Schlautman, and Gregory C. Post. 2019b. Valuation of soil organic carbon stocks in the contiguous United States based on the avoided social cost of carbon emissions. Resources 8: 153. [Google Scholar] [CrossRef] [Green Version]
  18. Mikhailova, Elena A., Hamdi A. Zurqani, Christopher J. Post, Mark A. Schlautman, and Christopher J. Post. 2021a. Soil diversity (pedodiversity) and ecosystem services. Land 10: 288. [Google Scholar] [CrossRef]
  19. Mikhailova, Elena A., Lili Lin, Zhenbang Hao, Hamdi A. Zurqani, Christopher J. Post, Mark A. Schlautman, and Gregory C. Post. 2021b. Land cover change and soil carbon regulating ecosystem services in the state of South Carolina, USA. Earth 2: 674–95. [Google Scholar] [CrossRef]
  20. Mikhailova, Elena A., Lili Lin, Zhenbang Hao, Hamdi A. Zurqani, Christopher J. Post, Mark A. Schlautman, and Gregory C. Post. 2021c. Vulnerability of soil carbon regulating ecosystem services to land cover change in the state of New Hampshire. Earth 2: 208–24. [Google Scholar] [CrossRef]
  21. Multi-Resolution Land Characteristics Consortium—MRLC. n.d. Available online: https://www.mrlc.gov/ (accessed on 1 September 2021).
  22. Natural Resources Conservation Service. n.d. USDA. Narragansett—Rhode Island State Soil. Available online: http://www.nrcs.usda.gov/Internet/FSE_DOCUMENTS/nrcs144p2_016348.pdf (accessed on 1 September 2021).
  23. Rhode Island Greenhouse Gas Emissions Reduction Plan. 2016 December. Available online: http://climatechange.ri.gov/documents/ec4-ghg-emissions-reduction-plan-final-draft-2016-12-29-clean.pdf (accessed on 1 September 2021).
  24. Soil Survey Staff, Natural Resources Conservation Service, United States Department of Agriculture. 2021a. Soil Survey Geographic (SSURGO) Database. Available online: https://nrcs.app.box.com/v/soils (accessed on 10 September 2021).
  25. Soil Survey Staff, Natural Resources Conservation Service, United States Department of Agriculture. 2021b. Photos of Soil Orders. Available online: https://www.nrcs.usda.gov/wps/portal/nrcs/detail/soils/edu/?cid=nrcs142p2_053588 (accessed on 20 September 2021).
  26. The 2021 Act on Climate Bills. n.d. (S0078 and H5445). Available online: http://webserver.rilin.state.ri.us/BillText/BillText21/SenateText21/S0078A.pdf (accessed on 1 September 2021).
  27. The United States Census Bureau. 2018. TIGER/Line Boundary Shapefiles. Available online: https://www.census.gov/geographies/ mapping-files/time-series/geo/tiger-line-file.2018.html (accessed on 10 September 2021).
  28. United Nations. 2015. Paris Agreement. Available online: https://unfccc.int/sites/default/files/english_paris_agreement.pdf (accessed on 1 September 2021).
  29. Wright, William R., and Edward H. Sautter. 1988. Soils of Rhode Island Landscapes. Agricultural Experiment Station Bulletin. Kingston: University of Rhode Island, p. 492. [Google Scholar]
Figure 1. General soil map of Rhode Island (U.S.A.) (Latitude: 41° 09′ N to 42° 01′ N; Longitude: 71° 07′ W to 71° 53′ W) (based on data from (Soil Survey Staff 2021a; The United States Census Bureau 2018).
Laws 10 00092 g001
Figure 2. Land cover map of Rhode Island (U.S.A.) for 2016 (Latitude: 41°09′ N to 42°01′ N; Longitude: 71°07′ W to 71°53′ W) (based on data from (MRLC n.d.)).
Laws 10 00092 g002
Figure 3. The total dollar value of mid-point total soil carbon (TSC) storage value for newly “developed” land covers (open space, low, medium, and high intensity) from 2001 to 2016 in Rhode Island (U.S.A.) based on a social cost of C (SC-CO2) of $46 per metric ton of CO2 applicable for the year 2025 (2007 U.S. dollars with an average discount rate of 3% (EPA 2016a)).
Laws 10 00092 g003
Table 1. Soil diversity (pedodiversity) is expressed as taxonomic diversity at the level of soil order and ecosystem service types in Rhode Island (U.S.A.) (adapted from Mikhailova et al. 2021a).
StocksEcosystem Services
Soil OrderGeneral Characteristics and ConstraintsProvisioningRegulation/
Maintenance
Cultural
Slightly Weathered
EntisolsEmbryonic soils with ochric epipedonxxx
InceptisolsYoung soils with ochric or umbric epipedonxxx
HistosolsOrganic soils with ≥20% of organic carbonxxx
Table 2. A conceptual overview of the accounting framework used in this study (adapted from Groshans et al. (2019)), which can also be used for greenhouse gas (GHG) emissions information disclosure for climate mitigation policy.
TimeSTOCKSFLOWSVALUE
Biophysical Accounts
(Science-Based)
Administrative Accounts
(Boundary-Based)
Monetary Account(s)Benefit(s)Total Value
Soil Extent:Administrative Extent:Ecosystem Good(s) and
Service(s):
Sector:Types of Value:
Composite (Total) Stock: Total Soil Carbon (TSC) = Soil Organic Carbon (SOC) + Soil Inorganic Carbon (SIC)
Past
This study: 2001, 2016, Change
(e.g., post-development disclosures)
Current (e.g., status)
Future
(e.g., pre-development disclosures)
Environment:The social cost of carbon (SC-CO2) and avoided emissions:
- Soil orders (Entisols, Inceptisols, Histosols)- State (Rhode Island)
- County
(5 counties)
- Regulating (e.g., carbon sequestration)- Carbon
sequestration
- $46 per metric ton of CO2 (2007 U.S. dollars with an average discount rate of 3% (EPA 2016a)
Table 3. Soil diversity (pedodiversity) by soil order (taxonomic pedodiversity) and county in Rhode Island (U.S.A.) based on Soil Survey Geographic (SSURGO) Database (2020) (Soil Survey Staff 2021a).
CountyTotal
Area
(km2) (%)
Degree of Weathering and Soil Development
Slight
EntisolsInceptisolsHistosols
2016 Area (km2), (% of Total Area)
Bristol 61 (2%) 17 (29%) 39 (63%)5 (8%)
Kent435 (16%)46 (11%)336 (77%)53 (12%)
Newport258 (10%)99 (38%)146 (57%)13 (5%)
Providence1055 (40%)53 (5%)854 (81%)148 (14%)
Washington842 (32%)122 (14%)604 (72%)116 (14%)
Totals (%)2651 (100%)337 (13%)1979 (75%)335 (12%)
Table 4. Area-normalized content (kg m−2) and monetary values ($ m−2) of soil organic carbon (SOC), soil inorganic carbon (SIC), and total soil carbon (TSC = SOC + SIC) by soil order based on data reported by Guo et al. (2006) for the upper 2 m of soil and an avoided social cost of C (SC-CO2) of $46 per metric ton of CO2 (2007 U.S. dollars with an average discount rate of 3% (EPA 2016a).
Soil OrderSOC ContentSIC ContentTSC ContentSOC ValueSIC ValueTSC Value
Minimum—Midpoint—Maximum ValuesMidpoint Values
(kg m−2)(kg m−2)(kg m−2)($ m−2)($ m−2)($ m2)
Slightly Weathered
Entisols1.88.015.81.94.88.43.712.824.21.350.822.17
Inceptisols2.88.917.42.55.18.45.314.025.81.500.862.36
Histosols63.9140.1243.90.62.45.064.5142.5248.923.620.4124.03
Table 5. Midpoint soil organic carbon (SOC) storage by soil order and county for the state of Rhode Island (USA), based on the areas shown in Table 3 and the midpoint SOC contents shown in Table 4.
CountyTotal SOC
Storage
(kg) (%)
Degree of Weathering and Soil Development
Slight
EntisolsInceptisolsHistosols
Total SOC Storage (kg), (% of Total)
Bristol 1.16 × 10⁹ (2%) 1.39 × 10⁸ (12%) 3.44 × 10⁸ (30%)6.82 × 10⁸ (59%)
Kent1.08 × 1010 (16%)3.68 × 10⁸ (3%)2.99 × 10⁹ (28%)7.43 × 10⁹ (69%)
Newport3.93 × 109 (6%)7.90 × 10⁸ (20%)1.30 × 10⁹ (33%)1.85 × 10⁹ (47%)
Providence2.88 × 1010 (43%)4.22 × 10⁸ (1%)7.60 × 10⁹ (26%)2.08 × 10¹⁰ (72%)
Washington2.25 × 1010 (34%)9.77 × 10⁸ (4%)5.38 × 10⁹ (24%)1.62 × 10¹⁰ (72%)
Totals (%)6.72 × 10¹⁰ (100%)2.70 × 10⁹ (4%)1.76 × 10¹⁰ (26%)4.69 × 10¹⁰ (70%)
Table 6. Monetary value of soil organic carbon (SOC) by soil order and county for the state of Rhode Island (USA), based on the areas shown in Table 3 and the area-normalized midpoint monetary values shown in Table 4.
CountyTotal
SC-CO2
($)
Degree of Weathering and Soil Development
Slight
EntisolsInceptisolsHistosols
SC-CO2 ($)
Bristol 1.96 × 10⁸ 2.35 × 1075.79 × 1071.15 × 108
Kent1.82 × 1096.20 × 1075.04 × 1081.25 × 109
Newport6.63 × 1081.33 × 1082.19 × 1083.11 × 108
Providence4.85 × 1097.13 × 1071.28 × 1093.50 × 109
Washington3.80 × 1091.65 × 1089.07 × 1082.73 × 109
Totals1.13 × 10104.55 × 1082.97 × 1097.91 × 109
Table 7. Midpoint soil inorganic carbon (SIC) storage by soil order and county for the state of Rhode Island (USA), based on the areas shown in Table 3 and the midpoint SIC contents shown in Table 4.
CountyTotal SIC
Storage
(kg) (%)
Degree of Weathering and Soil Development
Slight
EntisolsInceptisolsHistosols
Total SIC Storage (kg), (% from Total)
Bristol 2.92 × 10⁸ (2%) 1.39 × 10⁸ (29%) 3.44 × 10⁸ (67%)6.82 × 10⁸ (4%)
Kent1.08 × 1010 (16%)3.68 × 10⁸ (11%)2.99 × 10⁹ (83%)7.43 × 10⁹ (6%)
Newport3.93 × 109 (10%)7.90 × 10⁸ (38%)1.30 × 10⁹ (60%)1.85 × 10⁹ (3%)
Providence2.88 × 1010 (40%)4.22 × 10⁸ (5%)7.60 × 10⁹ (88%)2.08 × 10¹⁰ (7%)
Washington2.25 × 1010 (32%)9.77 × 10⁸ (15%)5.38 × 10⁹ (78%)1.62 × 10¹⁰ (7%)
Totals (%)1.25 × 10¹⁰ (100%)1.62 × 10⁹ (13%)1.01 × 10¹⁰ (81%)8.04 × 10⁸ (6%)
Table 8. Monetary value of soil inorganic carbon (SIC) by soil order and county for the state of Rhode Island (USA), based on the areas shown in Table 3 and the area-normalized midpoint monetary values shown in Table 4.
CountyTotal
SC-CO2
($)
Degree of Weathering and Soil Development
Slight
EntisolsInceptisolsHistosols
SC-CO2 ($)
Bristol 4.95 × 10⁷ 1.43 × 1073.32 × 1072.00 × 106
Kent3.49 × 1083.77 × 1072.89 × 1082.17 × 107
Newport2.12 × 1088.10 × 1071.25 × 1085.40 × 106
Providence8.38 × 1084.33 × 1077.34 × 1086.08 × 107
Washington6.67 × 1081.00 × 1085.20 × 1084.74 × 107
Totals2.12 × 1092.76 × 1081.70 × 1091.37 × 108
Table 9. Midpoint total soil carbon (TSC) storage by soil order and county for the state of Rhode Island (USA), based on the areas shown in Table 3 and the midpoint TSC contents shown in Table 4.
CountyTotal TSC
Storage
(kg) (%)
Degree of Weathering and Soil Development
Slight
EntisolsInceptisolsHistosols
Total TSC Storage (kg), (% from Total)
Bristol 1.46 × 10⁹ (2%) 2.23 × 10⁸ (15%) 5.41 × 10⁸ (37%)6.94 × 10⁸ (48%)
Kent1.29 × 1010 (16%)5.88 × 10⁸ (5%)4.71 × 10⁹ (37%)7.56 × 10⁹ (59%)
Newport5.18 × 109 (6%)1.26 × 10⁹ (24%)2.04 × 10⁹ (39%)1.88 × 10⁹ (36%)
Providence3.37 × 1010 (42%)6.76 × 10⁸ (2%)1.20 × 10¹⁰ (35%)2.11 × 10¹⁰ (63%)
Washington2.65 × 1010 (33%)1.56 × 10⁹ (6%)8.46 × 10⁹ (32%)1.65 × 10¹⁰ (62%)
Totals (%)7.97 × 10¹⁰ (100%)4.31 × 10⁹ (5%)2.77 × 10¹⁰ (35%)4.77 × 10¹⁰ (60%)
Table 10. Monetary value of total soil carbon (TSC) by soil order and county for the state of Rhode Island (USA), based on the areas shown in Table 3 and the area-normalized midpoint monetary values shown in Table 4.
CountyTotal
SC-CO2
($)
Degree of Weathering and Soil Development
Slight
EntisolsInceptisolsHistosols
SC-CO2 ($)
Bristol 2.46 × 10⁸ 3.77 × 1079.12 × 1071.17 × 108
Kent2.17 × 1099.97 × 1077.94 × 1081.27 × 109
Newport8.75 × 1082.14 × 1083.44 × 1083.17 × 108
Providence5.69 × 1091.15 × 1082.01 × 1093.56 × 109
Washington4.47 × 1092.65 × 1081.43 × 1092.78 × 109
Totals1.34 × 10107.31× 1084.67× 1098.05× 109
Table 11. Land use/land cover (LULC) change by soil order in Rhode Island (USA) from 2001 to 2016.
NLCD Land Cover Classes
(LULC)
2016 Total
Area by LULC
(km2)
Change in Area, 2001–2016 (%)
Degree of Weathering and Soil Development
EntisolsInceptisolsHistosols
2016 Area by Soil Order, km2
(Change in Area, 2001–2016, %)
Barren land 20 (−9.19%) 8.46 (−9.65%) 11.73 (−8.67%)0.26 (−16.91%)
Woody wetlands313 (−0.38%)28.54 (−0.20%)114.97 (-0.13%)169.24 (-0.57%)
Shrub/Scrub16 (128.58%)2.85 (163.82%)12.33 (126.76%)0.44 (39.32%)
Mixed forest421 (−0.23%)38.90 (−0.65%)352.78 (−0.20%)29.31 (0.02%)
Deciduous forest810 (−4.98%)45.54 (−11.29%)669.41 (−4.94%)94.86 (−1.94%)
Herbaceous48 (10.08%)11.92 (4.44%)35.39 (11.65%)0.73 (37.93%)
Evergreen forest115 (−1.30%)17.66 (−2.71%)93.79 (−1.04%)3.72 (−1.05%)
Emergent herbaceous wetlands25 (−6.65%)7.13 (−3.86%)6.93 (−10.25%)11.19 (−6.06%)
Hay/Pasture77 (−8.46%)16.77 (−3.95%)59.43 (−9.41%)1.24 (−19.00%)
Cultivated crops16 (23.72%)4.31 (19.09%)11.41 (25.51%)0.26 (25.64%)
Developed, open space183 (7.51%)27.29 (1.57%)142.43 (7.85%)12.81 (18.13%)
Developed, medium intensity278 (4.41%)52.02 (4.59%)222.43 (4.29%)3.83 (8.88%)
Developed, low intensity222 (4.34%)43.54 (1.07%)172.25 (5.06%)6.55 (7.91%)
Developed, high intensity106 (6.60%)32.09 (8.06%)73.60 (5.90%)0.41 (21.45%)
Table 12. Distribution of soil C regulating ecosystem services in the state of Rhode Island (USA) by soil order (photos courtesy of USDA/NRCS (Soil Survey Staff 2021b). Values are taken/derived from Table 3, Table 6, Table 8, and Table 10.
Soil Regulating Ecosystem Services in the State of Rhode Island
Degree of Weathering and Soil Development
Slight (100%)
Entisols
13%
Inceptisols
75%
Histosols
12%
Laws 10 00092 i001 Laws 10 00092 i002 Laws 10 00092 i003
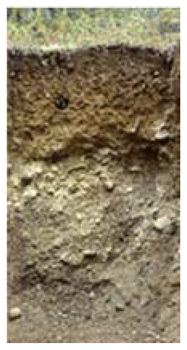
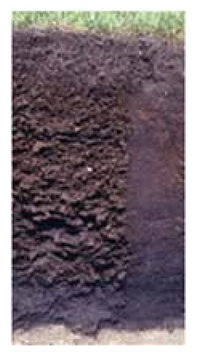
Social cost of soil organic carbon (SOC):$11.3B
$455.99M$2.97B$7.91B
4%26%70%
Social cost of soil inorganic carbon (SIC):$2.1B
$276.37M$1.70B$137.29M
13%80%6%
Social cost of total soil carbon (TSC):$13.4B
$731.40M$4.67B$8.05B
5%35%60%
Sensitivity to climate change
LowLowHigh
SOC and SIC sequestration (recarbonization) potential
LowLowLow
Note: Entisols, and Inceptisols are mineral soils. Histosols are mostly organic soils. M = million = 106; B = billion = 109.
Table 13. Increases in developed land and maximum potential for realized social costs of C due to complete loss of total soil carbon of developed land by soil order in Rhode Island (USA) from 2001 to 2016. Values are derived from Table 4 and Table 11.
NLCD Land Cover Classes
(LULC)
Degree of Weathering and Soil Development
Slight
EntisolsInceptisolsHistosols
Area Change, km2 (SC-CO2, $ = USD)
Developed, open space 0.42 ($0.91M) 10.4 ($24.46M)1.97 ($47.23M)
Developed, medium intensity2.28 ($4.96M)9.15 ($21.59M)0.31 ($7.50M)
Developed, low intensity0.46 ($1.00M)8.30 ($19.60M)0.48 ($11.55M)
Developed, high intensity2.39 ($5.20M)4.10 ($9.68M)0.07 ($1.73M)
Totals($155.0M)5.56 ($12.1M)31.9 ($75.3M)2.83 ($68.0M)
Note: Entisols and Inceptisols are mineral soils. Histosols are mostly organic soils. M = million = 106.
Table 14. Increases in land development (LULC: developed open space, developed medium intensity, developed low intensity, and developed high intensity) and maximum potential for realized social costs of C due to complete loss of total soil carbon of developed land by soil order and county in Rhode Island (USA) from 2001 to 2016.
CountyTotal
Area Change
(km2)
(SC-CO2, $ = USD)
Degree of Weathering and Soil Development
Slight
EntisolsInceptisolsHistosols
Developed Area Increase between 2001 and 2016 (km2)
(SC-CO2, $ = USD)
Bristol 1.22 ($4.42M) 0.27 ($0.58M) 0.88 ($2.07M)0.07 ($1.78M)
Kent9.28 ($33.6M)1.79 ($3.89M)6.93 ($16.4M)0.55 ($13.3M)
Newport3.22 ($8.71M)1.20 ($2.59M)1.97 ($4.64M)0.06 ($1.47M)
Providence19.2 ($83.7M)1.01 ($2.19M)16.4 ($38.7M)1.78 ($42.9M)
Washington7.94 ($26.1M)1.83 ($3.96M)5.76 ($13.6M)0.36 ($8.57M)
Totals40.8 ($157.0M)6.10 ($13.2M)31.9 ($75.3M)2.82 ($68.0M)
Note: Entisols and Inceptisols are mineral soils. Histosols are mostly organic soils. M = million = 106.
Publisher’s Note: MDPI stays neutral with regard to jurisdictional claims in published maps and institutional affiliations.

