Article

Mineralogical Characteristics and Isothermal Oxidation Kinetics of Ironsand Pellets

School of Metallurgical and Ecological Engineering, University of Science and Technology Beijing, 30th Xueyuan Road, Haidian district, Beijing 100083, China
*
Author to whom correspondence should be addressed.
Metals 2019, 9(2), 265; https://doi.org/10.3390/met9020265
Submission received: 23 January 2019 / Revised: 10 February 2019 / Accepted: 20 February 2019 / Published: 23 February 2019

Abstract

:
An in-depth understanding of mineralogical characteristics and the oxidation behaviors of ironsand is of great significance to make the best of ironsand and develop Ti-containing pellets. This paper quantitatively characterized the mineralogical characteristics of the ironsand from East Java in Indonesia through X-ray diffraction (XRD-Rietveld) and scanning electron microscope (SEM-EDS). The results indicated that the mineral composition of the ironsand was magnetite (22.7%), titanomagnetite (40.9%), enstatite (17.1%), hematite–ilmenite solid solution (14.5%), and magnesium iron aluminum silicon oxide (5.8%). The microstructure characterization of pellets after oxidation showed that the porosity of the pellets decreased from 20.7% to 11.7% with temperatures ranging from 1073 to 1473 K. Moreover, the activation energies of ironsand pellets were calculated by using model-function method. The calculated data of different mechanism functions indicated that the chemical reaction mechanism for the early stage of the oxidation fit A2 (random nucleation and nuclei growth) well, the chemical reaction mechanism for the post-oxidation at 1073–1273 K fit F1 (chemical reaction) well, and the chemical reaction mechanism for the post-oxidation at 1373 and 1473 K fit D4 (diffusion) well. The reaction mechanism and the limited link was finally discussed based on the kinetic analysis and the mineralogical characteristics.

1. Introduction

Vanadium–titanium magnetite is a type of important polymetallic mineral, which is mainly composed of Fe, V, Ti, and contains a small amount of Cr, Co, and Ni [1,2,3]. Vanadium–titanium magnetite (V-Ti) is widely distributed in Canada (Quebec), China (Panxi, Chengde, and Maoshan), South Africa (Bushveld), Russia (Ural tusk), and New Zealand [4,5,6]. For a long time, vanadium–titanium magnetite has been used as an essential raw material in sintering and pelletizing processes for ironmaking. The use of vanadium–titanium magnetite not only helps alleviate the crisis of iron ore resources [7,8,9], but also contributes to prolonging the furnace life due to the deposition of Ti(Cx, N1−x) at the surface or crack of the firebricks on the hearth [10,11]. Therefore, the effective activation and utilization of vanadium–titanium magnetite in sintering and pelletizing processes are of interest. Domestic and foreign scholars [12,13,14,15,16] have undertaken a lot of research on the influences of vanadium–titanium magnetite concentrate proportion on mineralogy, performance, and productivity of sinter. They suggested that due to the low iron content, small mineral crystal size, complicated phase structure, and numerous mineral components, V–Ti magnetite was a polymetallic paragenic resource that may be harmful to the sinter quality. They indicated that the increase of TiO2 content in the sinter could decrease the drum index, yield, and vertical sintering speed of the sintering, which limits the use of V–Ti magnetite.
In view of the drawbacks of Ti-containing sinter, the utilization of V–Ti magnetite in the pellets is another important research interest. Moreover, a deep understanding of the oxidation behavior of V–Ti magnetite pellets is important to determine operating parameters and improve the quality of the pellets. Han et al. [17] studied the isothermal oxidation kinetics of V–Ti magnetite pellets at the temperature of 1073–1323 K according to the shrinking unreacted-core model. The results indicated that the oxidation process of the Ti-bearing pellets was controlled by chemical reaction at temperatures of 1073–1173 K (activation energy, 68.64 kJ/mol), and was mixed-controlled by the chemistry reaction and the diffusion at a temperature range of 1173–1273 K (activation energy, 39.66 kJ/mol). In addition, the limited link of oxidation is the diffusion process when the temperature is higher than 1273 K with an activation energy 20.85 kJ/mol. Li et al. [18,19] conducted a series of experiments on the oxidation kinetics of Hongge vanadium titanium-bearing magnetite pellets. The results indicated that the phase transformations of the valuable elements could be described as follows: Fe3O4 → Fe2O3, Fe2VO4 → (Cr0.15V0.85)2O3, Fe2.75Ti0.25O4 → FeTiO3 → Fe9TiO15, FeCr2O4 → (Fe0.6Cr0.4)2O4, Fe0.7Cr1.3O3, (Cr0.15V0.85)2O3. The average value of activation energy was calculated to be 69.33 kJ/mol by the Flynn–Wall–Ozawa method. However, data are still scarce for the oxidation of ironsand pellets. The restriction factors are not clear at a high temperature. Identification of the kinetics mechanism for the ironsand pellets is deficient, especially oxidation at high temperatures.
In this paper, mineralogical characteristics of ironsand were quantitatively characterized through X-ray diffraction (XRD-Rietveld) and the microstructures were observed by scanning electron microscopy-energy dispersive X-ray spectroscopy (SEM-EDS). A series of thermal gravity (TG) experiments were conducted to investigate the isothermal kinetics of the ironsand pellets in the air. The mineralogical compositions, porosity evolution, and compressive strength of the pellets after oxidation were further characterized by SEM. Moreover, the activation energies of the ironsand pellets were calculated by using the model-function method. The reaction mechanism and the limited link was finally discussed based on the kinetics analysis and the mineralogical characteristics.

2. Materials and Methods

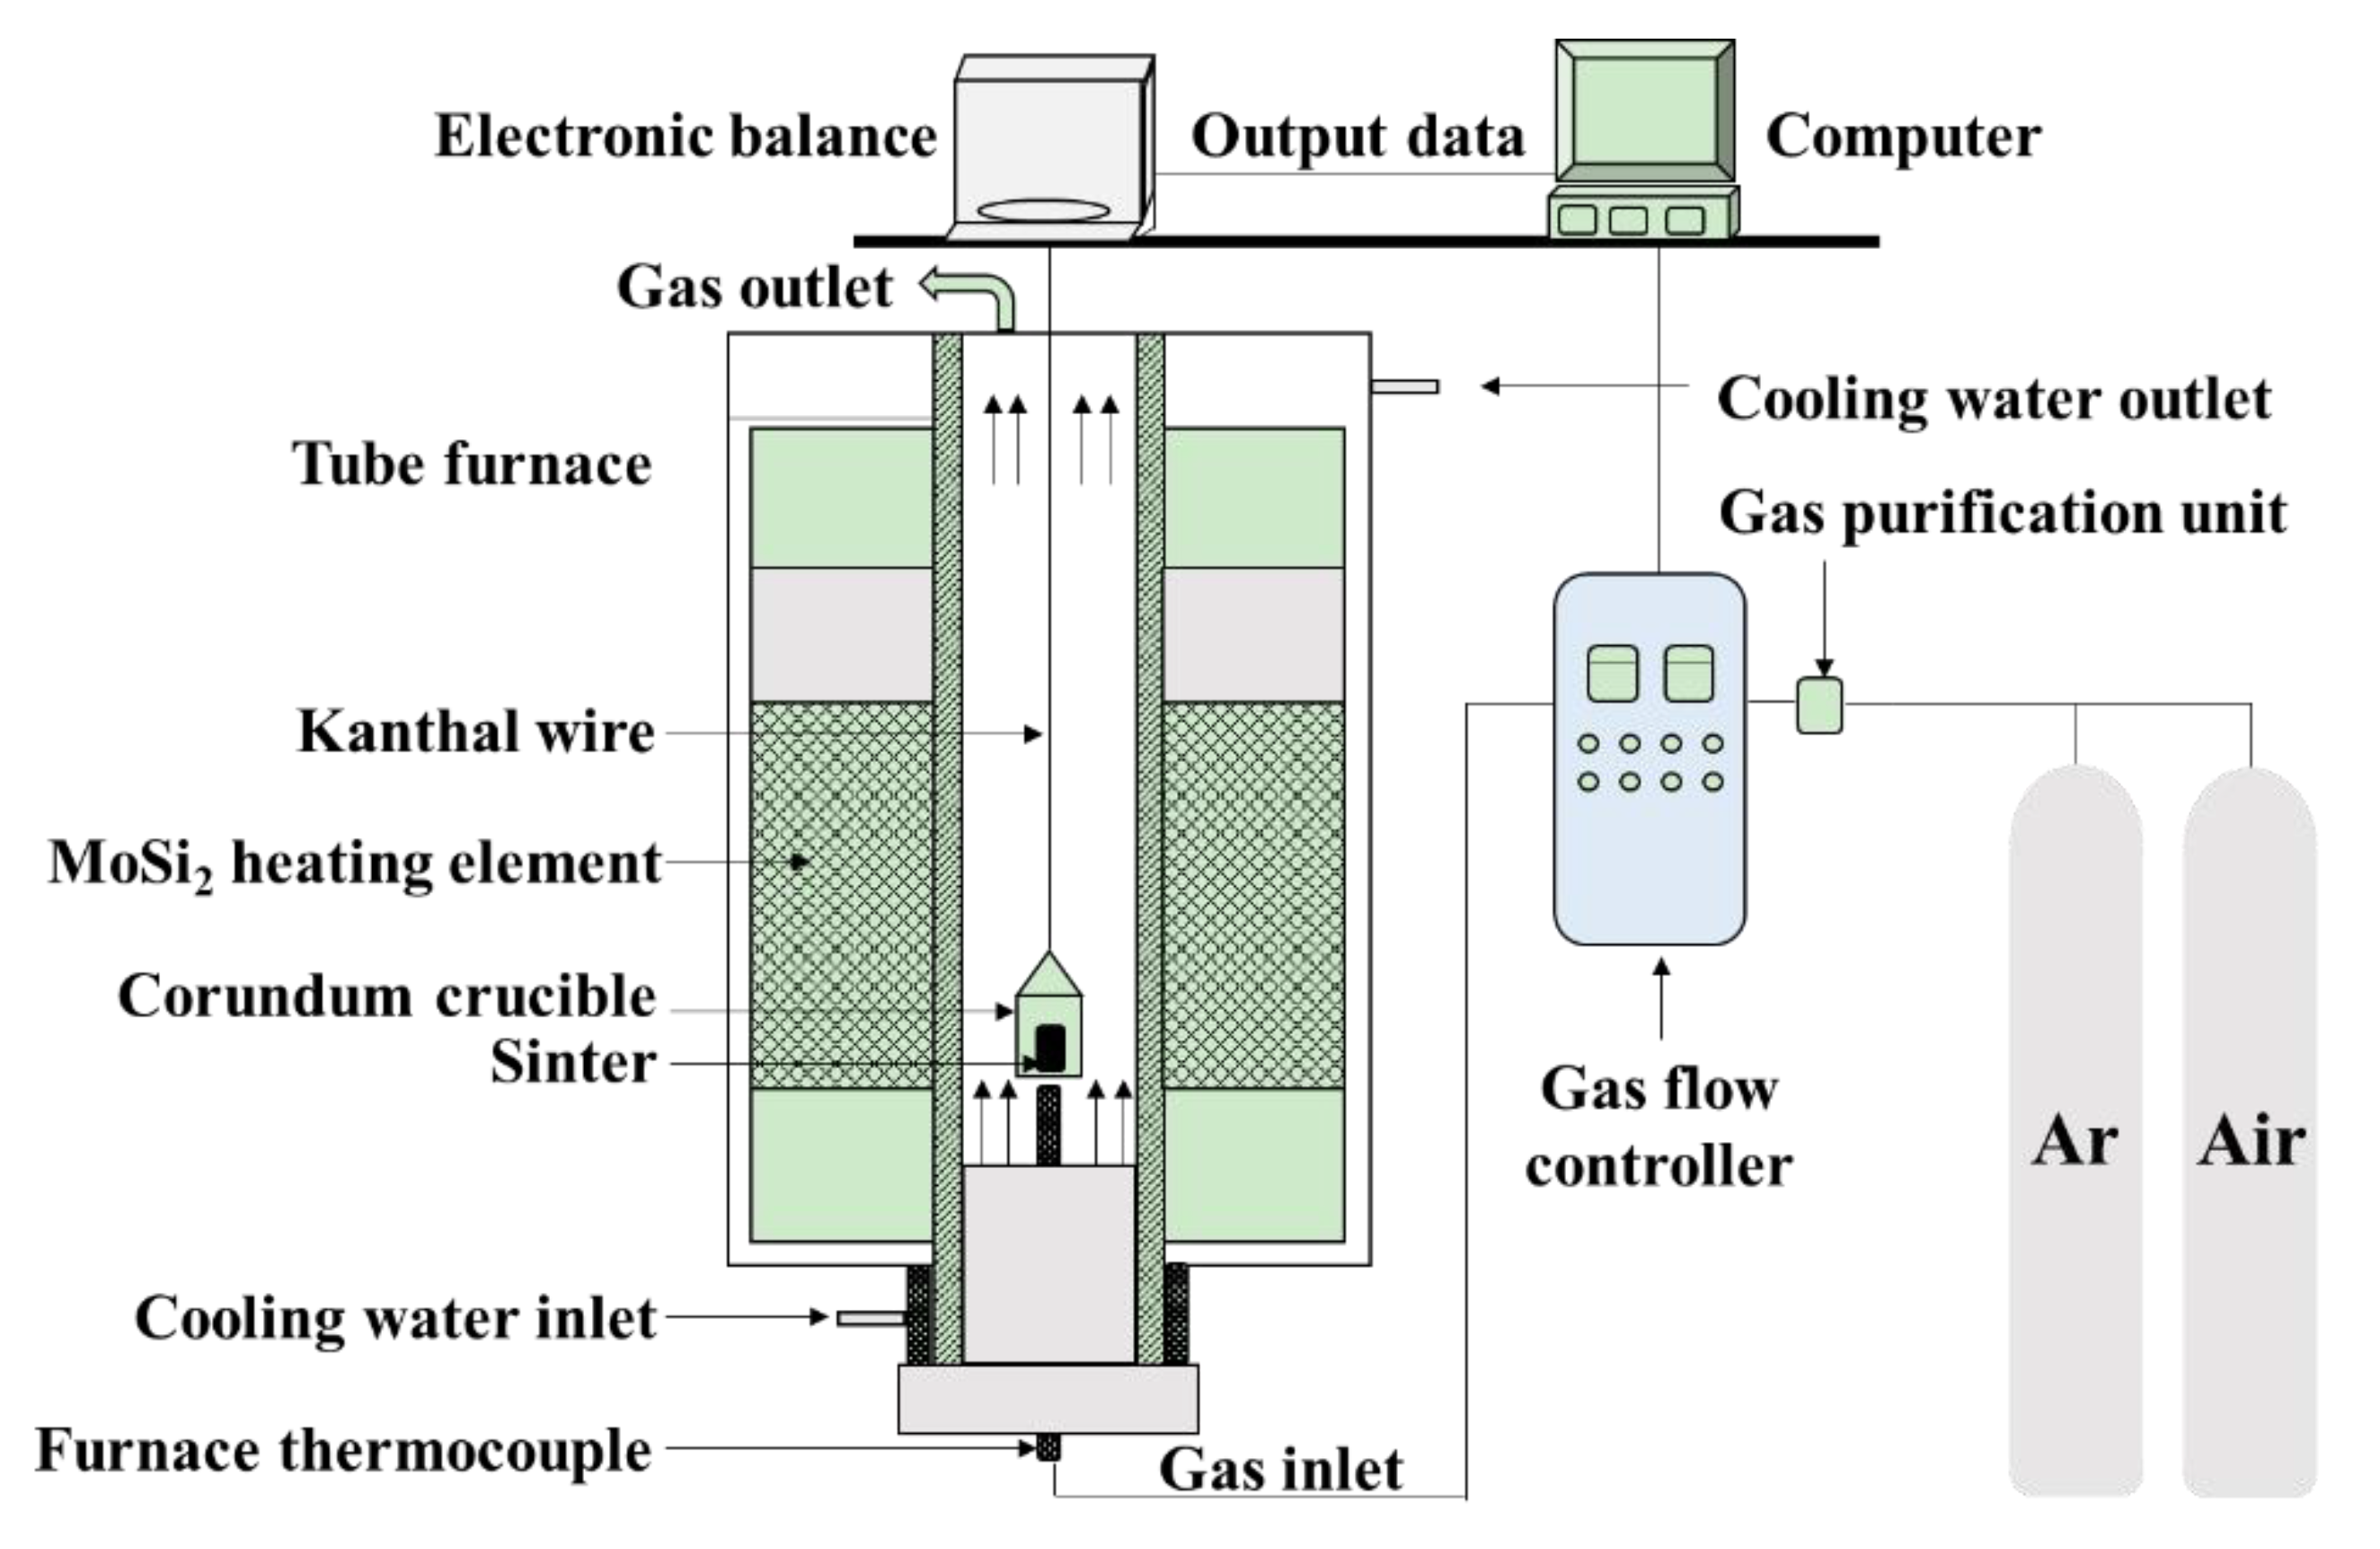
2.1. Materials and Oxidation Experiments

The ironsand used in the paper came from East Java in Indonesia. Table 1 gives the chemical composition of ironsand determined by chemical analysis and fluorescence analysis (XRF-1800, Shimadzu, Kyoto, Japan). The results indicated that the ironsand had a high content of TiO2 and FeO. The mass fractions of Fe3+ and Fe2+ were 26.03% and 29.60%, respectively. The oxidation kinetics of the ironsand pellets were studied by conducting a series of oxidation experiments performed in an electric tube furnace in Figure 1. Ironsand with sizes less than 74 μm was obtained through fine grinding and screening. Then the ironsand (50 g) and deionized water (4 mL) were mixed thoroughly. A total of 15 g of the blended mixture was pressed into a cylindrical block with a height of 10 mm and a diameter of 20 mm under the pressure of 10 MPa. After that, the pellets were dried in an oven at a constant temperature of 105 °C for 3 h to remove the free water. During a typical oxidation experiment, a pellet was placed in an iron–chromium–aluminum alloy wire basket and preheated under a protective atmosphere of Ar (3 L/min). The sample was then preheated to the target temperature. Subsequently, the gas was switched to compressed air with a flow rate of 5 L/min for 30 min. After oxidation, the samples were cooled to room temperature under an atmosphere of Ar (3 L/min). Each test was carried out three times and the mean was taken to remove any discrepancies.

2.2. Characterization

This study quantitatively characterized the mineralogical characteristics of ironsand through XRD-Rietveld with Cu Kα radiation (M21XVHF22, MAC Science Co., Ltd., Yokohama, Japan). The microstructures of ironsand were characterized by an energy dispersive X-ray spectrometer (EDS) in combination with a scanning electron microscopy (SEM, JSM-6460, JEOL Ltd., Mitaka, Japan) with backscattering modes. Sample particles were fixed in epoxy resin and vacuum impregnated. By using water as a lubricant, silicon carbide paper up to 1000 grit, and diamond paste, these sections were polished carefully [20]. The average porosity of the pellets was obtained through area method by using five SEM patterns. The compressive strengths of the pellets after oxidation were measured by a compressive machine (QZYC-10C, Hebi metallurgical machinery equipment co. LTD, Hebi, China).

3. Results and Discussion

3.1. Mineralogical Characteristics of Ironsand

Figure 2 illustrates the XRD-Rietveld analysis of the ironsand. In the process of multiphase refinement, the Chebyshev polynomial was used to fit the background. The refinement significantly reduced the difference between the calculated pattern and the experimental pattern. There was no residual diffraction peak, which indicated that the crystal structure model was reasonable [21]. The Rwp of the refinement reached 5.05% with an accuracy of 1%, which indicated that the equation analog effect was good. The average composition of mineral phases were obtained through multiple tests as shown in Table 2. The results indicated that the main minerals of the ironsand were titanomagnetite (Fe2.814Ti0.186O4), magnetite (Fe3O4), hematite–ilmenite solid solution (Fe1.696Ti0.228O3), enstatite (Mg1.56Fe0.44Si2O6), and magnesium iron aluminum silicon oxide (Al0.205Fe0.281Mg0.719O3Si0.795). Titanium mainly exists in the form of Fe2.814Ti0.186O4 and Fe1.696Ti0.228O3 at concentrations of 40.9% and 14.5%. Si and Mg combine with a small amount of iron to form Mg1.56Fe0.44Si2O6 and Al0.205Fe0.281Mg0.719O3Si0.795.
Figure 3 gives the microstructures of the ironsand. As can be seen from Figure 3a, the shapes of the ironsand particles were mostly regular and had smooth surfaces. The particle diameter varied from 100 to 300 μm. SEM patterns in Figure 3 suggested that iron oxides in ironsand had two different kinds of microstructures. One was particles with the layered phases deposited on the substrate at an angle, as shown in Figure 3b,c. The EDS results in Figure 3 (P1, P2) indicated that the substrate was titanomagnetite (TTM) and the layered phase was titanohematite (TTH). Another was a homogeneous particle with smooth surfaces and relatively average element distribution, as expressed in Figure 3e,f. The EDS results in Figure 3 (P4, P6) confirmed the main phase in the homogeneous particle was TTM. The EDS patterns in Figure 3 (P3, P5) confirmed the existence of enstatite, which was consistent with the results of XRD. More remarkable, the EDS results showed that a small amount of Mg, Al, and V existed in iron oxides to form the complex solid solution.

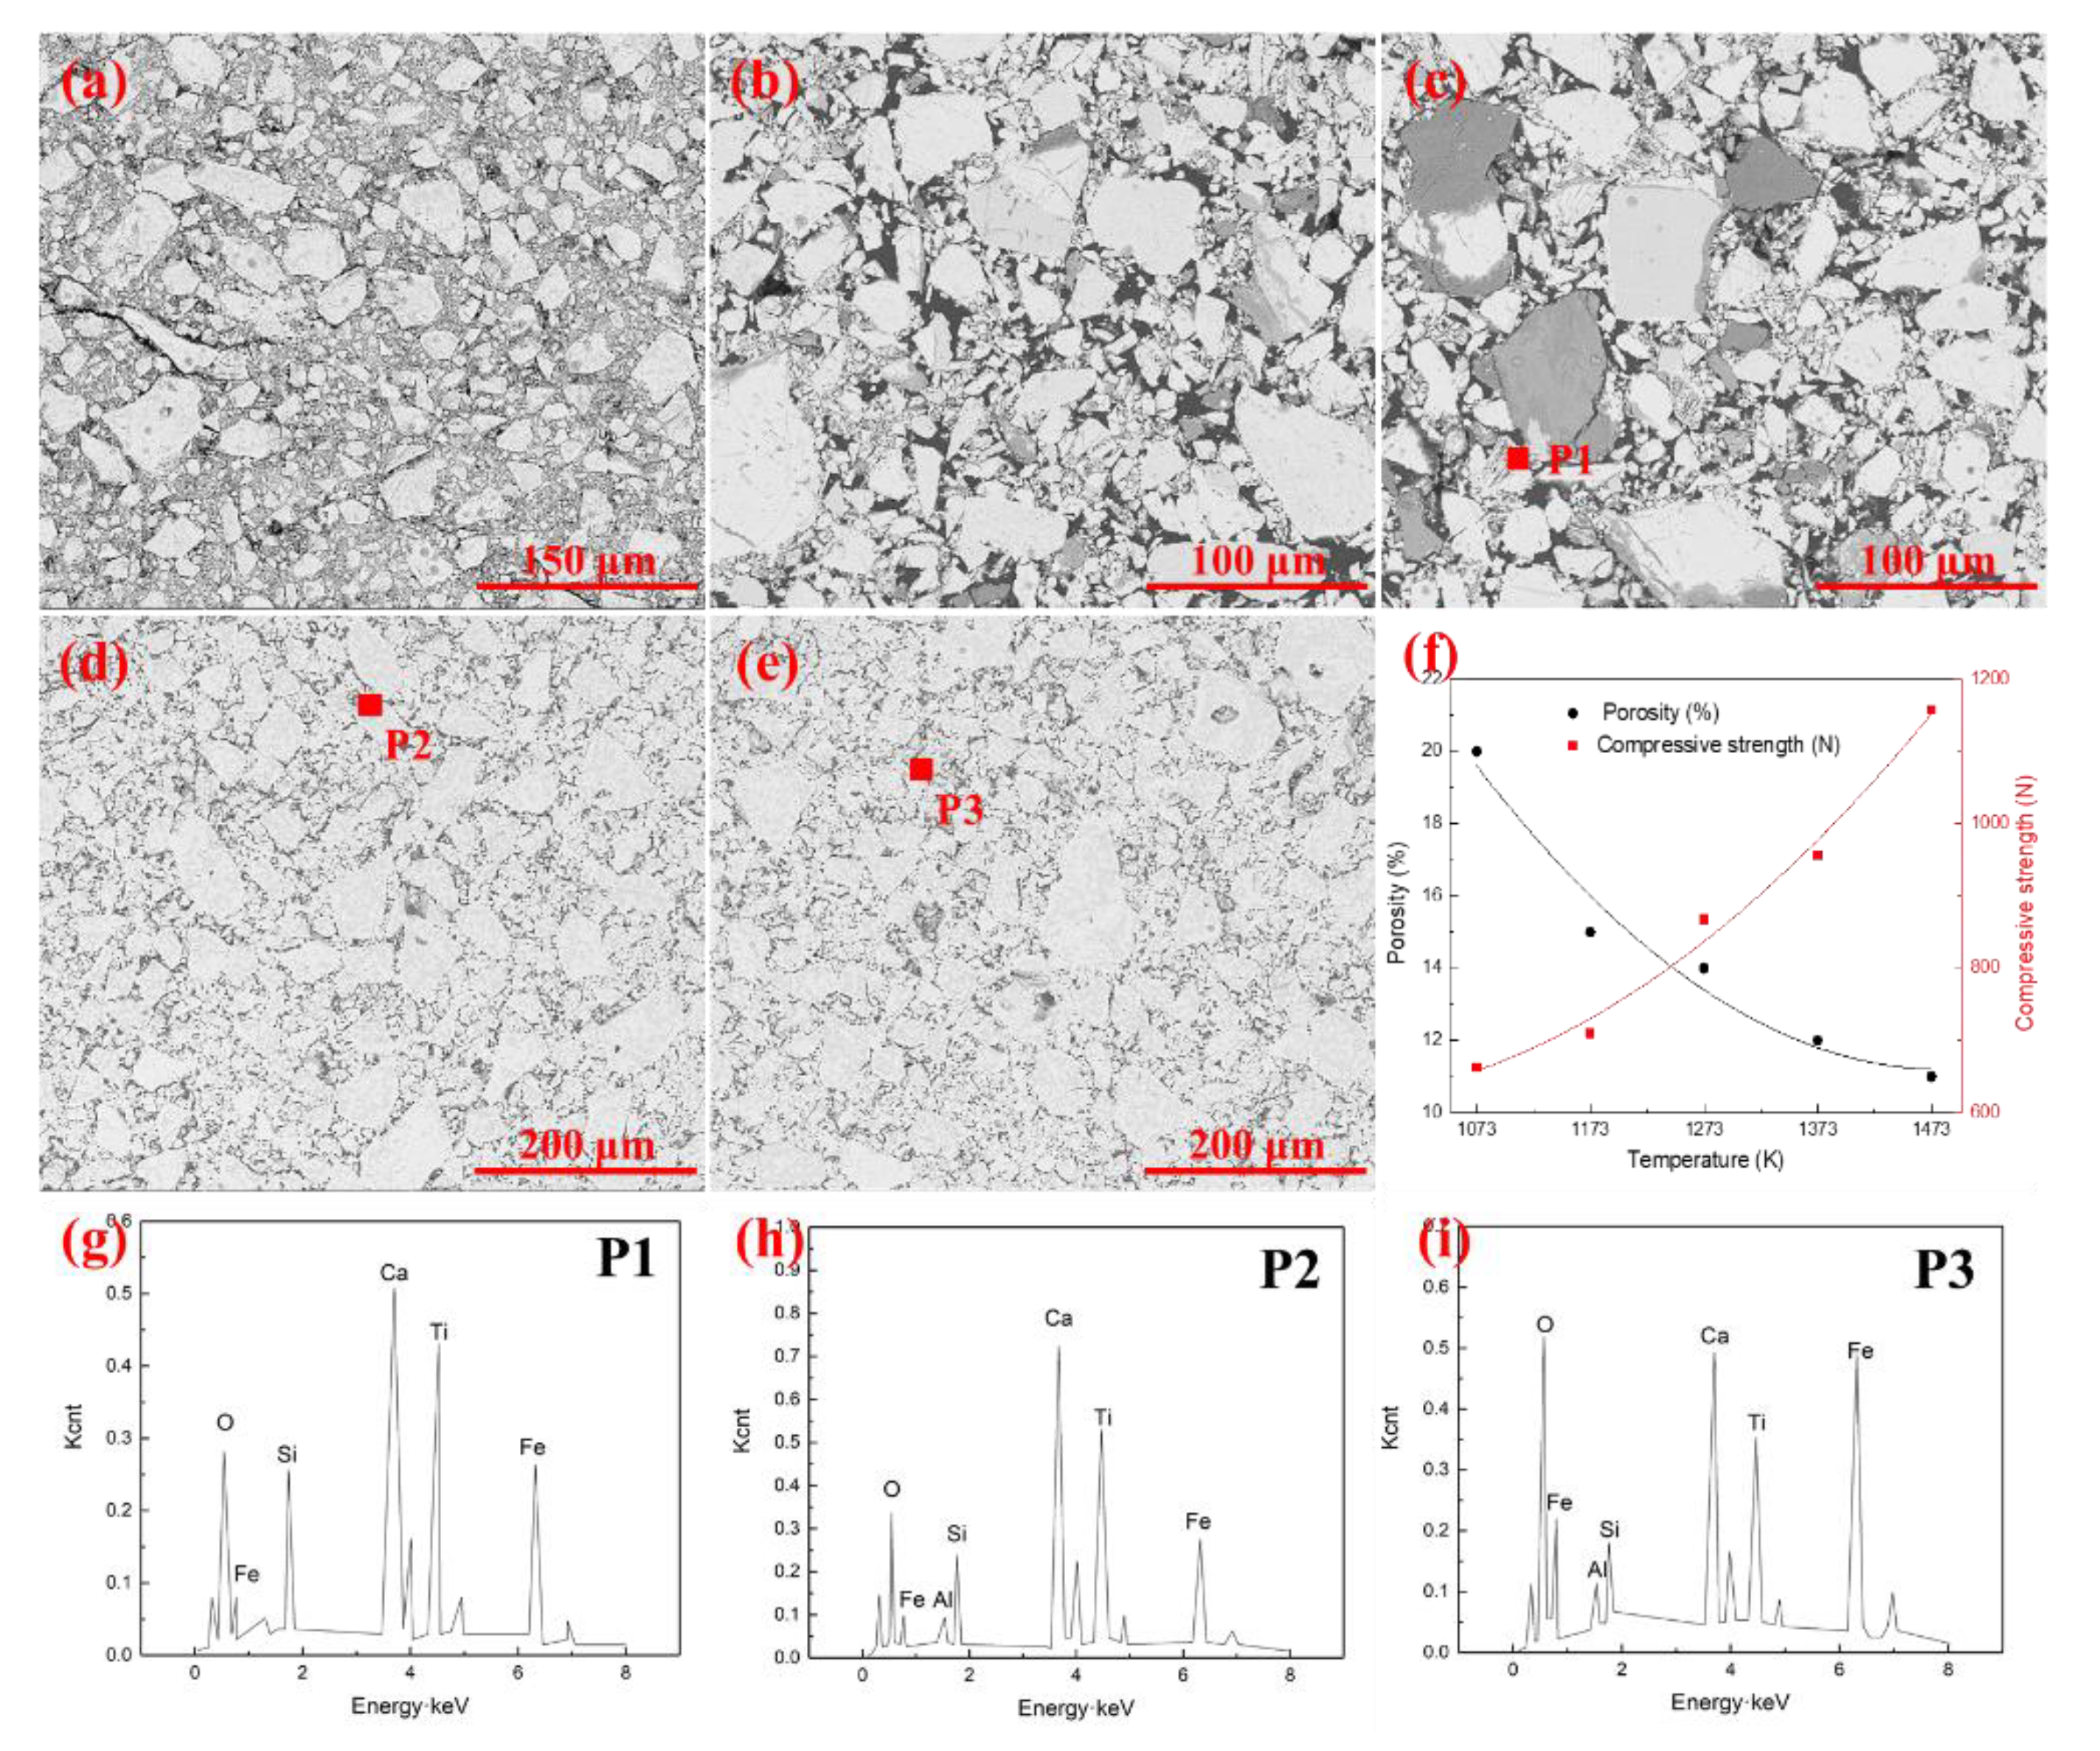
3.2. Effect of Oxidation Temperature on the Microstructure of the Pellets

Figure 4 gives the microstructures of the pellets with the oxidation time of 30 min at a temperature range of 1073–1373 K. The results indicated that the oxidation temperature significantly affected the mineralogical compositions and microstructure. As can be seen from Figure 4a,b, clear boundaries existed between the iron ore particles due to the small amount of liquid phase in the pellets. The pellets were mainly composed of hematite, silicate, magnetite, and ilmenite. The Fe2O3 crystallization started at 1273 K, and some crystalline phases were formed in Figure 4c. As shown in Figure 4, hematite grains grew gradually, and the morphology transformed from graininess to crystal stock with the increase of oxidation temperature. Moreover, the generated liquid phase under high temperature bonded the fine grains together to form a continuous cohesive zone. More liquid phase can also facilitate ion exchange during the oxidation, which is good for crystal growth. The silicate, hematite, magnetite, pseudobrookite, and perovskite in pellets formed the melting corrosion structure under high temperature. The porosity in pellets reduced due to the existence of the liquid phase. Five SEM patterns were randomly selected to calculate the average porosity of the pellets to further confirm the microstructures variation, as shown in Figure 4f. The results indicated that the porosity of the pellets decreased from 20.7% to 11.7% with temperatures ranging from 1073 K to 1473 K. Accordingly, the compressive strength showed the reverse change trend and increased from 663 N to 1157 N.
Figure 4g–i further indicated that the liquid phase in pellets was composed of Fe, O, Si, Ca, Ti, and Al. With the rising of oxidation temperature, the unoxidized magnetite and titanomagnetite reacted with the silicates to form the low melting point silicate liquid phase. The liquid phase composition was similar at different temperatures. In summary, the increase of oxidation temperature was propitious to the growth of grain. For the oxidation of ironsand, the formation of Fe2O3 crystallization was marked when the oxidation temperature was over 1273 K. The decrease of porosity in pellets could enhance the consolidation performance of the pellets, prevent the air diffusion inside the pellets, and slow down the oxidation rate.

3.3. Thermogravimetric Analysis and Reaction Mechanism

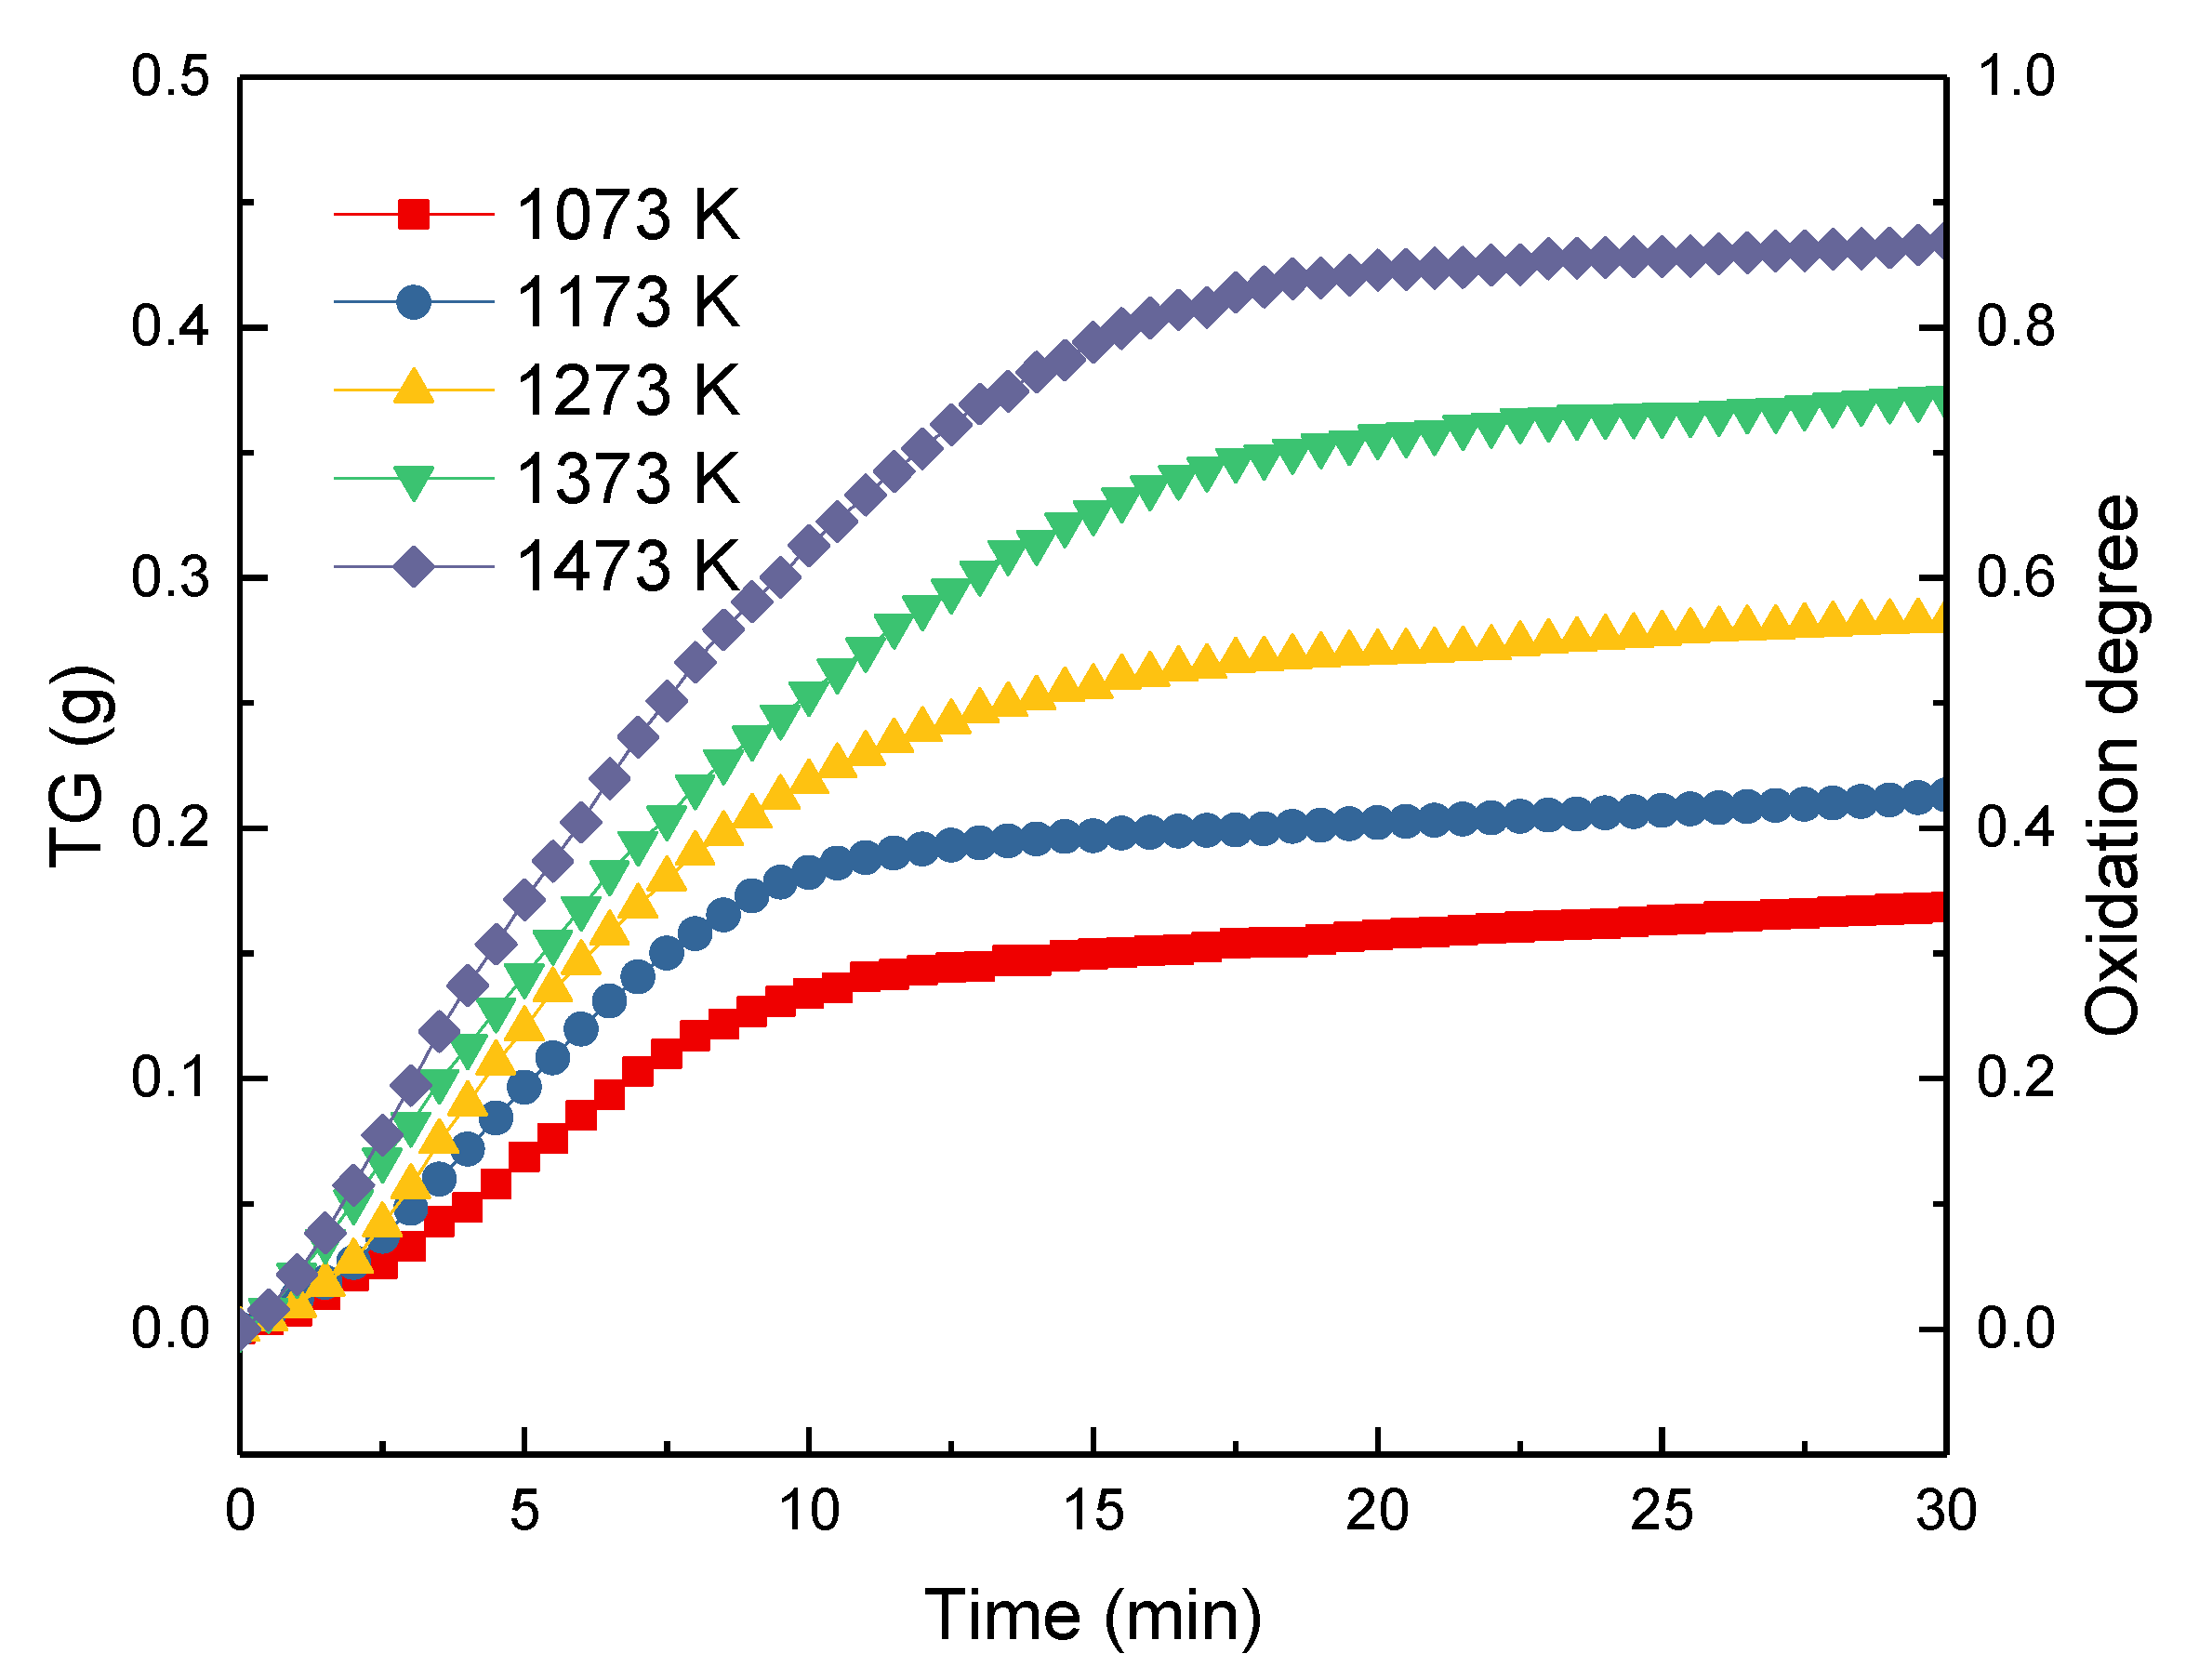
3.3.1. Thermogravimetric Analysis

Figure 5 gives the TG curves and the oxidation degrees during the oxidation of ironsand in the air at the temperatures ranging from 1023 to 1423 K. Due to the oxidization of Fe2+ in the ironsand, the weight of each sample increased as the reaction proceeded. The results also indicated that the increase in reaction temperature could accelerate the oxidation rate. For all the pellets, the reaction rate reached the maximum at the beginning of the reaction and gradually decreased with time. This was mostly because the growth and recrystallization of hematite in the pellets, as well as the formation of silicate liquid phase, promoted the bonding of the small particles. As analyzed in Section 3.2., the shrinkage and consolidation of the pellets could reduce the porosity and prevent the diffusion of the air, which slows down the oxidation rate. As described in Equation (1), the oxidization degree of the pellets defined as α . Δ m and m T respectively represent the mass increase of the pellets and the theoretical maximum increase of the sample mass. As shown in Figure 5, the change rule of the oxidation degrees at different temperatures tends to follow lines similar to the TG curves in Figure 5. The maximum oxidation degrees of the pellets at different temperatures can be obtained in Figure 5. The results further confirmed that the increase of the oxidation temperature could significantly promote the oxidation degree of the pellets from 0.3426 to 0.8833.
α = Δ m m T

3.3.2. Reaction Mechanism

According to Avrami–Erofeev, the relation between oxidation rate and constant reaction rate can be expressed as Equation (2) [22], where α is the oxidation rate; k r is the constant reaction rate; t is the time (min); and n is the Avrami exponent. Equation (2) can also be expressed as Equation (3) after taking the logarithm. Figure 6 gives the relation between ln ( ln ( 1 α ) ) and lnt at different temperatures. The slopes and intercepts of the fitting lines are n and ln k r , respectively. The calculated parameters are summarized in Table 3. The calculated standard deviation in Table 3 was close to 0, which indicated that the obtained model is credible. The results suggested that the oxidation of the pellet had two stages (the early stage of the oxidation and the post-oxidation) as the reaction proceeded. The oxidation temperatures greatly influenced the turning point between the two stages. It can be concluded that the oxidation temperatures and the oxidation time have a great influence on the oxidation rate. The effect of temperature on the oxidation rate of the pellets became stronger with the increase of temperature. While the effect of reaction time on the oxidation rate of the pellets decreased with the extension of time. It can be also concluded that the reaction is mainly controlled by the second stage at 1073, 1173, and 1273 K. The kinetics analysis can be divided into three parts: the early stage of the oxidation, the post-oxidation at 1073–1273 K, and post-oxidation at 1373 and 1473 K.
ln ( 1 α ) = k r t n
ln ( ln ( 1 α ) ) = nln t + ln k r

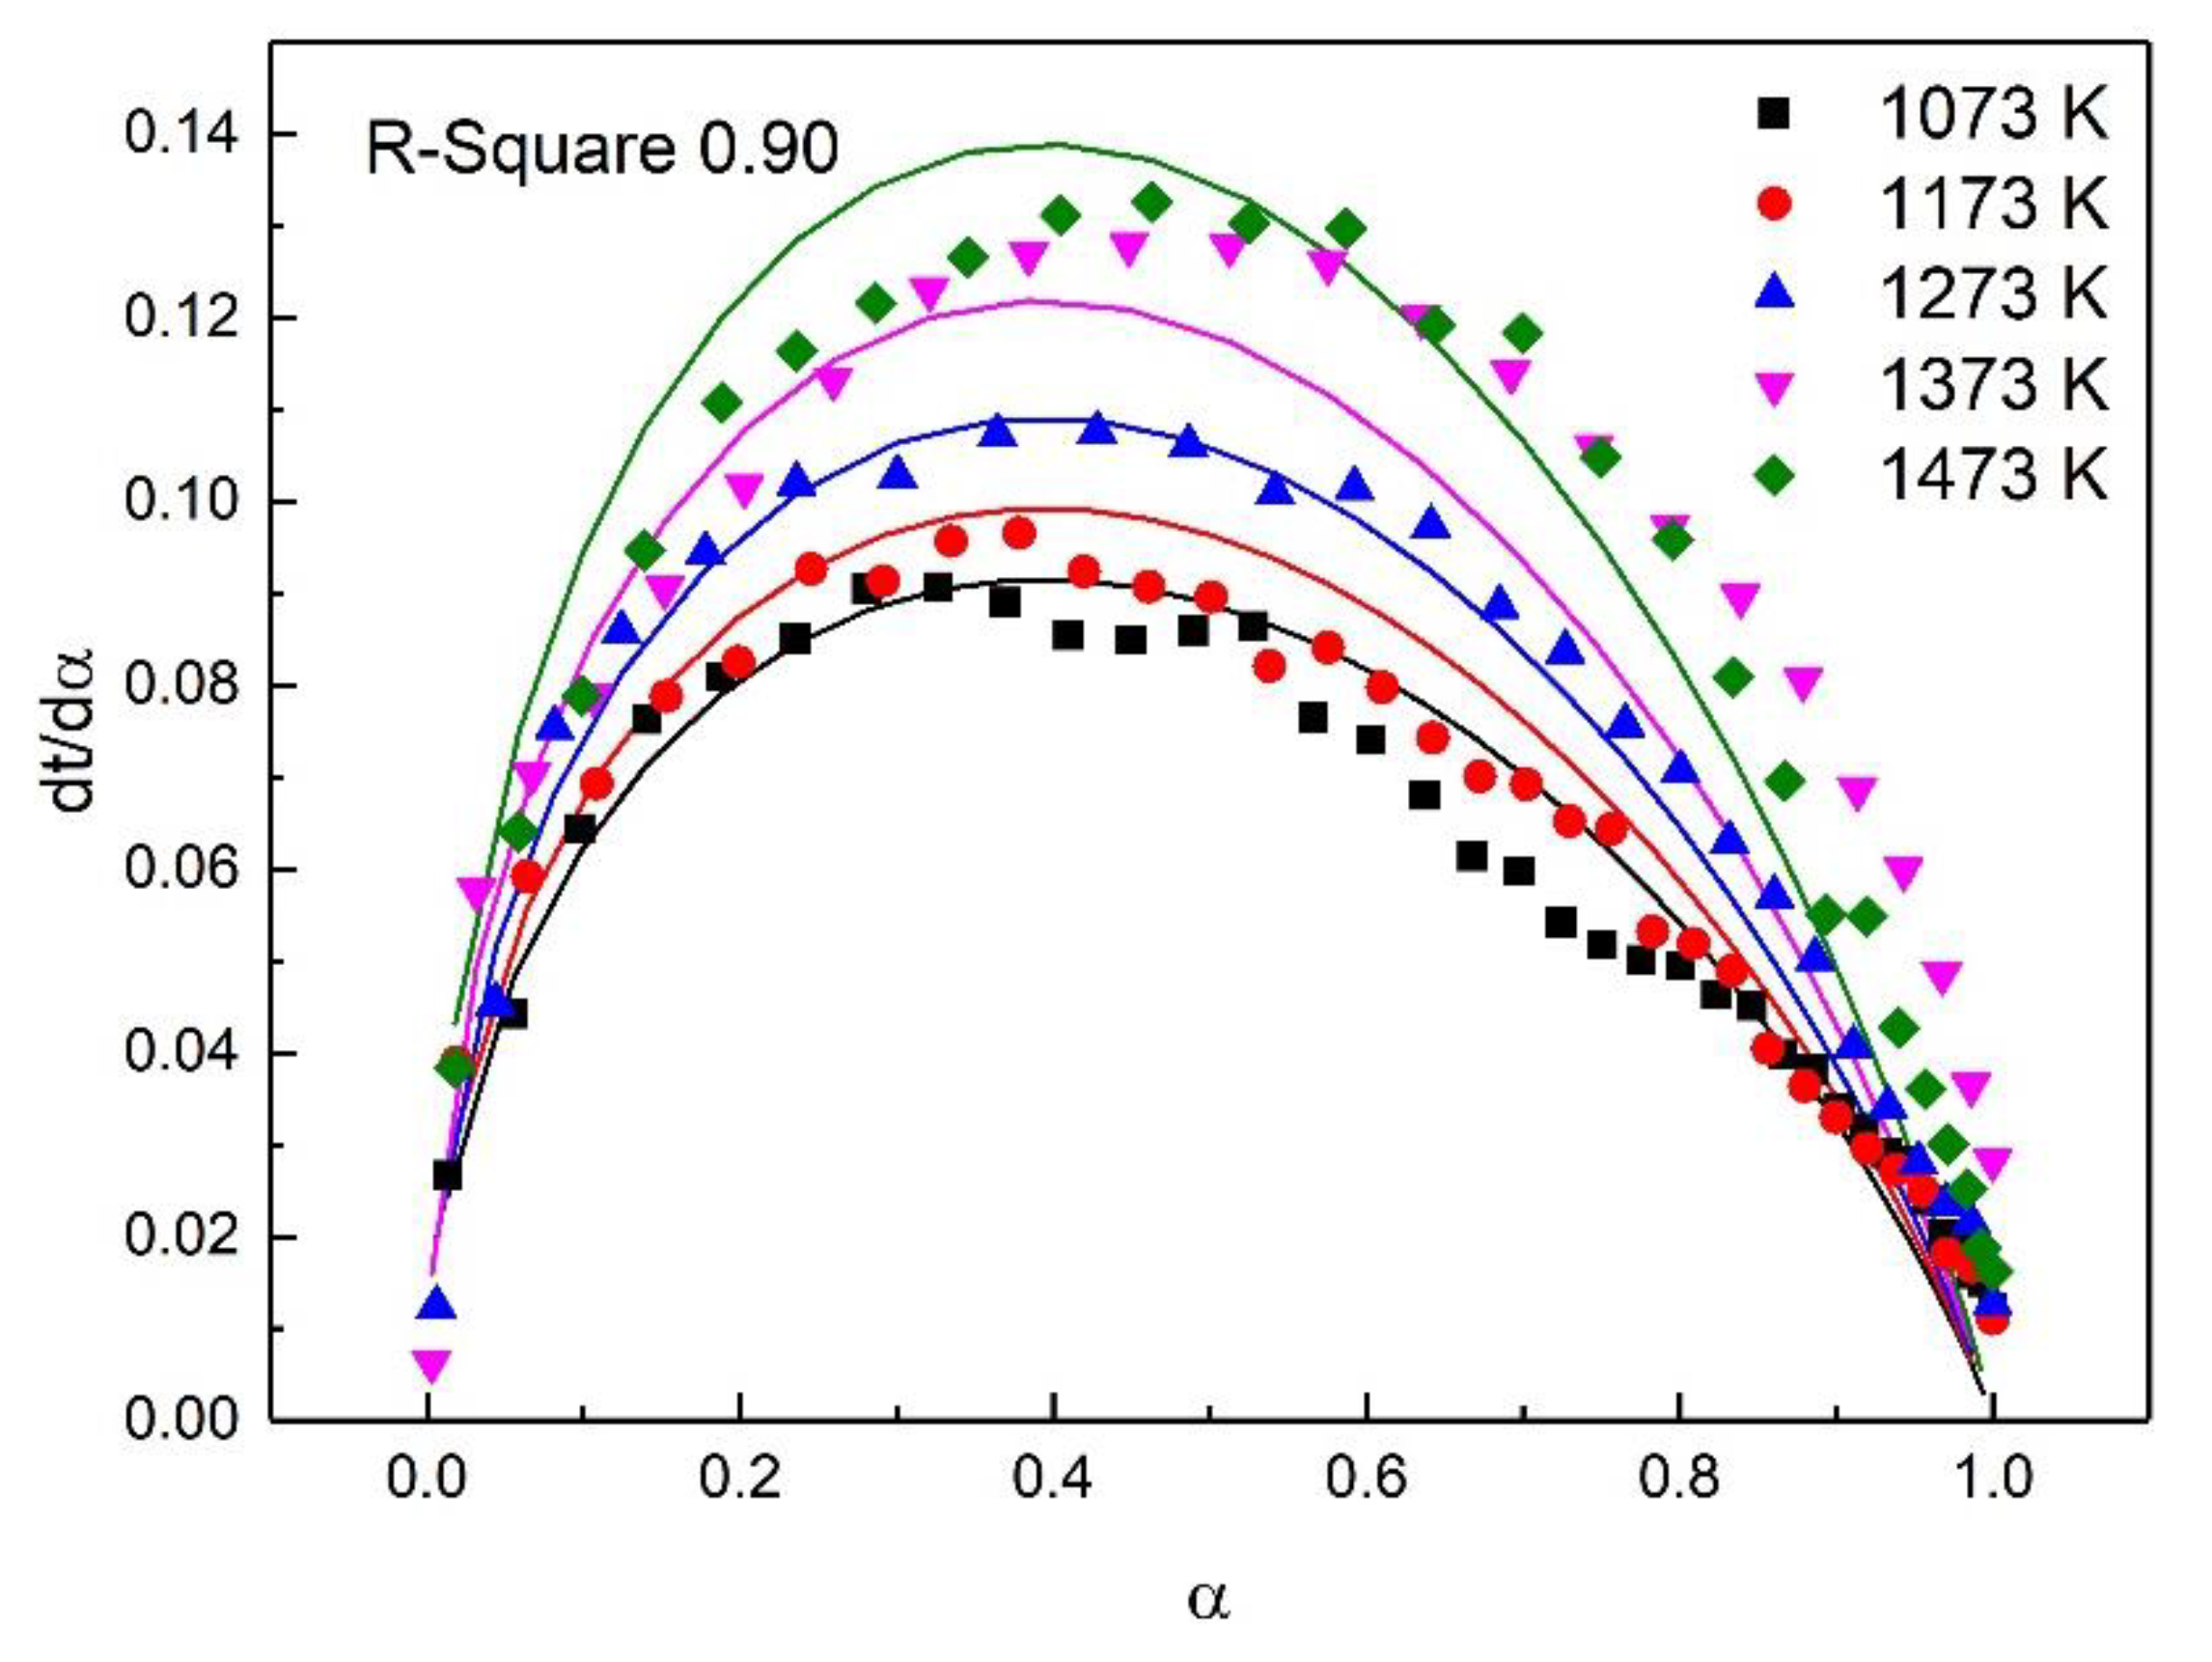
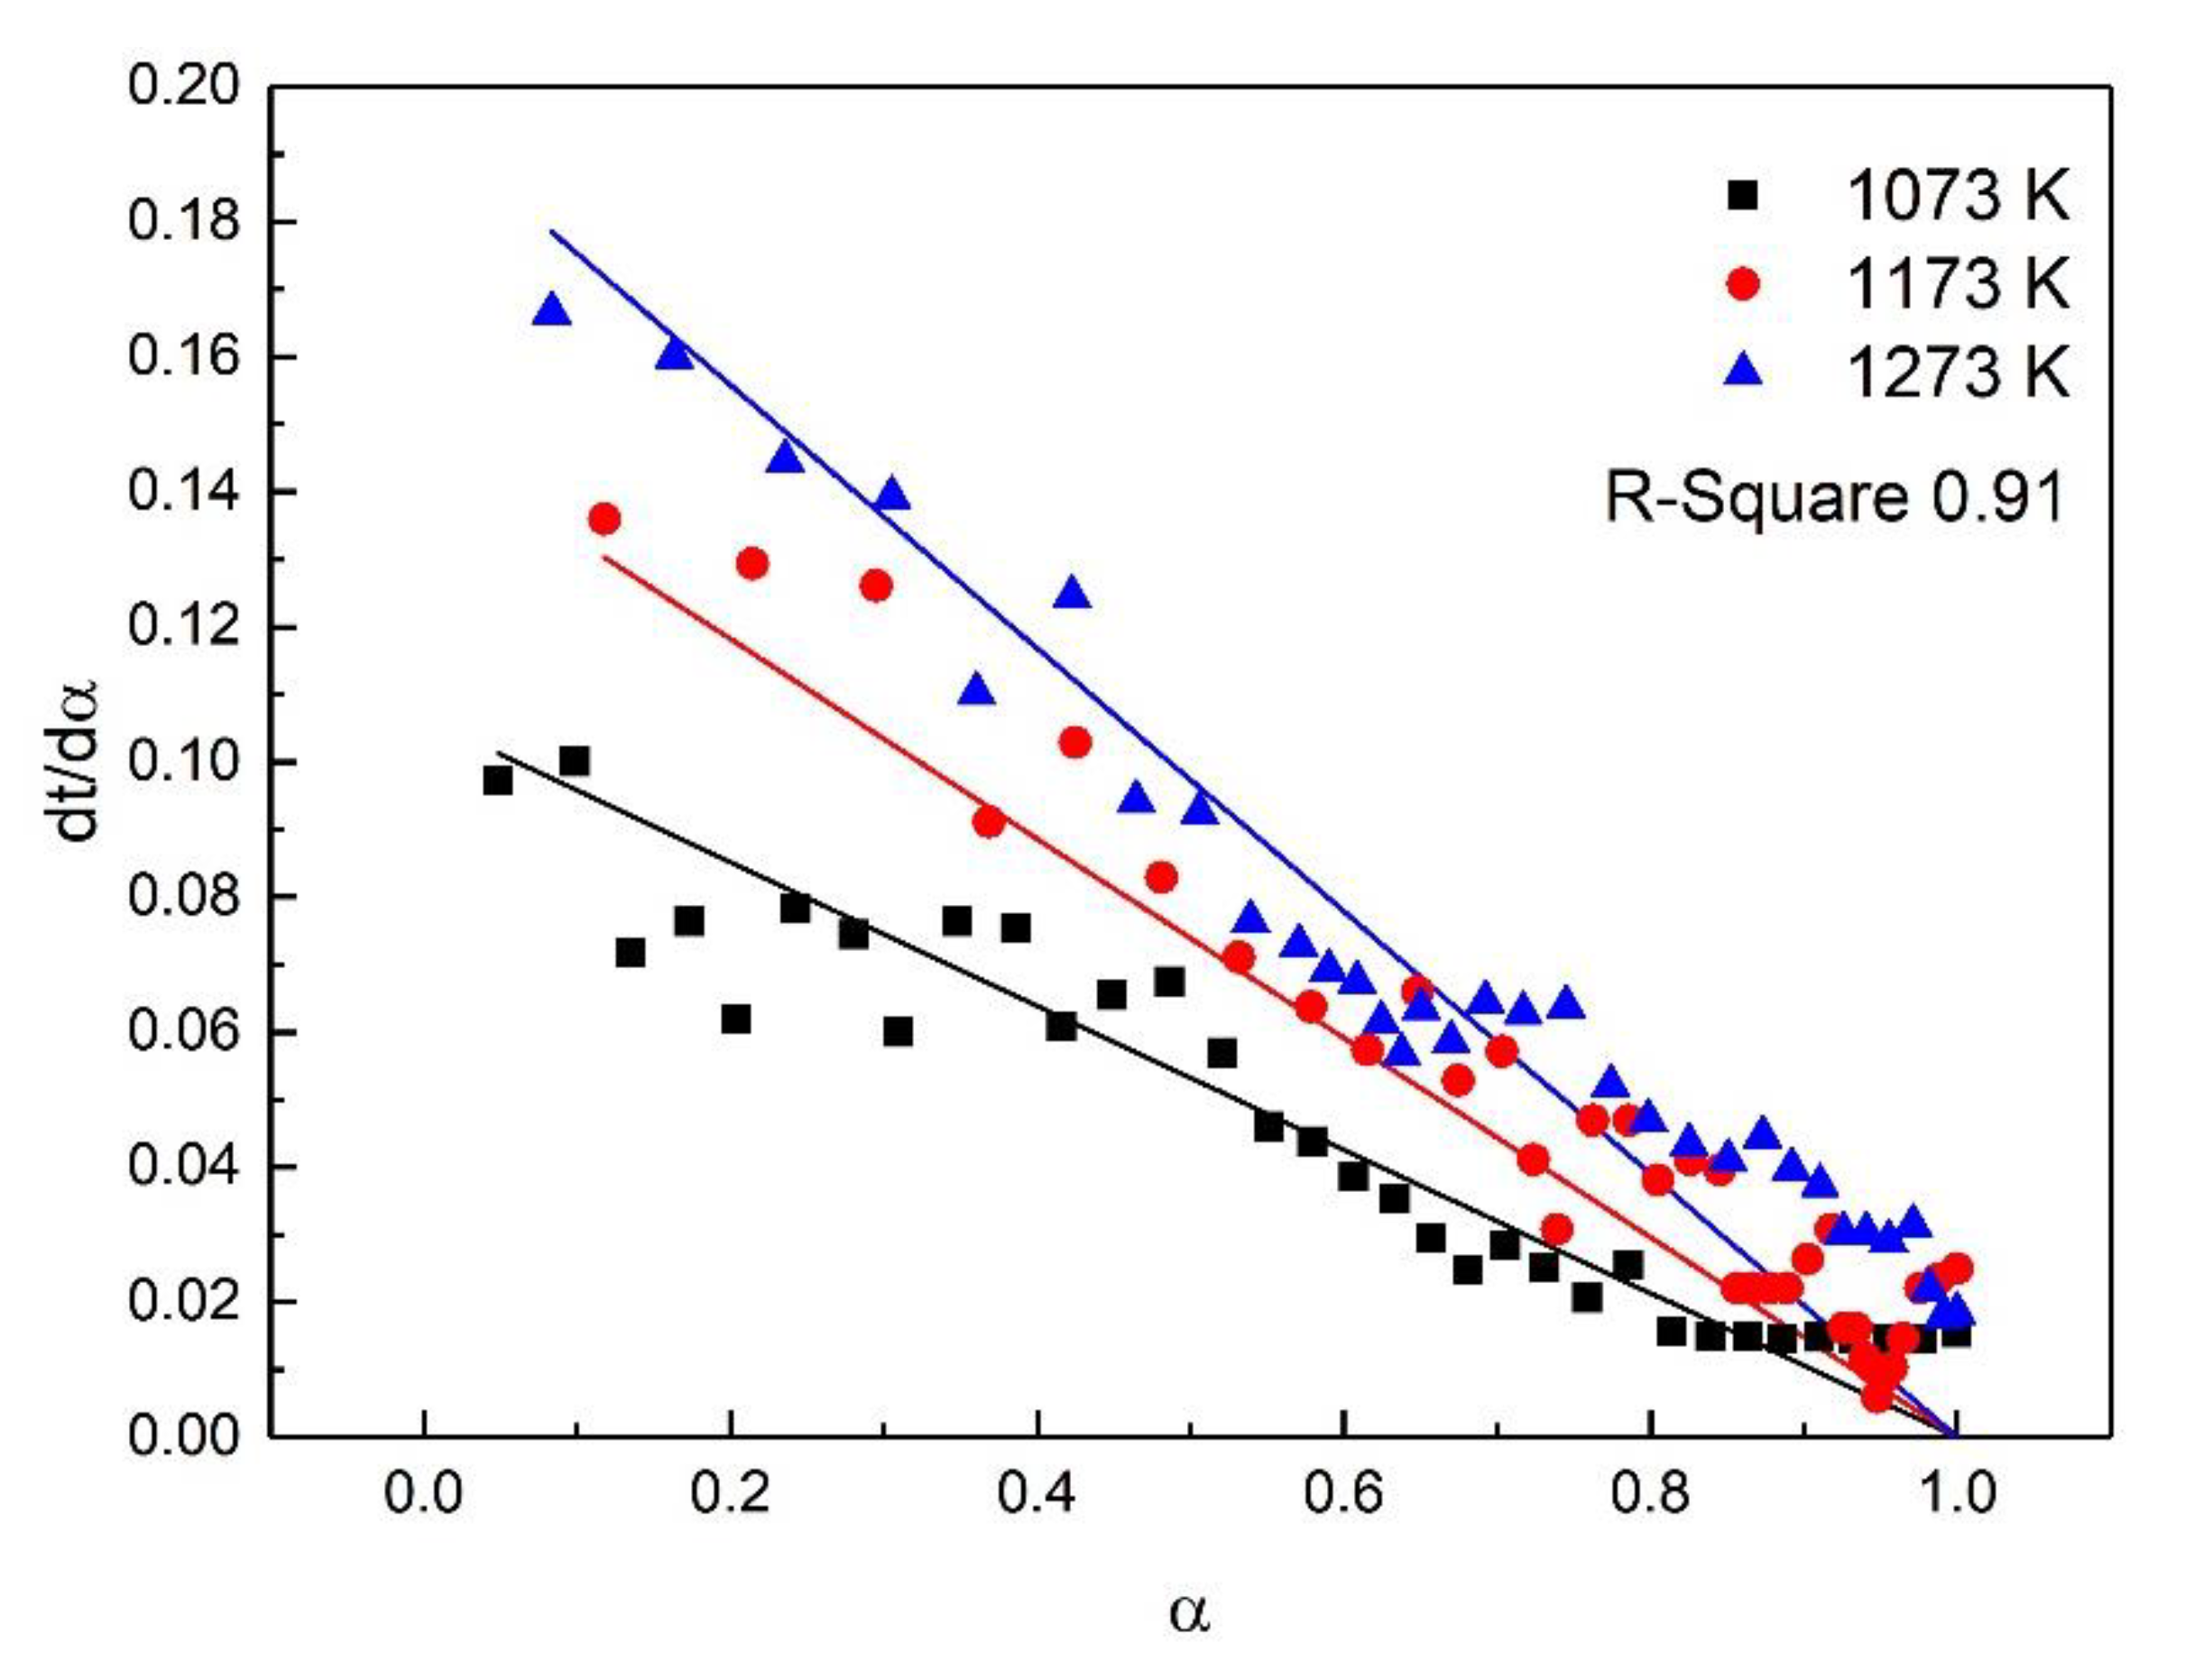
3.4. Oxidation Reaction Kinetics Analysis

As shown in Equation (4), the isothermal conversion rate is a function of time and temperature, where the conversion rate is /dt, s−1; the reaction rate k(T) is a function of temperature; the mechanism function is f(α); and the time is t, s. According to the Arrhenius formula, k(T) can be expressed as Equation (5), where the pre-exponential factor is A, s−1; the activation energy is E, kJ⋅mol−1; and R is the standard molar gas constant, kJ⋅mol−1⋅K−1. Equation (6) can be obtained by combining Equation (5) and Equation (1). Equation (7) can also be expressed as Equation (6) after taking the logarithm.
d α d t = k ( T ) f ( α )
k ( T ) = A exp ( E R T )
d α d t = A exp ( E R T ) f ( α )
ln d α d t = ln A E R T + ln f ( α )
For the study of reaction kinetics, researchers have developed a lot of models. As summarized in Table 4, these models can be categorized into nucleation, geometric contraction, diffusion, and reaction-order models [23]. All the models in Table 4 have been tested for the reaction. The calculated data of different mechanism functions indicated that the chemical reaction mechanism for the early stage of the oxidation fit A2 well with the R-square value of 0.90, the chemical reaction mechanism for the post-oxidation at 1073–1273 K fit F1 well with the R-square value of 0.91, and the chemical reaction mechanism for the post-oxidation at 1373 and 1473 K fit D4 well with the R-square value of 0.97. The comparisons between the theoretical curves and the experimental curves for the early stage of the oxidation, the post-oxidation at 1073–1273 K, and the post-oxidation at 1373 and 1473 K are drawn in Figure 7, Figure 8 and Figure 9, respectively. The activation energies of ironsand pellets were calculated by using the model-function method. For the early stage of the oxidation, the reaction mechanism was random nucleation and nuclei growth (A2) due to the formation of new phases which was consistent with the results of the study [24,25]. For the post-oxidation, the reaction mechanism was chemical reaction (F2) at the temperatures of 1073, 1173, and 1273 K. As indicated in Figure 6, the increase of oxidation temperature could significantly increase the oxidation degree. This means that for the post-oxidation at the relative low temperature, the oxidation of ironsand pellets was mainly controlled by chemical reaction. However, with the increase of reaction temperature, the reaction mechanism was the three-dimension diffusion control (D4) at the temperature of 1373 and 1473 K. Due to the growth and recrystallization of hematite, as well as the formation of silicate liquid phase, the porosity of the pellets sharply decreased, which prevented the air diffusion inside the pellets and slowed down the oxidation rate. Table 5 summarizes the apparent activation energy obtained through Equation (7). The calculation results were as follows: for the early stage of the oxidation E = 15.39 kJ/mol, and A = 0.77; for the post-oxidation at 1073, 1173, and 1273 K, E = 34.29 kJ/mol and A = 4.97; for the post-oxidation at 1373 and 1473 K, E = 13.88 kJ/mol and A = 0.23.

4. Conclusions

The mineralogical characteristics and isothermal oxidation kinetics of ironsand pellets in air were investigated through a series of experiments. (1) The quantitative analysis of mineral composition through XRD-Rietveld indicated that the mineral composition of the ironsand was magnetite (22.7%), titanomagnetite (40.9%), enstatite (17.1%), hematite-ilmenite solid solution (14.5%), and magnesium iron aluminum silicon oxide (5.8%). SEM-EDS patterns of ironsand suggested that iron oxides in ironsand were the heterogeneous particle with the layered phases deposited on the substrate at an angle and the homogeneous particle with smooth surface and relatively average element distribution.
(2) The mineralogical compositions and microstructure of pellets after oxidation were characterized by SEM. The results showed that the porosity of the pellets decreased from 20.7% to 11.7% with temperatures ranging from 1073 to 1473 K. Accordingly, the compressive strength showed the reverse change trend and increased from 663 to 1157 N.
(3) The oxidation of the ironsand pellets had two stages as the reaction proceeded. The calculated data of different mechanism functions indicated that the chemical reaction mechanism for the early stage of the oxidation fit A2 well, the chemical reaction mechanism for the post-oxidation at 1073–1273 K fit F1 well, and the chemical reaction mechanism for the post-oxidation at 1373 and 1473 K fit D4 well. Kinetic studies showed that for the early stage of the oxidation E = 15.39 kJ/mol, and A = 0.77; for the post-oxidation at 1073, 1173, and 1273 K, E = 34.29 kJ/mol and A = 4.97; for the post-oxidation at 1373 and 1473 K, E = 13.88 kJ/mol and A = 0.23.

Author Contributions

Conceptualization, Y.W. and Z.L.; methodology, Y.W. and Z.L.; software, Y.W.; validation, Y.W., Z.L. and J.Z.; formal analysis, Y.W. and Z.L.; investigation, Y.W.; resources, J.Z. and Z.L.; writing (original draft preparation), Y.W.; writing (review and editing), visualization, Y.W. and Z.L.; supervision, Z.L. and J.Z.

Funding

The authors acknowledge the financial support of the National Natural Science Foundation of China (51874025), and the National Key R&D Program of China (2017YFB0304300 & 2017YFB0304302). Yaozu Wang gratefully acknowledges financial support from China Scholarship Council for one year study at the Montanuniversitaet Leoben, Austria.

Conflicts of Interest

The authors declare no conflict of interest.

References

  1. Liang, X.; Zhong, Y.; Zhu, S.; Zhu, J.; Yuan, P.; He, H.; Zhang, J. The decolorization of Acid Orange II in non-homogeneous Fenton reaction catalyzed by natural vanadium–titanium magnetite. J. Hazard. Mater. 2010, 181, 112–120. [Google Scholar] [CrossRef] [PubMed]
  2. Liu, J.; Cheng, G.; Liu, Z.; Chu, M.; Xue, X. Reduction process of pellet containing high chromic vanadium–titanium magnetite in cohesive zone. Steel Res. Int. 2015, 86, 808–816. [Google Scholar] [CrossRef]
  3. Liu, S.; Guo, Y.; Qiu, G.; Jiang, T. Solid-state reduction kinetics and mechanism of pre-oxidized vanadium–titanium magnetite concentrate. Trans. Nonferrous Met. Soc. China 2014, 24, 3372–3377. [Google Scholar] [CrossRef]
  4. Wang, Y.-Z.; Zhang, J.-L.; Liu, Z.-J.; Du, C.-B. Carbothermic reduction reactions at the metal–slag interface in Ti-bearing slag from a blast furnace. JOM 2017, 69, 2397–2403. [Google Scholar] [CrossRef]
  5. Zhang, J.; Chen, B. Occurrence and recycling of main elements in Panxi vanadium-titanium magnetite. Conserv. Util. Miner. Resour. 2008, 5, 12. [Google Scholar]
  6. Liang, X.; Zhu, S.; Zhong, Y.; Zhu, J.; Yuan, P.; He, H.; Zhang, J. The remarkable effect of vanadium doping on the adsorption and catalytic activity of magnetite in the decolorization of methylene blue. Appl. Catal. B Environ. 2010, 97, 151–159. [Google Scholar] [CrossRef]
  7. Qin, J.; Xue, X.; Deng, J. Study on CO2 emission in the process of dealing with vanadium-titanium magnetite. In Proceedings of the 2011 International Conference on Materials and Products Manufacturing Technology, Chengdu, China, 28–30 October 2011; Trans Tech Publications: Zurich, Switzerland, 2011; pp. 125–132. [Google Scholar]
  8. Li, H.; Wang, H.; Qing, S.; Hu, J.; Li, Y.; Hou, Y.; Hu, L.; Li, L. Energy conservation and emissions reduction in iron and steel industry. In Proceedings of the Third International Conference on Measuring Technology and Mechatronics Automation, Shangshai, China, 6–7 January 2011; pp. 41–44. [Google Scholar]
  9. Yu, C.; Li, H.; Jia, X.; Li, Q. Improving resource utilization efficiency in China’s mineral resource-based cities: A case study of Chengde, Hebei province. Resour. Conserv. Recycl. 2015, 94, 1–10. [Google Scholar] [CrossRef]
  10. Shi, L.; Liu, Y.; Huang, J.; Zhang, S.; Zhao, X. Growth kinetics of cubic carbide free layers in graded cemented carbides. Int. J. Miner. Metall. Mater. 2012, 19, 64–71. [Google Scholar] [CrossRef]
  11. Smolik, J.; Zdunek, K.; Larisch, B. Investigation of adhesion between component layers of a multi-layer coating TiC/Ti (Cx, N1−x)/TiN by the scratch-test method. Vacuum 1999, 55, 45–50. [Google Scholar] [CrossRef]
  12. Wang, Y.; Zhang, J.; Liu, Z.; Zhang, Y.P.; Liu, D.H.; Du, C.B. Effects of w(TiO2) on mineral structure and softening-melting property of sinter. Iron Steel 2017, 52, 20–28. [Google Scholar]
  13. Dehghan-Manshadi, A.; Manuel, J.; Hapugoda, S.; Ware, N. Sintering characteristics of titanium containing iron ores. ISIJ Int. 2014, 54, 2189–2195. [Google Scholar] [CrossRef]
  14. Zhou, M.; Yang, S.; Jiang, T.; Xue, X. Influence of basicity on high-chromium vanadium-titanium magnetite sinter properties, productivity, and mineralogy. JOM 2015, 67, 1203–1213. [Google Scholar] [CrossRef]
  15. Paananen, T.; Kinnunen, K. Effect of TiO2-content on reduction of iron ore agglomerates. Steel Res. Int. 2009, 80, 408–414. [Google Scholar]
  16. Liu, Z.; Chu, M.; Wang, H.; Zhao, W.; Xue, X. Effect of MgO content in sinter on the softening–melting behavior of mixed burden made from chromium-bearing vanadium–titanium magnetite. Int. J. Miner. Metall. Mater. 2016, 23, 25–32. [Google Scholar] [CrossRef]
  17. Han, G.; Jiang, T.; Zhang, Y.; Huang, Y.; Li, G. High-temperature oxidation behavior of vanadium, titanium-bearing magnetite pellet. J. Iron Steel Res. Int. 2011, 18, 14–19. [Google Scholar] [CrossRef]
  18. Li, W.; Fu, G.-Q.; Chu, M.-S.; Zhu, M.-Y. Oxidation induration process and kinetics of Hongge vanadium titanium-bearing magnetite pellets. Ironmak. Steelmak. 2017, 44, 294–303. [Google Scholar] [CrossRef]
  19. Tang, J.; Zhang, Y.; Chu, M.; Xue, X. Preparation of oxidized pellets with high Chromium Vanadium-Titanium Magnetite. J. Northeast. Univ. Nat. Sci. 2013, 4, 22. [Google Scholar]
  20. Wang, Y.; Liu, Z.; Zhang, J.; Du, C.; Niu, L. Central band structures: New insights into the coupling effects between the pores and minerals of sinter. Metall. Mater. Trans. B 2019. [Google Scholar] [CrossRef]
  21. Bartels, W.J.; Hornstra, J.; Lobeek, D.J.W. X-ray diffraction of multilayers and superlattices. Acta Crystallogr. Sect. A 1986, 42, 539–545. [Google Scholar] [CrossRef] [Green Version]
  22. Tan, S.; Su, A.; Li, W.; Zhou, E. New insight into melting and crystallization behavior in semicrystalline poly (ethylene terephthalate). J. Polym. Sci. B Polym. Phys. 2000, 38, 53–60. [Google Scholar] [CrossRef]
  23. Lv, W.; Lv, X.; Zhang, Y.; Li, S.; Tang, K.; Song, B. Isothermal oxidation kinetics of ilmenite concentrate powder from Panzhihua in air. Powder Technol. 2017, 320, 239–248. [Google Scholar] [CrossRef]
  24. Rekoske, J.E.; Barteau, M.A. Isothermal reduction kinetics of titanium dioxide-based materials. J. Phys. Chem. B 1997, 101, 1113–1124. [Google Scholar] [CrossRef]
  25. Zhang, Y.; Lü, W.; Lü, X.; Li, S.; Bai, C.; Song, B.; Han, K. Isothermal reduction kinetics of Panzhihua ilmenite concentrate under 30vol% CO–70vol% N 2 atmosphere. Int. J. Miner. Metall. Mater. 2017, 24, 240–248. [Google Scholar] [CrossRef]
Figure 1. Schematic of electric tube furnace.
Metals 09 00265 g001
Figure 2. Rietveld refinement of the obtained XRD pattern for the ironsand.
Metals 09 00265 g002
Figure 3. SEM and energy dispersive X-ray spectroscopy (EDS) images of the morphology of the ironsand. (af) SEM images of ironsand particles. (P1P6) indicated the EDS results in the SEM patterns.
Metals 09 00265 g003
Figure 4. SEM images of pellets under different oxidation temperature. (a) 1073 K; (b) 1173 K; (c) 1273 K; (d) 1373 K; (e) 1473 K; (f) Porosity and compressive strength of pellets after oxidation; (g) EDS pattern of P1; (h) EDS pattern of P2; (i) EDS pattern of P3.
Metals 09 00265 g004
Figure 5. Thermal Gravity (TG) curves and oxidation degrees variation of ironsand at different temperatures.
Metals 09 00265 g005
Figure 6. The relation between ln ( ln ( 1 α ) ) and lnt at different temperatures. (a) 1073 K; (b) 1173 K; (c) 1273 K; (d) 1373 K; (e) 1473 K.
Metals 09 00265 g006
Figure 7. Comparison of theoretical–experimental curves for the early stage of the oxidation.
Metals 09 00265 g007
Figure 8. Comparison of theoretical–experimental curves for the post-oxidation at 1073, 1173, and 1273 K.
Metals 09 00265 g008
Figure 9. Comparison of theoretical–experimental curves for the post-oxidation at 1373 and 1473 K.
Metals 09 00265 g009
Table 1. Chemical analysis results of typical magnetite (mass, %).
ItemTotal FeFeOSiO2Al2O3CaOMgOTiO2V2O5PK2ONa2O
Ironsand55.6329.604.133.380.603.7411.410.760.030.020.02
Table 2. XRD-Rietveld quantitative analysis of the mineral phase in the ironsand (mass ratio, %).
PhaseChemical FormulaQuantitative Analysis
MagnetiteFe3O421.7
TitanomagnetiteFe2.814Ti0.186O440.9
EnstatiteMg1.56Fe0.44Si2O617.1
Hematite–ilmenite solid solutionFe1.696Ti0.228O314.5
Magnesium iron aluminum silicon oxideAl0.205Fe0.281Mg0.719O3Si0.7955.8
Table 3. Important data-fitting parameters at different temperatures.
PeriodTemp (K)10731173127313731473
First stageSlope (n)1.397 ± 0.0201.383 ± 0.0181.341 ± 0.0371.180 ± 0.0101.256 ± 0.013
Intercept (lnkr)−4.159 ± 0.030−3.821 ± 0.027−3.428 ± 0.054−2.898 ± 0.020−2.923 ± 0.030
α0–0.2090–0.3330–0.4670–0.7740–0.844
R-Square0.9970.9970.9820.9980.996
Standard deviation0.0470.0430.0850.0410.060
Second stageSlope (n)0.303 ± 0.0060.103 ± 0.0100.254 ± 0.0160.289 ± 0.0130.188 ± 0.021
Intercept (lnkr)−1.889 ± 0.020−0.971 ± 0.030−0.949 ± 0.045−0.382 ± 0.041−0.104 ± 0.065
α0.280–0.3400.333–0.4100.468–0.5910.774–0.8350.844–0.875
R-Square0.9810.9250.9550.9600.813
Standard deviation0.0150.0210.0360.0010.011
Table 4. The common mechanism functions (data from [23]).
MechanismCodeDifferential FormIntegral FormR-square
Stage 1Stage 2Stage 3
Chemical reactionn = 1F1(1 − α)−ln(1 − α)−0.570.900.75
n = 2F2(1 − α)2(1 − α)−1 − 1−1.850.510.91
n = 3F3(1 − α)3[(1 − α)−1 − 1]/2−2.600.060.89
DiffusionThe two- dimension Diffusion controlD2[−ln(1 − α)]−1(1 − α)ln(1 − α)+α−4.11−0.110.96
The two- dimension Diffusion controlD31.5(1 − α)2/3[1 − (1 − α)1/3]−1[1 − (1 − α)1/3]2−4.21−0.420.88
The three- dimension Diffusion controlD41.5[(1 − α)1/3 − 1]−1(1 − 2α/3) − (1 − α)2/3−4.210.020.97
Random nucleation and nuclei growthTwo dimensionA22(1 − α) [−ln(1 − α)]1/2[−ln(1 − α)]1/20.910.560.20
Three dimensionA33(1 − α) [−ln(1 − α)]2/3[−ln(1 − α)]1/30.880.330.02
Exponential nucleationPower series law, n = 1/2P21/2α1/2−0.72−0.60−0.40
Power series law, n = 1/3P32/3α1/3−1.05−0.76−0.48
Power series law, n = 1/4P43/4α1/4−1.20−0.83−0.52
Phase boundary reactionCylindrical symmetryR22(1 − α)1/21 − (1 − α)1/20.270.830.48
Spherical symmetryR33(1 − α)2/31 − (1 − α)1/30.020.890.59
Table 5. Activation energy of the isothermal oxidation of ironsand pellets at different temperatures.
StageEarly Stage of the OxidationPost-OxidationPost-Oxidation
Fitting ModelA2F2D4
Temp (K)1073–14731073–12731373–1473
E (KJ/mol)15.3934.2913.88
A0.774.970.23
R-square0.900.910.97

