Abstract
According to European regulations, indium and germanium are critical metals. Therefore, their recovery is a crucial issue. The present study was focused on the pyrometallurgical treatment of polymetallic PbSnIn and PbSnCuGeIn generated at the Miasteczko Zinc Smelter in order to recover In and Ge. The paper presents the production process of these alloys, as well as their characteristics. The materials were subjected to thermal processing in a laboratory-scale refining kettle fired with natural gas and air. Two different methods for the processing of the individual alloys are described. Two series (one for each material) consisting of five tests were performed in order to determine the optimal metal recovery parameters. The described pyrometallurgical process resulted in the production of an indium-enriched semi-product (In—1.15%) and a Ge–In-enriched product (Ge—11.1%, In—3.0%). Direct indium recovery rates were approximately 83% and >99%, respectively.
1. Introduction
On the basis of the List of Critical Raw Materials for the EU [1], germanium and indium are critical materials, which need to be processed and recovered efficiently in order to fulfill the requirements of the circular economy. Germanium does not exist in its elemental form in nature, but it can be found in a relatively small number of mineral ores. It is present in certain types of coal, and is concentrated in the fly ash from coal-fired power stations. Such coals are found in parts of Russia and China [2]. Ge concentrations in processed materials are usually not high. Chinese and Russian coal ash contain 0.3–0.5% Ge [3], while European coal ash contains up to 400 ppm Ge [4]. Ash containing less than 15 ppm Ge is not considered as a source of germanium [5]. Residues from zinc plants contain up to 0.60% Ge [6,7,8,9]. Indium is less abundant than germanium. Its concentration in the Earth’s crust is estimated at 0.05–0.20 ppm [10]. Indium does not occur naturally in its native state, but is found as a trace element in a number of sulfide minerals. Zinc-bearing minerals typically contain the highest concentration of indium, followed by lead and copper minerals. As such, indium is most commonly recovered during the production and refining of zinc [2].
Germanium and indium can be recovered from the multicomponent alloys produced from the New Jersey (NJ) process [11]. Those alloys contain high levels of germanium (approx. 10%) and indium (approx. 2%), which are not currently recovered. The aim of this research work was to develop a method for the recovery of these critical metals.
Two polymetallic alloys (i.e., PbSnIn and PbSnCuGeIn) which contain germanium, indium, and tin are produced during the rectification process in HCM (Huta Cynku Miasteczko, Miasteczko Zinc Smelter, Miasteczko Śląskie, Poland). The process is carried out in a reboiling column of the 160-tonne furnace. The first alloy (PbSnIn) is cast in 2-t blocks and is used to produce crude lead without the possibility of recovering indium and tin.
The second alloy (i.e., Zn–PbSnCuGeIn) is subjected to a zinc removal process in a Faber furnace at approximately 1200 °C under atmospheric pressure in order to recover metallic zinc and produce the polymetallic PbSnCuGeIn alloy. Currently, this alloy is a subject of research in the Miasteczko Zinc Smelter with the aim of recovering Ge and In in the form of a marketable GeIn concentrate.
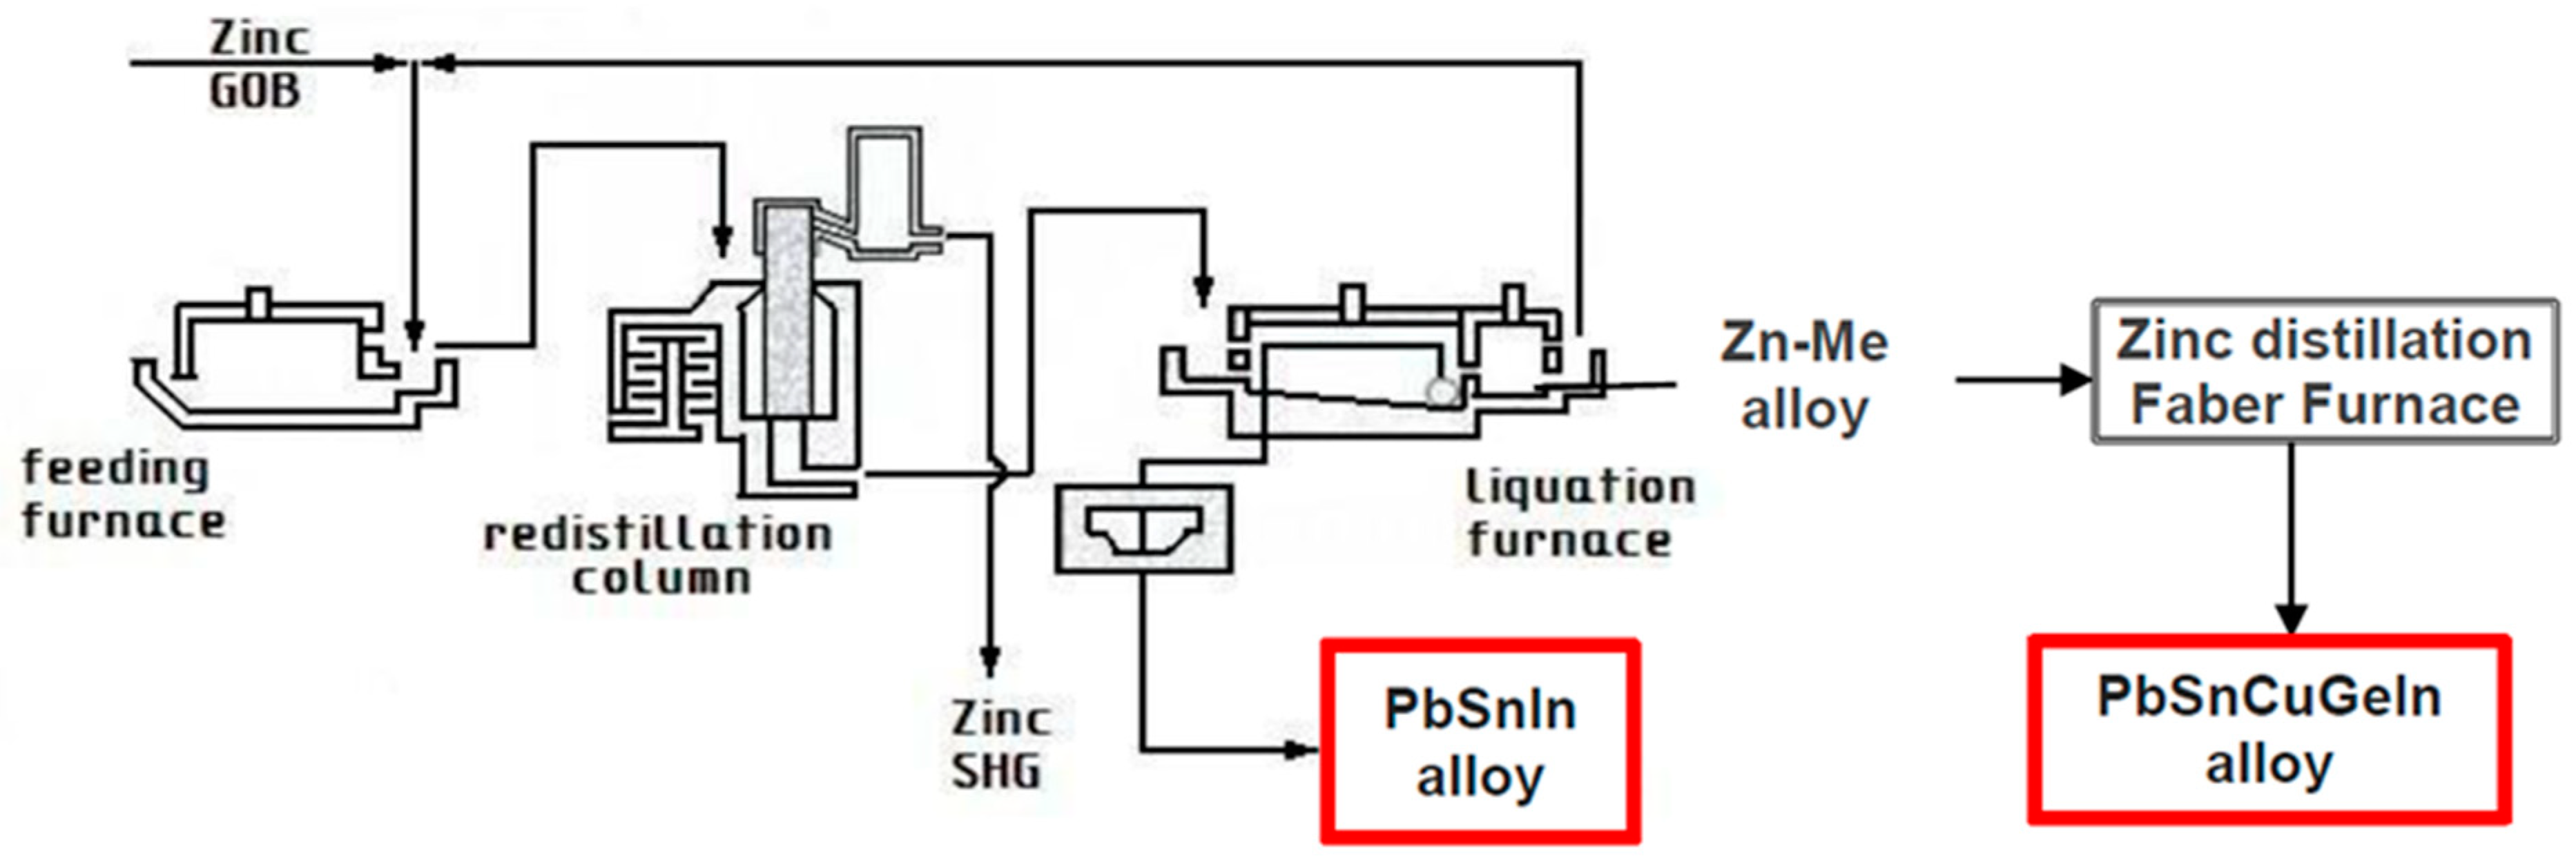
The layout of the zinc refinery at HCM where byproduct alloys are prepared is presented in Figure 1.
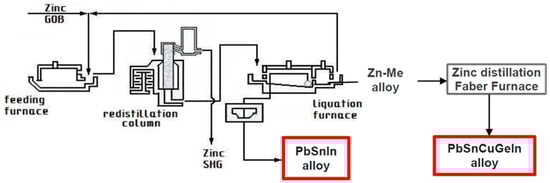
Figure 1.
The layout of the zinc refinery at HCM where byproduct alloys are prepared (GOB: good ordinary brand, SHG: special high grade).
2. Materials and Methods
The scope of the work included the investigation of two lead-based byproducts generated at HCM:
- PbSnIn alloy, derived directly as the heavy bottom phase from the liquation furnace, used for separation of the residual melt from reboiling columns in the HCM zinc refinery, and
- PbSnCuGeIn alloy separated in the same zinc-rich upper phase, by extensive zinc removal in the distillation furnace (Faber furnace), according to the original HCM procedure, already successfully implemented in an industrial-scale practice.
The generic information on the annual output of these alloys and their composition, as declared by HCM, is presented in Table 1.

Table 1.
Annual output and chemical composition of the PbSnIn and PbSnCuGeIn alloys.
The aim of this research was to produce the oxide-In concentrate by the thermal oxidation of PbSnIn alloy and to produce the oxide-GeIn concentrate by thermal oxidation of PbSnCuGeIn alloy. The experiments were performed at IMN (Instytut Metali Nieżelaznych, Gliwice, Poland).
The research included two series of experiments: the first involved the processing of PbSnIn alloy, and the second was focused on PbSnCuGeIn alloy. Each series included five tests performed with the application of the thermal oxidation method in a 1-tonne refining kettle fired with natural gas and air, equipped with a mixer with a rotation speed of 50–450 rot/min and a thermocouple NiCr–Ni in a ceramic cover, used to measure the metal temperature. The installation diagram is presented in Figure 2.
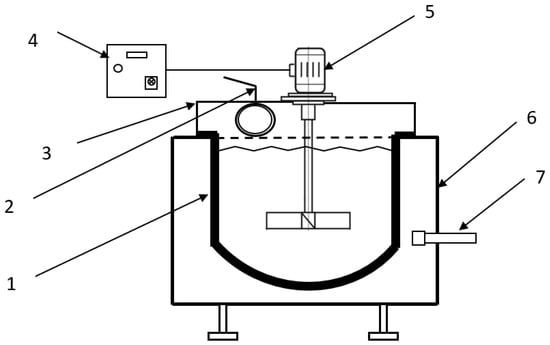
Figure 2.
Installation for the thermal oxidation of PbSnIn and PbSnCuGeIn alloys. 1: kettle, 2: gas exhaust, 3: kettle hood, 4: inverter, 5: mixer, 6: supporting structure, 7: gas–air burner.
2.1. PbSnIn Alloy Processing
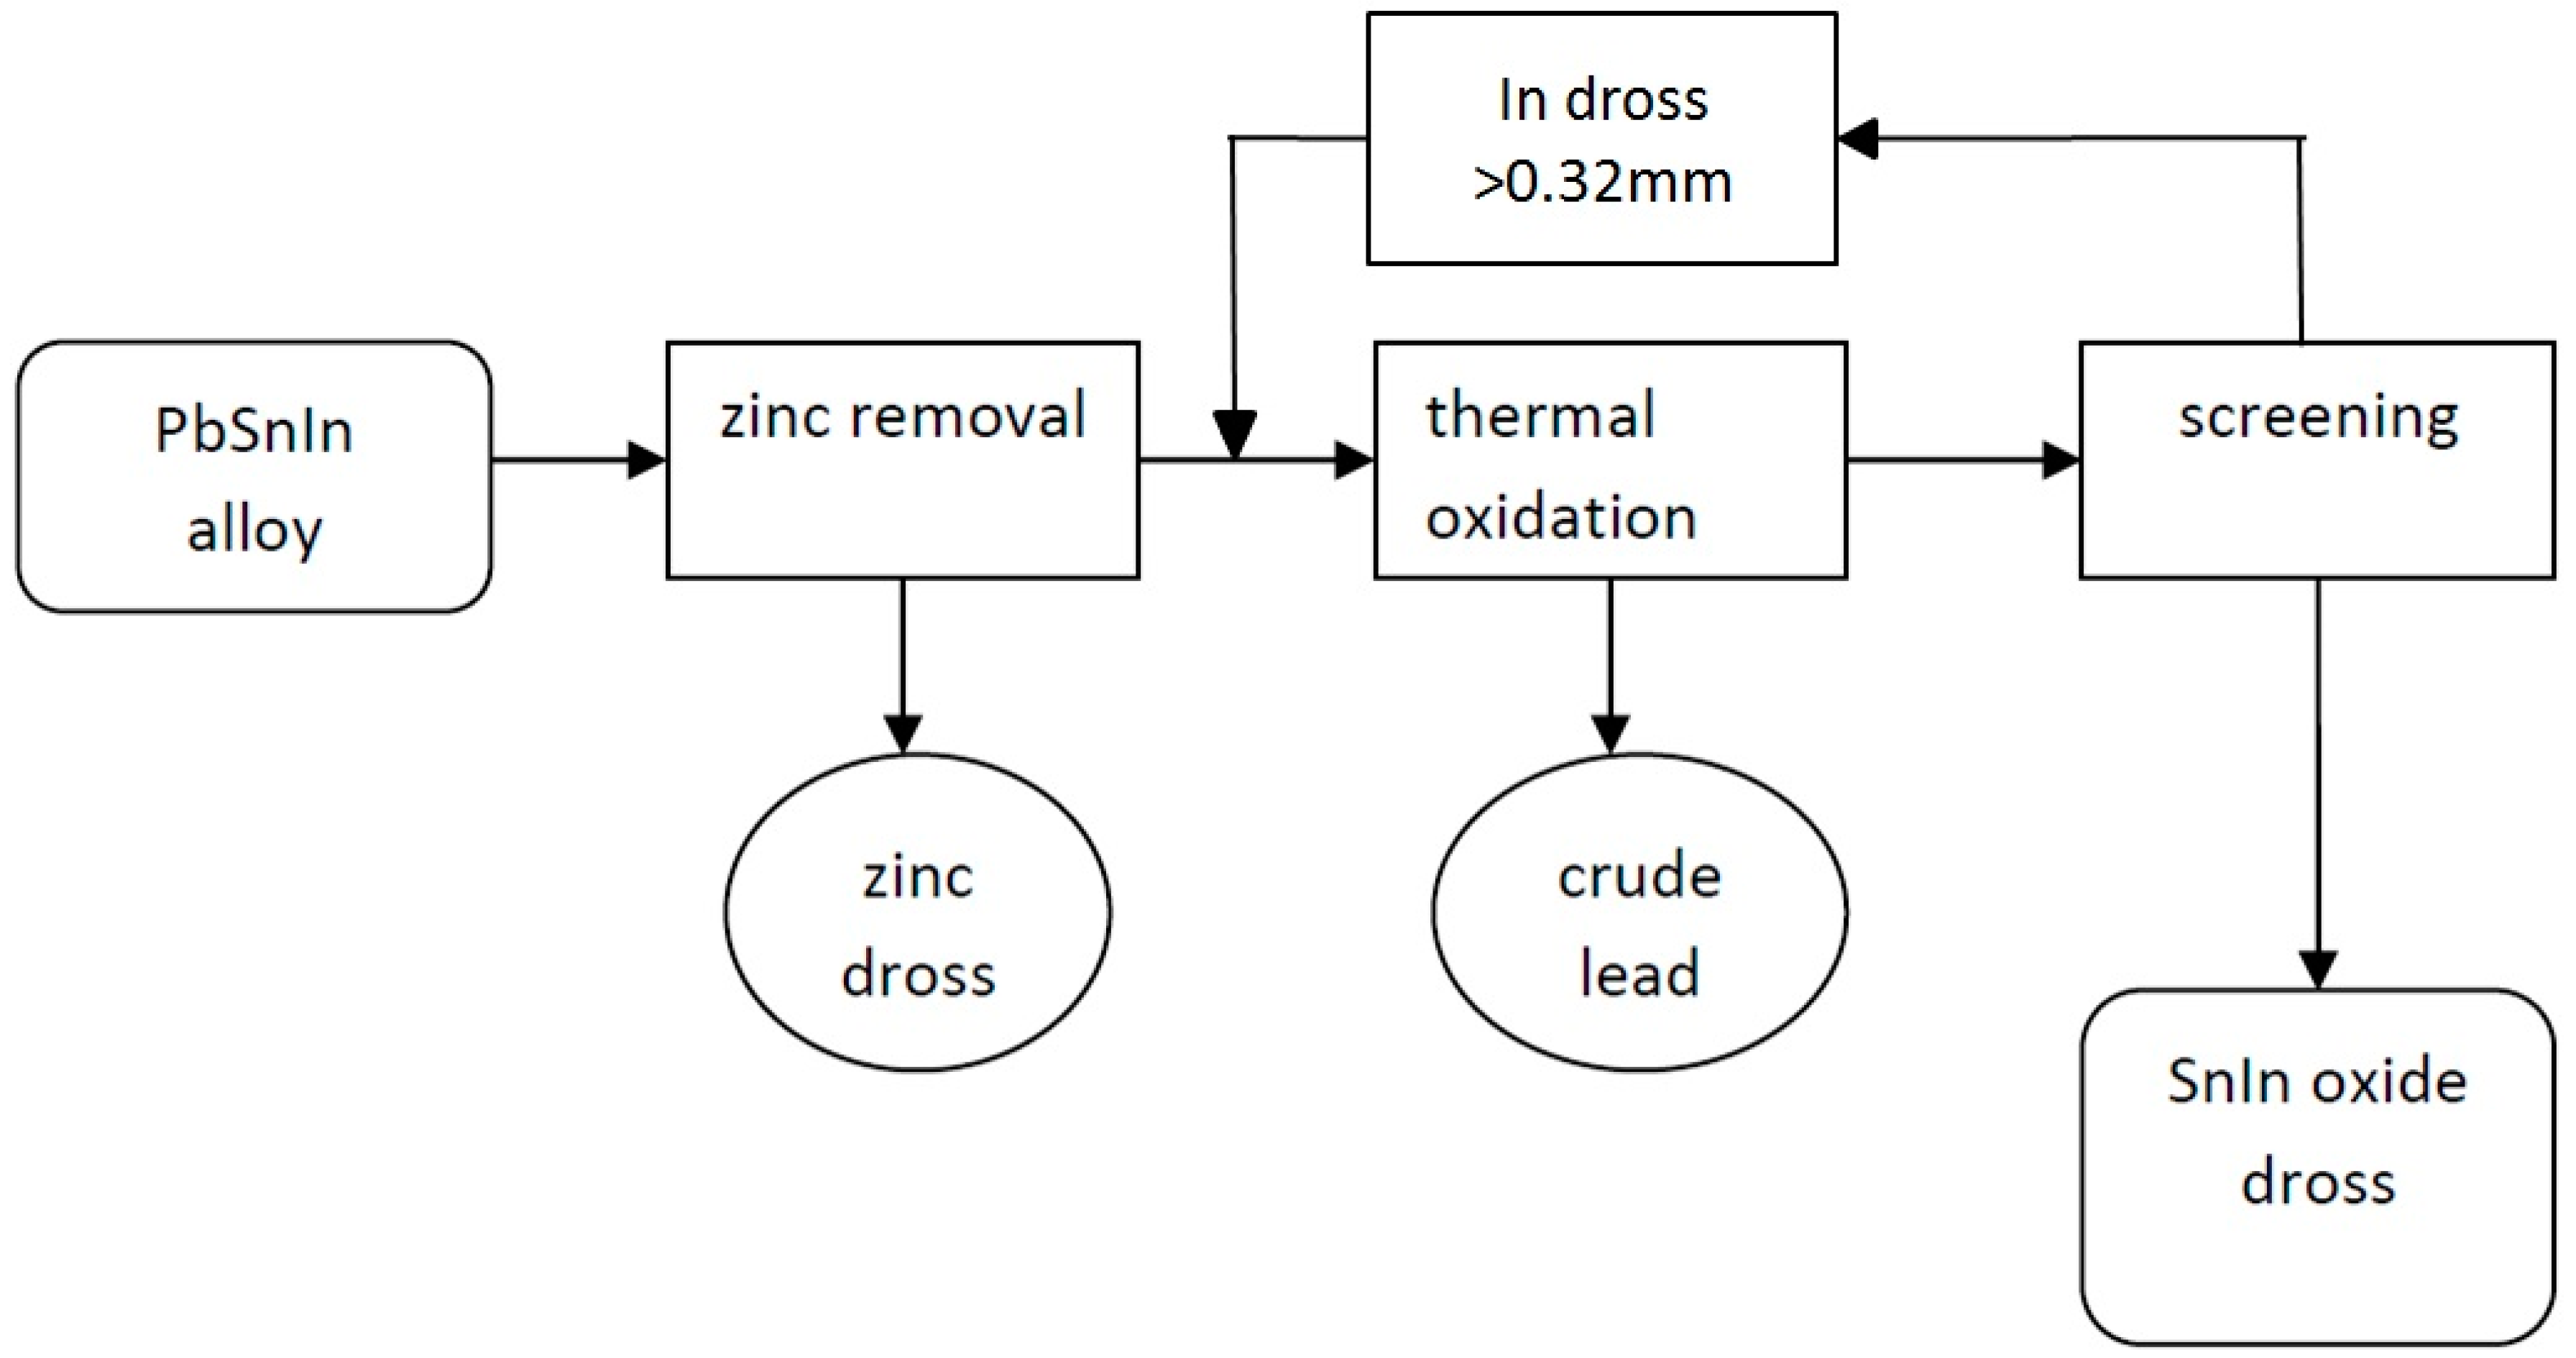
Zinc and indium were removed from the PbSnIn alloy in the following steps (Figure 3):
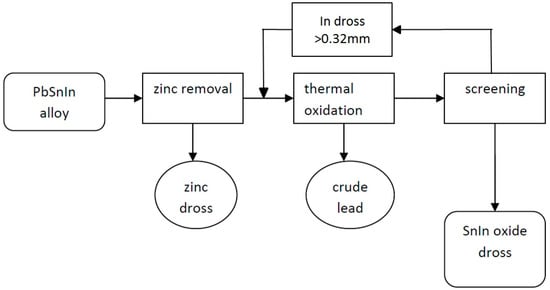
Figure 3.
Pyrometallurgical extraction of Zn, and also of In and Sn from the PbSnIn alloy.
- Alloy melting and collection of the homogenized sample;
- Zinc removal from the alloy, at first with the application of NaOH and finally by stirring NaOH + NaNO3 on the alloy surface at 500–550 °C;
- Indium removal by thermal oxidation of the alloy at approximately 650 ± 20 °C with intense stirring (400 rot/min) and open air circulation.
Zinc was removed from the lead alloy using NaOH according to the reaction:
Zn + 2NaOH = Na2ZnO2 + H2.
The refining of the PbSnIn alloy with O2 under open air takes place according to the chemical affinity of oxygen to the metals, according to the Ellingham diagrams by Howard [12]. The reactions take place in the following sequence:
2In + 1.5O2 = In2O3,
Sn + O2 = SnO2,
Pb + 0.5O2 = PbO.
Five tests of the oxidic indium concentrate preparation were carried out. Each test was composed of the following steps. Firstly, the initial alloy was loaded and melted in a 1-tonne refining kettle. The mass of the alloy processed in a single step was approximately 790 kg. After melting and homogenizing, a sample of the alloy was taken.
In the second step, zinc was removed from the alloy by the addition of NaOH or NaOH + NaNO3. The operation was performed at 430–580 °C with vigorous mixing (400 rot/min). Every 2 h, dross was collected and an alloy sample was taken to analyze zinc content. This was done by a quick chemical composition analysis using the WD-XRF (wavelength-dispersive X-ray fluorescence spectrometry) quantitative method on a ZSX Primus spectrometer (Rigaku, Tokyo, Japan). This step was finished when the zinc content was <0.01%. The mean time of one test step was 270 min.
Before the third step, the alloy temperature was increased to 650 ± 20 °C. Then, indium was removed from the alloy with intense mixing (400 rot/min) under open air. The generated indium dross was collected from the alloy surface approximately every 1 h, depending on the amount of the dross. Then, a sample of the alloy was taken and analyzed using WD-XRF. This step was finished when the indium content in the alloy was <0.02%. After each single test, the indium dross was screened on a 0.32-mm sieve. The coarse fraction (>0.32 mm) was recycled to the next test. The fine fraction (<0.32 mm) was the In-oxide concentrate ready for further hydrometallurgical treatment in IMN [11]. The mean time of the indium removal step was 580 min.
After each test, the remaining PbSn alloy was cast into the molds.
X-ray diffraction (XRD) analysis of the dross was done using XRD 7 (Seifert-FPM, Freiberg, Germany), with Co Kα radiation and an Fe filter. Analyses were performed for 2Θ angles between 10–100°, corresponding to dhkl spacings between 1.027–0.1168 nm.
The particle-size distribution (PSD) was analyzed using Analysette 22 NanoTec (Fritsch, Idar-Oberstein, Germany).
2.2. PbSnCuGeIn Alloy Processing
Germanium and indium removal from the PbSnCuGeIn alloy was done by a thermal oxidation process in open air with the addition of NaNO3 (Tests 1, 3, 4, and 5) or NaOH (Test 2). Ge and In were removed according to the following steps (Figure 4):
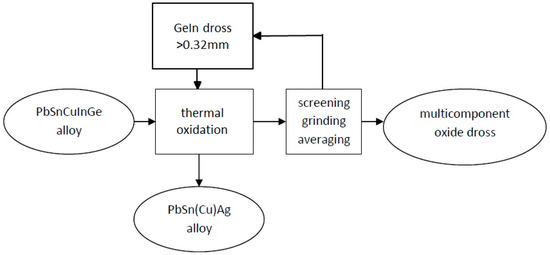
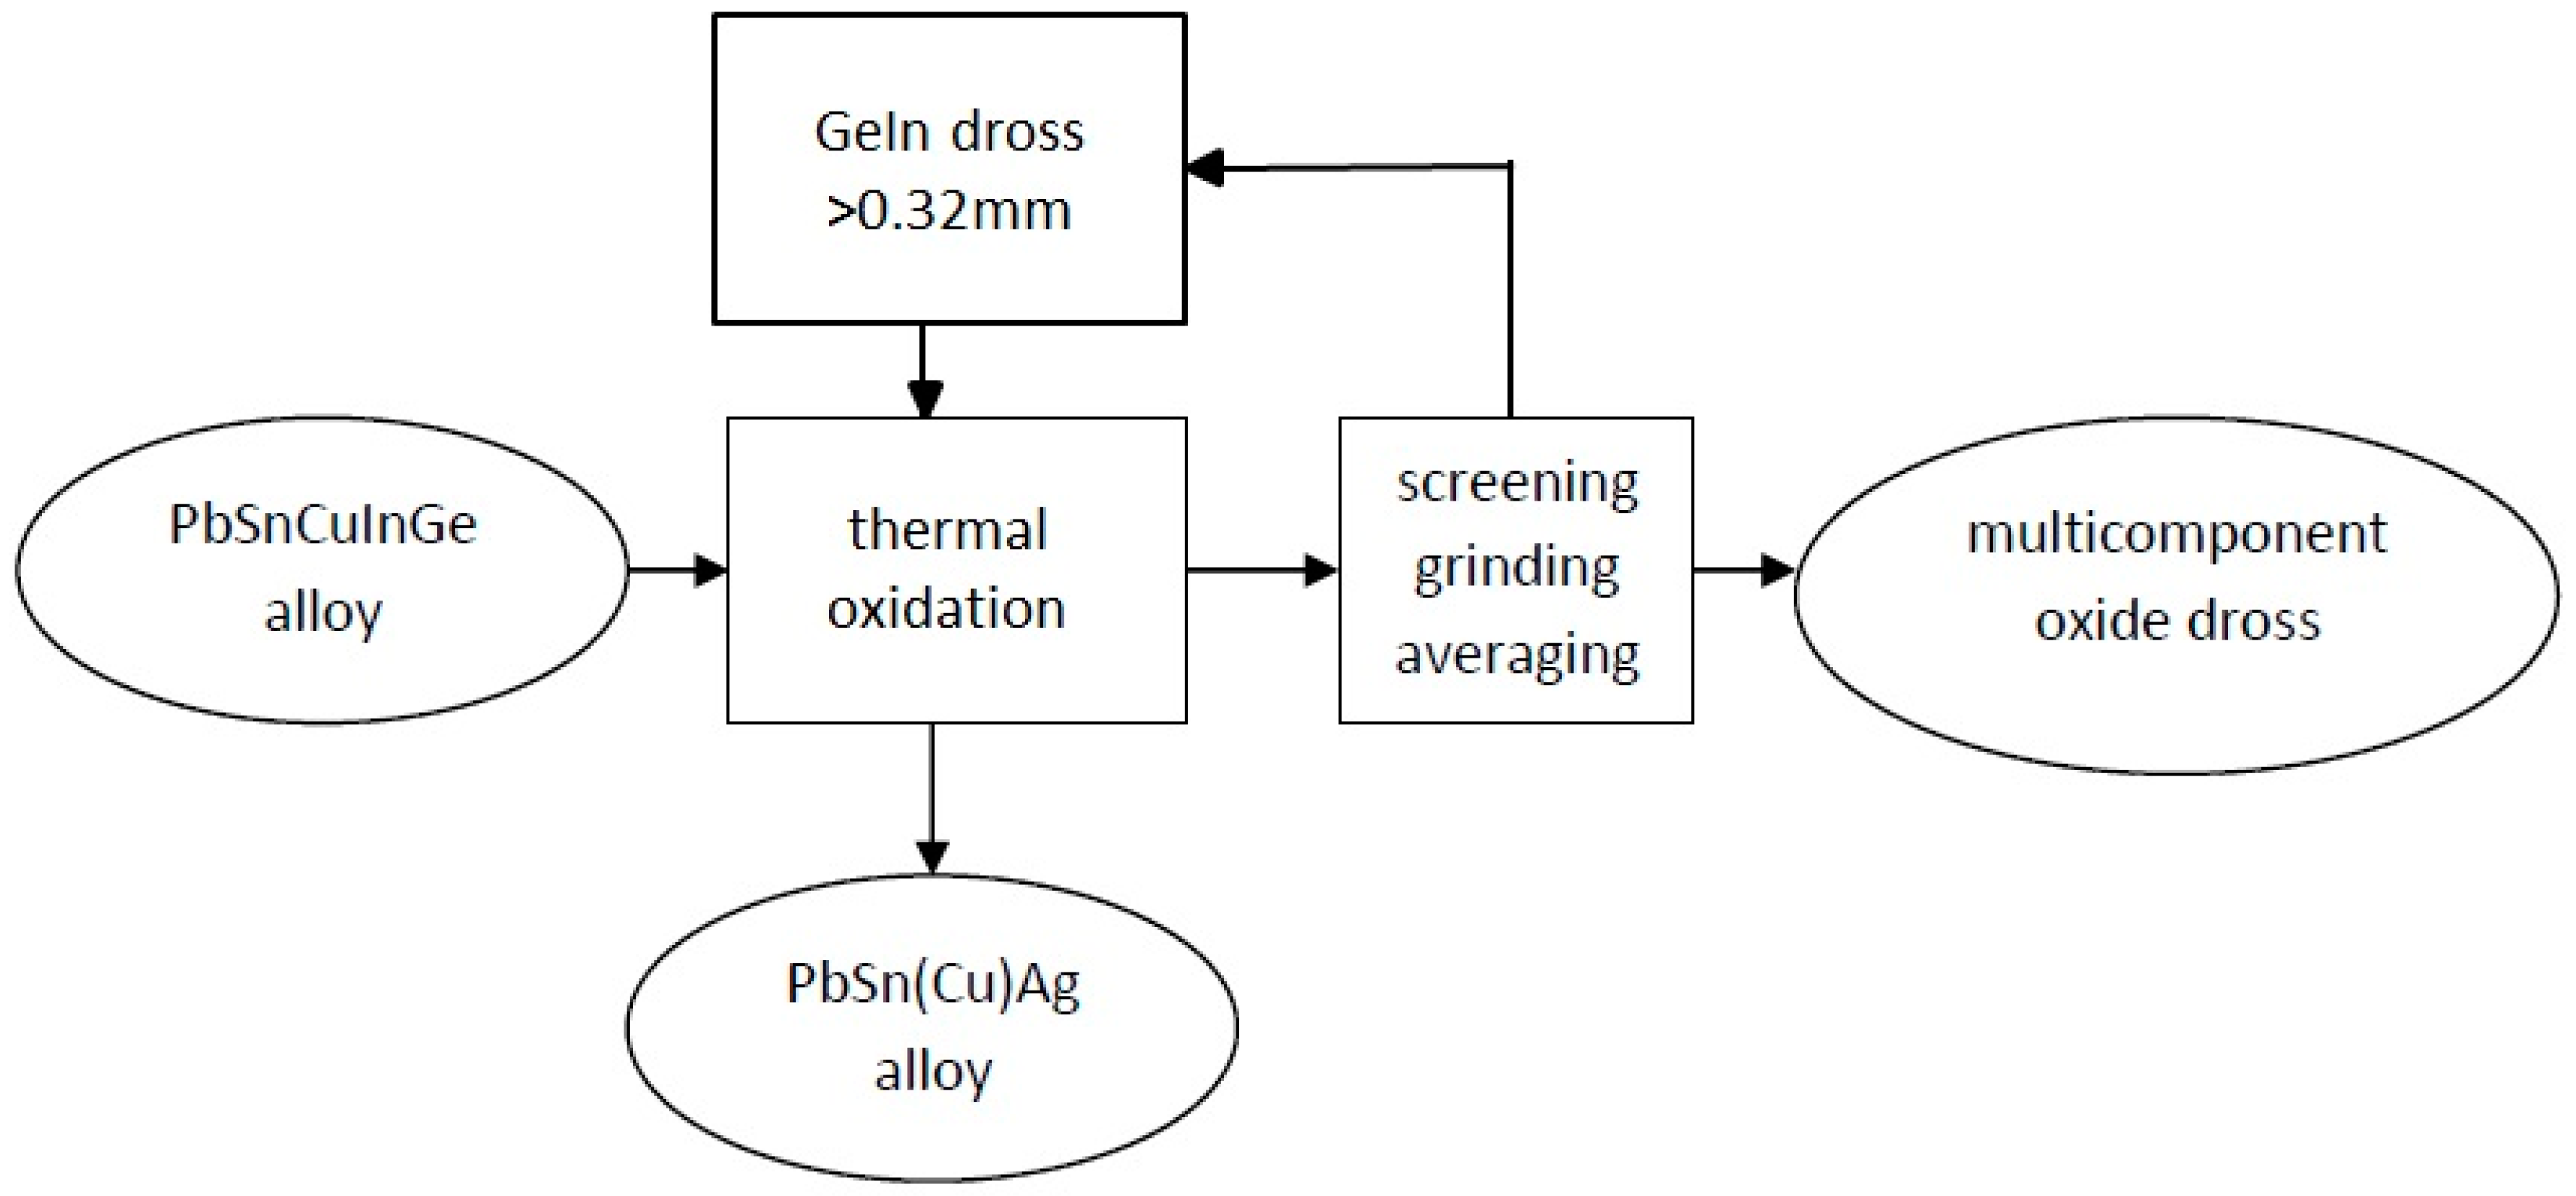
Figure 4.
Pyrometallurgical extraction of Ge, In, and Sn from the PbSnCuGeIn alloy.
- Alloy melting and potential addition of recycled metal;
- Ge and In removal by thermal oxidation of the alloy at approximately 650–700 °C under intensive mixing in open air with the addition of NaNO3 (Tests 1, 3, 4, and 5) or NaOH (Test 2);
- Collection of the GeIn drosses, sieving them through a 0.32-mm sieve, and recycling the oversized drosses before the next oxidation; and
- Casting the PbSn(Cu)Ag alloy.
The refining of the PbSnCuGeIn alloy with O2 from the open air takes place according to the chemical affinity of oxygen to the metals in the following sequence [12]:
Zn + 0.5O2 = ZnO,
2Ge + 1.5O2 = Ge2O3,
2In + 1.5O2 = In2O3,
Sn + O2 = SnO2,
Pb + 0.5O2 = PbO.
In the first step of the oxidic GeIn concentrate preparation by thermal oxidation, PbSnCuGeIn alloy was loaded and melted in a 1-tonne refining kettle. The mean mass of the alloy processed during a single test was approximately 577 kg. After melting and homogenizing, a sample of the initial alloy was taken.
Secondly, germanium and indium were removed from the alloy by thermal oxidation at 650–700 °C with vigorous stirring (400 rot/min). Oxidation was carried out under open air with the addition of 1–3 kg of NaNO3 (Tests 1, 3, 4, and 5) or 5 kg of NaOH (Test 2). During each test, GeIn dross was formed at the alloy surface. Every 2 h, the dross was collected from the surface and a sample of the alloy was taken for WD-XRF analysis. This step was stopped when the Ge and In content was <0.01%. The time of removal for Test 4 was 58 h, while for Test 5 it was 66 h.
The resulting dusty oxidic dross contained a significant amount of metallic droplets. Therefore, the GeIn dross was screened on a 0.32-mm sieve. The coarse fraction (>0.32 mm) was recycled to the next oxidation step of the subsequent test. The fine fraction (<0.32 mm) was the GeIn-oxide concentrate ready for further hydrometallurgical treatment [13]. In the case of Test 2, where NaOH was the additional additive, the obtained sodium–GeIn drosses were caked and therefore were not sieved. Due to the mixing time being too short during Tests 1–3, the resulting alloy contained unsatisfactory quantities of Ge and In. Therefore, after the end of each test, the alloy was recycled and melted in the first step of the subsequent test. After tests, the remaining PbSn(Cu)Ag alloy was cast into the molds.
3. Results
3.1. PbSnIn Alloy
The process included five tests of the pyrometallurgical processing of PbSnIn alloy containing: 93.30% Pb, 2.230% Zn, 2.620% Sn, 0.230% In, and 0.012% Ge. The tests were performed in a 1-tonne kettle in a two-step process involving:
- Zinc removal, at first with NaOH, and finally with NaOH + NaNO3 through continuous stirring on the alloy surface at 500–550 °C;
- Indium removal by thermal oxidation of the alloy at 650 ± 20 °C with intense stirring and free air circulation.
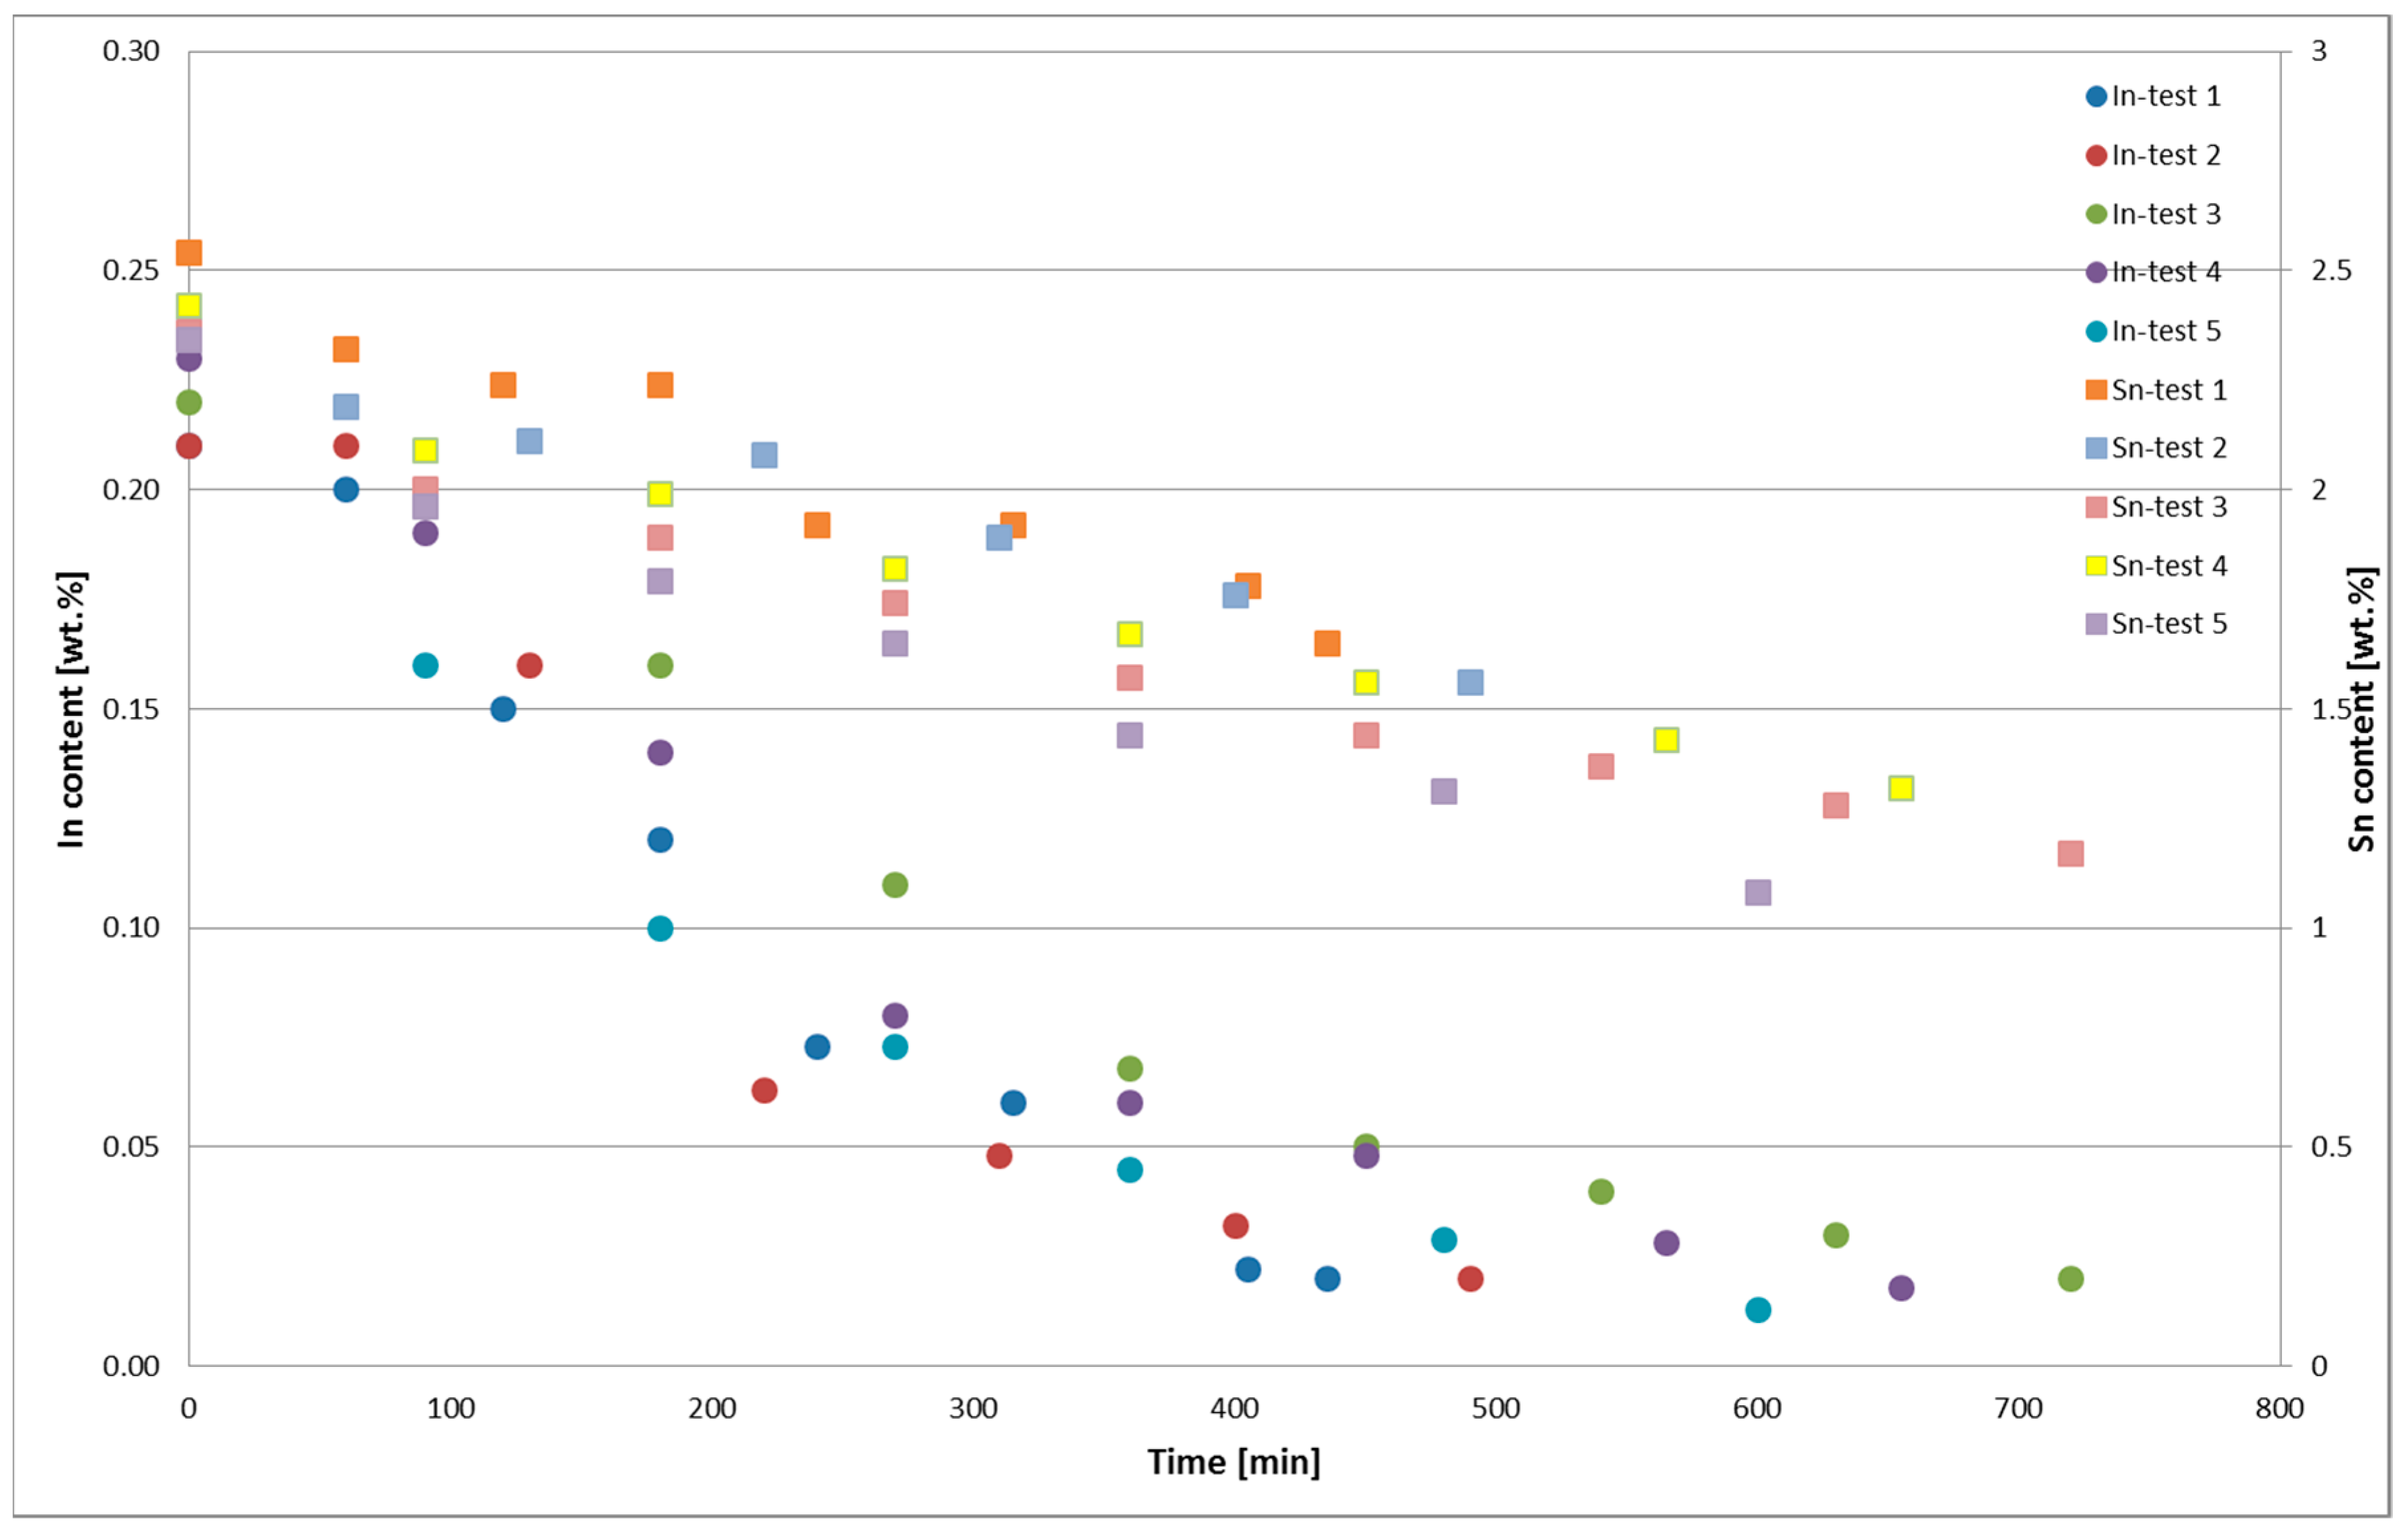
The changes in the In and Sn contents in PbSnIn alloys during the thermal oxidation for Tests 1–5 are presented in Figure 5. The chemical composition of the metal obtained from the thermal PbSnIn oxidation is presented in Table 2. The average chemical composition of the Zn drosses from the thermal PbSnIn oxidation is presented in Table 3. The average chemical composition of the In <0.32-mm dross from the thermal oxidation of the PbSnIn alloy is presented in Table 4.
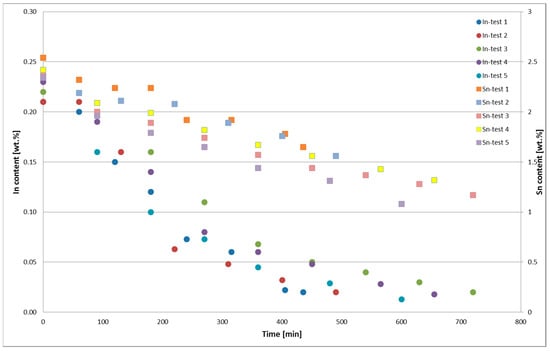
Figure 5.
Changes in the In and Sn contents in PbSnIn alloys during thermal oxidation, Tests 1–5.
Table 2.
Chemical composition of the metal obtained from thermal PbSnIn oxidation.
Table 3.
The average chemical composition of the Zn drosses from the thermal oxidation of PbSnIn.
Table 4.
The average chemical composition of the In <0.32-mm drosses from the thermal oxidation of PbSnIn alloy.
3.2. PbSnCuGeIn Alloy
Five tests of the thermal oxidation of PbSnCuGeIn alloy were performed in a 1-tonne kettle in a process involving:
- Ge and In removal by thermal oxidation of the alloy at approximately 650–700 °C under intensive mixing and in open air with addition of 1–3 kg of NaNO3 (Tests 1, 3, 4, and 5) or 5 kg of NaOH (Test 2); and
- Collection of the GeIn dross and its sieving through a 0.32-mm sieve, as well as recycling of the coarse fraction to the next oxidation step.
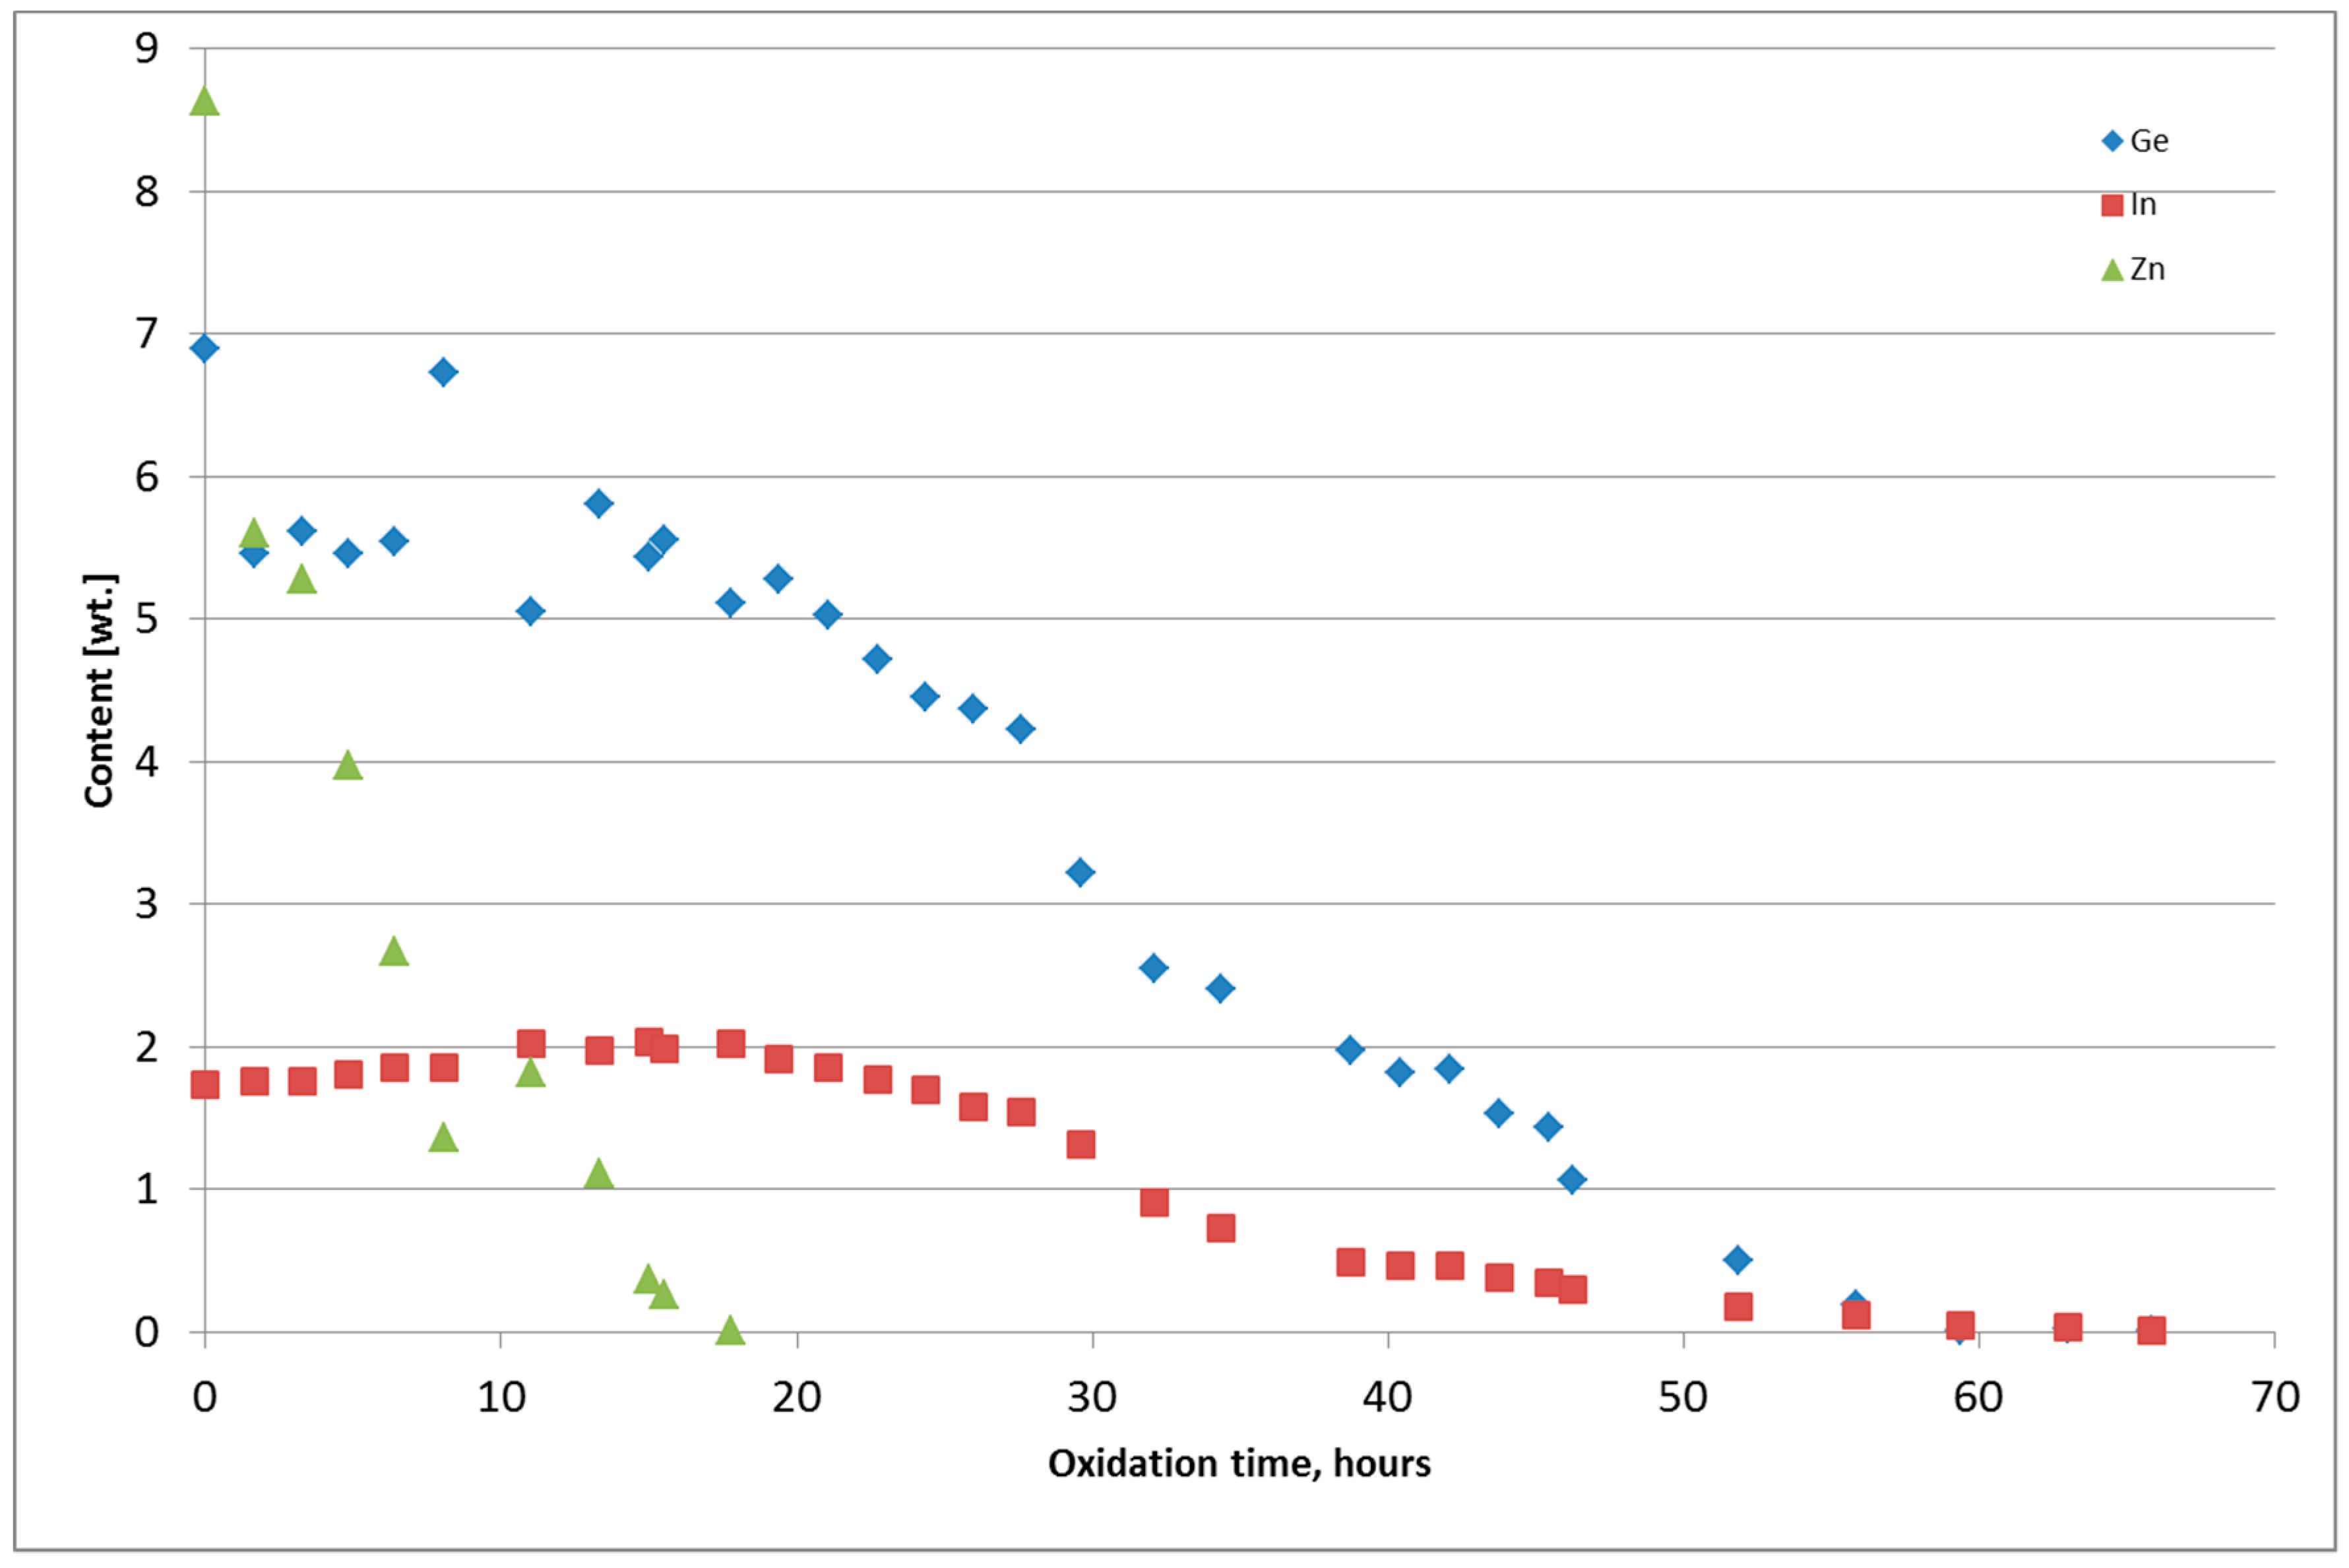
Figure 6 and Figure 7 present the chemical composition change of the alloy during thermal oxidation for Tests 4 and 5. Metals from Tests 1–3 were returned to the thermal oxidation step because the content of Ge and In was too high. The chemical composition of the metal obtained from the thermal oxidation of PbSnCuGeIn is presented in Table 5. The chemical composition of the oxide-GeIn dross <0.32 mm is presented in Table 6, and the chemical composition of the sodium–GeIn dross in Table 7.
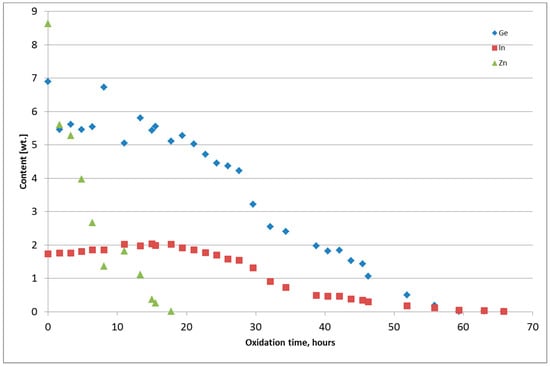
Figure 6.
Change of Ge, In, and Zn content in the PbSnCuGeIn alloy during thermal oxidation, Test 4.
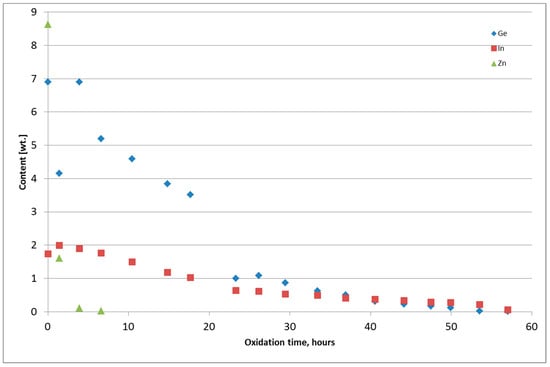
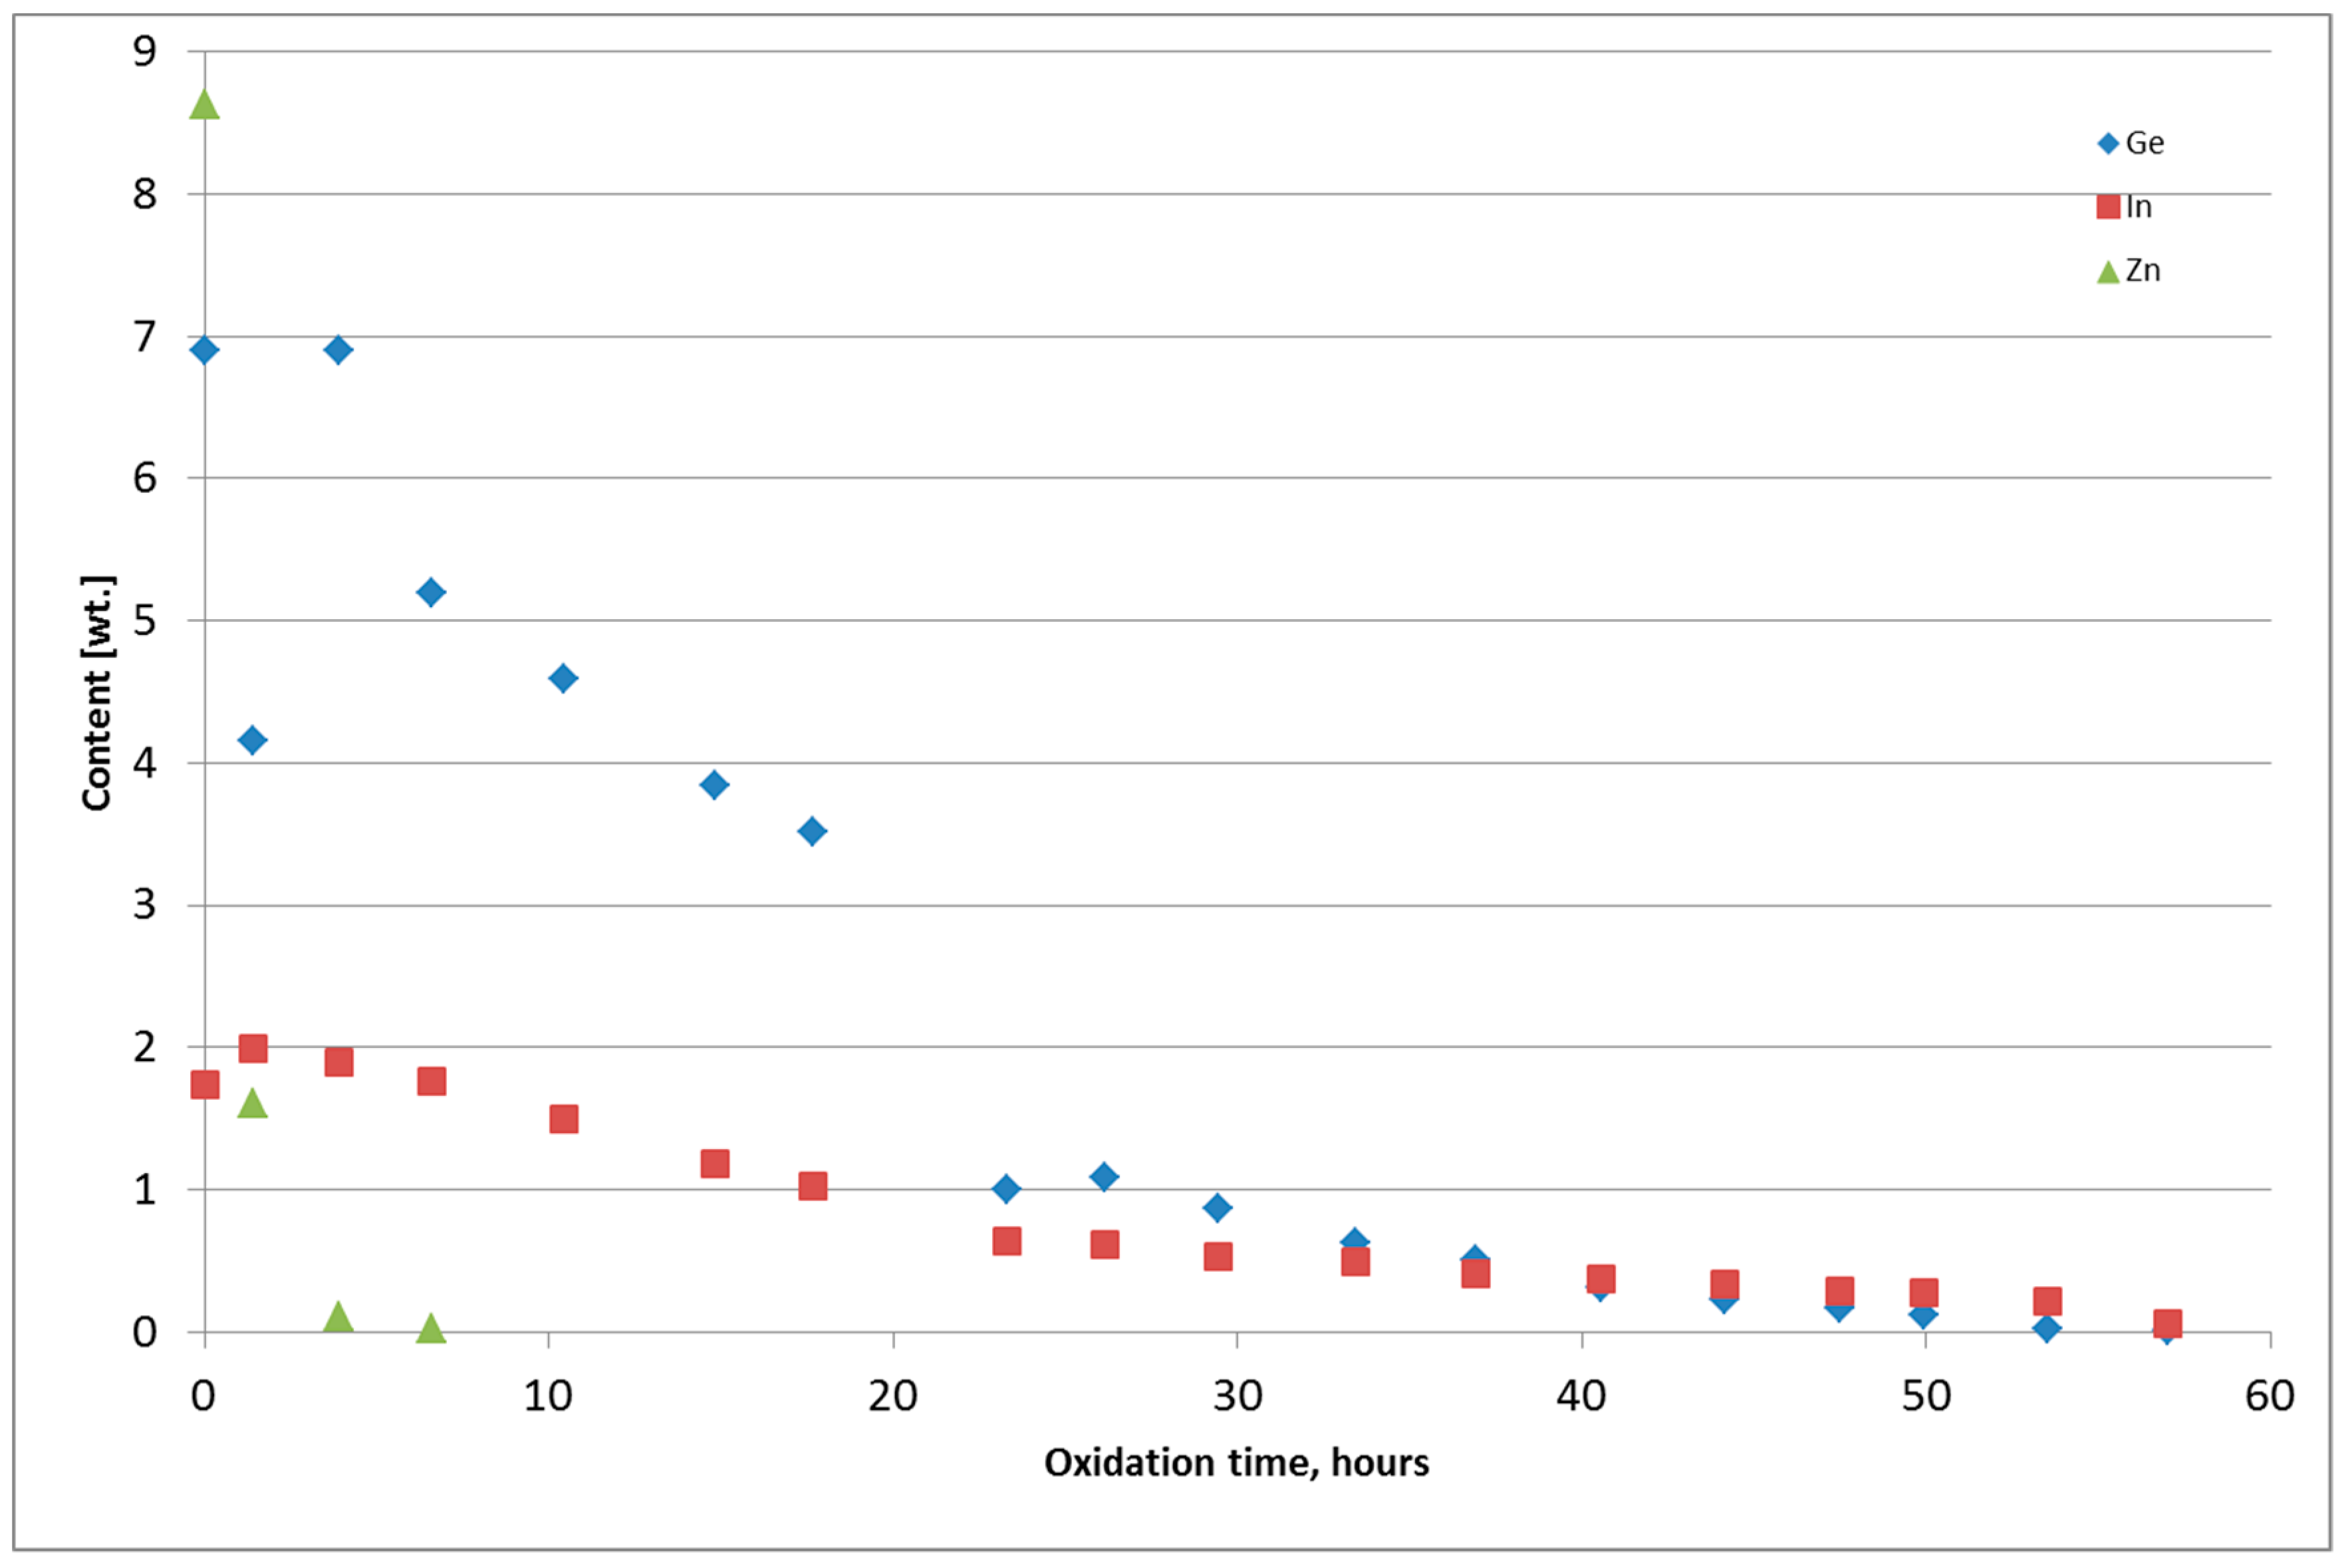
Figure 7.
Change of Ge, In, and Zn content in the PbSnCuGeIn alloy during thermal oxidation, Test 5.
Table 5.
Chemical composition of the final metal from the thermal oxidation of the PbSnCuGeIn alloy.
Table 6.
Chemical composition of the oxide-GeIn dross <0.32 mm.
Table 7.
Chemical composition of the sodium–GeIn dross.
4. Discussion
4.1. PbSnIn Alloy
Zinc removal was performed at 430–580 °C with NaOH in the amount of 1.85% alloy mass. In the final step, in order to increase the process rate, the additional oxidizing agent, NaNO3, was used in the amount of 0.18% of the alloy mass.
The amount of zinc in the alloy decreased to 0.04–0.43%. The obtained Zn drosses contained (average, wt %) 33.1% Zn, 15.8% Pb, 4.23% Sn, 0.13% In, 0.26% Ge, and 18.1% Na. It was observed that germanium was efficiently removed from the PbSnIn alloy with NaOH at the first step of the refining process. The obtained Zn drosses can be redirected to the ISP (Imperial Smelting Process), where the basic metals (Zn, Pb) will be recovered, while In and Ge will be concentrated during the zinc-refining process from PbSnIn and PbSnCuGeIn alloys. During the second step of the refining process, indium was removed from the alloy through intense stirring to obtain a 0.02% concentration in the final metal. This was carried out at 600–680 °C within 7–12 h, in the presence of free atmospheric air.
During the thermal oxidation of the alloy, In, Sn, and Pb are simultaneously oxidized into the oxide forms (In2O3, SnO2, and PbO) forming the drosses on the surface of the alloy, which contain high amounts of the metal drops. The In drosses were subjected to the 0.32-mm sieve analysis. The fraction which contained the metal drops was directed to further thermal oxidation in the following test. The undersized dross fraction constituted the oxide-indium concentrate suitable for further hydrometallurgical processing. The final amount of In <0.32-mm drosses was 17.1% of the mass of the original PbSnIn alloy, and their chemical composition after mixing was (wt %) 75.5% Pb, 1.15% In, 6.13% Sn, and 0.046% Ge. The yields of metals in the In <0.32-mm drosses were (wt %) 82.7% In, 37.2% Sn, and 13.8% Pb.
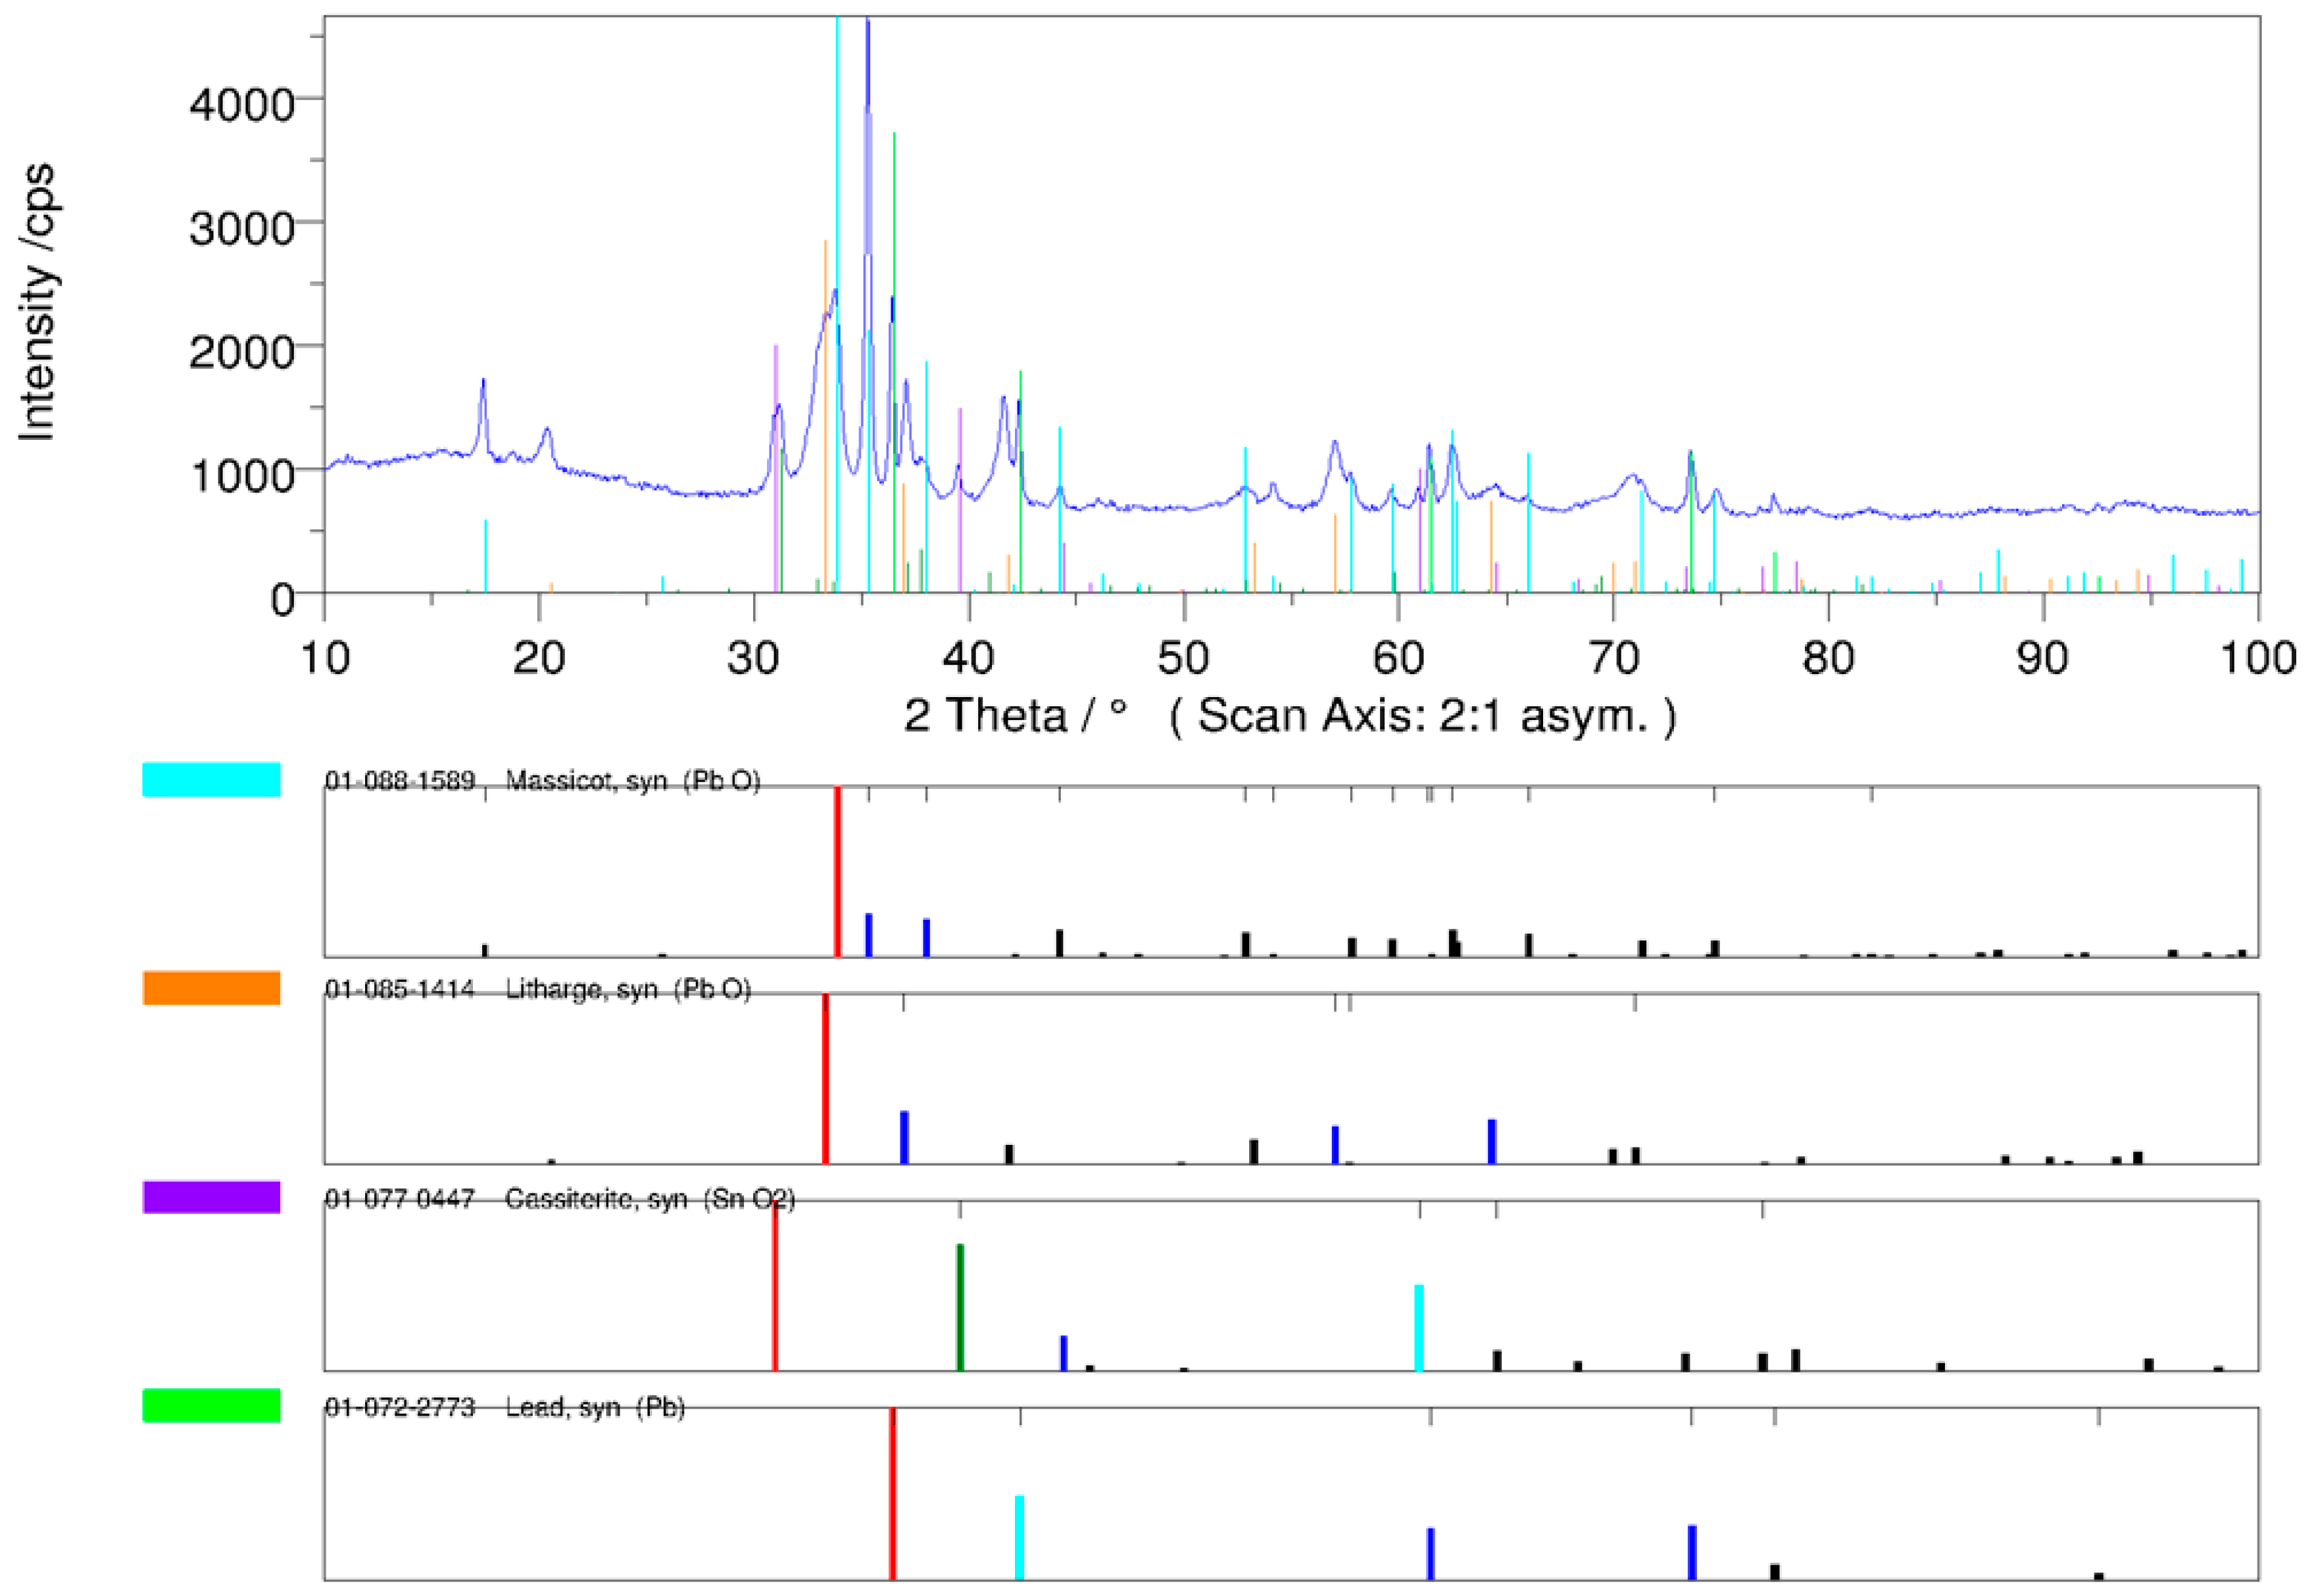
The phase analysis of the In <0.32-mm drosses indicates the presence of PbO and SnO2 oxides as well as small amounts of metallic Pb. No In2O3 was observed, possibly because the concentration was too low. The diffraction pattern of the qualitative XRD phase analysis of the In <0.32-mm dross is presented in Figure 8.
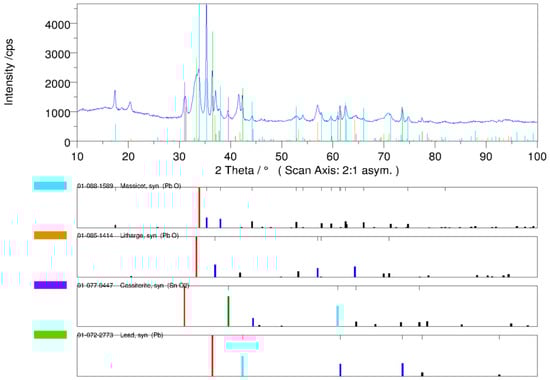
Figure 8.
Diffraction pattern of the qualitative XRD phase analysis of the In <0.32-mm dross.
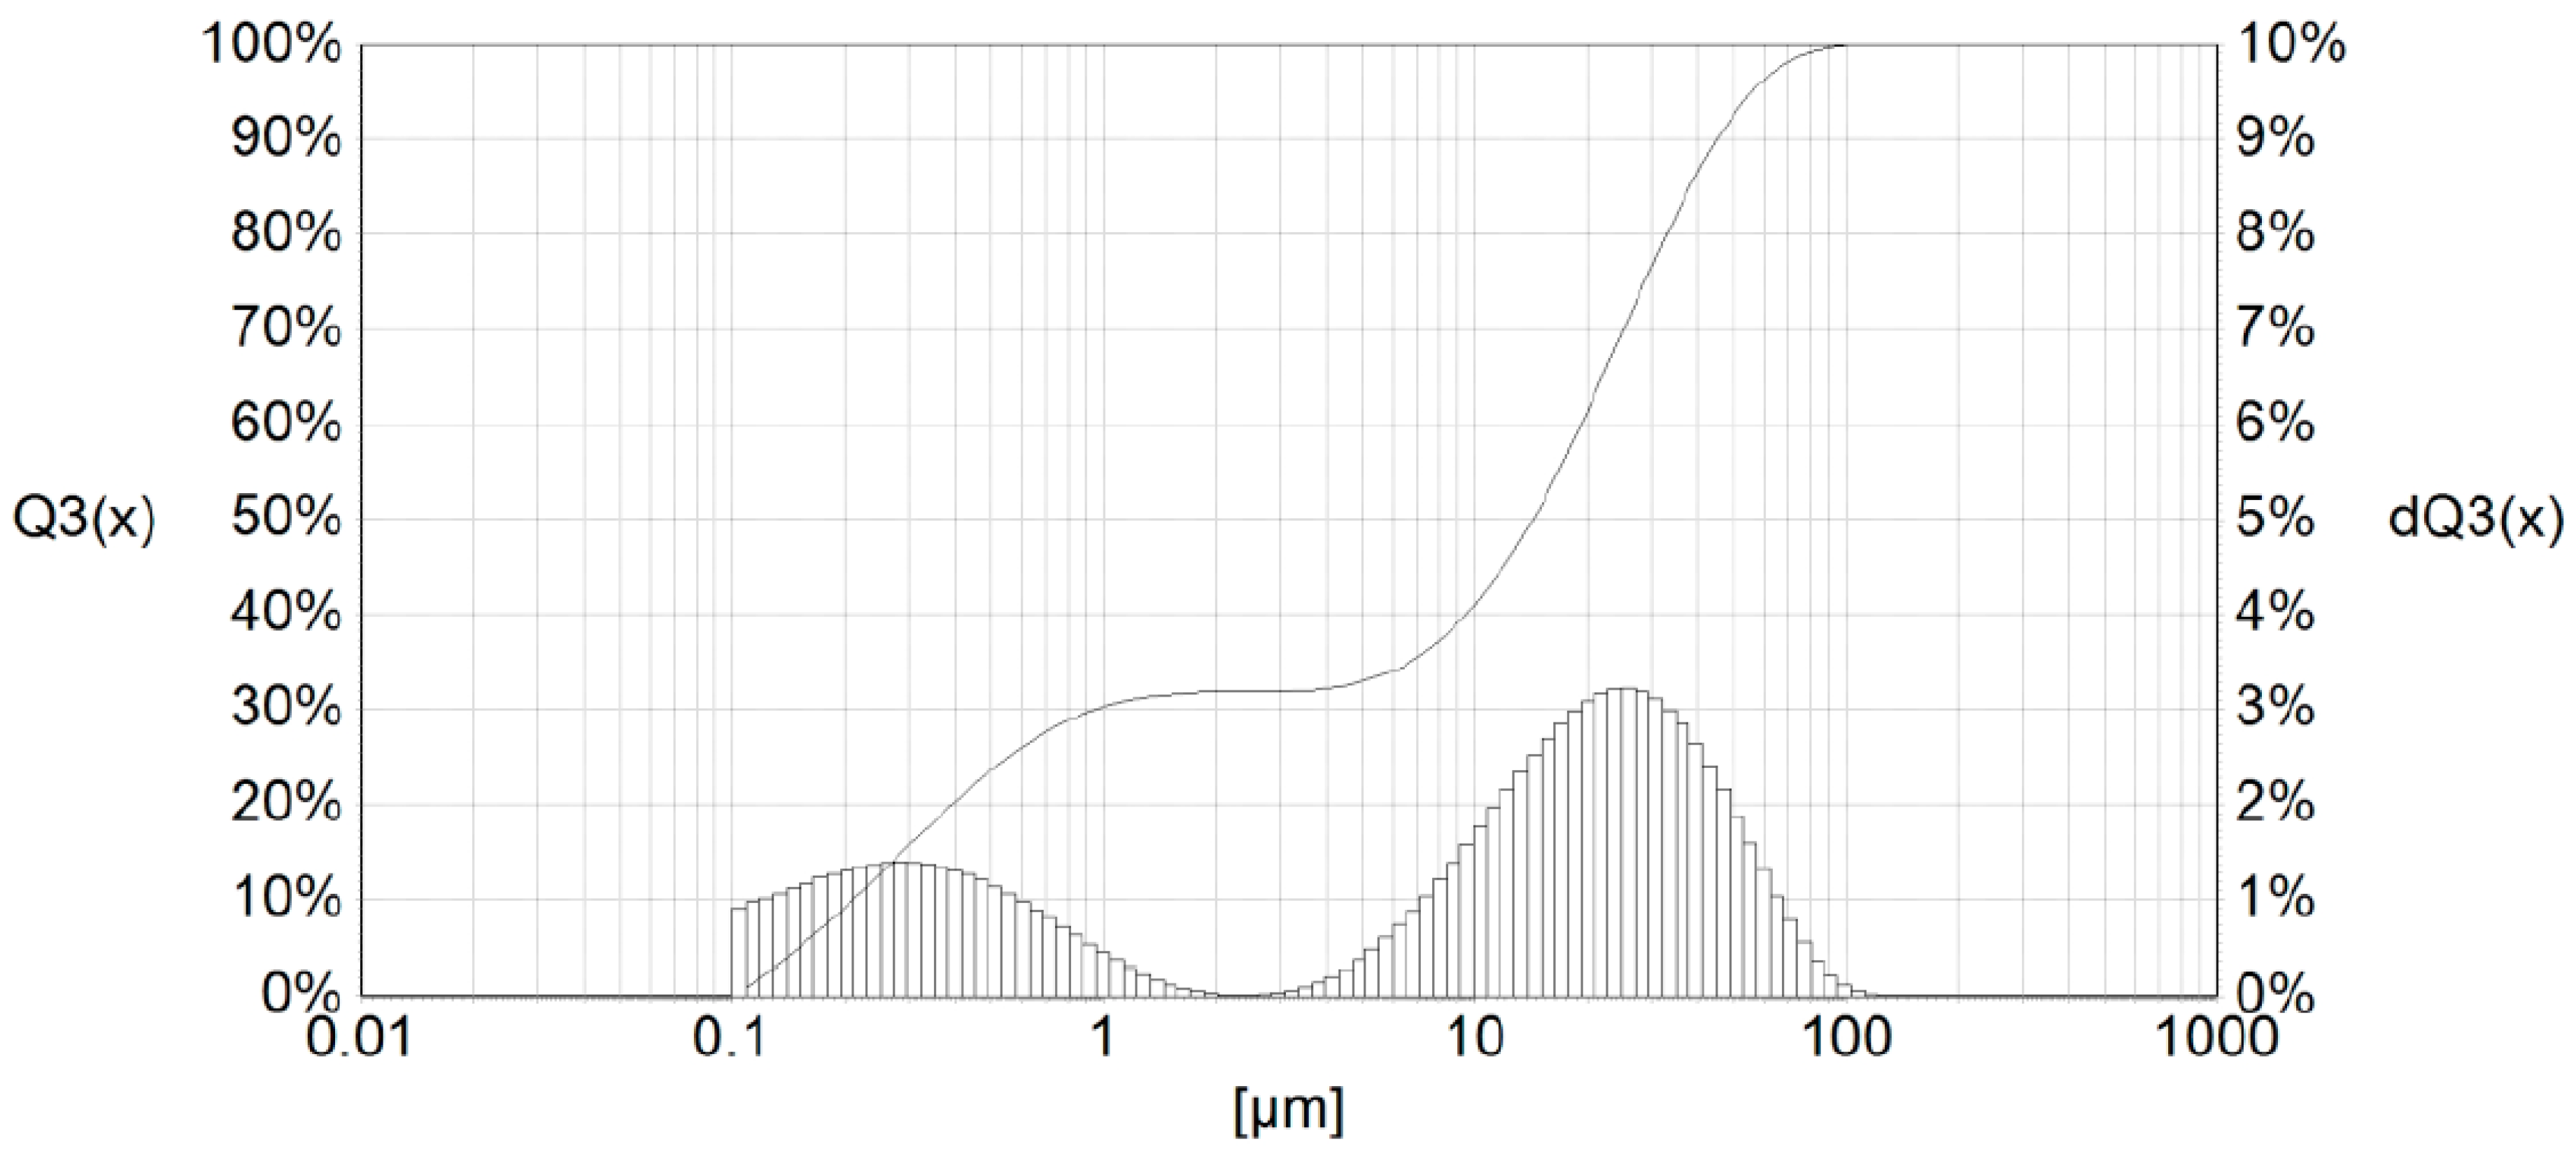
The examined sample of the In dross <0.32 mm had small particles in the range from about 0.05 μm up to 100 μm (Figure 9).
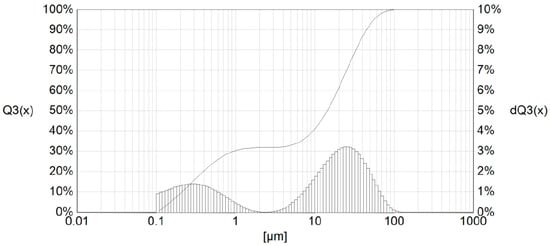
Figure 9.
Particle-size distribution of the In <0.32-mm dross.
After removing Zn in the first step, and In and a part of Sn in the second step of the refining process, the final metal—PbSn alloy, in the amount of 79.0 wt % of PbSnIn alloy, contained (wt %) 98.3% Pb, 1.38% Sn, and 0.019% In. The metal yield in this alloy was (wt %) 83.3% Pb, 41.7% Sn, and 6.4% In. In industrial practice, the PbSn alloy will be subjected to further fire refining in order to produce refined lead with 99.985% purity and the Sn and In drosses will be processed for the recovery of other metals.
4.2. PbSnCuGeIn Alloy
During the thermal oxidation process of the alloy by air and NaNO3, germanium, indium, tin, and zinc were oxidized to specific oxides (Ge2O3, In2O3, ZnO, and SnO2). First, zinc was removed from the alloy, followed by germanium, indium, and partially tin. They were collected on the alloy surface in the form of dross with a significant content of metal droplets. The metal was enriched in tin, copper, and silver. The obtained dusty oxide dross contained a significant amount of metallic alloy droplets. Therefore, the GeIn dross was sieved through a 0.32-mm sieve. The oversize fraction with metal droplets was recycled to thermal oxidation in the next step. The undersize GeIn dross (<0.32 mm) was mixed in a Muller mixer in order to homogenize the material. More than 99% of the initial amount of Ge and In introduced in the PbSnCuGeIn alloy was recovered in the dross. The material was then transferred for hydrometallurgical processing to produce germanium, indium, and tin concentrates.
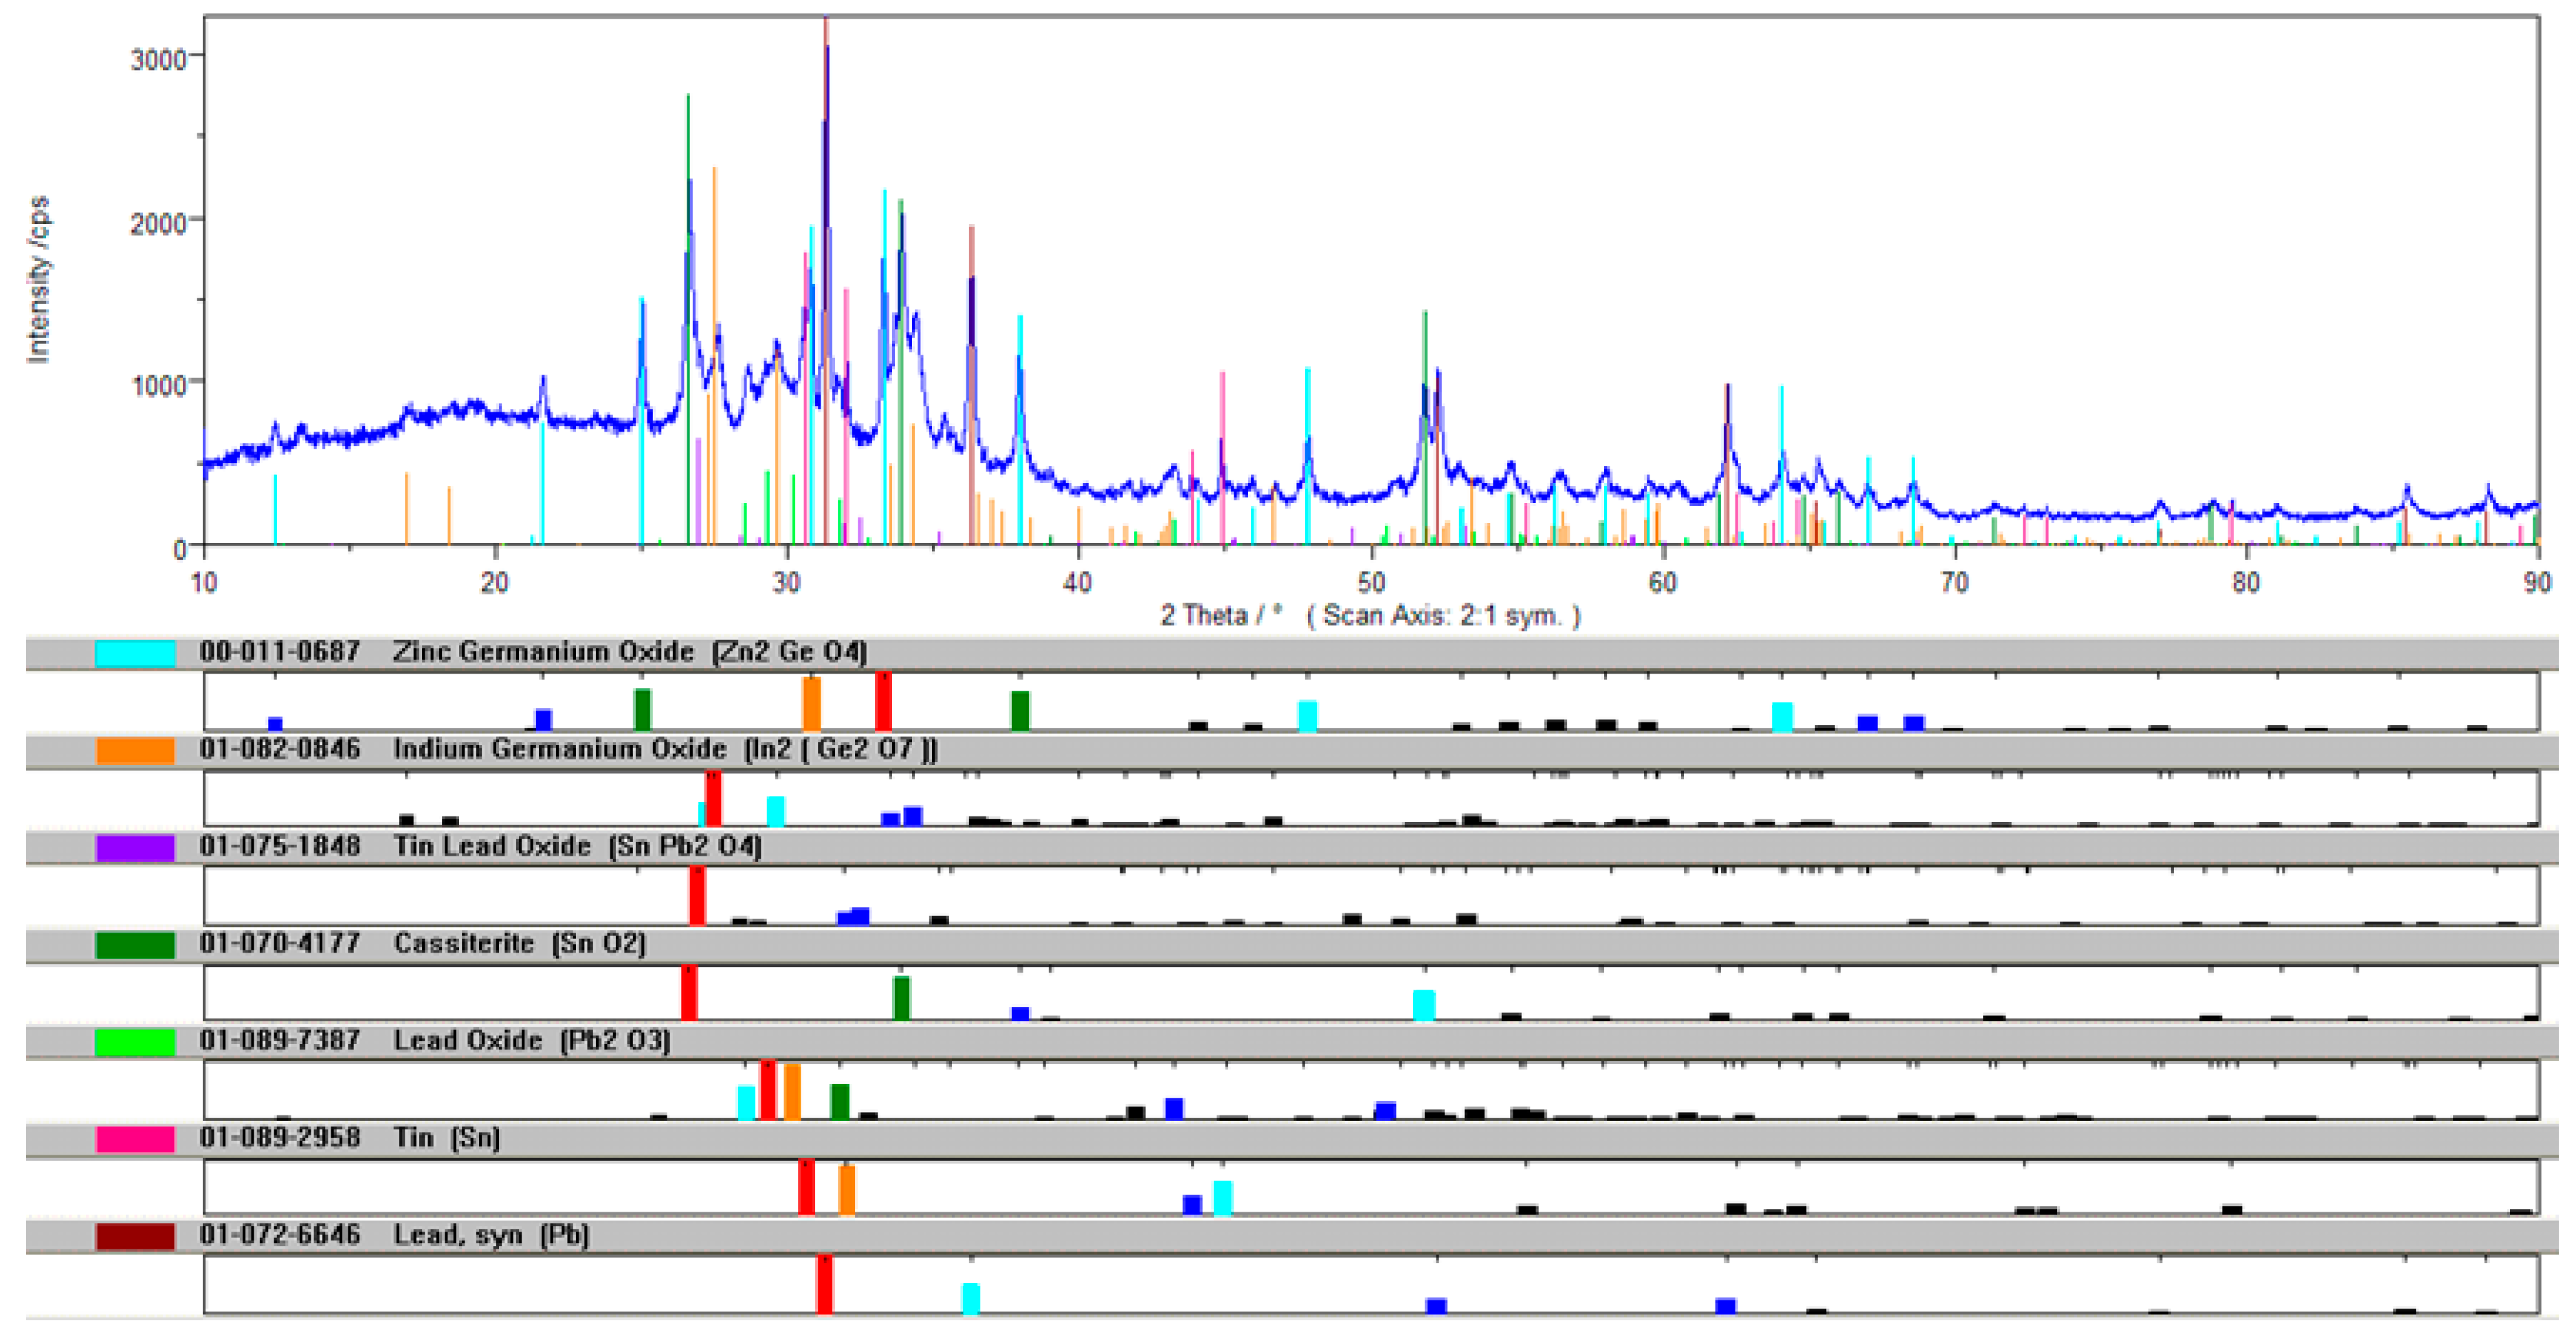
During the thermal oxidation processing of the alloy by air and NaOH, sodium–GeIn dross was obtained. It formed lumps and granules of 5–50 mm size with relatively high Ge (12.2%) and lower In (2.52%) content. Due to this nature of the dross, NaOH is not a suitable additive in the drossing process. The diffraction pattern of the qualitative XRD phase analysis of the GeIn dross is presented in Figure 10.
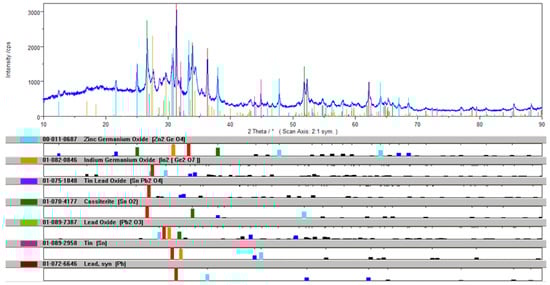
Figure 10.
Diffraction pattern of the qualitative XRD phase analysis of the GeIn dross.
The SnPbCuAg alloy obtained after drossing in Tests 4 and 5 contained (wt %) 0.01% Ge, 0.015–0.06% In, <0.01% Zn, ~30% Cu, 50% Sn, 1.8% Ag, and 16–18% Pb. It is possible to recover (wt %) 43% Sn, 60% Cu, 28% Pb, and 68% Ag in the final alloy. The alloy can be subjected to further refining to recover tin.
5. Conclusions
The described pyrometallurgical process of indium removal from the PbSnIn alloy resulted in the production of an indium-enriched semi-product (1.15% In), with a direct indium-recovery rate of about 83%, in the form of an indium-oxide dross suitable to be further processed in the hydrometallurgical stage. Other byproducts from this stage, PbSn alloy (crude lead) and zinc dross, could be easily processed in the proper sites of the zinc smelter technological flowsheet. Thermal oxidation for each test was carried out at 650 ± 20 °C within 7–12 h, in the presence of free atmospheric air, with intense stirring (400 rot/min).
The described pyrometallurgical process of germanium and indium removal from the PbSnCuGeIn alloy produced a Ge–In-enriched product (11.1% Ge, 3.0% In), with a direct indium-recovery rate at the level of >99%, in the form of a GeIn-oxide dross suitable for further hydrometallurgical processing. Thermal oxidation for Tests 4 and 5 was carried out at 650–700 °C within 58 and 66 h, in the presence of free atmospheric air and NaNO3, with intense stirring (400 rot/min).
Author Contributions
Conceptualization: R.P., S.K.; Methodology: R.P.; Investigation: R.P., S.K., A.C., R.M., and M.D., Resources: R.P.; Writing—original draft preparation: R.P.; Writing—review and editing: R.P., S.K., K.K., G.K., and M.D.; Visualization: R.P.; Supervision: R.P., S.K., and G.K.; Funding acquisition: A.C.
Funding
This activity has received funding from the European Institute of Innovation and Technology (EIT) under grant agreement No. 15038. This European body receives support from the Horizon 2020 research and innovation program. The work was also supported by own funds.
Conflicts of Interest
The authors declare no conflict of interest.
References
- European Commission. Communication from the Commission to the European Parliament, the Council, the European Economic and Social Committee and the Committee of the Regions on the 2017 List of Critical Raw Materials for the EU. COM(217) 490 Final; European Commission: Brussels, Belgium, 2017. [Google Scholar]
- Speirs, J.; Gross, B.; Gross, R.; Houari, Y. Energy Materials Availability; UK Energy Research Centre: London, UK, 2013. [Google Scholar]
- Dai, S.F.; Seredin, V.V.; Ward, C.R.; Jiang, J.H.; Hower, J.C.; Song, X.L.; Jiang, Y.F.; Wang, X.B.; Gornostaeva, T.; Li, X.; et al. Composition and modes of occurrence of minerals and elements in coal combustion products derived from high-Ge coals. Int. J. Coal Geol. 2014, 121, 79–97. [Google Scholar] [CrossRef]
- Font, O.; Querol, X.; Lopez-Soler, A.; Chimenos, J.M.; Fernandez, A.I.; Burgos, S.; Pena, F.G. Ge extraction from gasification fly ash. Fuel 2005, 84, 1384–1392. [Google Scholar] [CrossRef]
- Makowska, D.; Wieronska, F.; Strugala, A.; Kosowska, K. Germanium content in Polish hard coals. In Proceedings of the 1st International Conference on the Sustainable Energy and Environment Development (SEED), Krakow, Poland, 17–19 May 2016. [Google Scholar]
- Kul, A.; Topkaya, Y. Recovery of germanium and other valuable metals from zinc plant residues. Hydrometallurgy 2008, 92, 87–94. [Google Scholar] [CrossRef]
- Bayat, S.; Aghazadeh, S.; Noaparast, M.; Gharabaghi, M.; Taheri, B. Germanium separation and purification by leaching and precipitation. J. Cent. South Univ. 2016, 23, 2214–2222. [Google Scholar] [CrossRef]
- Fayram, T.S.; Anderson, C.G. The development and implementation of industrial hydrometallurgical gallium and germanium recovery. J. South. Afr. Inst. Min. Metall. 2008, 108, 261–271. [Google Scholar]
- Liu, F.P.; Liu, Z.H.; Li, Y.H.; Wilson, B.P.; Lundstrom, M. Recovery and separation of gallium(III) and germanium(IV) from zinc refinery residues: Part I: Leaching and iron(III) removal. Hydrometallurgy 2017, 169, 564–570. [Google Scholar] [CrossRef]
- Alfantazi, A.M.; Moskalyk, R.R. Processing of indium: A review. Miner. Eng. 2003, 16, 687–694. [Google Scholar] [CrossRef]
- Chmielarz, A.; Prajsnar, R.; Szołomicki, Z.; Becker, K.; Pietrek, W. A case study on indium recovery from by-product lead alloy. In Proceedings of the Pb-Zn, Duesseldorf, Germany, 14–17 June 2015; pp. 147–158. [Google Scholar]
- Howard, S.M. Ellingham Diagrams, Internet Resource for MET 320—Metallurgical Thermodynamics, South Dakota School of Mines and Technology, Rapid City, SD, USA. Available online: http://showard.sdsmt.edu/MET320/Handouts/EllinghamDiagrams/Ellingham_v22_Macro.pdf (accessed on 17 Dec 2018).
- Drzazga, M.; Prajsnar, R.; Chmielarz, A.; Benke, G.; Leszczyńska-Sejda, K.; Ciszewski, M.; Bilewska, K.; Krawiec, G. Germanium and Indium Recovery from Zinc Metallurgy by—Products—Dross Leaching in Sulphuric and Oxalic Acids. Metals 2018, 8, 1041. [Google Scholar] [CrossRef]

© 2019 by the authors. Licensee MDPI, Basel, Switzerland. This article is an open access article distributed under the terms and conditions of the Creative Commons Attribution (CC BY) license (http://creativecommons.org/licenses/by/4.0/).