Article

VHCF Response of Two AISI H13 Steels: Effect of Manufacturing Process and Size-Effect

Department of Mechanical and Aerospace Engineering, Politecnico di Torino, 10129 Turin, Italy
Metals 2019, 9(2), 133; https://doi.org/10.3390/met9020133
Submission received: 19 December 2018 / Revised: 18 January 2019 / Accepted: 22 January 2019 / Published: 26 January 2019
(This article belongs to the Special Issue Fatigue Design and Defects in Metals and Alloys)

Abstract

:
In the last decades, the fatigue lifetime of structural components has increased significantly and in many industrial applications (aerospace, automotive, and energy production industry) is even larger than 1010 cycles. Therefore, the interest in the Very High Cycle Fatigue (VHCF) behavior of materials has grown rapidly, becoming a subject of primary interest among university and industries. In high-strength steels, VHCF failures generally originate from defects/inclusions; consequently, the steel cleanliness significantly affects the VHCF response. Furthermore, since the probability of finding critical defects in a loaded volume increases with the loaded volume, the loaded volume also significantly affects the VHCF response. This is generally referred to as the “size-effect” in VHCF. The present paper investigates the effects of the manufacturing process and the size-effect on the VHCF response of an AISI H13 steel. Experimental tests were performed on hourglass and Gaussian specimens made of two different types of AISI H13 steels: Unrefined H13 and refined Electroslag Remelting (ESR) H13. The analysis of variance (ANOVA), which was carried out on the test results, and the P–S–N curves showed that the two factors (i.e., the manufacturing process and the size-effect) significantly affect the VHCF response.

1. Introduction

In the last decades, the fatigue lifetime of structural components has increased significantly, exceeding 10 10 cycles [1,2] in many industrial applications (aerospace, automotive, and energy production industry). For instance, according to Shanyavskiy’s research [2], a compressor blade subjected to high-frequency vibrations can reach 1010 cycles before the programmed maintenance. For these reasons, the interest in the Very High Cycle Fatigue (VHCF) behavior of materials has grown rapidly, becoming a subject of primary interest among university and industries.
According to the VHCF literature [1,3,4], high-strength steels employed in structural applications are prone to VHCF failures, which generally originate from the largest defect/inclusion present within the loaded volume (risk-volume, according to [3]). Therefore, the steel cleanliness and the defect population (quantity and size), which is controlled by the manufacturing process, significantly affect the VHCF response [3]. Moreover, according to the well-known dependency between defect size and risk-volume (i.e., the larger the risk-volume, the larger the probability of critical defects originating failure [3,5,6,7]), size-effect strongly influences the VHCF response of high-strength steels. The influence of the manufacturing process on the VHCF response and the size-effect are therefore of utmost interest among researchers and industries and must be properly experimentally assessed in order to prevent unexpected VHCF failures.
In the present paper, the VHCF response of a conventional AISI H13 steel and of a cleaner AISI H13 steel subjected to Electroslag Remelting (ESR) was experimentally assessed. Among the refinement processes currently employed for enhancing the steel cleanliness, the ESR is one of the most used in Europe since it permits removal of large detrimental defects to obtain very clean high-strength steels [8,9,10]. Fully reversed tension–compression tests were performed using the two ultrasonic testing machines (loading frequency of 20 kHz) available at DynLab in Politecnico di Torino on hourglass and Gaussian specimens [11,12,13,14] with significantly different risk-volumes to investigate size-effect in VHCF. Size-effect was investigated by the authors in previous papers by considering only unrefined H13 steel [11,13,14,15] and refined H13 [16] steel. However, in the present paper, all the experimental results of tests on hourglass (refined and unrefined) and Gaussian (refined and unrefined) H13 steel specimens (69 specimens) are gathered together, with the aim of investigating the interaction between the risk-volume (size-effect) and the manufacturing process (ESR effect) or, in general, the steel cleanliness. The enhancement of the VHCF response that can be attained with the ESR process, the detrimental effect of the size-effect, and the interactions between these two factors were discussed by comparing the inclusion population, the VHCF strength at 109 cycles, and the P–S–N curves [17].

2. Materials and Methods

This section describes the experimental activity in detail: Section 2.1. concerns the material properties of the two investigated H13 steels, Section 2.2. reports the specimen geometry, and Section 2.3. describes the ultrasonic testing equipment used for the experimental tests. In the following, “H13” will refer to the unrefined H13 steel, whereas “H13-ESR” will refer to the refined H13 steel.

2.1. Material and ESR Process

The AISI H13 steel is classified as a hot-work tool steel, but it is also employed in applications where resistance to VHCF loads is required (e.g., fuel injectors for naval engines and aerospace components). The chemical composition of the investigated material, as provided by the steel manufacturer (Böhler Uddeholm Company, Milano, Italy), is reported in Table 1.
The H13 and the H13-ESR were obtained by conventional casting. After the production process, the H13-ESR was subjected to an ESR process, which involved a second remelting of the steel in a protective atmosphere and a subsequent fine, controlled solidification [14]. With the ESR process, micro- and macrosegregation and large defects were eliminated and the sulfur content was reduced [8], thus allowing for a significant enhancement of the steel cleanliness. On the other hand, the ESR refining process induced an increment of the steel production costs, making it 13% higher for the H13-ESR.
The Gaussian specimen shape (Section 2.2.) was obtained through a machining process starting from rectangular bars with the dimensions 32 × 32 × 115 mm. Both H13 and H13-ESR specimens were quenched and tempered in an ordinary industrial cycle. The heat treatment involved preheating at 1023 K (30 min), austenitizing at 1303 K (1 h), gas quenching, and triple tempering (first tempering at 793 K for 1 h, second tempering and third tempering for 1 h at 813 K), with subsequent cooling in the furnace, in order to obtain a homogeneous microstructure [14].
Preliminary tests were performed to assess the relevant mechanical properties of the investigated heat-treated H13 steels. Table 2 compares the longitudinal dynamic Young’s modulus, E d , measured with the Impulse Excitation Technique (IET) according to the ASTM Standard E1876-09 [18]; the tensile strength, σu, assessed through tensile tests (Instron 8801, Norwood, USA) and the Vickers hardness (NOVA 130, Innovatest, Maastricht, Netherlands), HV, measured according to the Standard EN ISO 6507-1 [19]. The minimum and maximum values for each property are reported in Table 2.
According to Table 2, σu and Ed are slightly larger after the ESR process. However, the difference is limited (maximum difference smaller than 6%), whereas the Vickers hardness is the same in H13 and in H13-ESR.

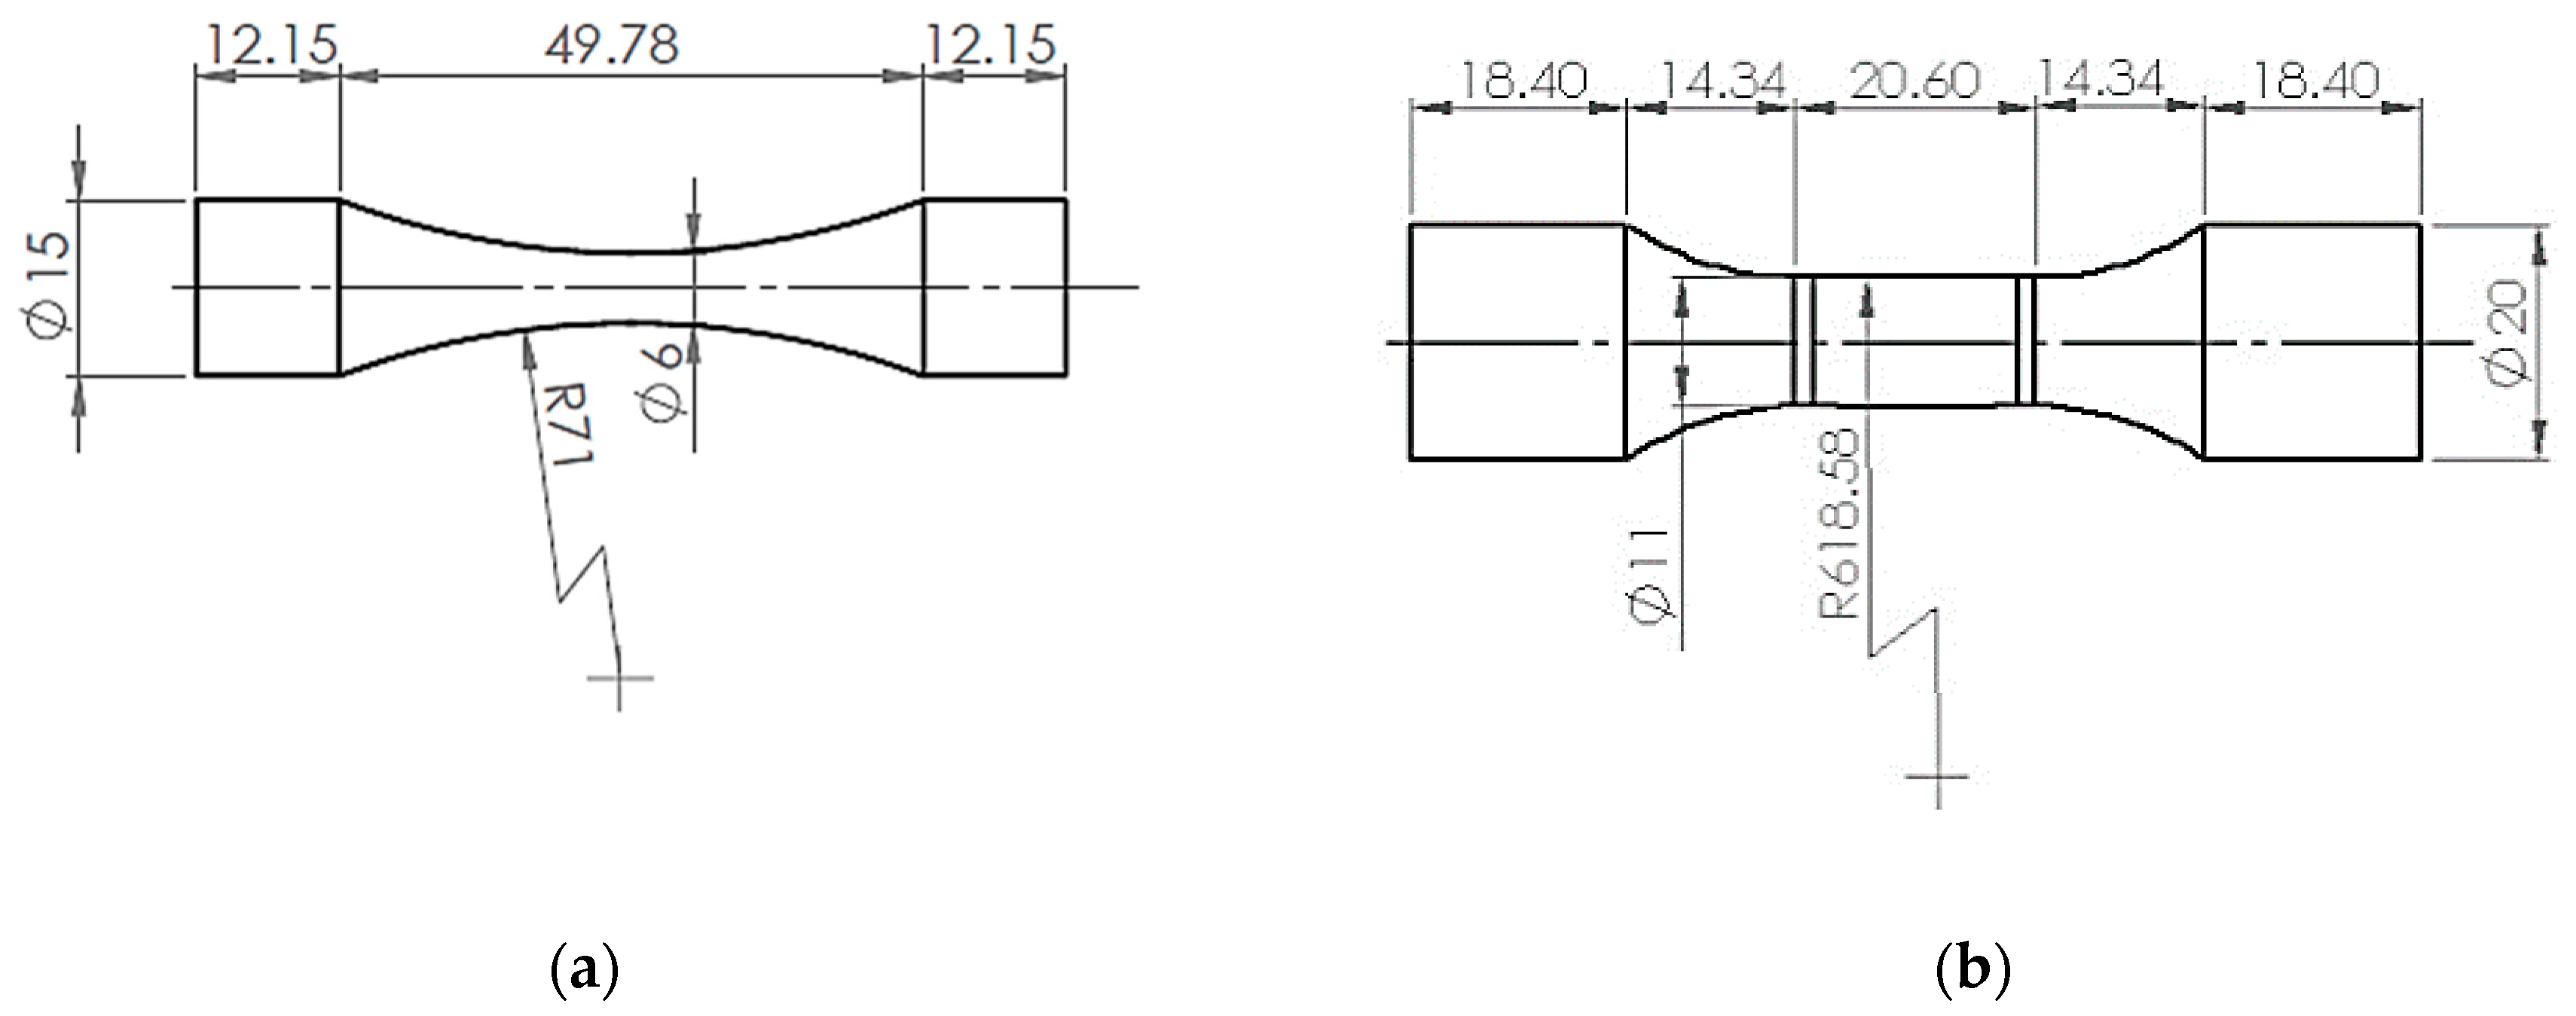
2.2. Specimen Design

Experimental tests were carried out on hourglass specimens (V90 = 194 mm3) and on Gaussian specimens (V90 = 2300 mm3) in order to assess the size-effect for the investigated steels. According to [3], the V90 is defined as the volume of material subjected to a stress amplitude larger than 90% of the maximum applied stress (i.e., the region where the stress is large enough to nucleate a fatigue crack, if a defect is present). The Gaussian specimen shape was introduced in [11,12] and permits the testing of V90 which is significantly larger than that attainable with traditional hourglass and dog-bone specimens [5,16,20,21,22].
Hourglass and Gaussian specimens were analytically designed according to the procedure reported in Reference [9] and verified through a Finite Element Analysis (FEA). Figure 1a,b shows the hourglass specimen and the Gaussian specimen used for the experimental tests, respectively.
Before the experimental tests, specimens were fine polished with sandpapers with increasing grit in order to remove superficial defects formed during the machining process and to enhance internal nucleation of cracks.

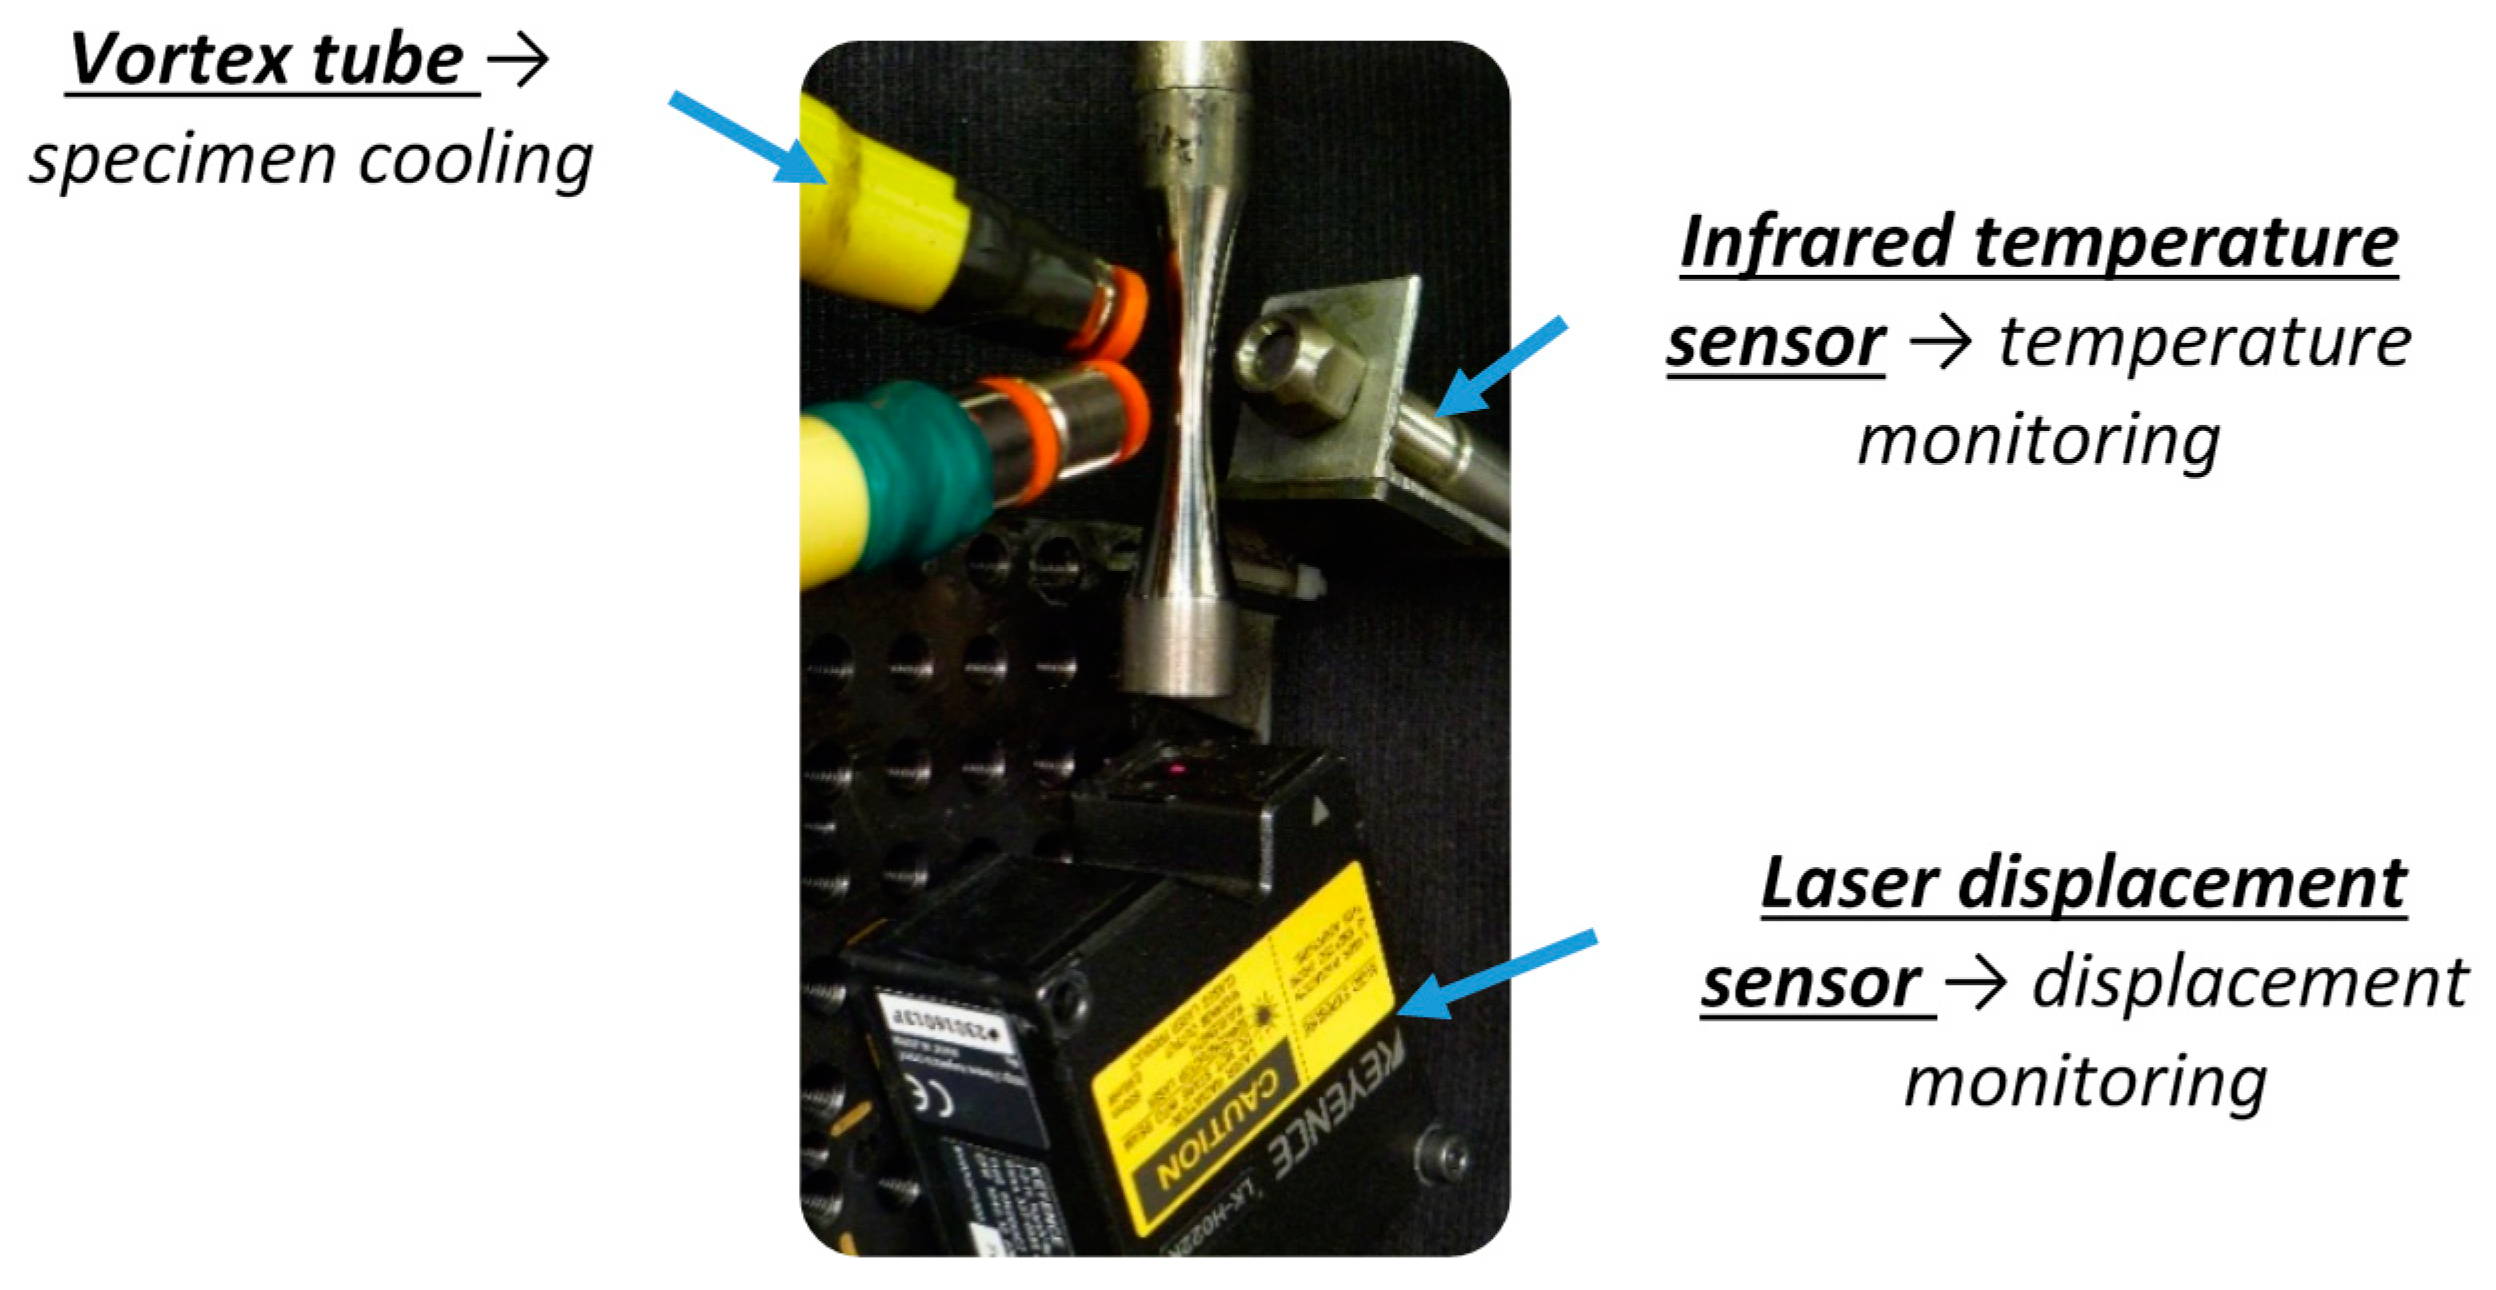
2.3. Ultrasonic Testing Configuration

Fully reversed tension–compression tests were carried out up to failure or up to 1010 cycles (runout specimen) by using the ultrasonic testing machines available at DynLab in Politecnico di Torino (Torino, Italy) [15]. The displacement amplitude at the specimen-free end, measured by using a laser displacement sensor (sample rate of 300 kHz), was kept constant during the experimental tests. Therefore, by assuming a macroscopic linear elasticity of the material, the stress amplitude at the specimen mid-section can be considered constant during the tests. The correlation between the measured displacement amplitude and the applied stress amplitude was obtained through an accurate strain-gage calibration.
Specimen temperature was also monitored during the test by using an infrared sensor (OPTRIS CT-LT-15, Optris GmbH, Berlin, Germany). Intermittent tests [23] were carried out to check that the specimen temperature remained between 298 K and 323 K. Vortex tubes were also employed to limit the temperature increment and to speed up the cooling phase. For the Gaussian specimens, temperature variation within the large risk-volume was verified to be smaller than 1% [24,25]. Figure 2 shows an hourglass specimen during an experimental test, with the vortex tubes, the temperature sensor, and the laser displacement sensor.

3. Experimental Results

In Section 3, the experimental results are presented and analyzed. Section 3.1 reports the experimental dataset. In Section 3.2, the fracture surfaces and the defects at the origin of the fatigue failures are investigated and compared. In Section 3.3, the VHCF strength at 109 cycles is estimated. Finally, in Section 3.4, the P–S–N curves are estimated and compared.

3.1. Experimental Dataset

The aim of the experimental tests was to obtain a large number of failures in the range between 108–1010 cycles (i.e., below the conventional fatigue limit or the “transition fatigue strength” [26,27,28,29,30]), in order to properly estimate and compare the VHCF response of the two tested H13 steels and to investigate the size-effect. Sixty-nine specimens were experimentally tested: All experimental failures originated from internal defects. The local stress amplitude at the defect location, denoted as s l o c a l and assessed through Finite Element Analysis (FEA), was considered as the applied stress during the test. s l o c a l was computed by considering the location of the defect originating the failure. The location was measured by using a high-resolution digital caliper (longitudinal direction) and through digital image processing of the fracture-surface images (Section 3.2.). With reference to the H13 steel, the Slocal range was [552–683] MPa for the hourglass specimens and [487–635] MPa for the Gaussian specimens. Regarding the H13-ESR, the applied stress amplitude range was [622–773] MPa for the hourglass, whereas it was [571–779] MPa for the Gaussian specimens. Figure 3 shows the S–N plot of the experimental results.
According to Figure 3, for both the H13 and the H13-ESR, hourglass specimen data are above Gaussian specimen data. In particular, the runouts in H13 steel occurred at 580 MPa for the hourglass specimens and at 493 MPa for the Gaussian specimens. With reference to the H13-ESR, the runout stress amplitude was equal to 630 MPa for hourglass specimens and reduced to 610 MPa for Gaussian specimens. Moreover, for the same specimen type, experimental failures for the H13-ESR steel were above failures for the H13 steel. The size-effect and the effect of the steel purity will be statistically analyzed in Section 3.3 and Section 3.4.

3.2. Defect Analysis

All fracture surfaces were observed by using a Scanning Electron Microscope, SEM (FEI Quanta 200 LV, FEI Company, Hillsboro, AL, USA and an optical microscope in order to determine the origin of the crack. Internal inclusions were at the origin of the fatigue crack in all the experimental failures; moreover, fracture surfaces showed a typical fish-eye morphology [1,3], depicted in Figure 4.
The morphology and the chemical composition of the inclusions originating the failure were investigated through the energy-dispersive X-ray spectroscopy (EDX, EDAX Genesis, EDAX Corporate, Mahwah, NJ, USA) technique. Globular oxide-type inclusions, with a high percentage of aluminum, calcium, and manganese, were at the origin of the fatigue failure in 65 out of 69 failures. In one case, the fatigue crack originated from a stringer-type inclusion with an irregular shape (H13 steel), and in three cases the crack originated from clusters of small inclusions (H13-ESR). Globular inclusions were the most critical and the most frequent defect in both the unrefined and refined H13 steels.
Figure 5 shows the different types of inclusions that were found: Figure 5a shows an example of globular inclusion; Figure 5b shows the stringer-type inclusion found in the H13 steel; and Figure 5c shows a cluster of inclusions found in the H13-ESR steel.
Finally, the inclusion size was analyzed. According to Reference [3], the inclusion originating the failure with size a d , 0 (i.e., the square root of the projected area of the inclusion) was considered as the largest defect in the risk-volume. Table 3 reports the smallest, a d , 0 m i n , and the largest, a d , 0 m a x , inclusion sizes for the tested hourglass and Gaussian specimens. Runout specimens were subjected to a second fatigue test to induce the internal failure and assess the largest defect present within the tested risk volume.
According to Table 3, inclusions originating failures in Gaussian specimens were significantly larger than those in hourglass specimens. In particular, a d , 0 m a x in Gaussian specimens was about 35% larger than a d , 0 m a x in hourglass specimens (37% for the H13 and 35% for the H13-ESR), showing a significant size-effect. The effect of the ESR process on the inclusion size was also relevant: a d , 0 m a x in H13-ESR Gaussian specimens was about half of a d , 0 m a x in H13 Gaussian. Moreover, inclusion size in H13-ESR was generally in a smaller range ( [ 10 31 ] μ m for H13-ESR and [ 21 56 ] μ m for H13), confirming the significant enhancement of the steel cleanliness attainable through the ESR process. The effect of the different inclusion size on the VHCF response, due to the size-effect and the ESR process, will be statistically investigated in the following subsections.

3.3. Size-Effect and ESR Process: Influence on the VHCF Strength
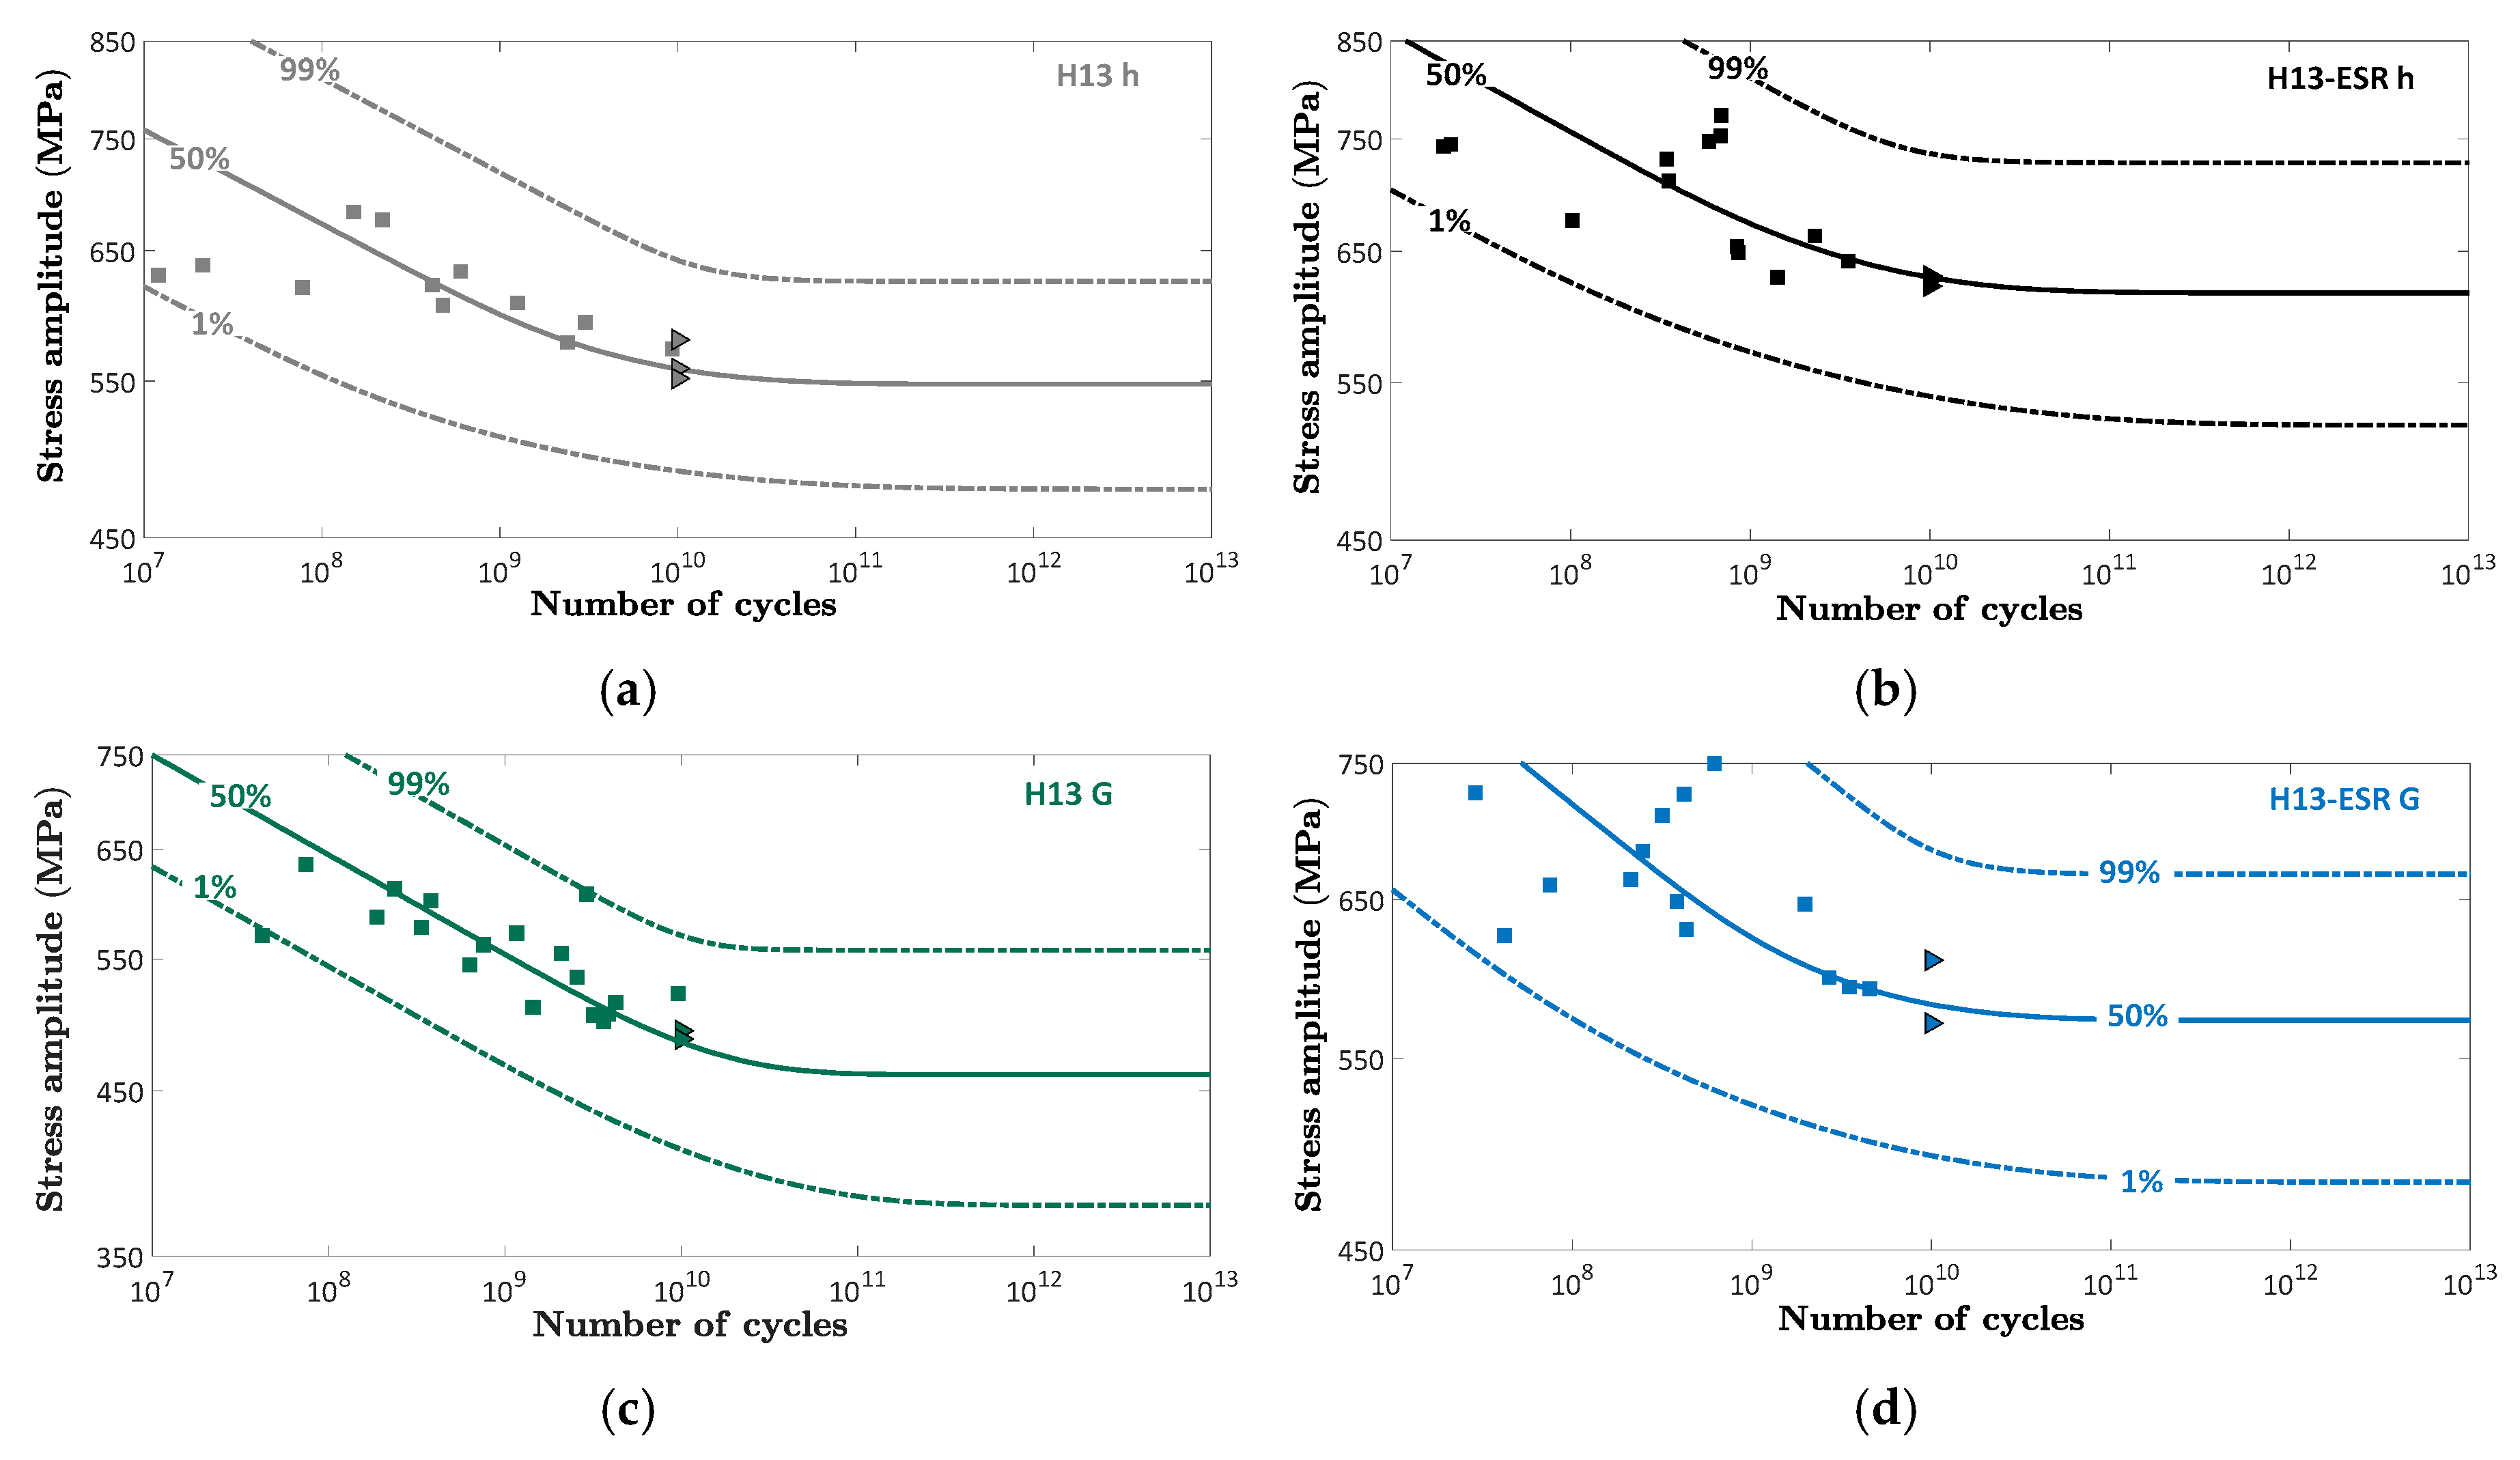
The influence of size-effect and ESR on the VHCF strength is investigated in this section. Following a procedure adopted in the VHCF literature [31,32], data were gathered together at the reference fatigue life, N f , r e f , by considering the relationship between mean fatigue life, stress amplitude, and defect size (Equation (1)):
log 10 [ N f ] = c Y + m Y log [ s l o c a l ] + n Y log 10 [ a d , 0 ] + Z σ Y
where N f is the number of cycles to failure; c Y , m Y , and n Y are constant coefficients; Z is the standardized normal random variable; and σ Y is the standard deviation.
Through easy passages [32], the VHCF strength (corrected VHCF strength, s c o r r ) at the reference number of cycles can be expressed by:
log 10 [ s c o r r ] = ( c Y m Y log 10 [ N f , r e f ] m Y + n Y m Y log 10 [ a d , 0 ] ) + Z σ Y m Y
According to Equation (2), s c o r r depends only on the inclusion size and therefore permits the assessment of the influence of the different inclusion size on the VHCF strength. According to Reference [32], it can be shown that s c o r r is a normal random variable with mean, μ S c o r r , equal to c Y m Y + log 10 [ N f , r e f ] m Y n Y m Y log 10 [ a d , 0 ] and standard deviation, σ S c o r r , equal to σ Y m Y . The probability-density function (pdf) of s c o r r , denoted as f S c o r r , can be finally expressed as:
f S c o r r = 1 σ S c o r r φ [ s c o r r μ S c o r r σ S c o r r ]
where φ [ · ] is the standardized normal pdf.
Figure 6 shows the estimated probability density function of s c o r r for N f , r e f = 10 9 cycles and for an initial defect size a d , 0 corresponding to the median defect size of each specimen type and production process (i.e., a d , 0 = 29   μ m for H13 hourglass, a d , 0 = 17   μ m for H13-ESR hourglass, a d , 0 = 36   μ m for H13 Gaussian, and a d , 0 = 23   μ m for H13-ESR Gaussian).
Analysis of variance (ANOVA) was used to statistically compare the experimental data. A 5% significance level was considered in the analysis. Sum of squares (SS), degrees of freedom (DOF), mean squares (MS), and the estimated P-value are reported in Table 4. The applicability of the ANOVA (variance heterogeneity) was also verified through Lavene’s tests.
According to the ANOVA results, the tested risk-volume and the manufacturing process significantly influenced the VHCF strength at 10 9 cycles. Experimental results therefore statistically confirm that size-effect must be taken into account when components are designed, especially if the risk-volume of experimentally tested specimens is significantly smaller than the risk-volume of components [33]. Moreover, Table 4 further confirms that the ESR process is effective in enhancing the steel cleanliness (Table 3) and that it has a positive influence on the VHCF response. On the other hand, the interaction between size and process cannot be considered significant for the VHCF strength at 10 9 cycles.

3.4. P–S–N Curves

P–S–N curves were estimated according to the model reported in [17]. In particular, the marginal P–S–N curves (i.e., the ones not conditioned to the inclusion size) were estimated according to the procedure reported in Reference [17]. For more details on the statistical model and on the parameter estimation, the reader is referred to [17]. Figure 7 shows the estimated marginal P–S–N curves: Figure 7a, H13 hourglass (H13 h); Figure 7b, H13-ESR hourglass (H13-ESR h); Figure 7c, H13 Gaussian (H13 G); and Figure 7d, H13-ESR Gaussian (H13-ESR G). The median, the 0.99th, and the 0.01th P–S–N curves are shown in each figure.
According to Figure 7, the model considered for the estimation of the P–S–N curves fits the experimental data well. All the experimental failures (except one) are included within the 98% confidence interval. The 0.01th P–S–N curves (99% reliability), which ensure an appropriate safety margin with respect to failures [32], can be considered for comparison. Figure 8 shows the 0.01th P–S–N curves for the investigated H13 and H13-ESR steel: In the figure, h refers to the hourglass specimens and G refers to the Gaussian specimens.
According to Figure 8, size-effect was relevant for both H13 and H13-ESR, especially for number of cycles above 10 9 and for the VHCF fatigue limit [3,17,34,35]. Larger size-effects were found by testing the unrefined H13: The fatigue limit reduced by about 21% when testing Gaussian H13, whereas it reduced by about 7% when testing Gaussian H13-ESR. The difference was quite constant for H13-ESR, while it increased with the number of cycles for H13. The enhancement of the steel cleanliness through the ESR process therefore contributed the limitation of size-effects in the VHCF region, above 10 9 cycles.
The ESR process significantly enhanced the VHCF response. By testing the hourglass specimens, the difference was quite constant and equal to 40   MPa , whereas it increased with the number of cycles by considering the Gaussian specimens, with a maximum equal to 105 MPa for the fatigue limit. The effect of the ESR process was more relevant for Gaussian specimens, since the range of a d , 0 and the difference between a d , 0 m a x (Table 3) were larger for specimens characterized by large risk-volumes. To conclude, the steel cleanliness has a strong effect on the VHCF response: The ESR process significantly enhanced VHCF response and limited size-effect, thanks to a significantly reduced inclusion size range (Table 3). The interactions between size-effect and steel cleanliness in VHCF, which have not been investigated previously in the literature and have been highlighted in the present paper by analyzing a large amount of experimental data, must be carefully taken into account when components characterized by very large risk-volumes are to be designed.

4. Conclusions

In the present paper, the effects of the risk-volume and of the manufacturing process on the Very High Cycle Fatigue (VHCF) response of an AISI H13 high-strength steel were experimentally investigated. A H13 steel obtained by conventional casting (H13 steel) and the same H13 steel subjected to an ESR process (H13-ESR) were experimentally tested. Fully reversed ultrasonic tension–compression tests were carried out on specimens characterized by significantly different risk-volumes to properly assess the size-effect. In particular, hourglass specimens, with a risk-volume of 194   mm 3 , and Gaussian specimens, with a risk-volume of 2300   mm 3 were experimentally tested.
All the fatigue failures originated from internal inclusions and showed a fish-eye morphology. The inclusions at the origin of the fatigue failure were at first compared: The critical inclusion population was the same in both unrefined and refined H13 steel and globular inclusions were found to be the most critical and the most frequent defects. Regarding the inclusion size, the inclusions originating failures were significantly larger in Gaussian specimens than those in hourglass specimens. In particular, the largest defect in Gaussian specimens was found to be about 35% larger than that in hourglass specimens, showing a significant size-effect. The effect of the ESR process on the inclusion size was also relevant: Inclusion size in H13-ESR was in a smaller range ( [ 10 31 ]   μ m for H13-ESR and [ 21 56 ]   μ m for H13), confirming the significant enhancement of the steel cleanliness attainable through the ESR process.
Finally, the VHCF strength at 109 cycles was statistically compared: The risk-volume and the manufacturing process were found to significantly affect the VHCF response. The 0.01th P–S–N curves were also compared. The size-effect was found to significantly affect the VHCF response of both H13 and H13-ESR: For the same material condition, the P–S–N curves estimated from the results of tests on hourglass specimens were above the P–S–N curves estimated from the results of tests on Gaussian specimens. The ESR process also significantly affected the VHCF response, with larger differences (compared to the unrefined H13 steel) at very high number of cycles (larger than 109) and in case of Gaussian specimens. The enhancement of the steel cleanliness through the ESR process, moreover, was found to limit the size-effect, mainly due to a significantly reduced inclusion-size range after the refining process. To conclude, the ESR process can be employed to significantly enhance the VHCF response of high-strength steels. Moreover, the interactions between size-effect and steel cleanliness, which have been highlighted in the present paper, must be carefully taken into account when components are to be designed.

Funding

This research received no external funding.

Conflicts of Interest

The author declares no conflict of interest.

References

  1. Bathias, C.; Paris, P.C. Gigacycle Fatigue in Mechanical Practice, 1st ed.; CRC Dekker: New York, NY, USA, 2004. [Google Scholar]
  2. Shanyavskiy, A.A. Very-high-cycle-fatigue of in-service air-engine blades, compressor and turbine. Sci. China Phys. Mech. Astron. 2014, 57, 19–29. [Google Scholar] [CrossRef]
  3. Murakami, Y. Metal Fatigue: Effects of Small Defects and Nonmetallic Inclusions, 1st ed.; Elsevier Ltd: Oxford, UK, 2002. [Google Scholar]
  4. Akiniwa, Y.; Stanzl-Tschegg, S.; Mayer, H.; Wakita, M.; Tanaka, K. Fatigue strength of spring steel under axial and torsional loading in the very high cycle regime. Int. J. Fatigue 2008, 94, 178–191. [Google Scholar] [CrossRef]
  5. Furuya, Y. Notable size effects on very high cycle fatigue properties of high strength steel. Mater. Sci. Eng. A 2011, 528, 5234–5240. [Google Scholar] [CrossRef]
  6. Paolino, D.S.; Tridello, A.; Chiandussi, G.; Rossetto, M. Crack growth from internal defects and related size-effect in VHCF. Proced. Struct. Integr. 2017, 5, 247–254. [Google Scholar] [CrossRef]
  7. Paolino, D.S.; Tridello, A.; Chiandussi, G.; Rossetto, M. Effect of defect size on P-S-N curves in very-high-cycle fatigue. Proced. Struct. Integr. 2017, 7, 335–342. [Google Scholar] [CrossRef]
  8. Totten, G.E.; Xie, L.; Funatani, K. Handbook of Mechanical Alloy Design, 1st ed.; CRC Press: New York, NY, USA, 2003. [Google Scholar]
  9. Sawahata, A.; Tanigawa, H.; Enomoto, M. Effects of ElectroSlag Remelting on inclusion formation and impact property of reduced activation ferritic/martensitic steels. J. Jpn. Inst. Met. 2008, 72, 176–180. [Google Scholar] [CrossRef]
  10. Zhang, L.; Allanore, A.; Wang, C.; Yurko, J.A.; Crapps, J. Materials Processing Fundamentals, 1st ed.; John Wiley & Sons: Hoboken, NJ, USA, 2013. [Google Scholar]
  11. Tridello, A.; Paolino, D.S.; Chiandussi, G.; Rossetto, M. Analytical design of gigacycle fatigue specimens for size effect evaluation. Key Eng. Mater. 2014, 577–558, 369–372. [Google Scholar] [CrossRef]
  12. Paolino, D.S.; Tridello, A.; Chiandussi, G.; Rossetto, M. On specimen design for size effect evaluation in ultrasonic gigacycle fatigue testing. Fatigue Fract. Eng. Mater. Struct. 2014, 37, 570–579. [Google Scholar] [CrossRef] [Green Version]
  13. Tridello, A.; Paolino, D.S.; Chiandussi, G.; Rossetto, M. VHCF response of AISI H13 steel: Assessment of size effects through Gaussian specimens. Proced. Eng. 2015, 109, 121–127. [Google Scholar] [CrossRef]
  14. Tridello, A. VHCF response of Gaussian specimens made of high-strength steels: Comparison between unrefined and refined AISI H13. Fatigue Fract. Eng. Mater. Struct. 2017, 40, 1676–1689. [Google Scholar] [CrossRef]
  15. Paolino, D.S.; Rossetto, M.; Chiandussi, G.; Tridello, A. Sviluppo di una Macchina a Ultrasuoni per Prove di Fatica Gigaciclica. In Proceedings of the 41th AIAS Conference, Vicenza, Italy, 5–8 September 2012. (In Italian). [Google Scholar]
  16. Tridello, A.; Paolino, D.S.; Chiandussi, G.; Rossetto, M. VHCF strength decrement in large H13 steel specimens subjected to ESR process. Proced. Struct. Integr. 2016, 2, 1117–1124. [Google Scholar] [CrossRef] [Green Version]
  17. Paolino, D.S.; Tridello, A.; Chiandussi, G.; Rossetto, M. S-N curves in the very-high-cycle fatigue regime: Statistical modeling based on the hydrogen embrittlement consideration. Fatigue Fract. Eng. Mater. Struct. 2016, 39, 1319–1336. [Google Scholar] [CrossRef]
  18. ASTM International. Standard Test Method for Dynamic Young’s Modulus, Shear Modulus, and Poisson’s Ratio by Impulse Excitation of Vibration; ASTM Standard E1876-09; ASTM Standard: West Conshohocken, PA, USA, 2009. [Google Scholar]
  19. EN ISO 6507-1 Metallic Materials—Vickers Hardness Test—Part 1: Test Method; International Standard Organization (ISO): Genève, Switzerland, 2005.
  20. Tridello, A.; Paolino, D.S.; Chiandussi, G.; Rossetto, M. Comparison between dog-bone and Gaussian specimens for size effect evaluation in gigacycle fatigue. Frattura e Integrità Strutturale 2013, 26, 49–56. [Google Scholar] [CrossRef]
  21. Tridello, A.; Paolino, D.S.; Chiandussi, G.; Rossetto, M. VHCF response of H13 steels produced with different manufacturing processes. Proced. Eng. 2016, 160, 93–100. [Google Scholar] [CrossRef]
  22. Tridello, A.; Paolino, D.S.; Chiandussi, G.; Rossetto, M. Effect of electroslag remelting on the VHCF response of an AISI H13 steel. Fatigue Fract. Eng. Mater. Struct. 2017, 40, 1783–1794. [Google Scholar] [CrossRef]
  23. Stanzl-Tschegg, S. Very high cycle fatigue measuring techniques. Int. J. Fatigue 2014, 60, 2–17. [Google Scholar] [CrossRef]
  24. Tridello, A.; Paolino, D.S.; Chiandussi, G.; Rossetto, M. Gaussian specimens for gigacycle fatigue tests: Evaluation of temperature increment. Key Eng. Mater. 2015, 625, 85–88. [Google Scholar] [CrossRef]
  25. Tridello, A.; Paolino, D.S.; Chiandussi, G.; Rossetto, M. Gaussian specimens for VHCF tests: Analytical prediction of damping effects. Int. J. Fatigue 2016, 83, 36–41. [Google Scholar] [CrossRef]
  26. Bathias, C. There is no infinite fatigue life in metallic materials. Fatigue Fract. Eng. Mater. Struct. 1999, 22, 559–565. [Google Scholar] [CrossRef]
  27. Sakai, T.; Lian, B.; Takeda, M.; Shiozawa, K.; Oguma, N.; Ochi, Y.; Nakajima, M.; Nakamura, T. Statistical duplex S-N characteristics of high carbon chromium bearing steel in rotating bending in very high cycle regime. Int. J. Fatigue 2010, 32, 497–504. [Google Scholar] [CrossRef]
  28. Pyttel, B.; Schwerdt, D.; Berger, C. Very high cycle fatigue—Is there a fatigue limit? Int. J. Fatigue 2011, 33, 49–58. [Google Scholar] [CrossRef]
  29. Paolino, D.S.; Tridello, A.; Chiandussi, G.; Rossetto, M. Statistical distributions of transition fatigue strength and transition fatigue life in duplex S-N fatigue curves. Theor. Appl. Fract. Mec 2015, 80, 31–39. [Google Scholar] [CrossRef]
  30. Paolino, D.S.; Tridello, A.; Geng, H.S.; Chiandussi, G.; Rossetto, M. Duplex S-N fatigue curves: Statistical distribution of the transition fatigue life. Frattura e Integrità Strutturale 2014, 30, 417–423. [Google Scholar] [CrossRef]
  31. Schuller, R.; Fitzka, M.; Irrasch, D.; Tran, D.; Pennings, B.; Mayer, H. VHCF properties of nitrided 18Ni maraging steel thin sheets with different Co and Ti content. Fatigue Fract. Eng. Mater. Struct. 2015, 38, 518–527. [Google Scholar] [CrossRef]
  32. Tridello, A.; Biffi, C.A.; Fiocchi, J.; Bassani, P.; Chiandussi, G.; Rossetto, M.; Tuissi, A.; Paolino, D.S. VHCF response of as-built SLM AlSi10Mg specimens with large loaded volume. Fatigue Fract. Eng. Mater. Struct. 2018, 41, 1918–1928. [Google Scholar] [CrossRef]
  33. Zhang, J.W.; Lu, L.T.; Wu, P.B.; Ma, J.J.; Wang, G.G.; Zhang, W.H. Inclusion size evaluation and fatigue strength analysis of 35CrMo alloy railway axle steel. Mater. Sci. Eng. A 2013, 562, 211–217. [Google Scholar] [CrossRef]
  34. Sakai, T. Review and prospects for current studies on very high cycle fatigue of metallic materials for machine structural use. J. Solid Mech. Mater. Eng. 2009, 3, 425–439. [Google Scholar] [CrossRef]
  35. Paolino, D.S.; Tridello, A.; Chiandussi, G.; Rossetto, M. A general model for crack growth from initial defect in very-high-cycle fatigue. Proced. Struct. Integr. 2017, 3, 411–423. [Google Scholar] [CrossRef]
Figure 1. Drawings of tested specimens: (a) hourglass specimen; (b) Gaussian specimen.
Metals 09 00133 g001
Figure 2. Typical ultrasonic Very High Cycle Fatigue (VHCF) testing configuration.
Metals 09 00133 g002
Figure 3. S–N plot of the experimental results.
Metals 09 00133 g003
Figure 4. Typical fish-eye morphology, which was experimentally found and observed with a scanning electron microscope.
Metals 09 00133 g004
Figure 5. Types of inclusions originating the VHCF failures: (a) globular oxide-type inclusion, (b) stringer-type inclusion, (c) cluster of small inclusions.
Metals 09 00133 g005
Figure 6. Corrected VHCF strength and probability density function for the tested specimens.
Metals 09 00133 g006
Figure 7. Marginal P–S–N curve: (a) H13 hourglass, (b) H13-ESR hourglass, (c) H13 Gaussian, (d) H13-ESR Gaussian.
Metals 09 00133 g007
Figure 8. The 0.01th P–S–N curves for the tested H13 steels.
Metals 09 00133 g008
Table 1. Chemical composition of the investigated AISI H13 steel.
ElementCSiMnCrMoV
%0.3910.40.45.30.9
Table 2. Relevant mechanical properties of the two investigated H13 steels.
MaterialEd (GPa)σu (MPa)HV (HV)
H13211.7–211.91987–2021554–570
H13-ESR212.8–212.92085–2105555–562
Table 3. Inclusions originating failures: Smallest and largest values.
MaterialSpecimen a d , 0 m i n (μm) a d , 0 m a x (μm)
H13Hourglass2141
H13Gaussian1956
H13-ESRHourglass1023
H13-ESRGaussian1531
Table 4. ANOVA analysis to assess the influence of size and process on the VHCF strength. Stars denote significant factors.
-SSDOFMSp-Value
Process0.038810.03640.000 *
Size0.013810.01380.002 *
Interaction0.000210.00020.727
Error0.0697550.0013-
Total0.122458--

