Numerical Simulation of Steel Reinforced Concrete (SRC) Joints


Abstract
1. Introduction
2. Objectives
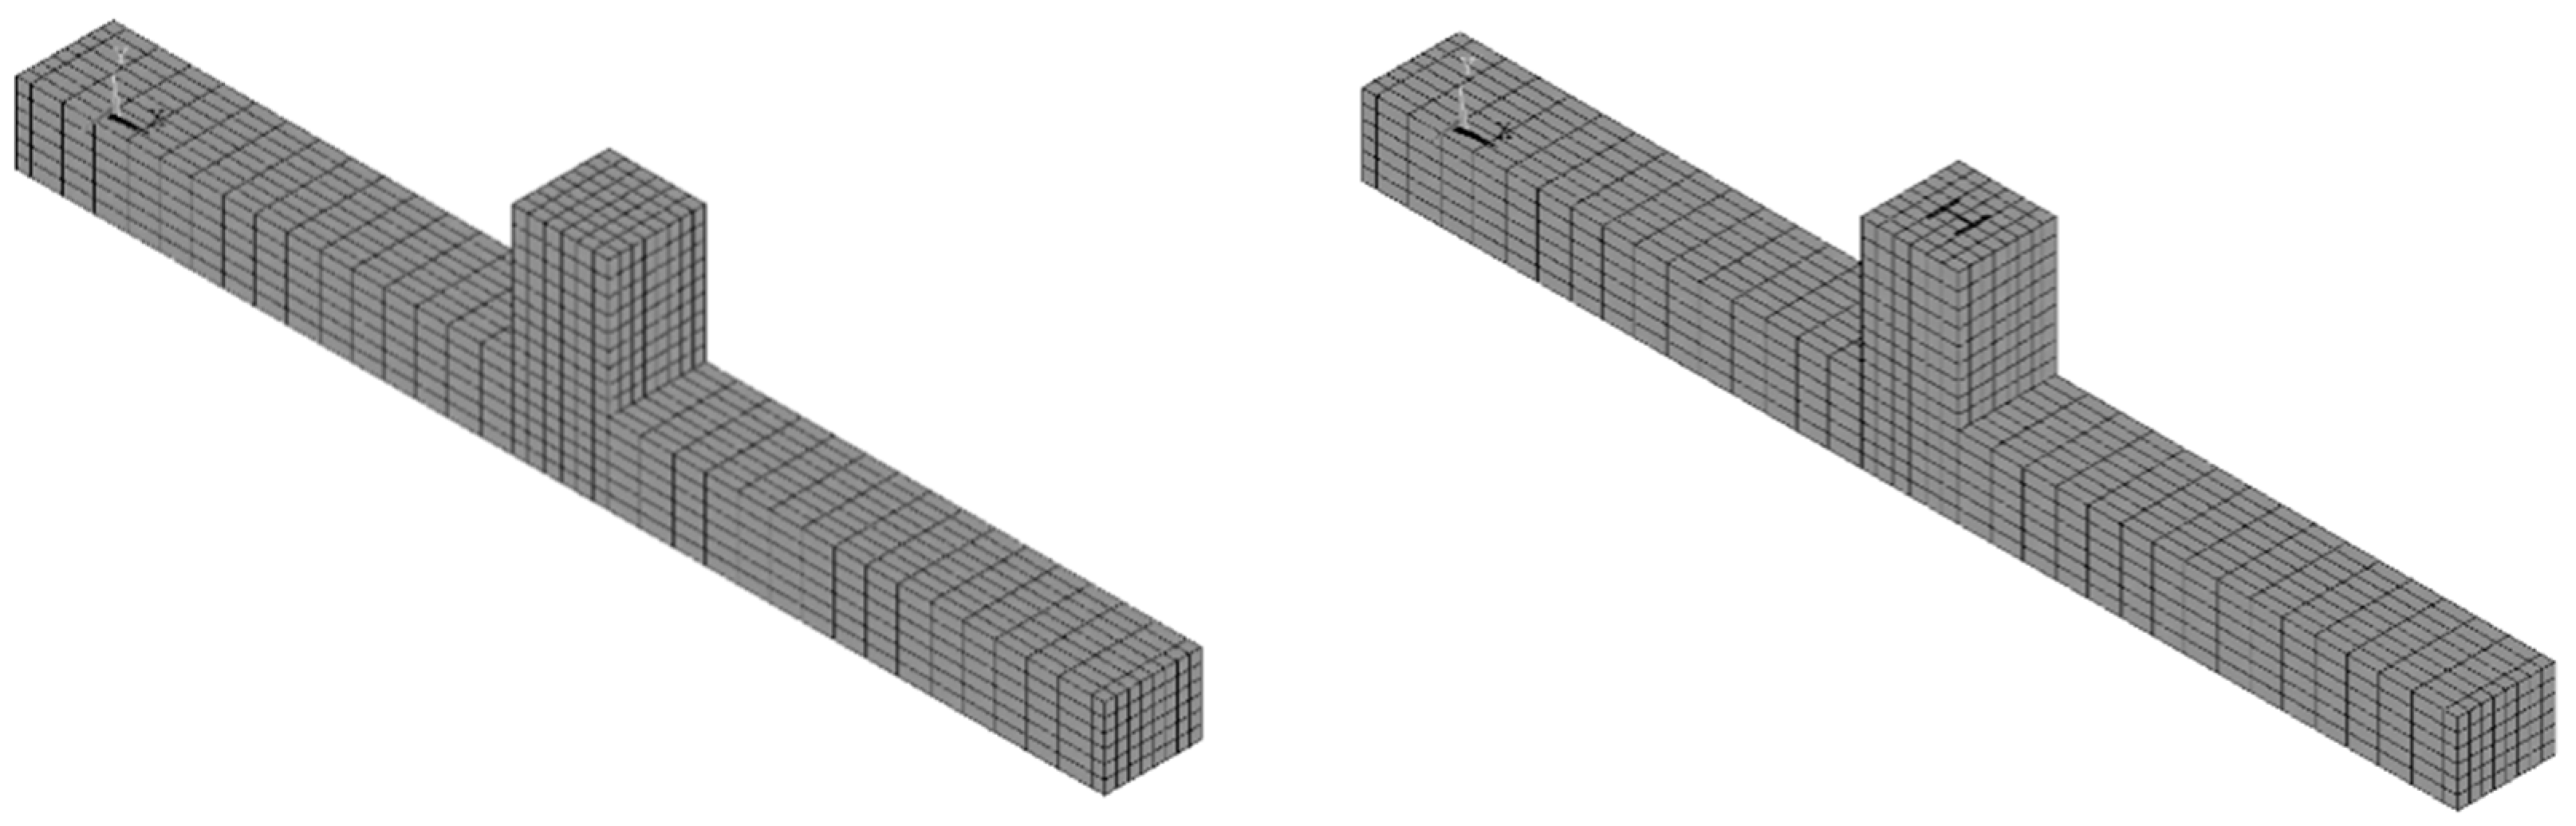
3. Numerical Simulation
3.1. Numerical Model
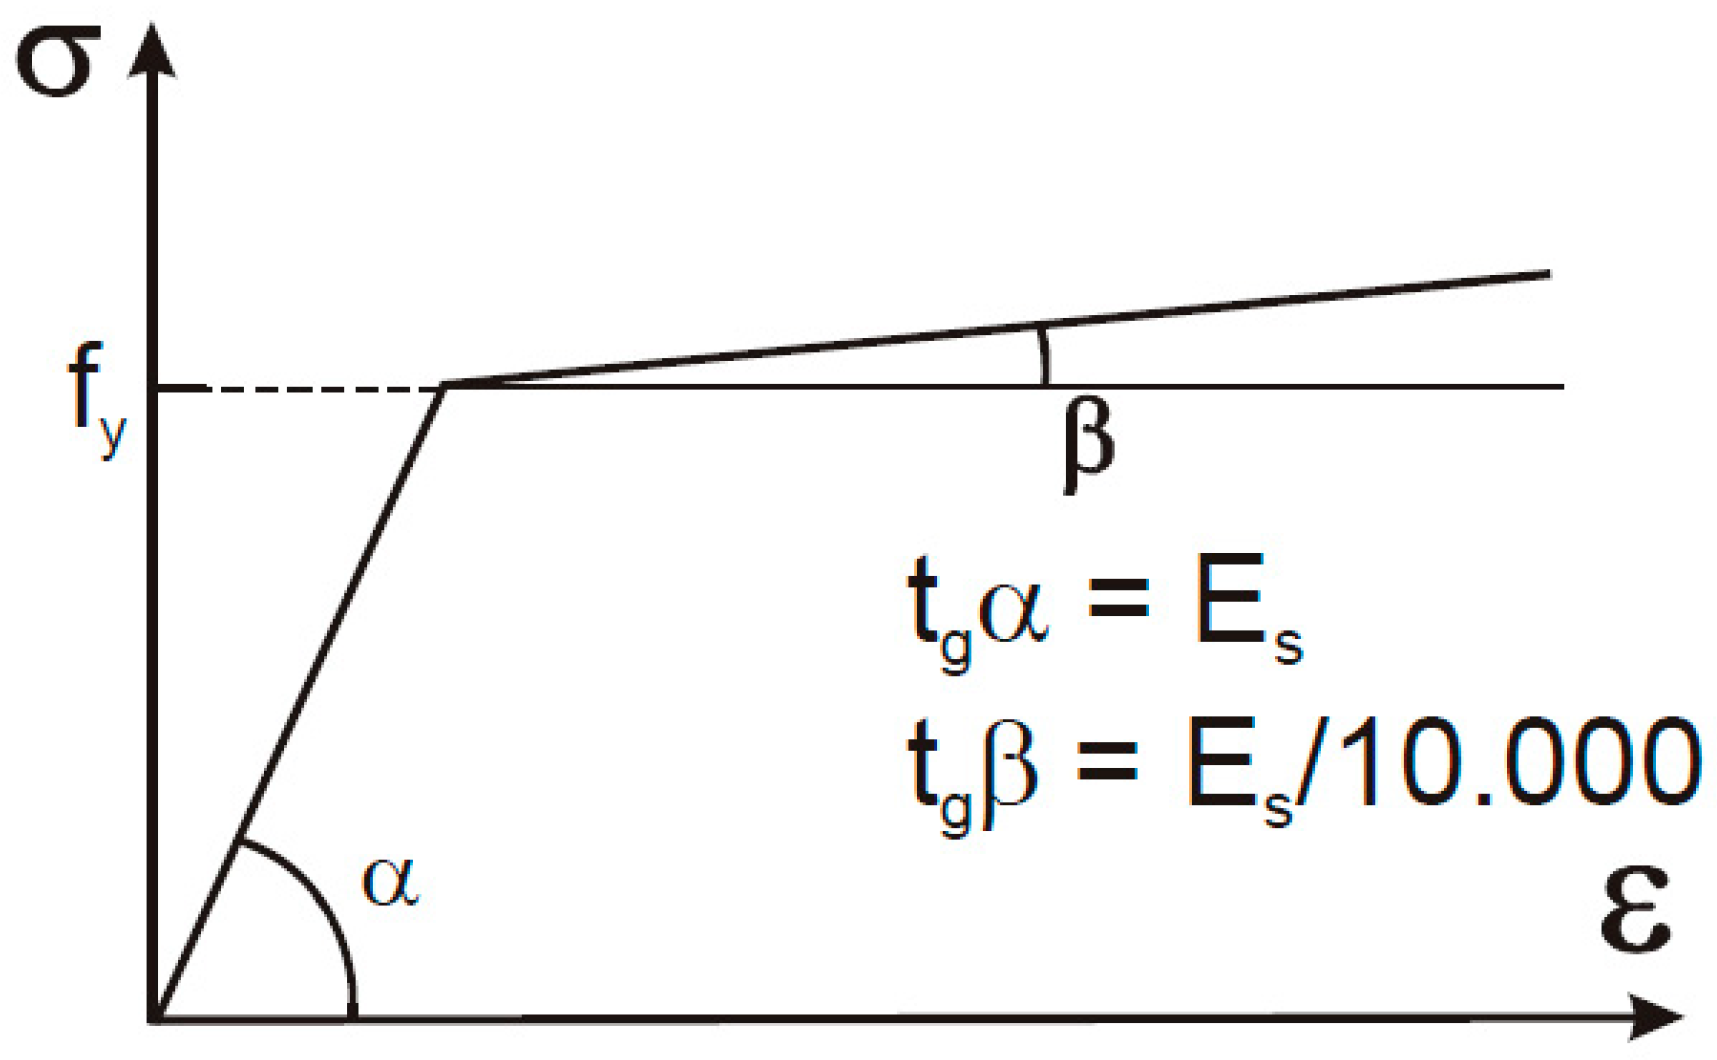
3.2. Materials
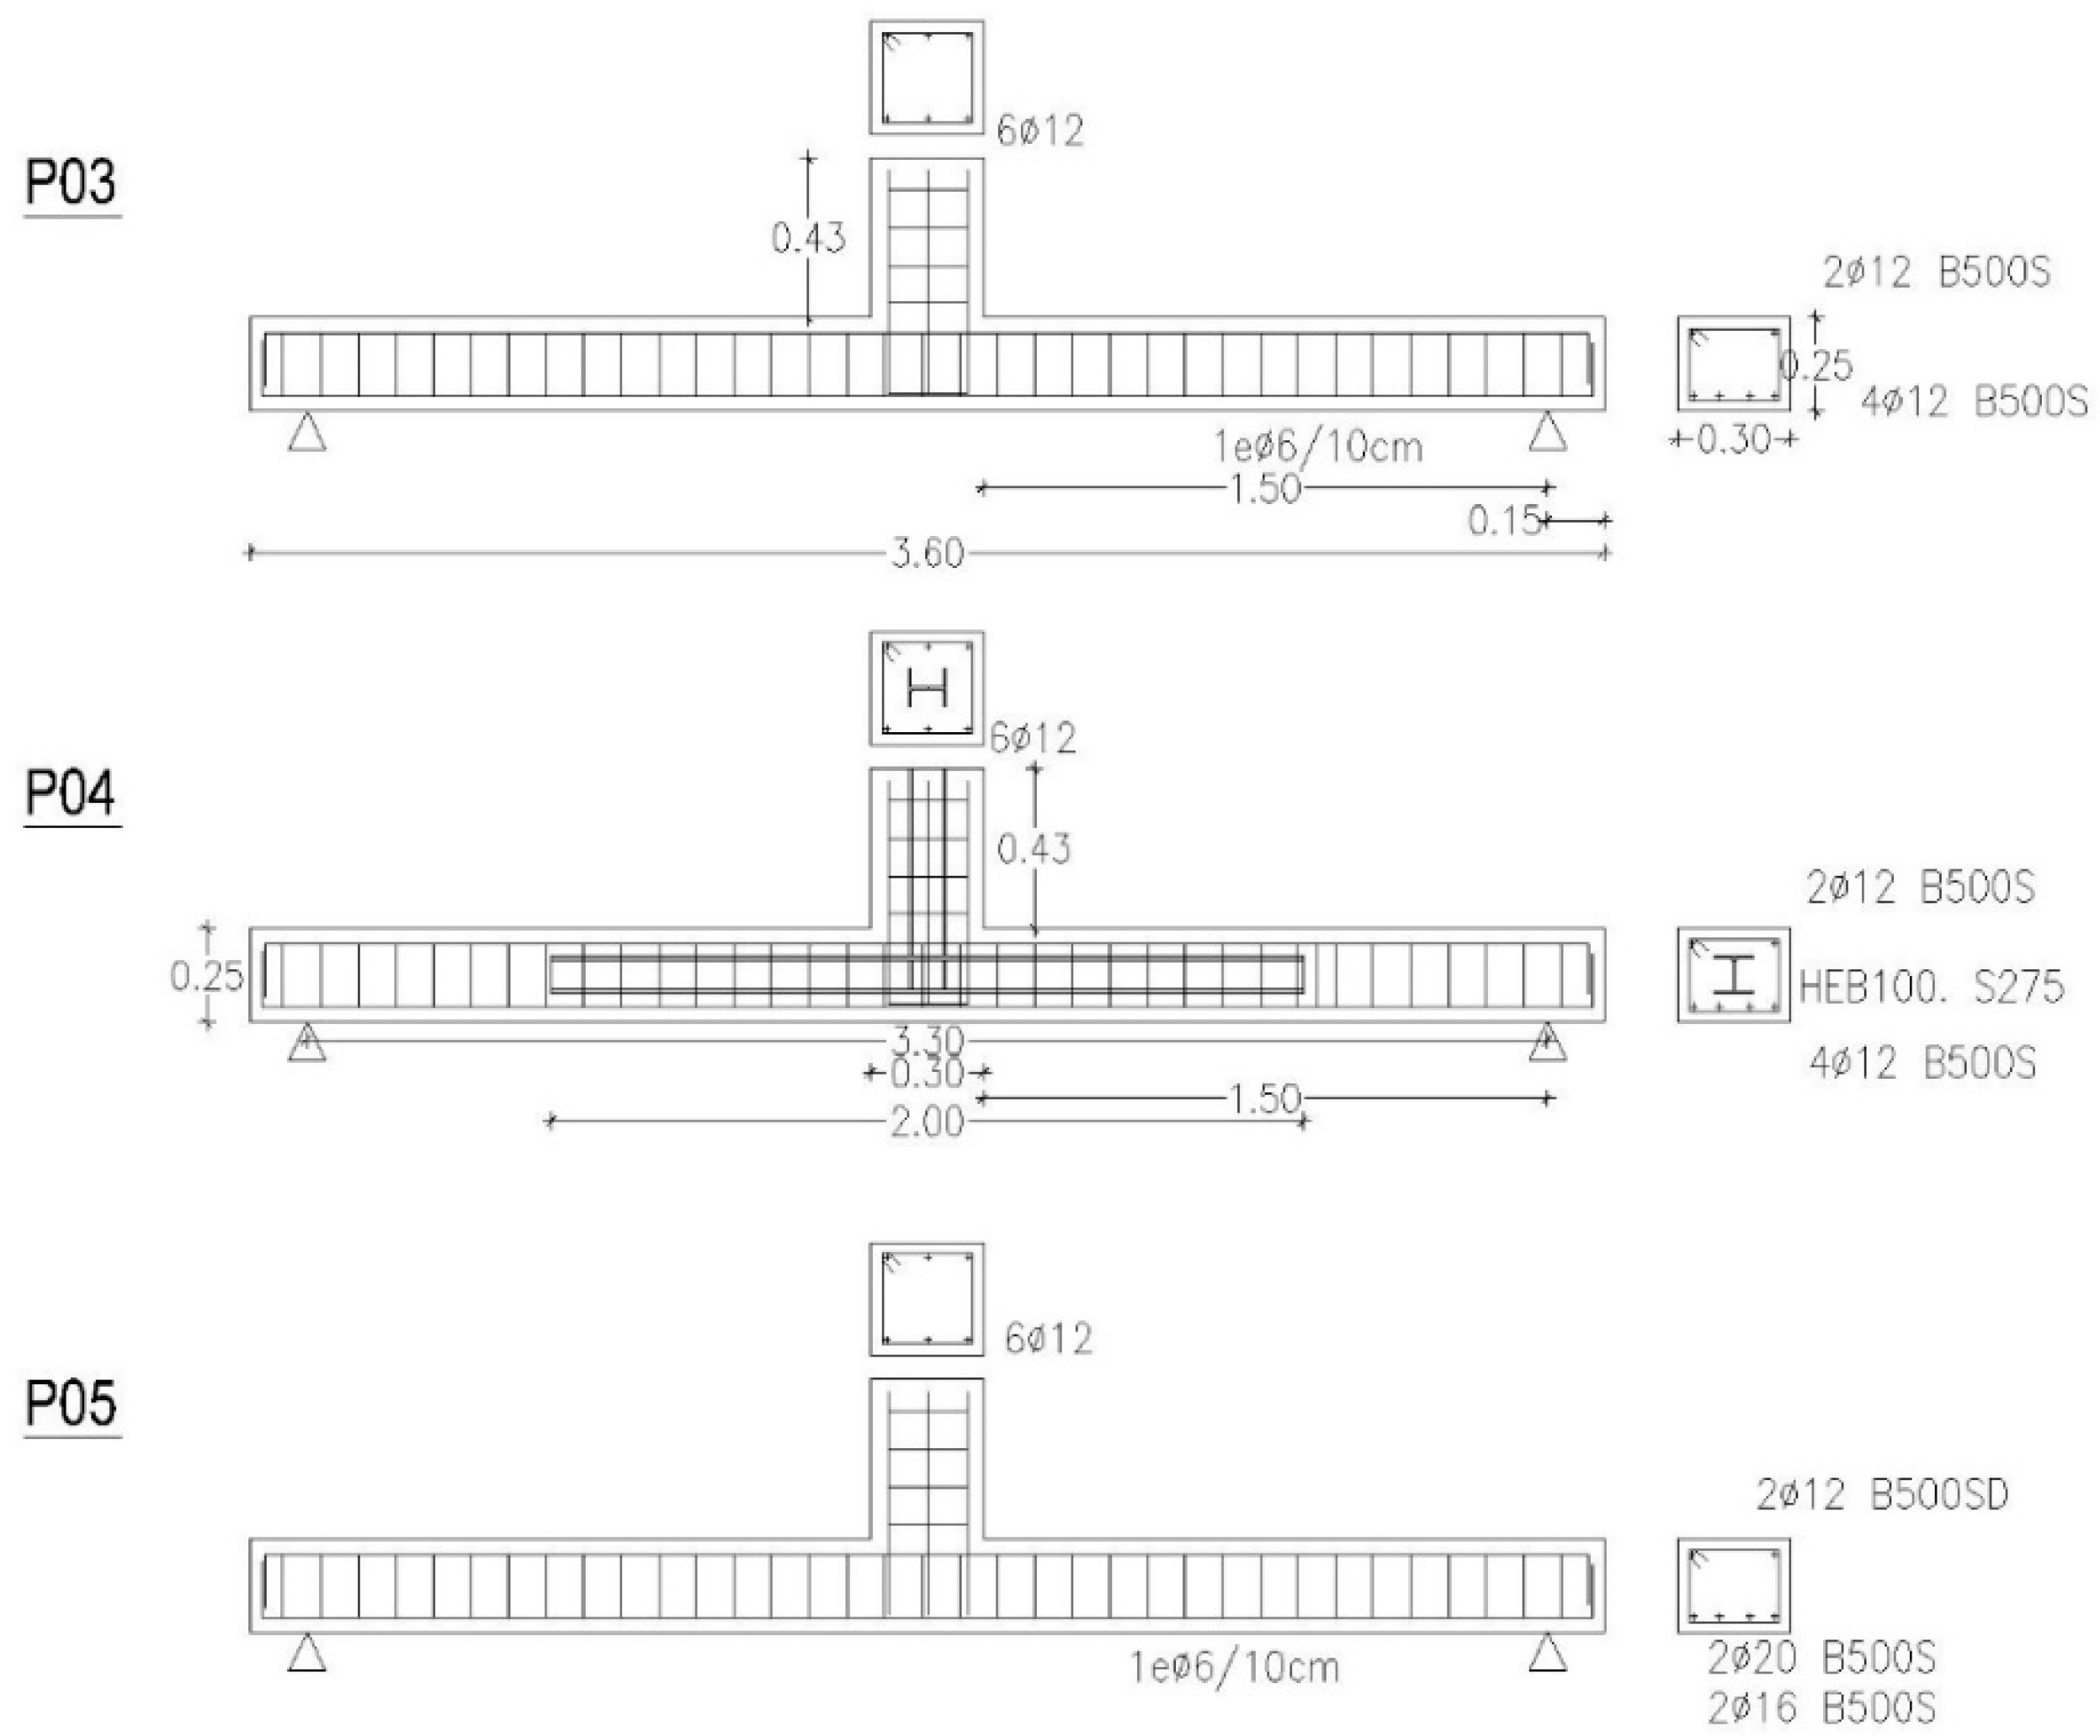
4. Simulated Models
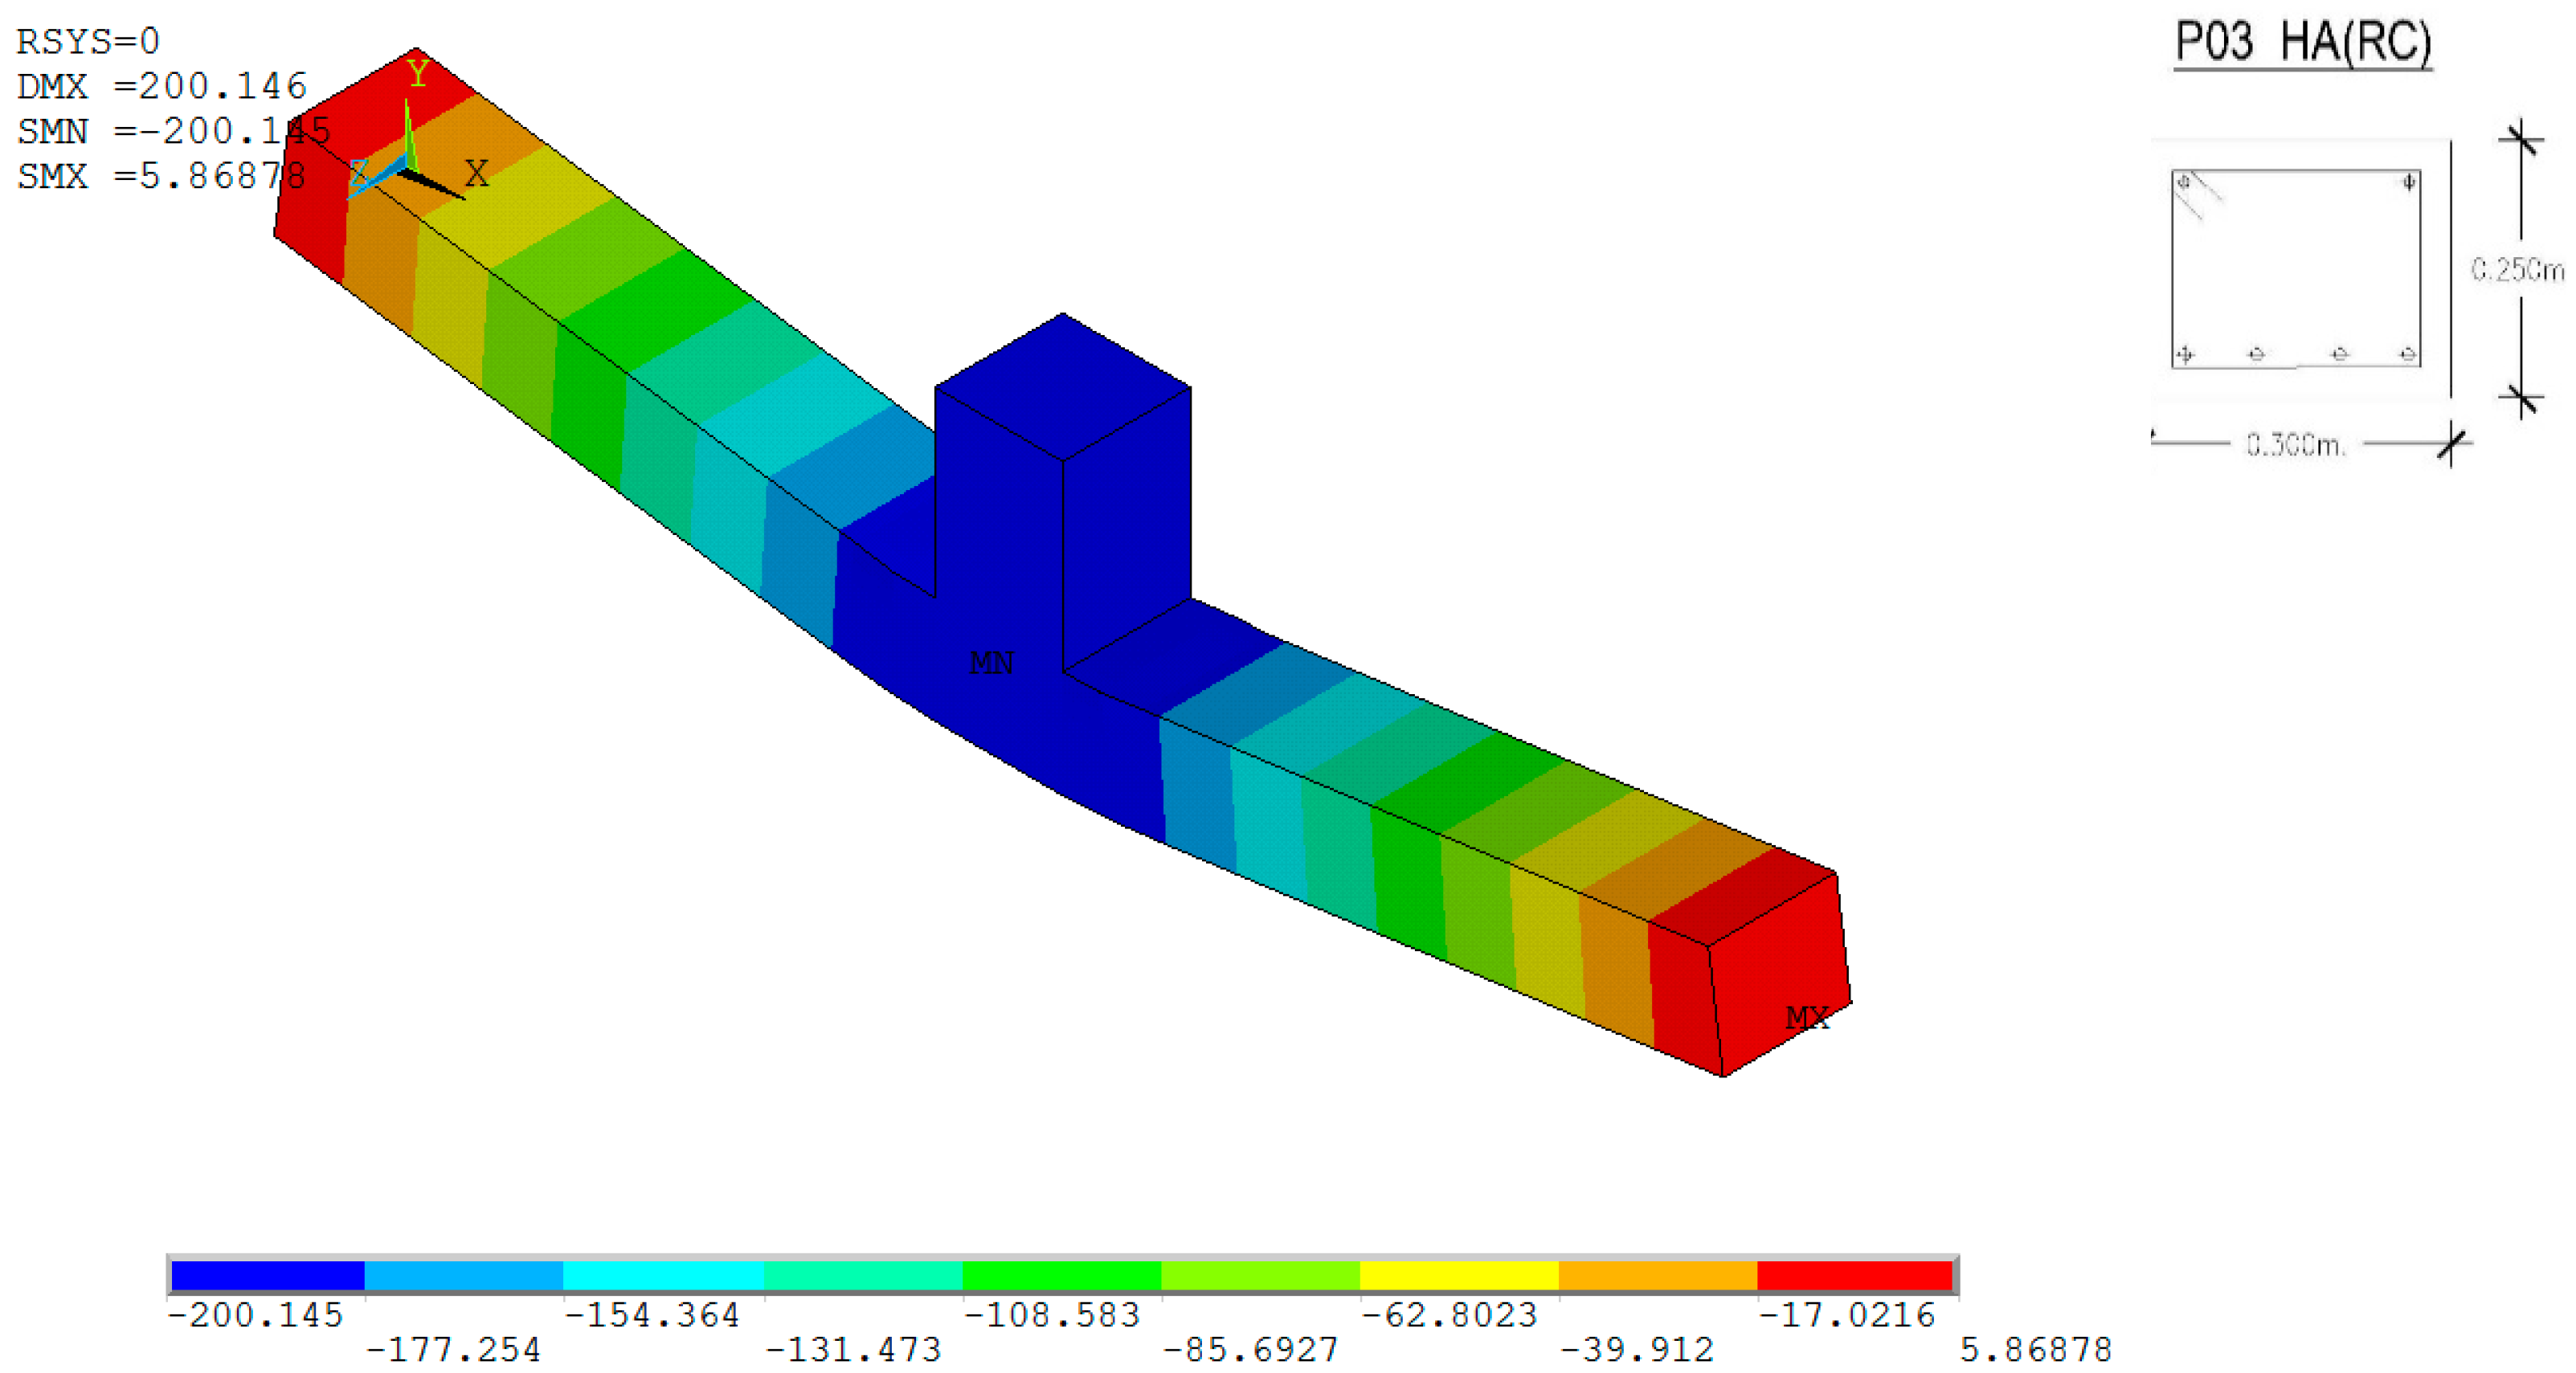
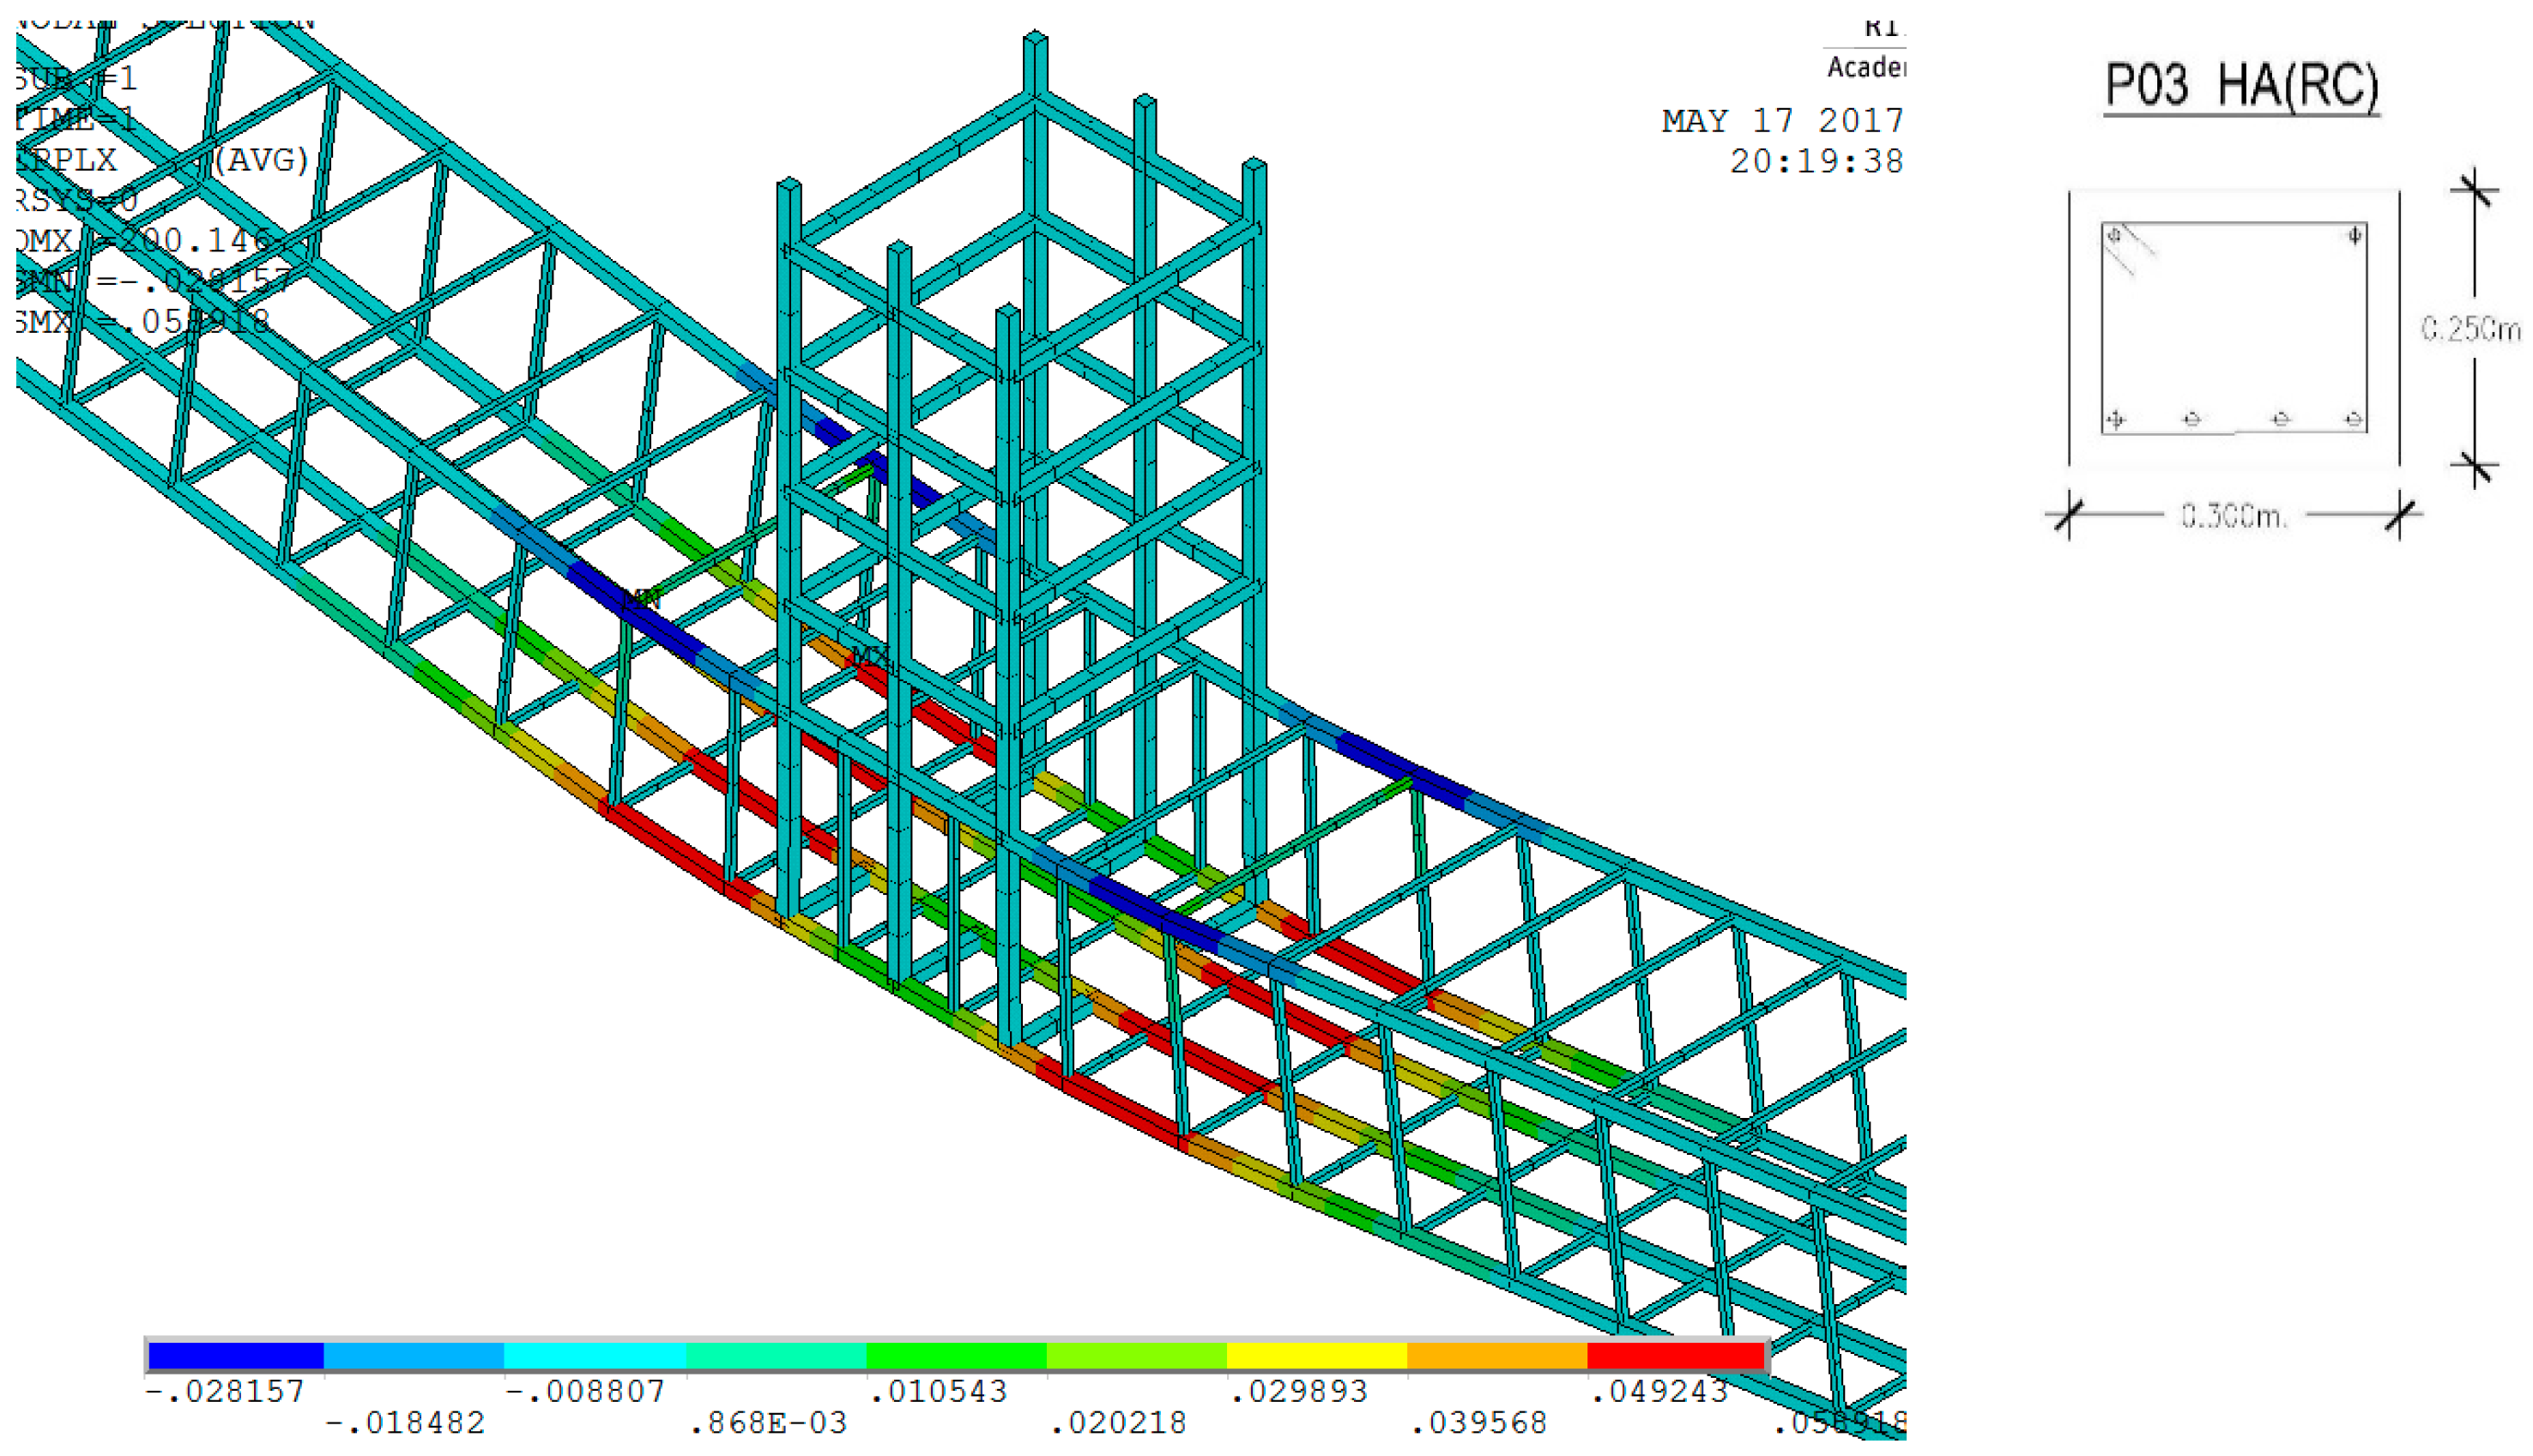
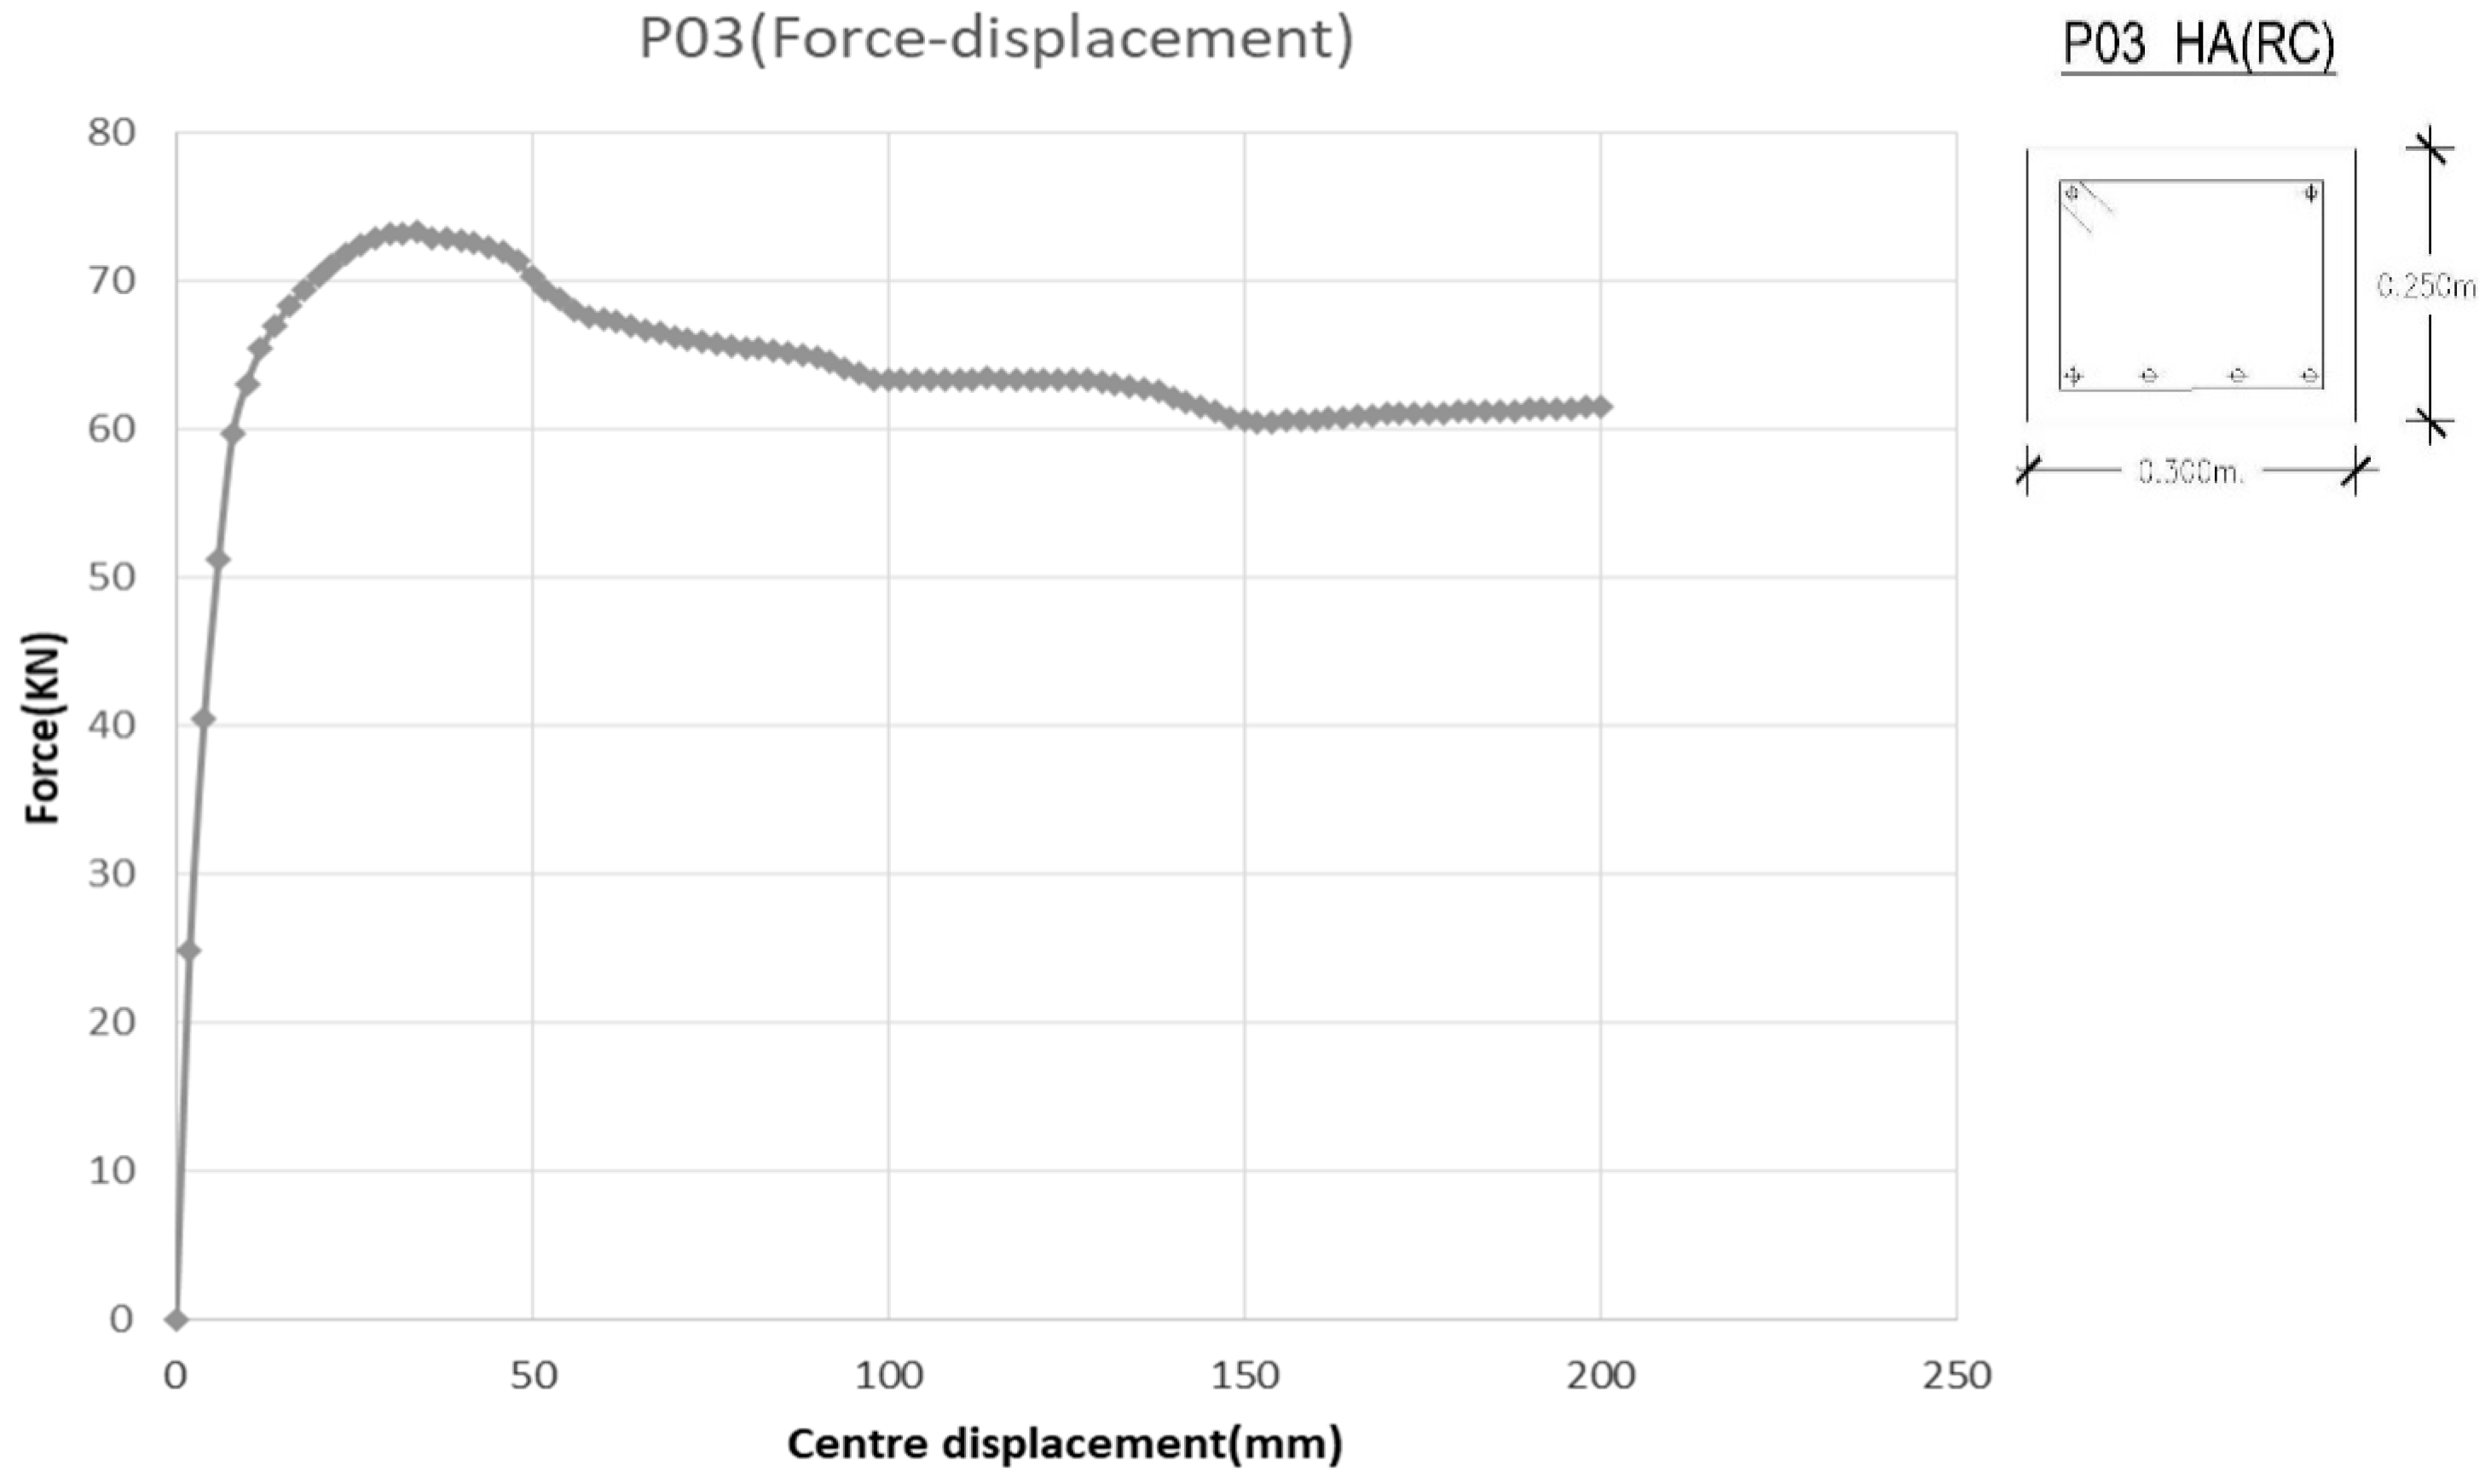
4.1. Reinforced Concrete Beam P03
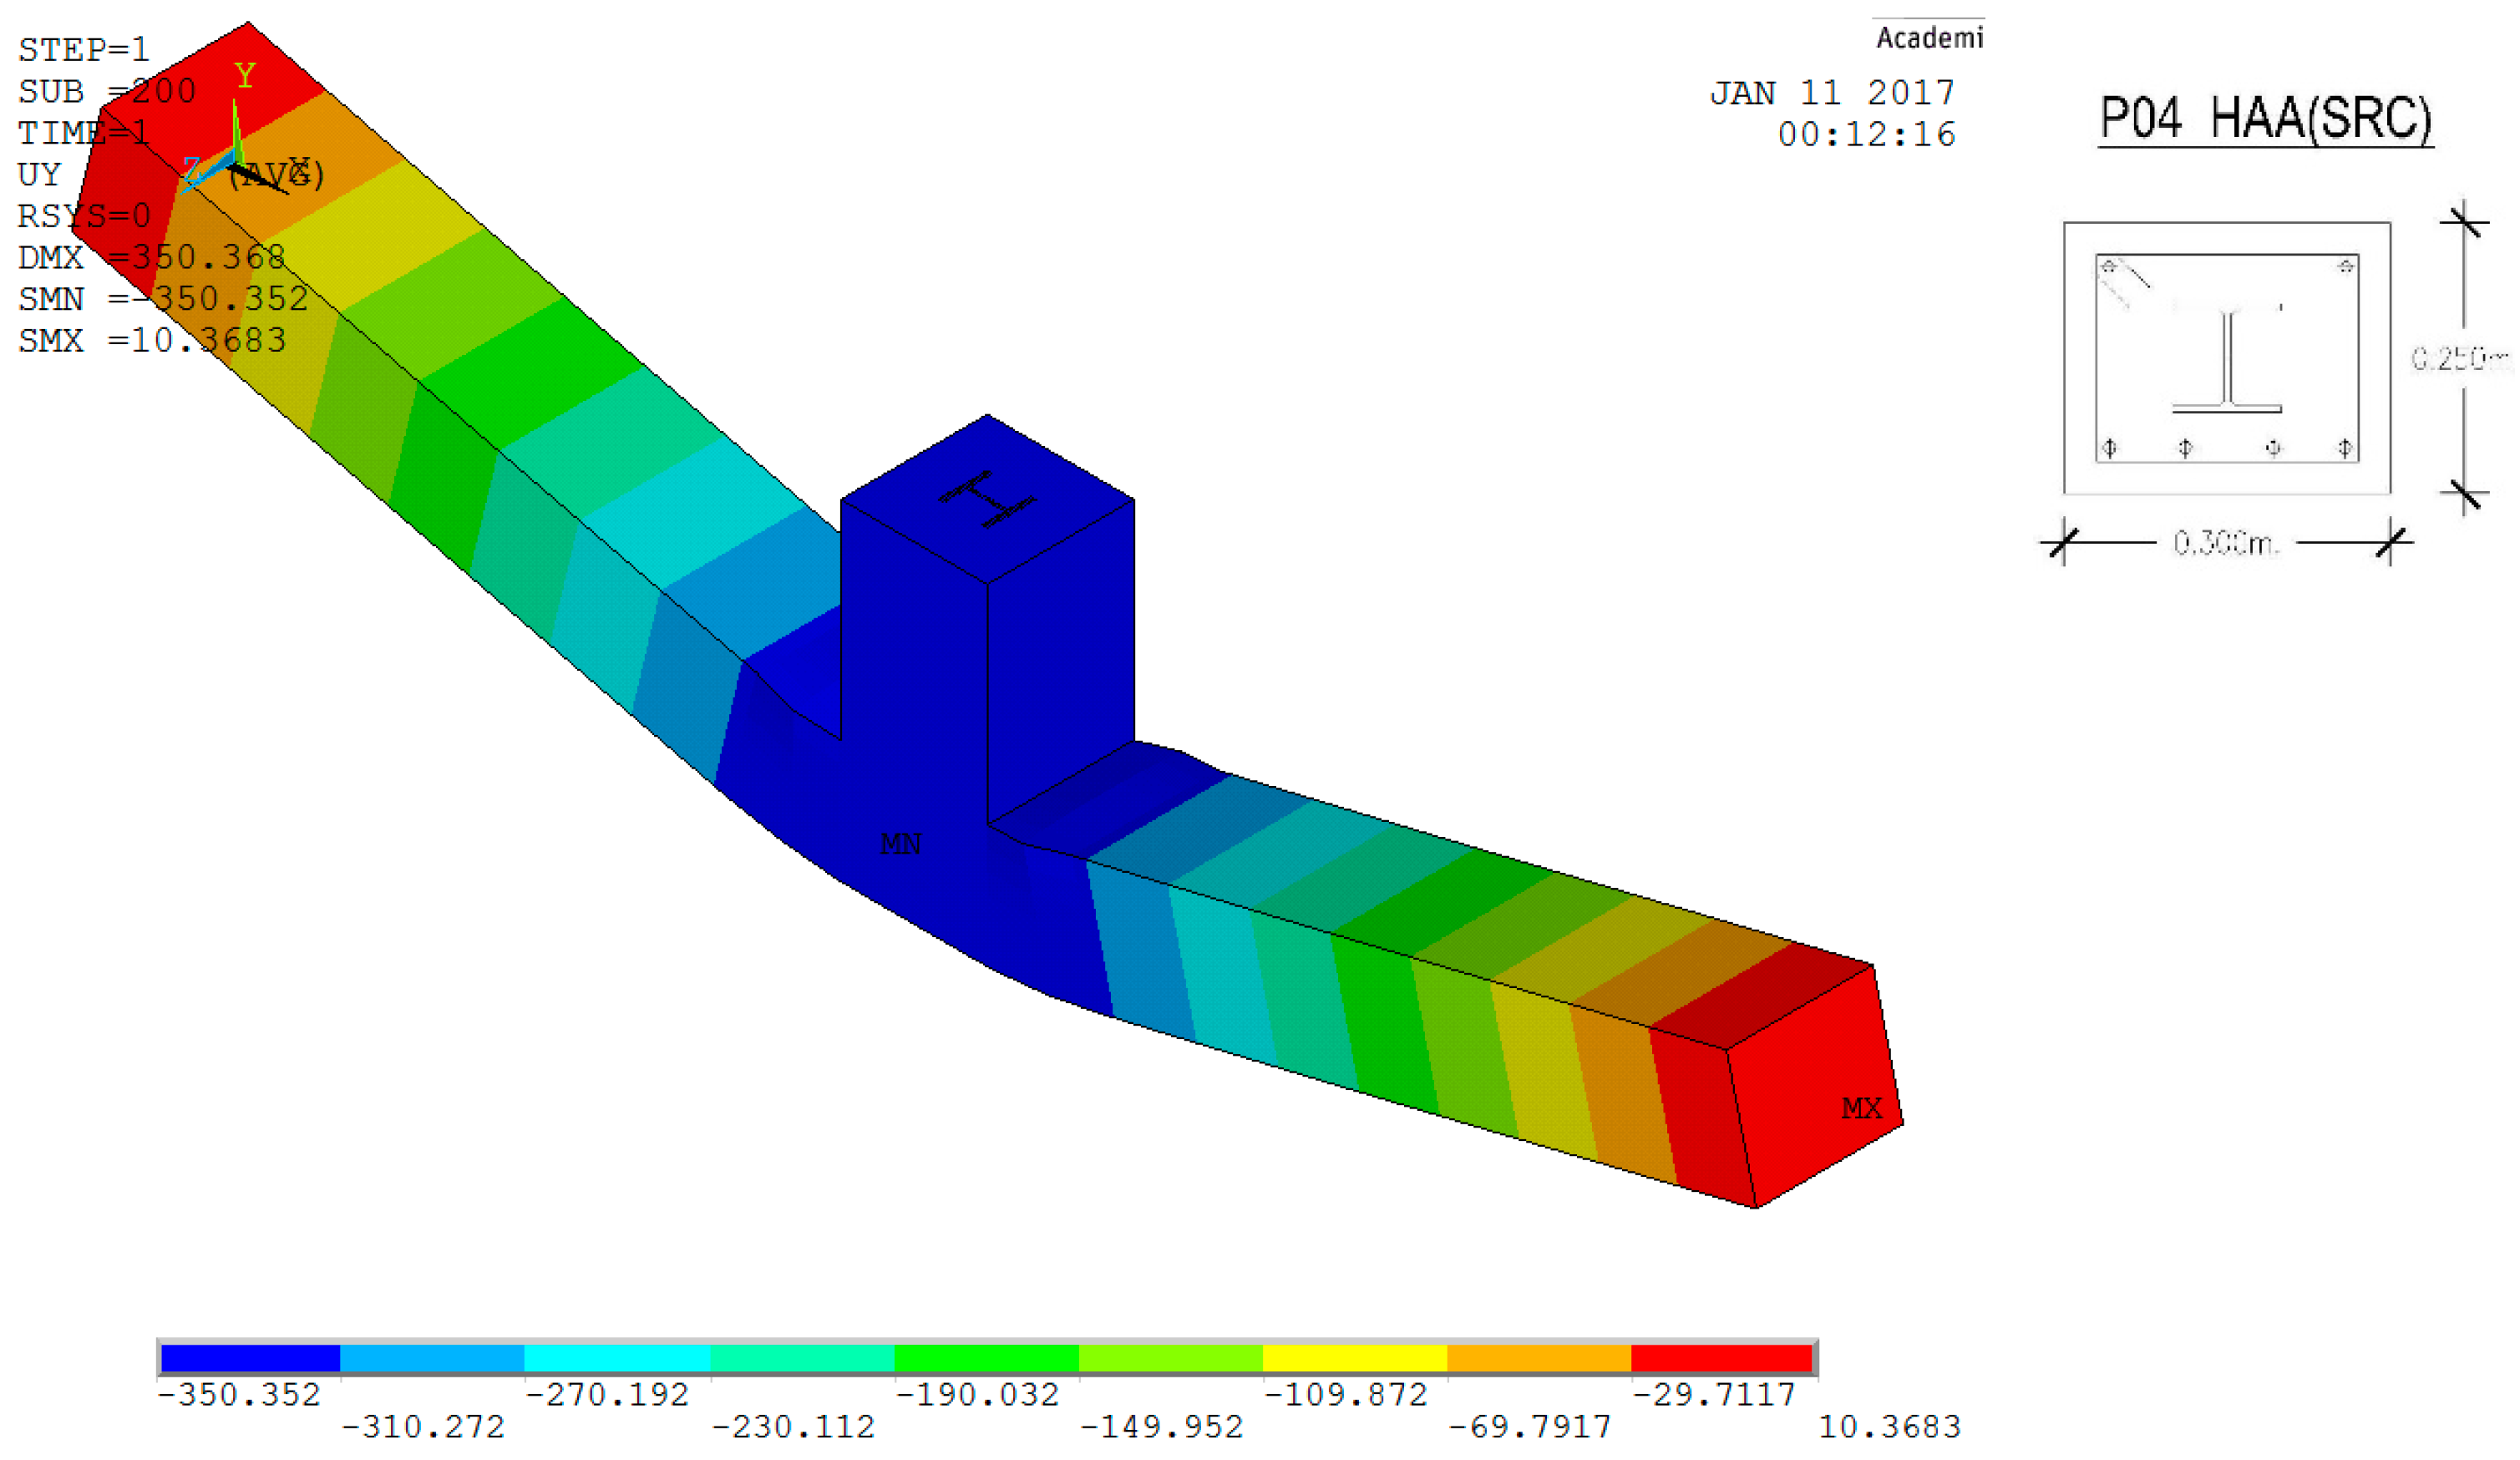
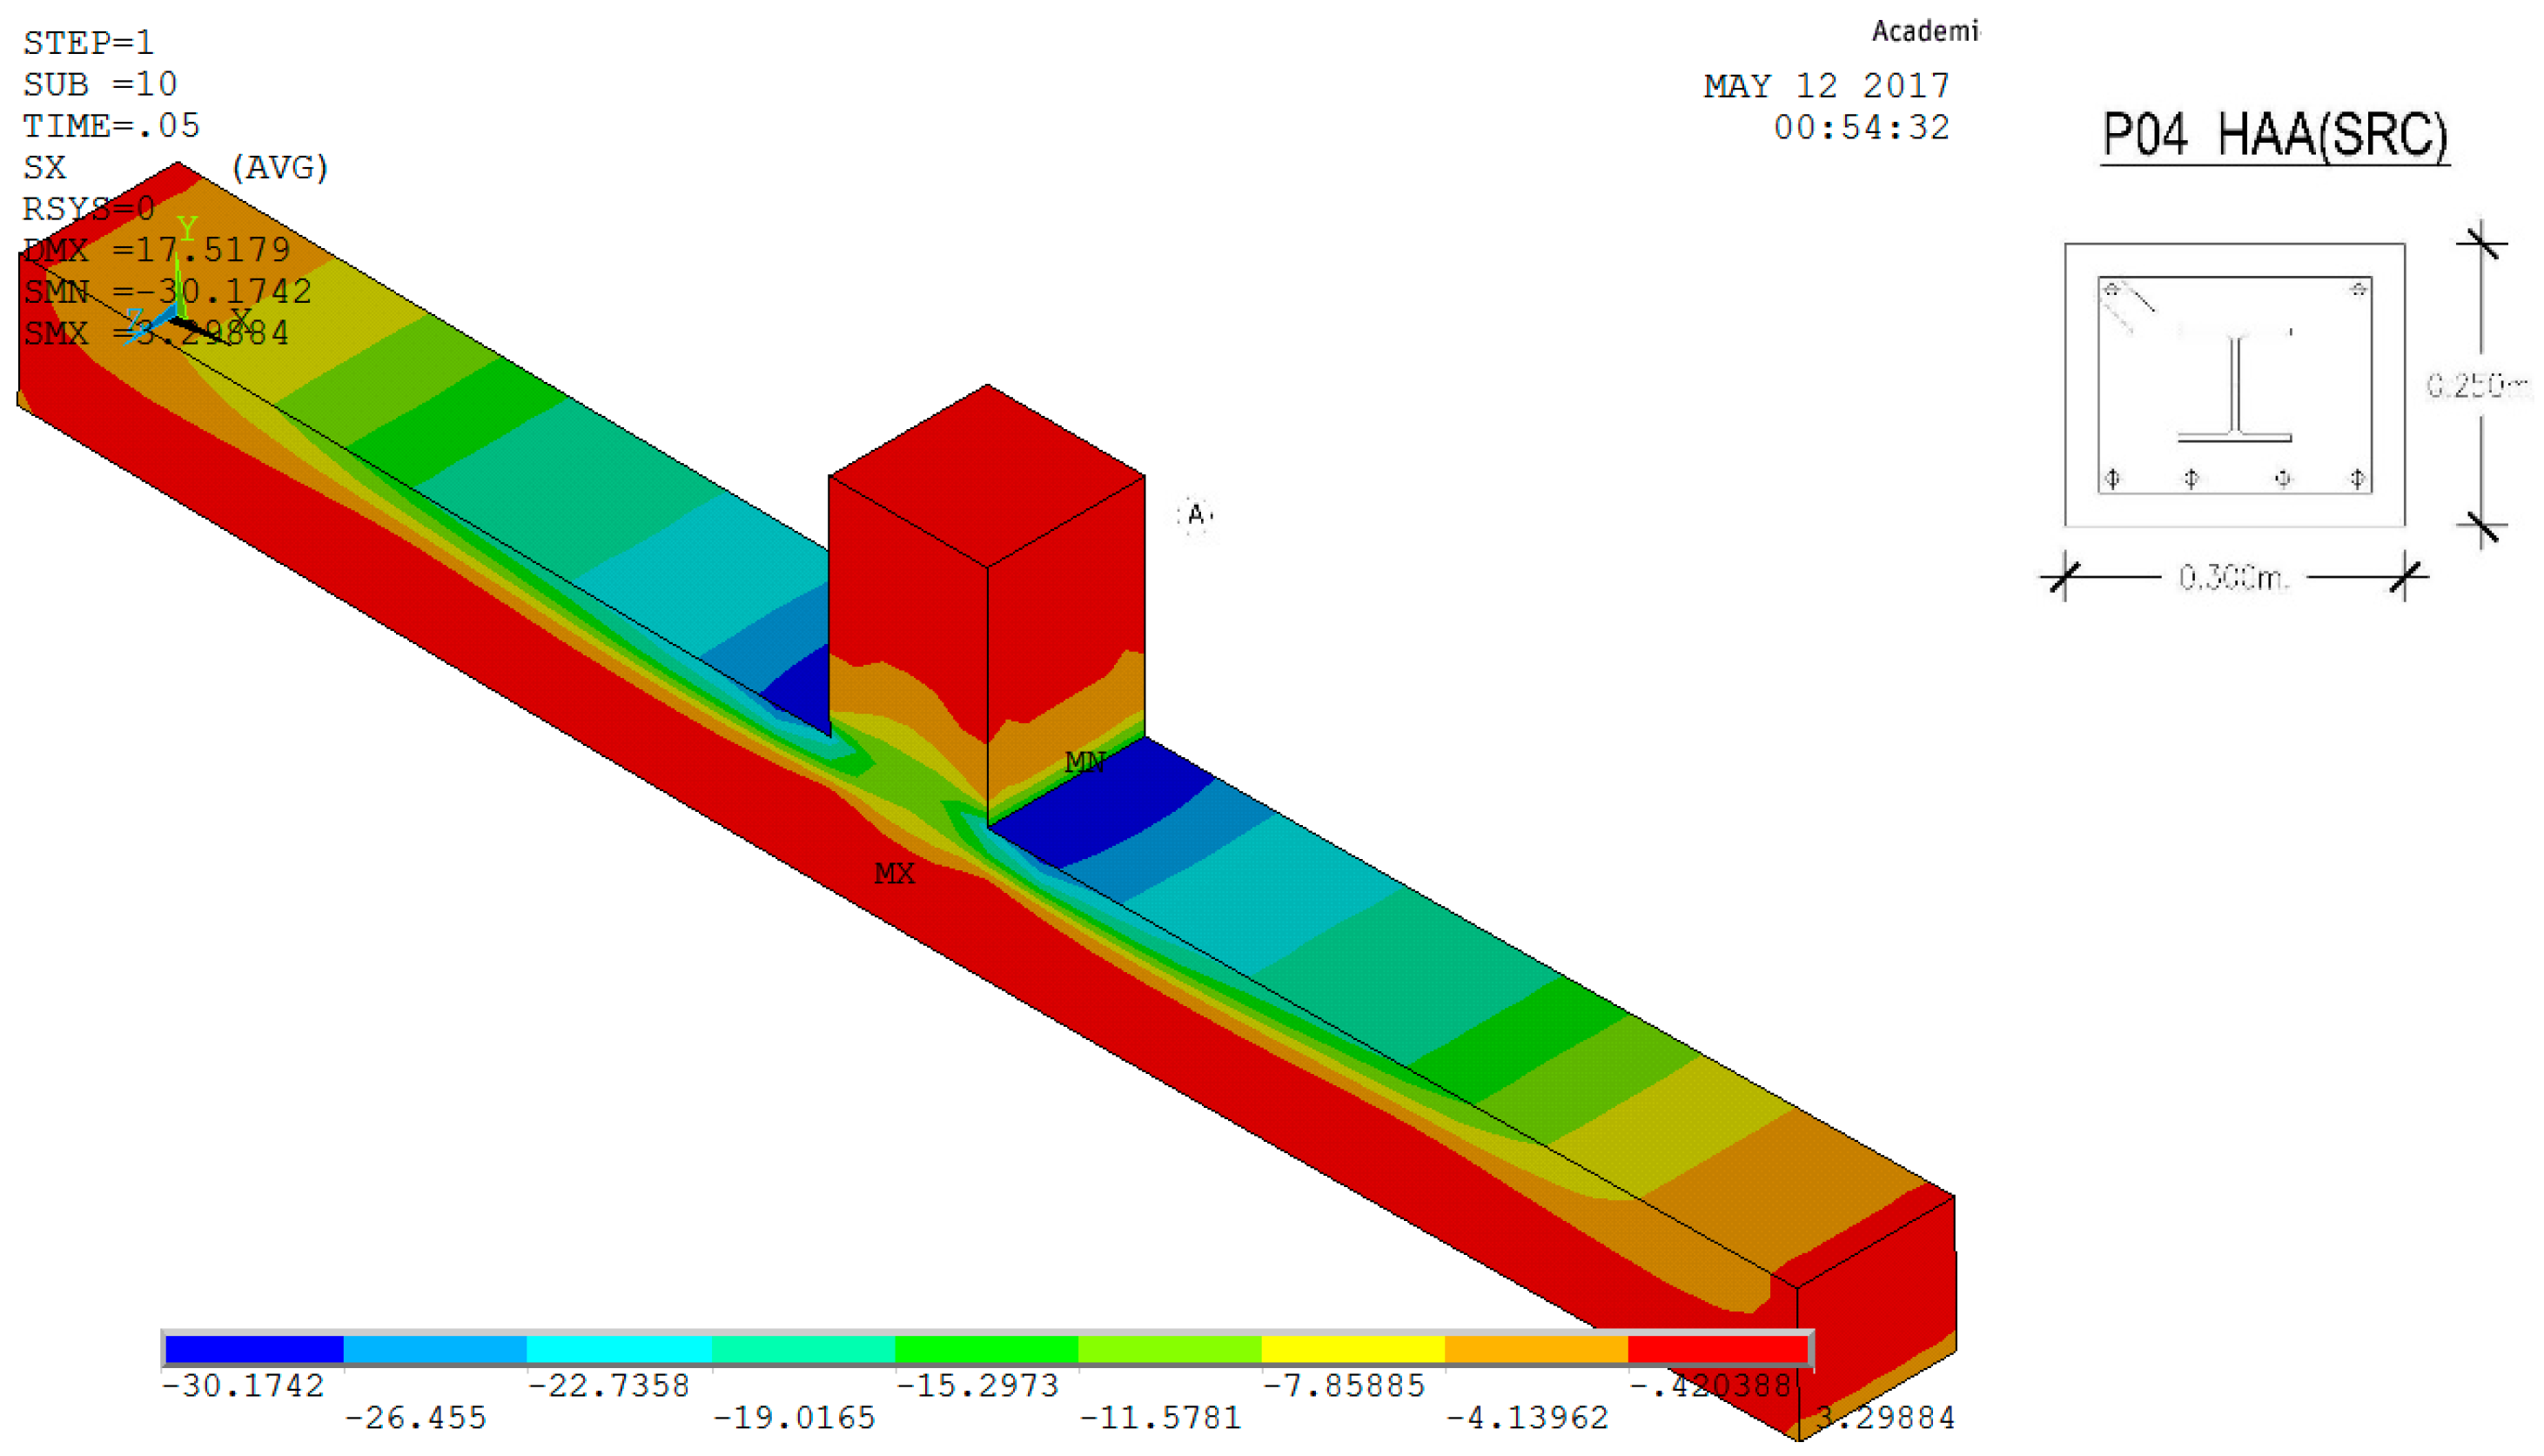
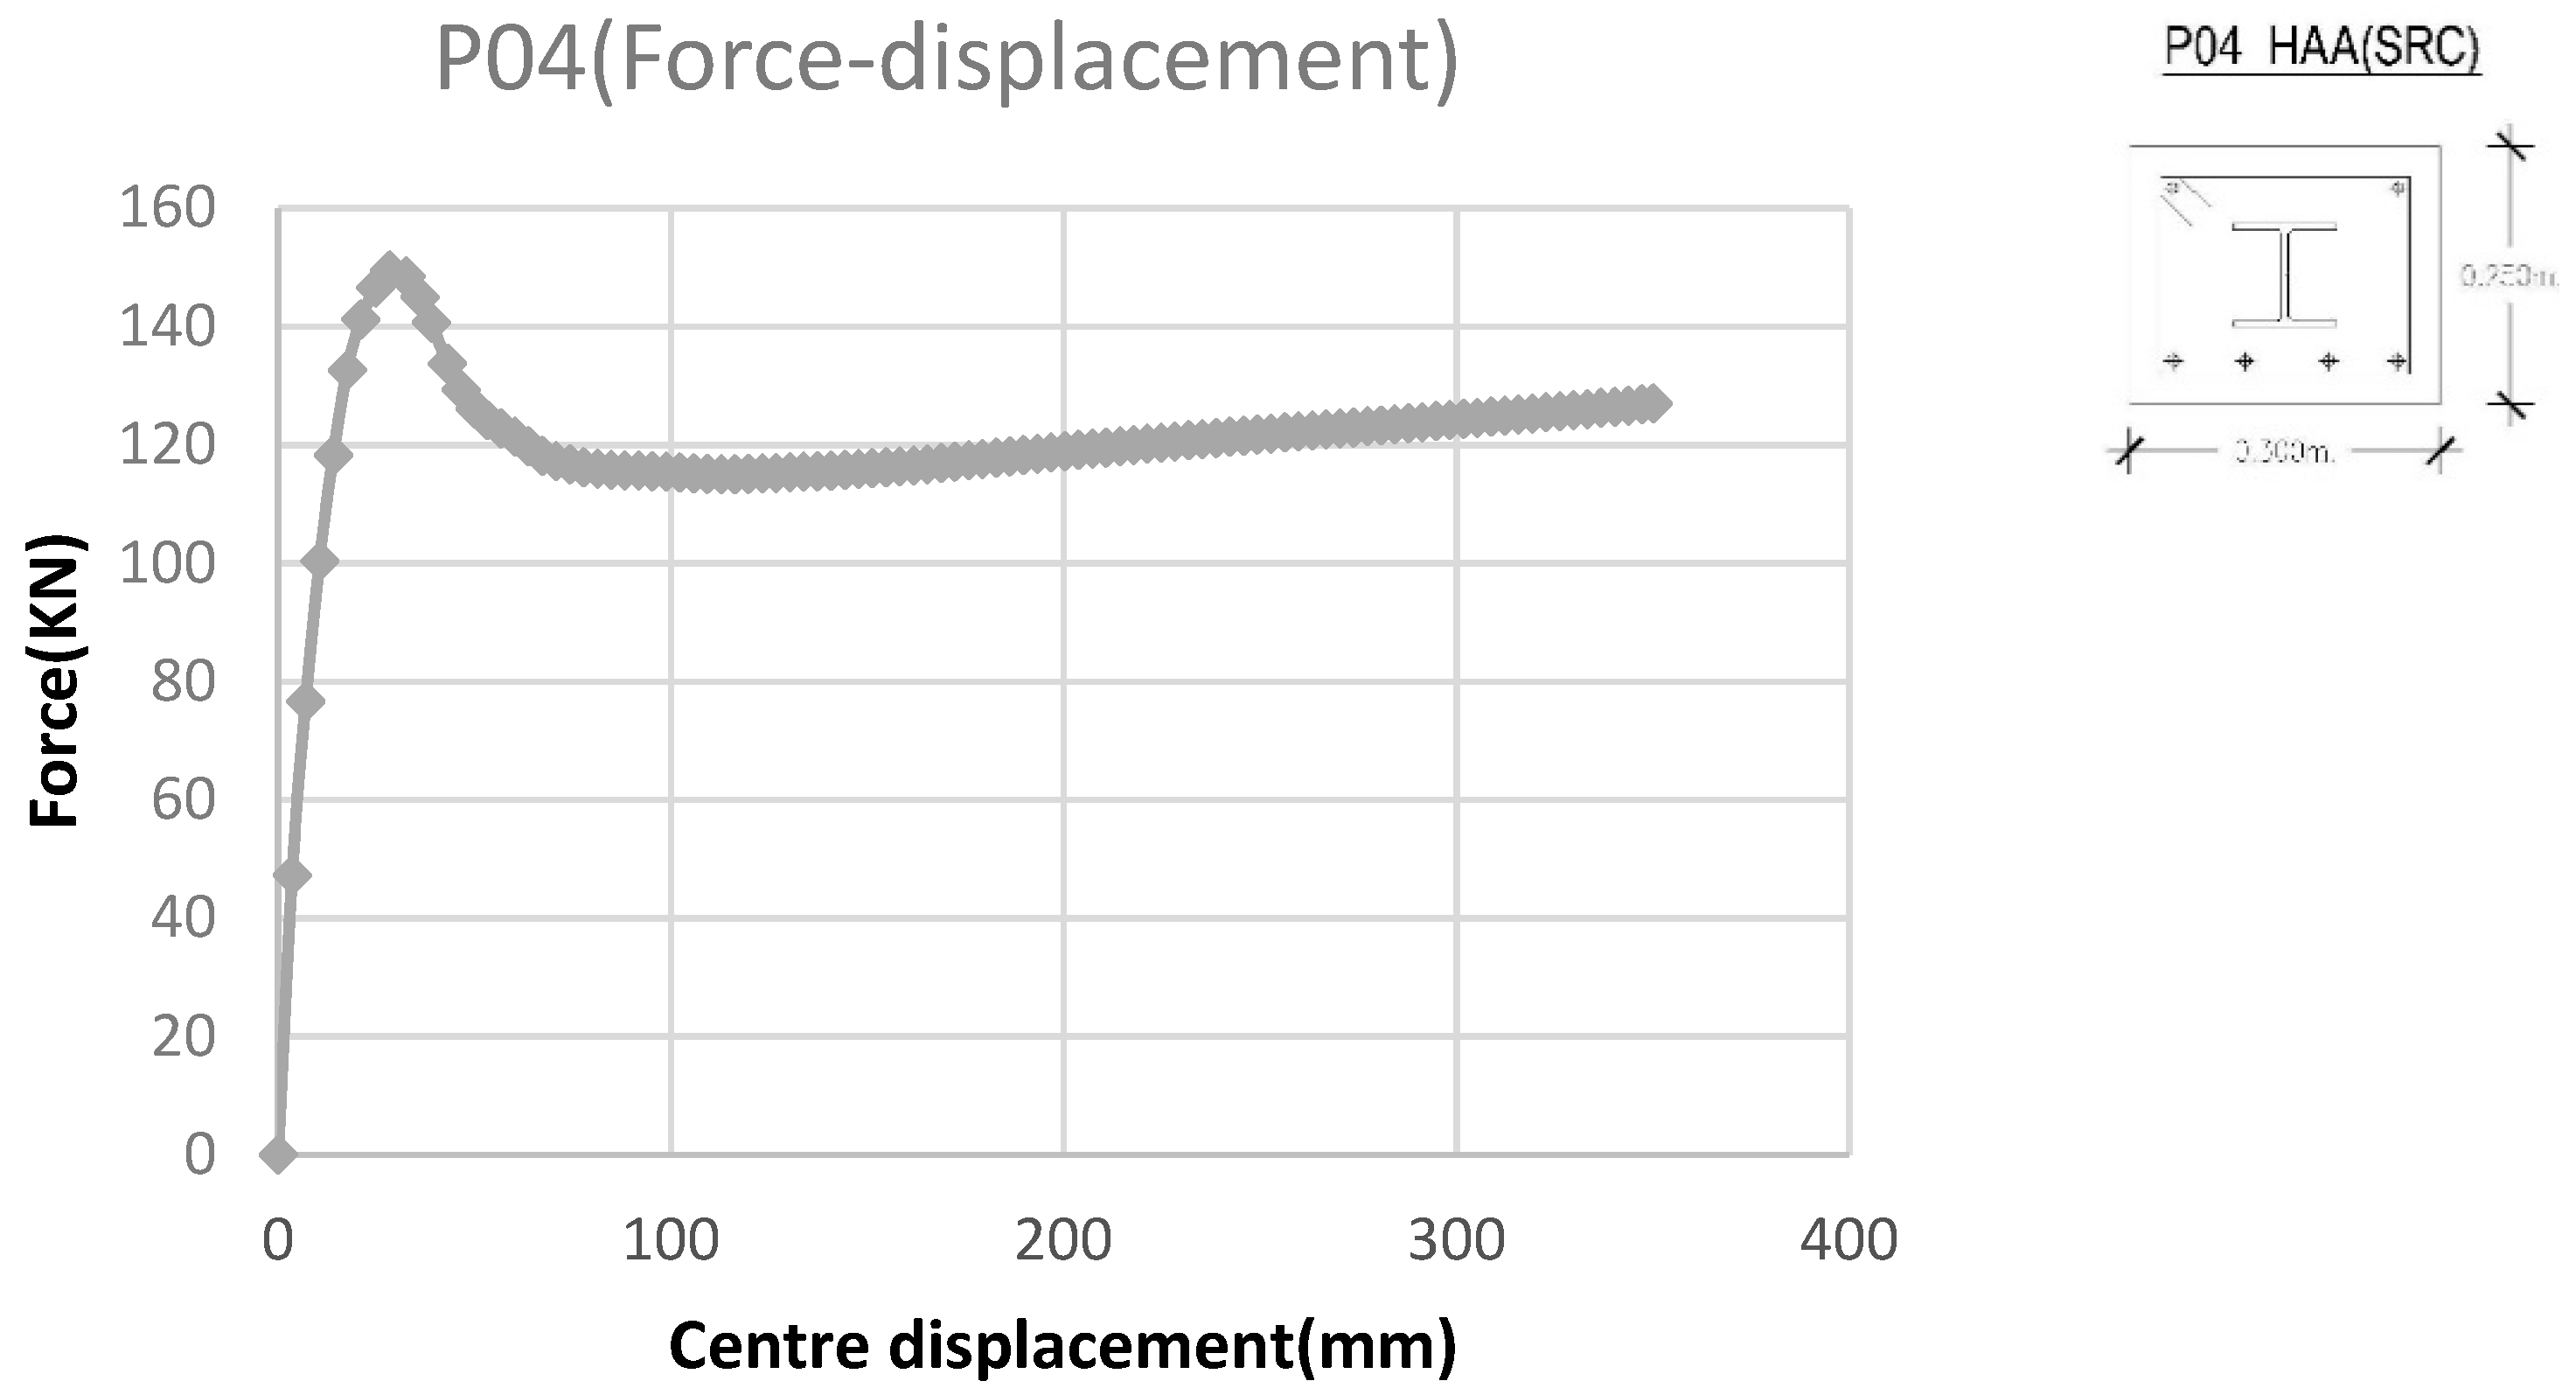
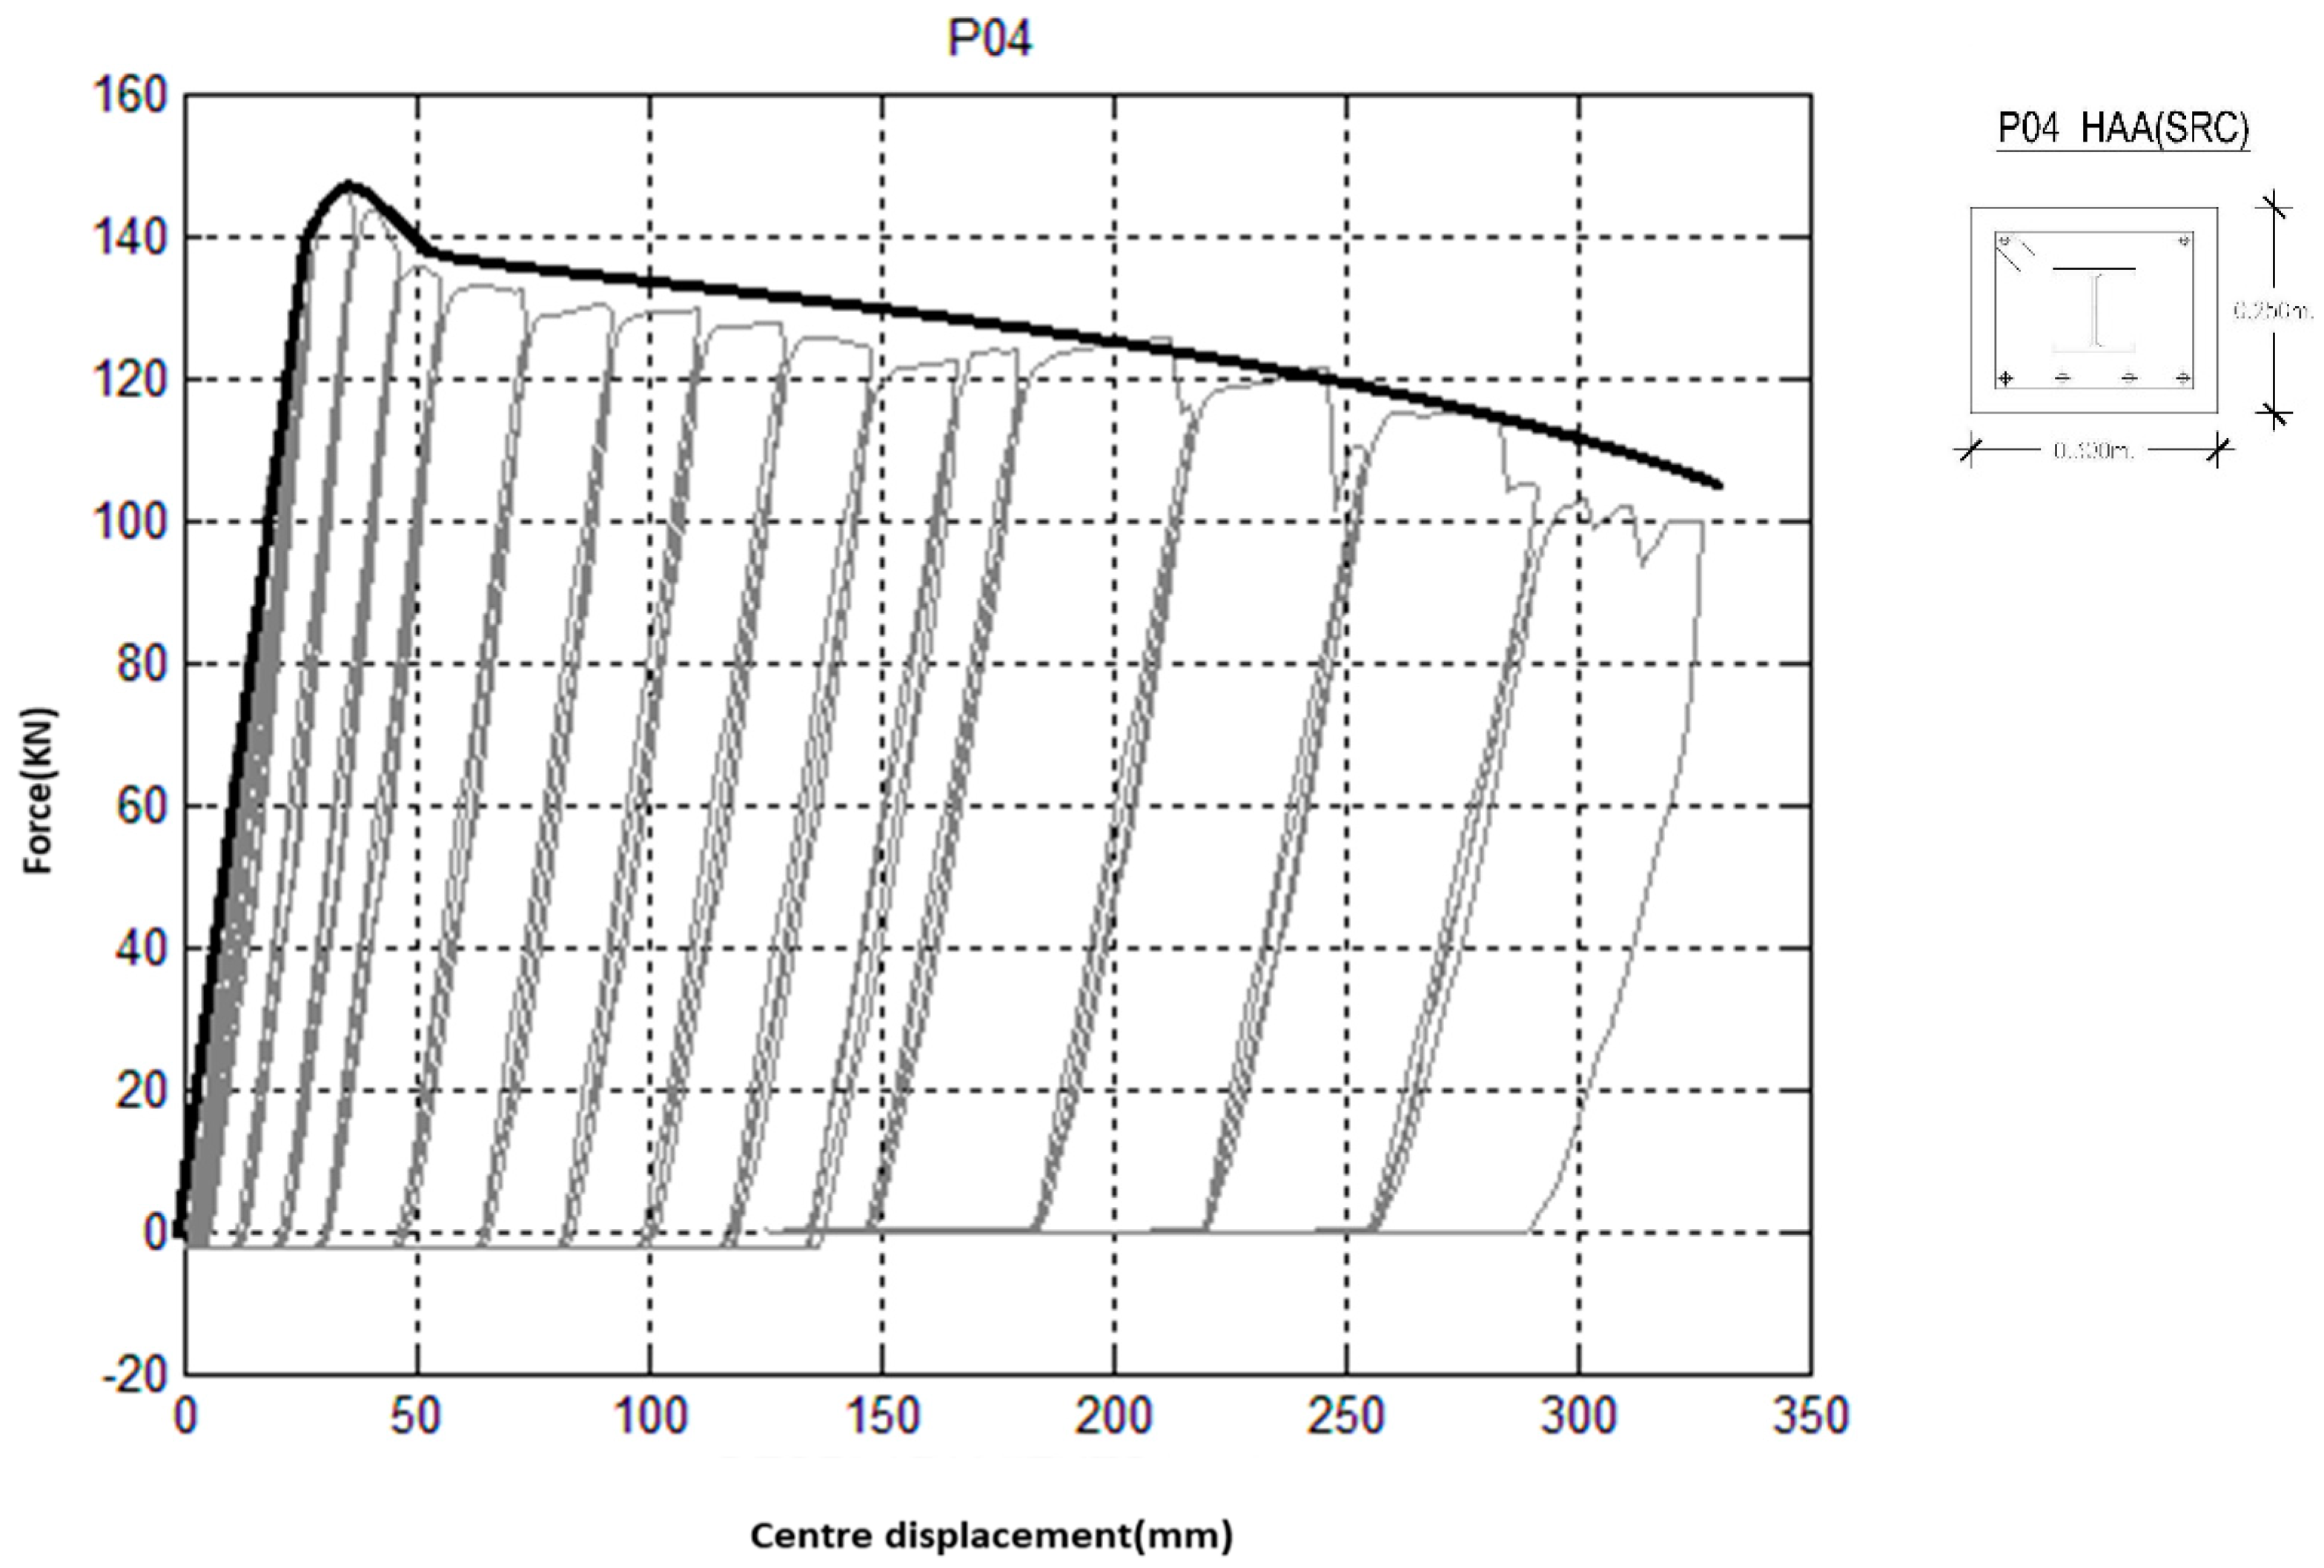
4.2. Steel-Reinforced Concrete Beam P04
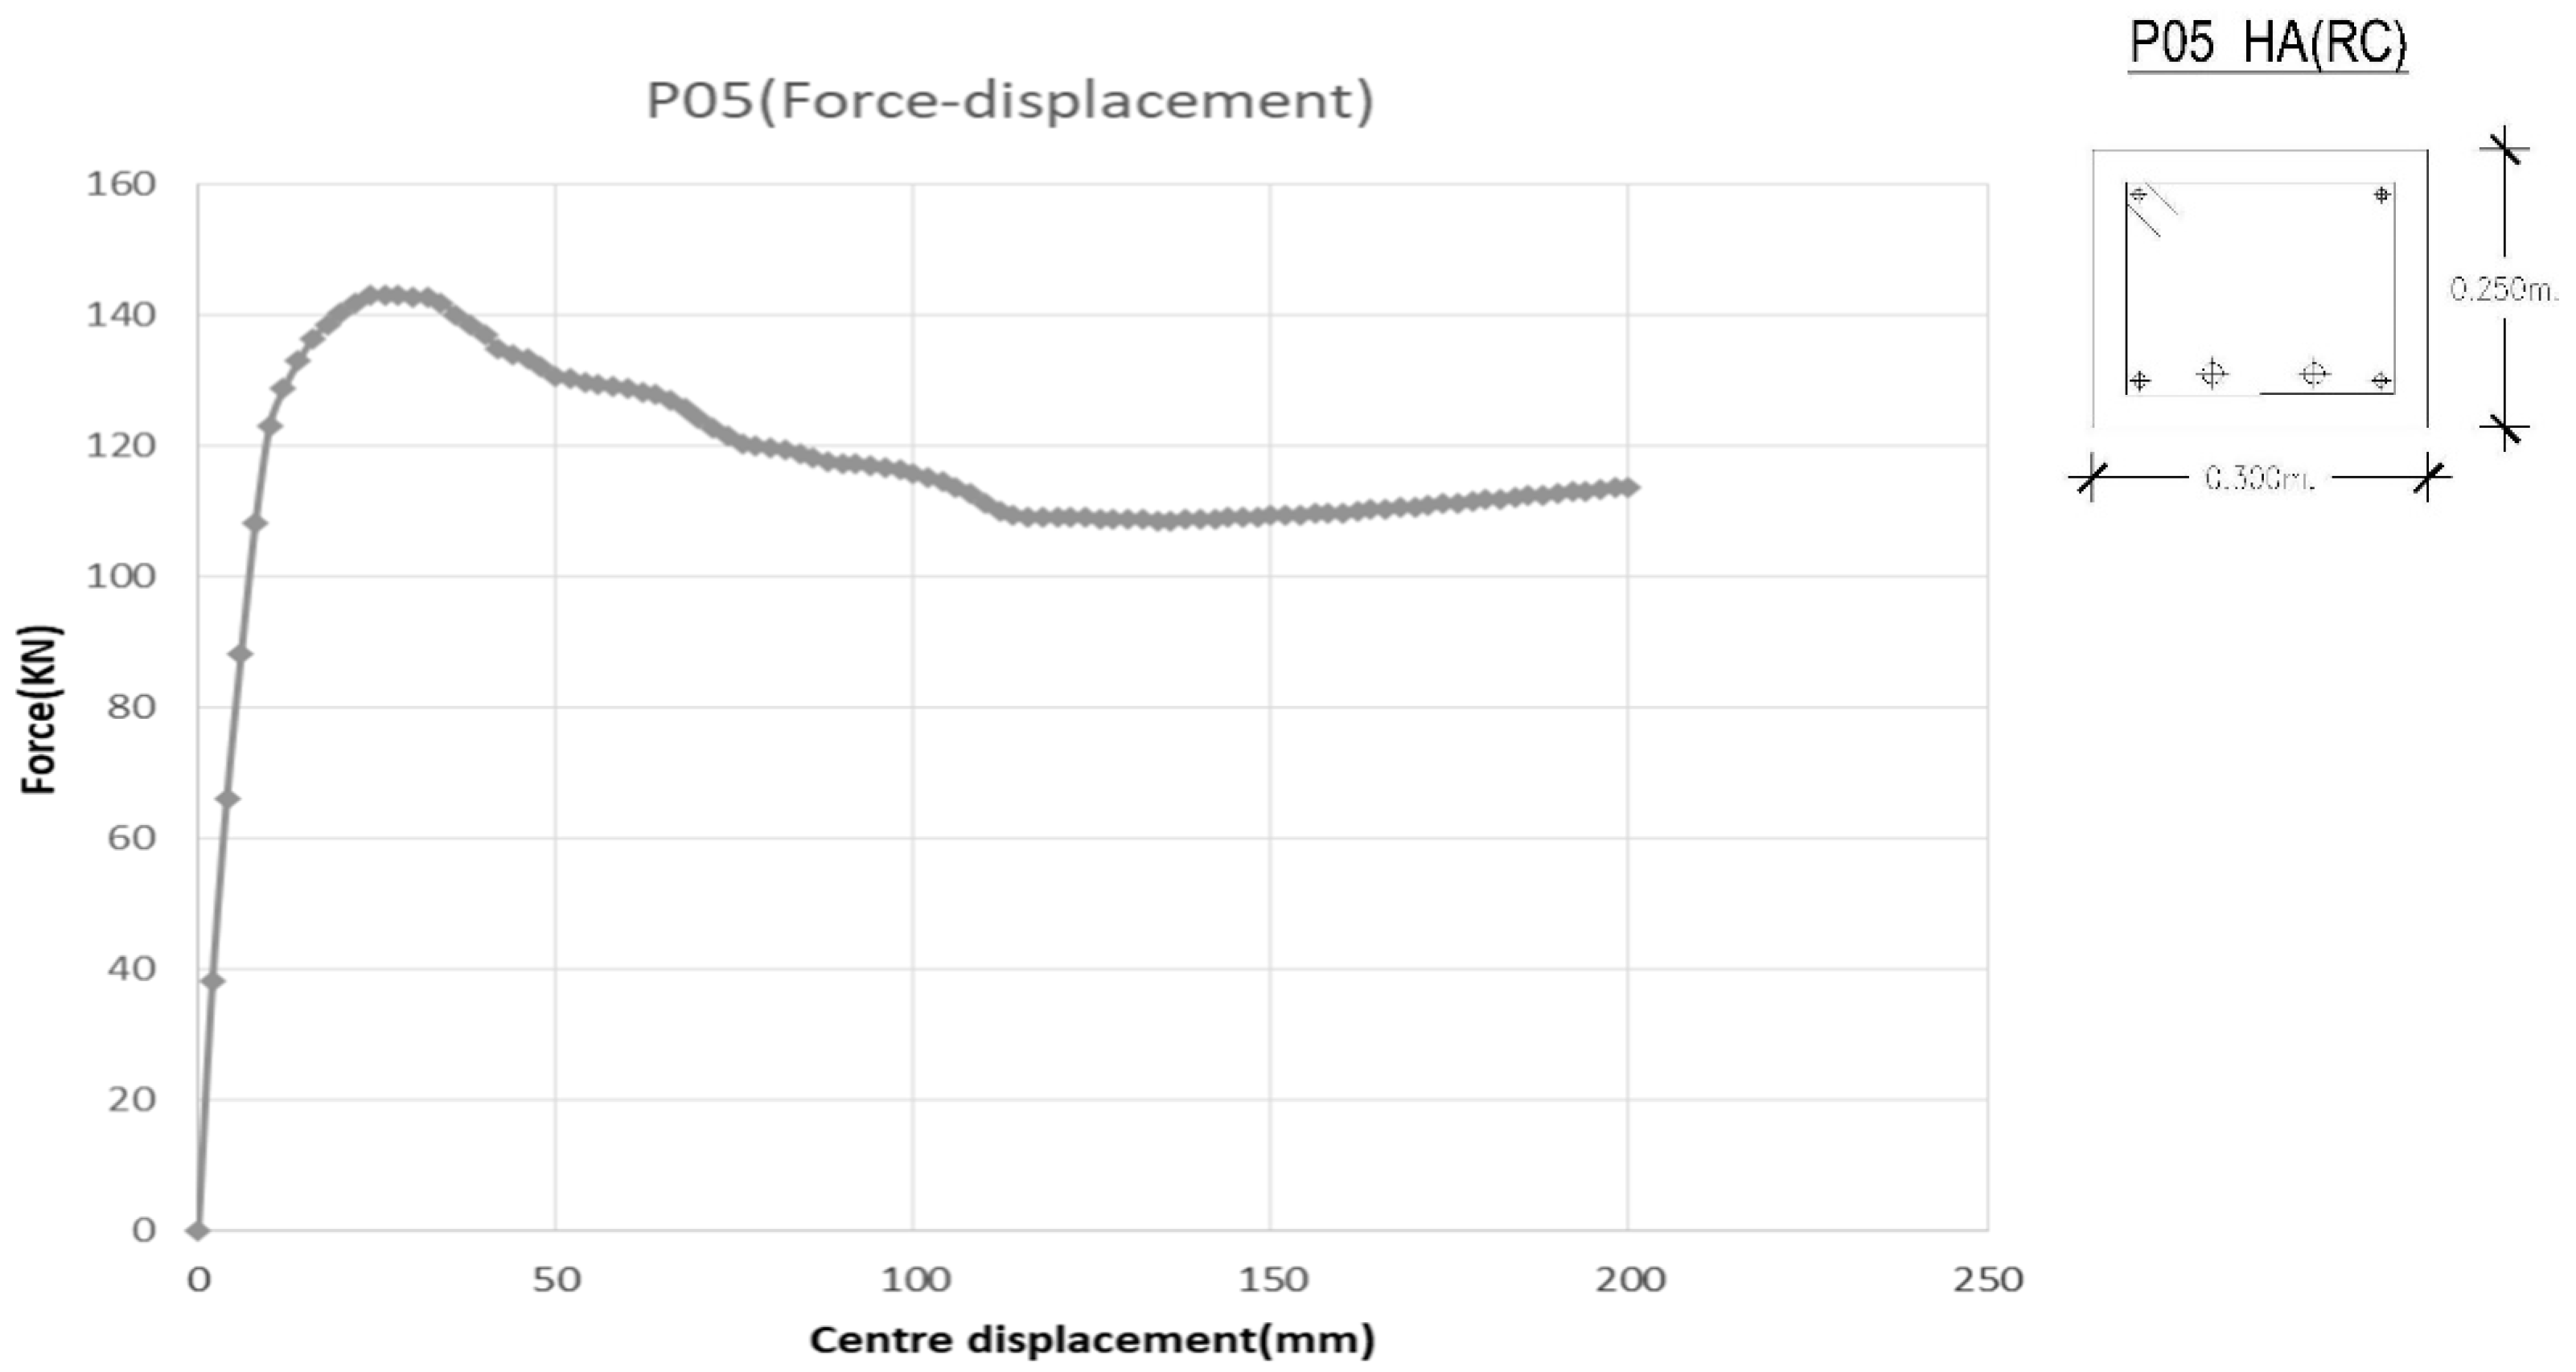
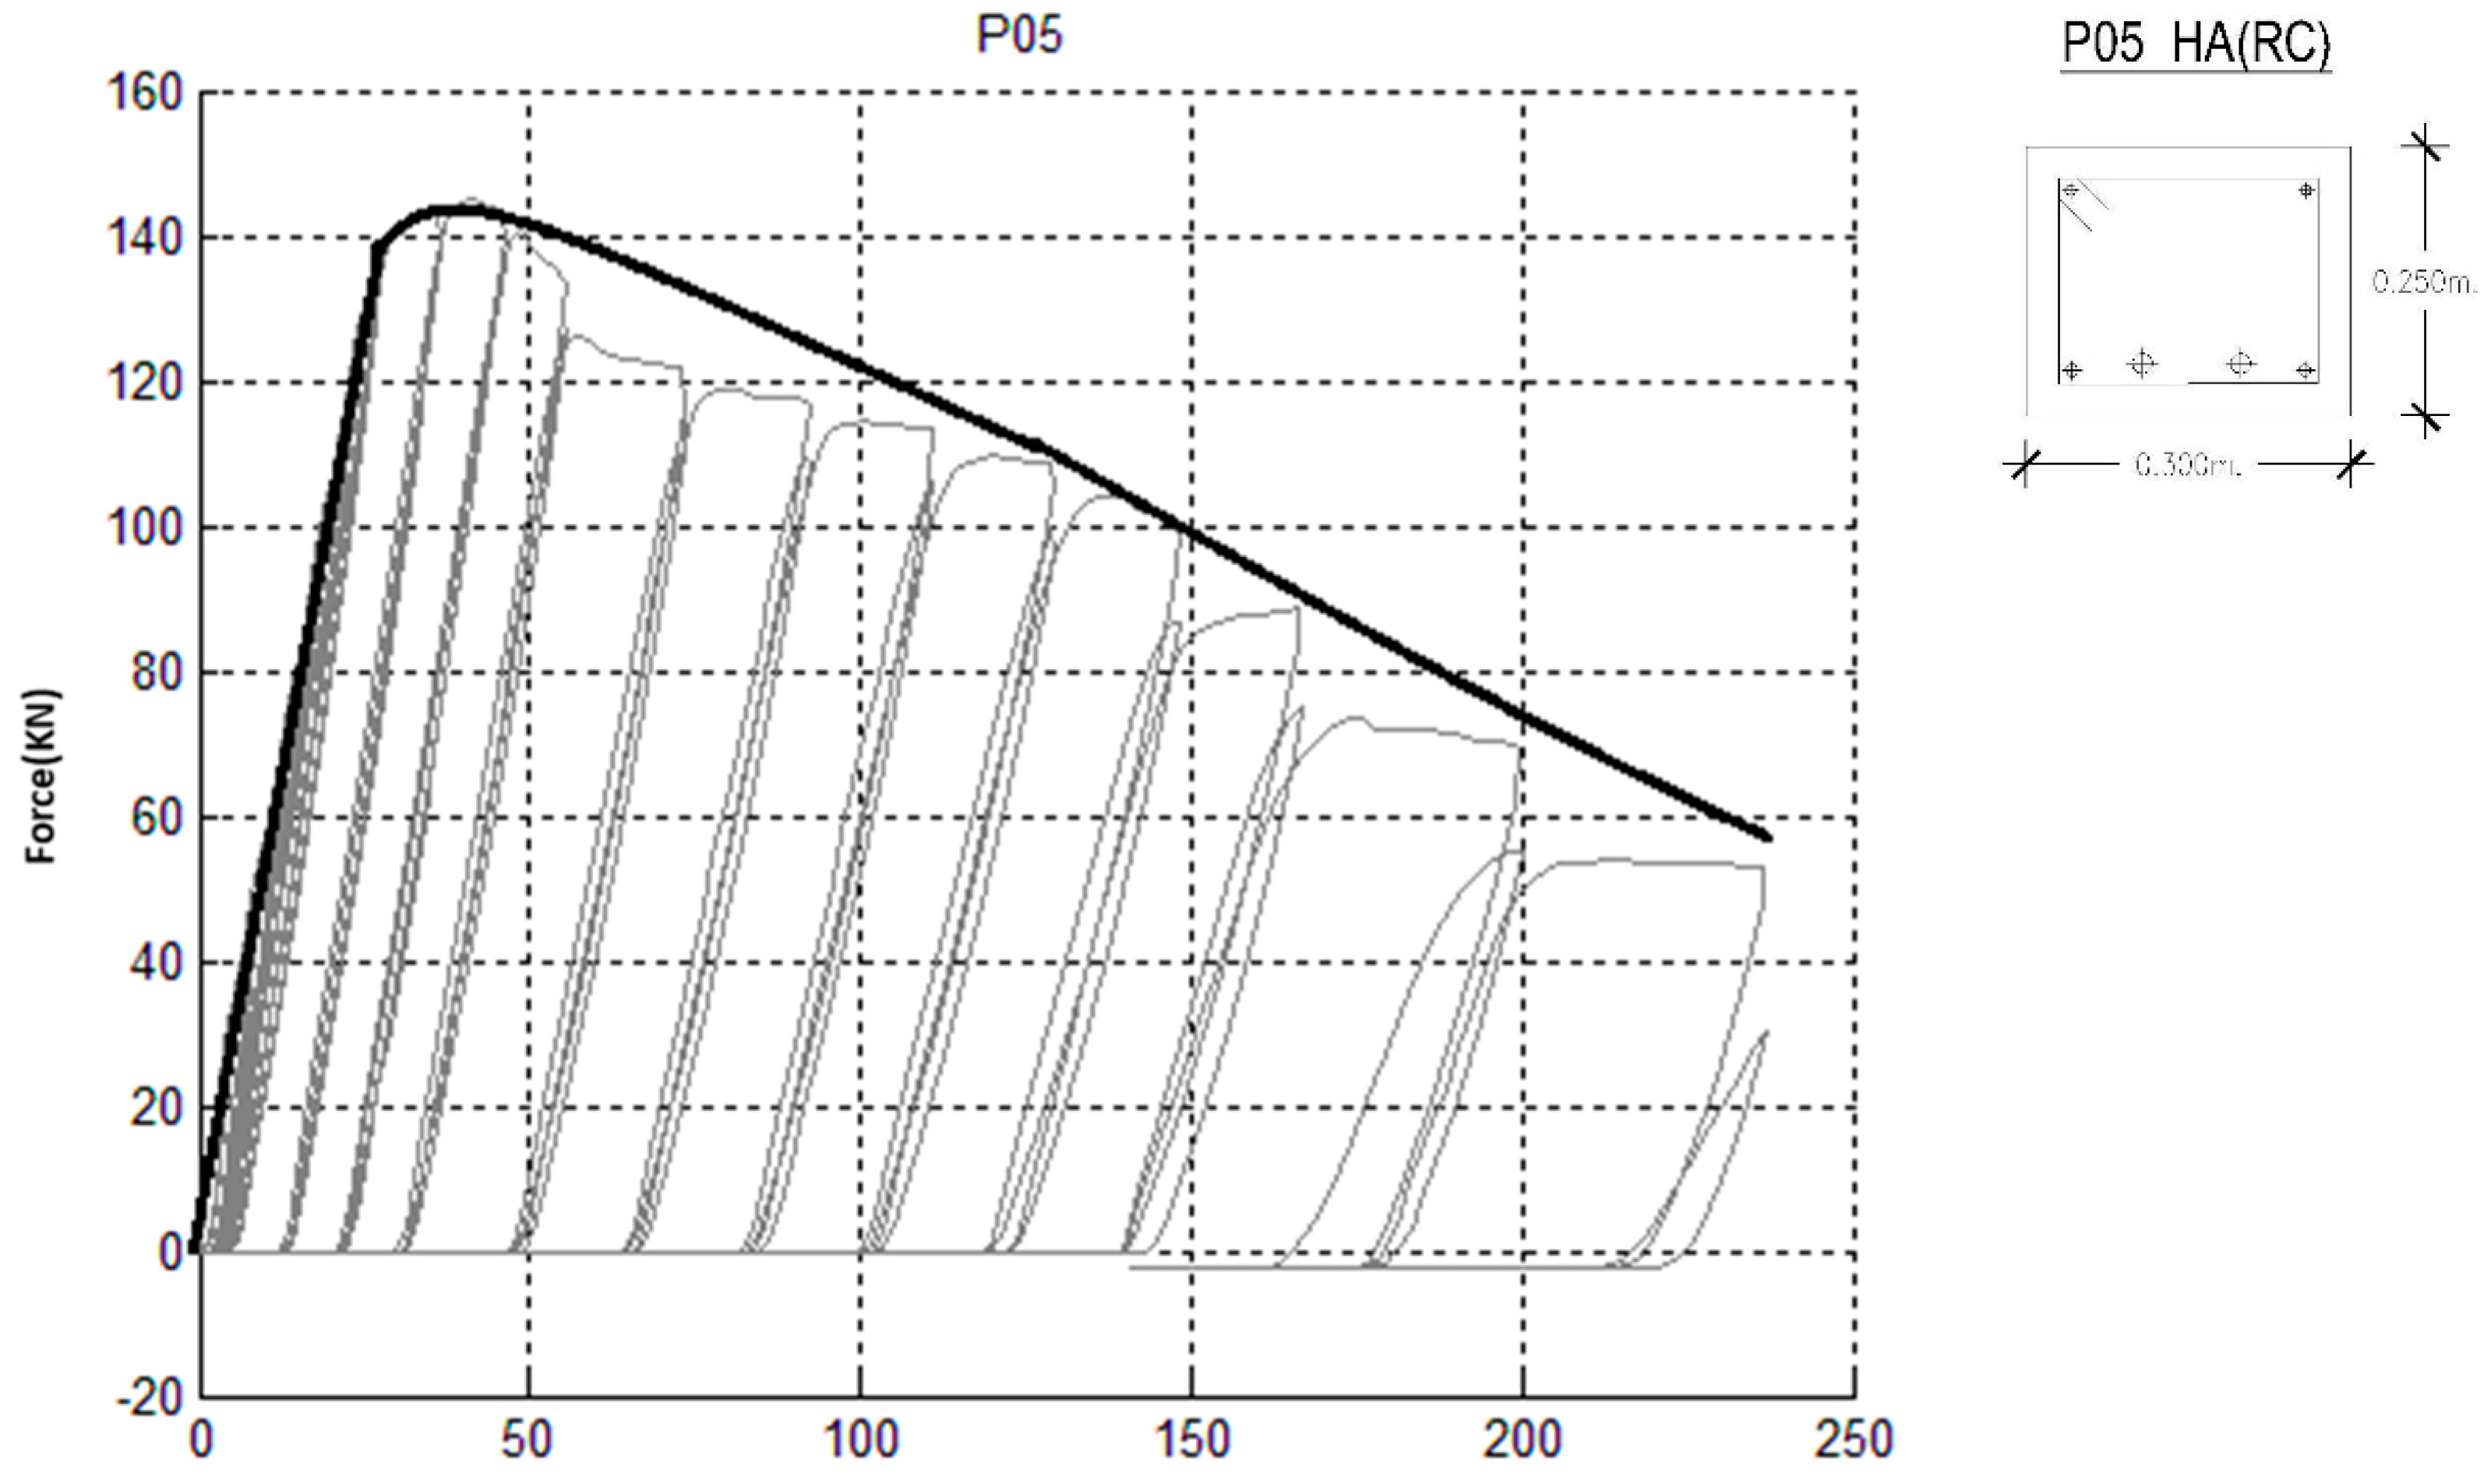
4.3. Reinforced Concrete Beam P05
4.4. M-χ Nonlinear Graph
5. Conclusions
- -
- The analysis was conducted by three-dimensional finite element models of specimens P03, P04, and P05, which were analyzed experimentally in previous research.
- -
- The force-displacement graph results obtained in the three models were similar to the experimental tests.
- -
- The increase of force in the plastic region when it reached the large displacement was due to descending branches in the steel not being included, which generated hardening for large strains and did not include loss of strength due to failure. This will be studied in future research.
- -
- The model with the steel section reinforcement worked with less stress, but with more length affected. In the model with no reinforcement section, the damage was concentrated more on the part of the joint, while a force distribution effect along the beam was obtained for steel, with more rigidity and strength for the model with the metal cross-section than the model without it.
- -
- The analysis of the stress–strain graphs of the materials for large deflections to conduct nonlinear simulations of large displacements was essential to predict the descending branches in the plastic region.
- -
- A very interesting capability of this model was that it generated decreasing moment–curvature graphs due to partial or total fatigue or failure of materials. This is a novel procedure, which is easy to apply.
- -
- The graphic moment–curvature of specimens P03, P04, and P05 in the section to 1400 mm supports entering the data in the following model of bars. The graph of P04 allows a greater range of ductility than the other two, where the break prevented reaching greater strains.
- -
- Simulation with the numerical models is able to analyze complex situations. In particular, the model of simplified bars with the relationship of moment–curvature allows nonlinear calculation until reaching large displacements, taking into account the reduction of rigidity because of the cracking of the concrete.
- -
- A new procedure was developed to obtain the moment–curvature graphs of the sections from the numerical models. The moment-curvature diagram can be used in the simplified bar analysis by contemplating post-critical behavior in future research.
Author Contributions
Funding
Conflicts of Interest
References
- Akiyama, H. Metodología de Proyecto Sismorresistente de Edificios Basada en el Balance Energético; Editorial Reverté. S.A.: Barcelona, Sapin, 2003. [Google Scholar]
- Chen, C.C.; Lin, K.T. Behavior and strength of steel reinforced concrete beam-column joints with two-side force inputs. J. Constr. Steel Res. 2009, 65, 641–649. [Google Scholar] [CrossRef]
- Chen, C.-C.; Suswanto, B.; Lin, Y.-J. Behavior and strength of steel reinforced concrete beam-column joints with single-side force inputs. J. Constr. Steel Res. 2009, 65, 1569–1581. [Google Scholar] [CrossRef]
- Oliver, J.; Cervera, M.; Oller, S.; Lubliner, J. Isotropic damage models and smeared crack analysis of concrete. In Proceedings of the II International Conference on Computer Aided Analysis and Design of Concrete Structures, SCI-C’90, At Zell am See, Austria, 4–6 April 1990. [Google Scholar]
- Chaudhari, S.V.; Chakrabarti, M.A. Modeling of concrete for nonlinear analysis using finite element code ABAQUS. Int. J. Comput. Appl. 2012, 44, 14–18. [Google Scholar]
- Jirásek, M. Damage and Smeared Crack Models. In Numerical Modeling of Concrete Cracking; Hofstetter, G., Meschke, G., Eds.; CISM International Centre for Mechanical Sciences, Springer: Vienna, Austria, 2011; Volume 532. [Google Scholar]
- Chen, W.F.; Han, D.J. Plasticity for Structural Engineers; Springer: New York, NY, USA, 1988. [Google Scholar]
- Hjelm, H.E. Yield Surface for Gray Cast iron under Biaxial Stress. J. Eng. Mater. Technol. 1994, 116, 148–154. [Google Scholar] [CrossRef]
- Sinaei, H.; Shariati, M.; Abna, A.H.; Aghaei, M.; Shariati, A. Evaluation of reinforced concrete beam behaviour using finite element analysis by ABAQUS. Sci. Res. Essays 2012, 7, 2002–2009. [Google Scholar]
- López, N. Análisis de la Aplicación del Método de los Elementos Finitos al Modelado de Elementos de Hormigón Armado. Ph.D. Thesis, Universidad da Coruña, A Coruña, Spain, 2008. [Google Scholar]
- Fanning, P. Nonlinear models of reinforced and post-tensioned concrete beams. Electron. J. Struct. Eng. 2001, 1, 111–119. [Google Scholar]
- Wakabayashi, M. Diseño de Edificios Resistentes a los Terremotos; McGraw-Colina: New York, NY, USA, 1986. [Google Scholar]
- Uy, B.; Patel, V.; Li, D.; Aslani, F. Behaviour and design of connections for demountable steel and composite structures. Structures 2017, 9, 1–12. [Google Scholar] [CrossRef]
- Soti, R.; Barbosa, A.R.; Stavridis, A. Numerical Modeling of URM Infill Walls Retrofitted with Embedded Reinforcing Steel. In Proceedings of the 10th National Conference in Earthquake Engineering, Anchorage, AK, USA, 21–25 July 2014; Earthquake Engineering Research Institute: Anchorage, AK, USA, 2014. [Google Scholar]
- Suswanto, B. Shear Behavior and Strength of Steel Reinforced Concrete Beam-Column Joints with Single-Side Force Inputs. Ph.D. Thesis, Department of Civil Engineering, Sepuluh Nopember Institute of Technology (ITS), Surabaya, Indonesia, 1998. [Google Scholar]
- Anastasiadis, A.; Mosoarca, M.; Gioncu, V. Prediction of available rotation capacity and ductility of wide-flange beams. J. Constr. Steel Res. 2012, 68, 176–191. [Google Scholar] [CrossRef]
- Forner, E.F. Análisis de Soportes Mixtos Sometidos a Flexocompresión Esviada. Ph.D. Thesis, Universidad Politécnica de Valencia, Valencia, Spain, 2011. [Google Scholar]
- Bossio, A.; Fabbrocino, F.; Lignola, G.P.; Prota, A.; Manfredi, G. Design Oriented Model for the Assessment of T-Shaped Beam-Column Joints in Reinforced Concrete Frames. Buildings 2017, 7, 118. [Google Scholar] [CrossRef]
- Bossio, A.; Fabbrocino, F.; Lignola, G.P.; Prota, A.; Manfredi, G. Simplified Model for Strengthening Design of Beam–Column Internal Joints in Reinforced Concrete Frames. Polymers 2015, 7, 1732–1754. [Google Scholar] [CrossRef]
- Santarsiero, G. FE Modelling of the Seismic Behavior of Wide Beam-Column Joints Strengthened with CFRP Systems. Buildings 2018, 8, 31. [Google Scholar] [CrossRef]
- Kabir, M.R.; Alam, M.S.; Said, A.M.; Ayad, A. Performance of Hybrid Reinforced Concrete Beam Column Joint: A Critical Review. Fibers 2016, 4, 13. [Google Scholar] [CrossRef]
- Tran, M.-T.; Bui, Q.-B.; Sentosa, B.; Nguyen, N.-T.; Duong, T.-H.; Plé, O. Sustainable RC Beam-Column Connections with Headed Bars: A Formula for Shear Strength Evaluation. Sustainability 2018, 10, 401. [Google Scholar] [CrossRef]
- Gribniak, V.; Tamulenas, V.; Ng, P.-L.; Arnautov, A.K.; Gudonis, E.; Misiunaite, I. Mechanical Behavior of Steel Fiber-Reinforced Concrete Beams Bonded with External Carbon Fiber Sheets. Materials 2017, 10, 666. [Google Scholar] [CrossRef] [PubMed]
- Du, Y.; Zhang, X.; Liu, L.; Zhou, F.; Zhu, D.; Pan, W. Flexural Behaviour of Carbon Textile-Reinforced Concrete with Prestress and Steel Fibres. Polymers 2018, 10, 98. [Google Scholar] [CrossRef]
- Adelzadeh, M.; Hajiloo, H.; Green, M.F. Numerical Study of FRP Reinforced Concrete Slabs at Elevated Temperature. Polymers 2014, 6, 408–422. [Google Scholar] [CrossRef]
- Li, J.; Wang, Y.; Lu, Z.; Li, J. Experimental Study and Numerical Simulation of a Laminated Reinforced Concrete Shear Wall with a Vertical Seam. Appl. Sci. 2017, 7, 629. [Google Scholar]
- Model for Moment-Curvature Relationship of Reinforced Concrete Sections. Math. Comput. Appl. 2010, 15, 66–78.
- Montava, I. Estudio del Comportamiento de Estructuras de Hormigón Armado con Perfiles Metálicos Completamente Embebidos. PhD Thesis, Universidad de Alicante, Alicante, Spain, 2017. [Google Scholar]
- EHE-08-Instrucción de Hormigón Estructural; Ministerio de Fomento: Madrid, Spain, 2008.
- EN 1993 1-1 (English): Eurocode 3: Design of Steel Structures; The European Union: Brussels, Belgium, 1993.
- EAE—Instrucción de Acero Estructural; Ministerio de Fomento: Madrid, Spain, 2010.


| Prototype | Typology | Beam Section (mm2) | Bottom Frame | Profile | Distance between Supports |
|---|---|---|---|---|---|
| P03 | HA (RC) | 300 × 250 | 4 ø 12 | – | 3.30 m |
| P04 | HAA (SRC) | 300 × 250 | 4 ø 12 | HEB-100 | 3.30 m |
| P05 | HA (RC) | 300 × 250 | 2 ø 16 + 2 ø 20 | – | 3.30 m |
© 2019 by the authors. Licensee MDPI, Basel, Switzerland. This article is an open access article distributed under the terms and conditions of the Creative Commons Attribution (CC BY) license (http://creativecommons.org/licenses/by/4.0/).
Share and Cite
Montava, I.; Irles, R.; Segura, J.; Gadea, J.M.; Juliá, E. Numerical Simulation of Steel Reinforced Concrete (SRC) Joints. Metals 2019, 9, 131. https://doi.org/10.3390/met9020131
Montava I, Irles R, Segura J, Gadea JM, Juliá E. Numerical Simulation of Steel Reinforced Concrete (SRC) Joints. Metals. 2019; 9(2):131. https://doi.org/10.3390/met9020131
Chicago/Turabian StyleMontava, Isaac, Ramon Irles, Jorge Segura, Jose Maria Gadea, and Ernesto Juliá. 2019. "Numerical Simulation of Steel Reinforced Concrete (SRC) Joints" Metals 9, no. 2: 131. https://doi.org/10.3390/met9020131
APA StyleMontava, I., Irles, R., Segura, J., Gadea, J. M., & Juliá, E. (2019). Numerical Simulation of Steel Reinforced Concrete (SRC) Joints. Metals, 9(2), 131. https://doi.org/10.3390/met9020131